Article

Genome-Wide Association Study Unravels LRK1 as a Dark Respiration Regulator in Rice (Oryza sativa L.)

1
State Key Laboratory of Plant Molecular Genetics, CAS Center for Excellence in Molecular Plant Sciences, Shanghai 200032, China
2
Shanghai Center for Plant Stress Biology, Center for Excellence in Molecular Plant Sciences, Chinese Academy of Sciences, Shanghai 200032, China
3
State Key Laboratory of Hybrid Rice, Hunan Hybrid Rice Research Center, Changsha 410125, China
4
Laboratory of Photosynthesis and Environmental Biology, Shanghai Institute of Plant Physiology and Ecology, Chinese Academy of Sciences, Shanghai 200032, China
*
Author to whom correspondence should be addressed.
Int. J. Mol. Sci. 2020, 21(14), 4930; https://0-doi-org.brum.beds.ac.uk/10.3390/ijms21144930
Submission received: 16 June 2020 / Revised: 4 July 2020 / Accepted: 7 July 2020 / Published: 13 July 2020
(This article belongs to the Special Issue Plant Respiration)

Abstract

:
Respiration is a major plant physiological process that generates adenosine triphosphate (ATP) to support the various pathways involved in the plant growth and development. After decades of focused research on basic mechanisms of respiration, the processes and major proteins involved in respiration are well elucidated. However, much less is known about the natural variation of respiration. Here we conducted a survey on the natural variation of leaf dark respiration (Rd) in a global rice minicore diversity panel and applied a genome-wide association study (GWAS) in rice (Oryza sativa L.) to determine candidate loci associated with Rd. This rice minicore diversity panel consists of 206 accessions, which were grown under both growth room (GR) and field conditions. We found that Rd shows high single-nucleotide polymorphism (SNP) heritability under GR and it is significantly affected by genotype-environment interactions. Rd also exhibits strong positive correlation to the leaf thickness and chlorophyll content. GWAS results of Rd collected under GR and field show an overlapped genomic region in the chromosome 3 (Chr.3), which contains a lead SNP (3m29440628). There are 12 candidate genes within this region; among them, three genes show significantly higher expression levels in accessions with high Rd. Particularly, we observed that the LRK1 gene, annotated as leucine rich repeat receptor kinase, was up-regulated four times. We further found that a single significantly associated SNPs at the promoter region of LRK1, was strongly correlated with the mean annual temperature of the regions from where minicore accessions were collected. A rice lrk1 mutant shows only ~37% Rd of that of WT and retarded growth following exposure to 35 °C for 30 days, but only 24% reduction in growth was recorded under normal temperature (25 °C). This study demonstrates a substantial natural variation of Rd in rice and that the LRK1 gene can regulate leaf dark respiratory fluxes, especially under high temperature.

1. Introduction

Plant respiration (R) is a major element of the global ecosystem, which couples the production of energy to the release of CO2. At the ecosystem level, plant R contributes up to 65% in the total CO2 released into the atmosphere [1]. Globally, terrestrial plants R releases about 64 Gigatons of carbon per year (Gt C year−1) into the atmosphere [2,3,4]. This is a large flux, compared to the relatively small release of CO2 from the use of fossil fuels and cement production (~5.5 Gt year−1) and changing land use (about 1.6 Gt C year−1) [5]. Therefore, an increase in R in response to the climate warming may have a substantial impact on atmospheric CO2 concentration, and hence, the greenhouse effect.
Up to two thirds of daily photosynthetic carbon gain is released back into atmosphere by plant dark respiration (Rd) [6,7,8]. Light and temperature are two principal environmental factors that influence Rd. Under light, adenosine triphosphate (ATP) and reducing equivalents (NADPH) are generated in the chloroplast through photosynthesis, which are then used for carbon and nitrogen assimilation. The resulting products of these assimilatory reactions are transported to the cytosol where they are either exported to distant sinks or used to produce ATP and carbon skeletons through glycolysis, tricarboxylic acid (TCA) cycle and the coupled reactions of the electron transfer chain, oxidative phosphorylation [8]. By contrast, in the dark, respiration provides ATP and the metabolic intermediates necessary for growth, maintenance, transport and nutrient assimilation. The interactions among photosynthesis, respiration and photorespiration largely determine the plant physiological properties [9,10,11].
The changes in Rd under different light environments are partially attributed to the variation in the accumulated carbohydrate and alternative oxidative (AOX) [12]. For example, during daytime, carbohydrate accumulates in mature leaves, while during the nighttime, starch in chloroplasts and fructan in vacuoles break down. The produced sugars and sugar phosphates enter respiratory pathways in several forms, such as fructose-6-P during gluconeogenesis [13]. This process might lead to an enhanced respiration late during the night or early in the morning, which has been called ‘morning rise’ in mature rice leaf [14]. AOX is an enzyme involved in an alternative oxidative pathway, and represents one quinol-oxidizing enzyme in plant respiratory chain and appears to act as an energy overflow pathway when the carbohydrate levels are elevated at the beginning of a night [15,16].
Respiration is classified into growth or maintenance respiration to help differentiate the usage of respiratory-derived ATP for macromolecule biosynthesis in growing versus maintenance of house-keeping functions in full-grown tissues [17]. Generally, growth respiration is associated with growth processes such as the synthesis of new products during growth, nutrient uptake, nitrogen reduction and phloem loading, whereas maintenance respiration is coupled to protein and membrane turnover and maintaining the ions concentrations and gradients [18]. The fraction of daily fixed carbon that comes from respiration varies from 20 to 80% depends on the species, with around half of whole-plant respiration taking place in leaves using various methods through defining different respiratory components from growth, maintenance and ion uptake [16,19,20,21,22]. Thus far, there have been fewer studies on the variation in Rd within the same species and less knowledge and data availability on the genetic basis of the natural variation in Rd.
The genome-wide association study (GWAS) has recently emerged as a powerful tool to dissect (or decipher) the genetic basis for many important traits in crops [23,24,25]. This method employs a population of accessions representing a broad genetic variability. Notably, we used a minicore diversity rice panel derived from global 97 countries [11]. This panel has diverse evolutionary recombination events [26] and has a high-resolution single-nucleotide polymorphism (SNP) map [27]. Moreover, we used the gas exchange method to measure Rd [13]. In the current study, we conducted a systematic survey regarding the Rd in rice and further used GWAS to identify the potential genetic mechanisms controlling Rd. The aim of our investigation is to evaluate the genetic variability of Rd in rice, characterize the potential genetic loci controlling this variation in Rd and identify the possible candidate genes underlying this natural variation in Rd.

2. Results

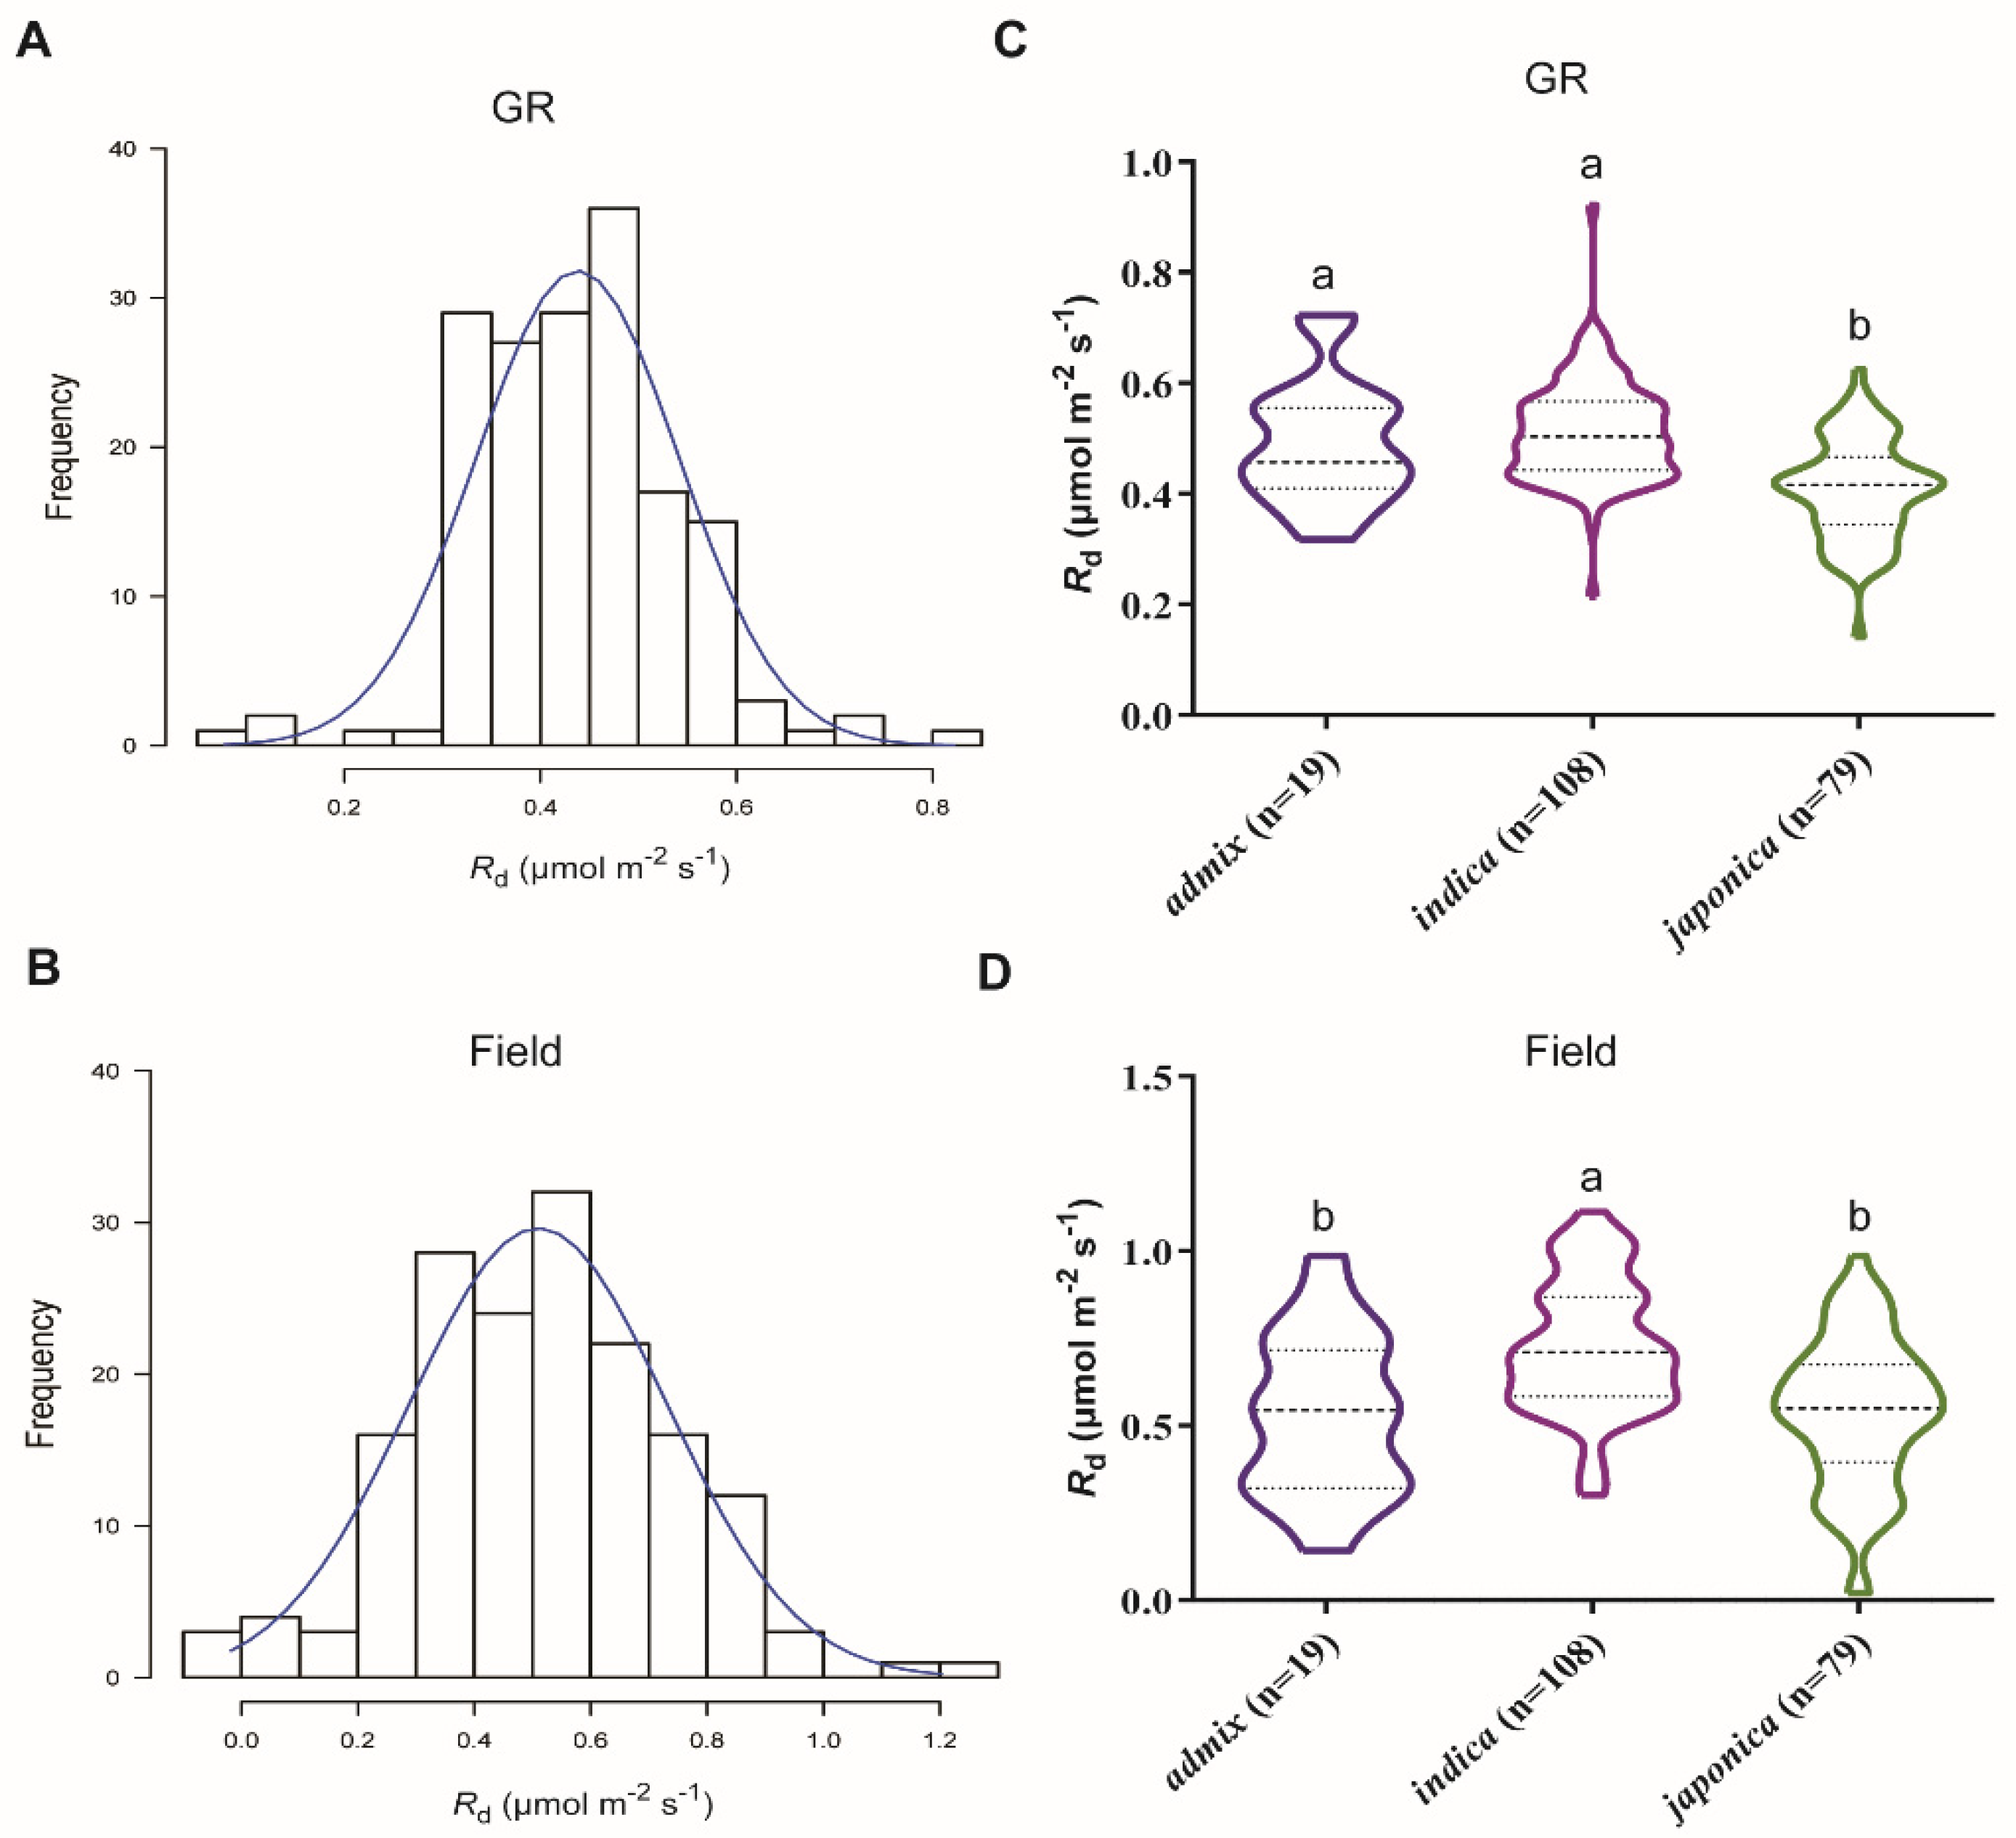
2.1. Genotypic Variation in Rd

We investigated the nighttime dark respiration (Rd), as well as other leaf physiological traits, including photosynthetic rates under either high (Ahigh) or low light (Alow), chlorophyll content (SPAD), and leaf thickness (Thickness) in 206 rice accessions of the minicore diversity panel under growth room (GR) and field conditions. Results revealed that a huge natural variation in Rd under both growth conditions and the variation in Rd follows a normal distribution (Shapiro-Wilk; P < 0.05). The values of Rd ranged between 0.1–0.9 and 0.08–1.3 μmol × m−2 × s−1 in GR and field, respectively (Figure 1A,B). The mean values of Rd across the rice minicore population were 0.46 and 0.58 μmol × m−2 × s−1 for GR and field, respectively (Table S2). A significantly high SNP heritability (h2SNP) for Rd in GR was observed (0.48), but not in the field, which was less than 0.001 (Table S2), implying that the presence of a strong genotype-environment interaction since the environment in the field is heterogeneous. The indica subpopulation including 108 accessions exhibited relatively higher Rd than the japonica subpopulation constituted with 79 accessions under both conditions, i.e., GR and field (Figure 1C,D).
We then compared the Pearson correlation coefficients (r) of Rd with Ahigh, Alow, SPAD, and thickness under both growth conditions. Our results show that, in GR, Rd was positively correlated with Ahigh, SPAD and leaf thickness (P < 0.05), but was negatively correlated with Alow, while in the field condition, Rd has no correlation with Ahigh, Alow, and SPAD, except the leaf thickness (Table S3). The r values between Rd with these four traits under GR ranged between 0.15–0.23. A strong positive correlation was observed between Rd recorded in GR and Rd in field (Table S3). Rd variance was significantly affected by either genotype or environmental factor or genotype-environment interactions (P < 0.001) (Table S4).
To uncover the effects of natural habitats on Rd, we compared the correlation between Rd and the geoclimate information of the region from where each accession was collected. Our obtained results show that Rd for both growth conditions (GR and field) was positively correlated with the annual solar irradiance parameters such as total PAR, diffuse PAR, and direct PAR, annual temperature regimes including minimal and mean temperatures, and annually minimal local dew point (Table S5).

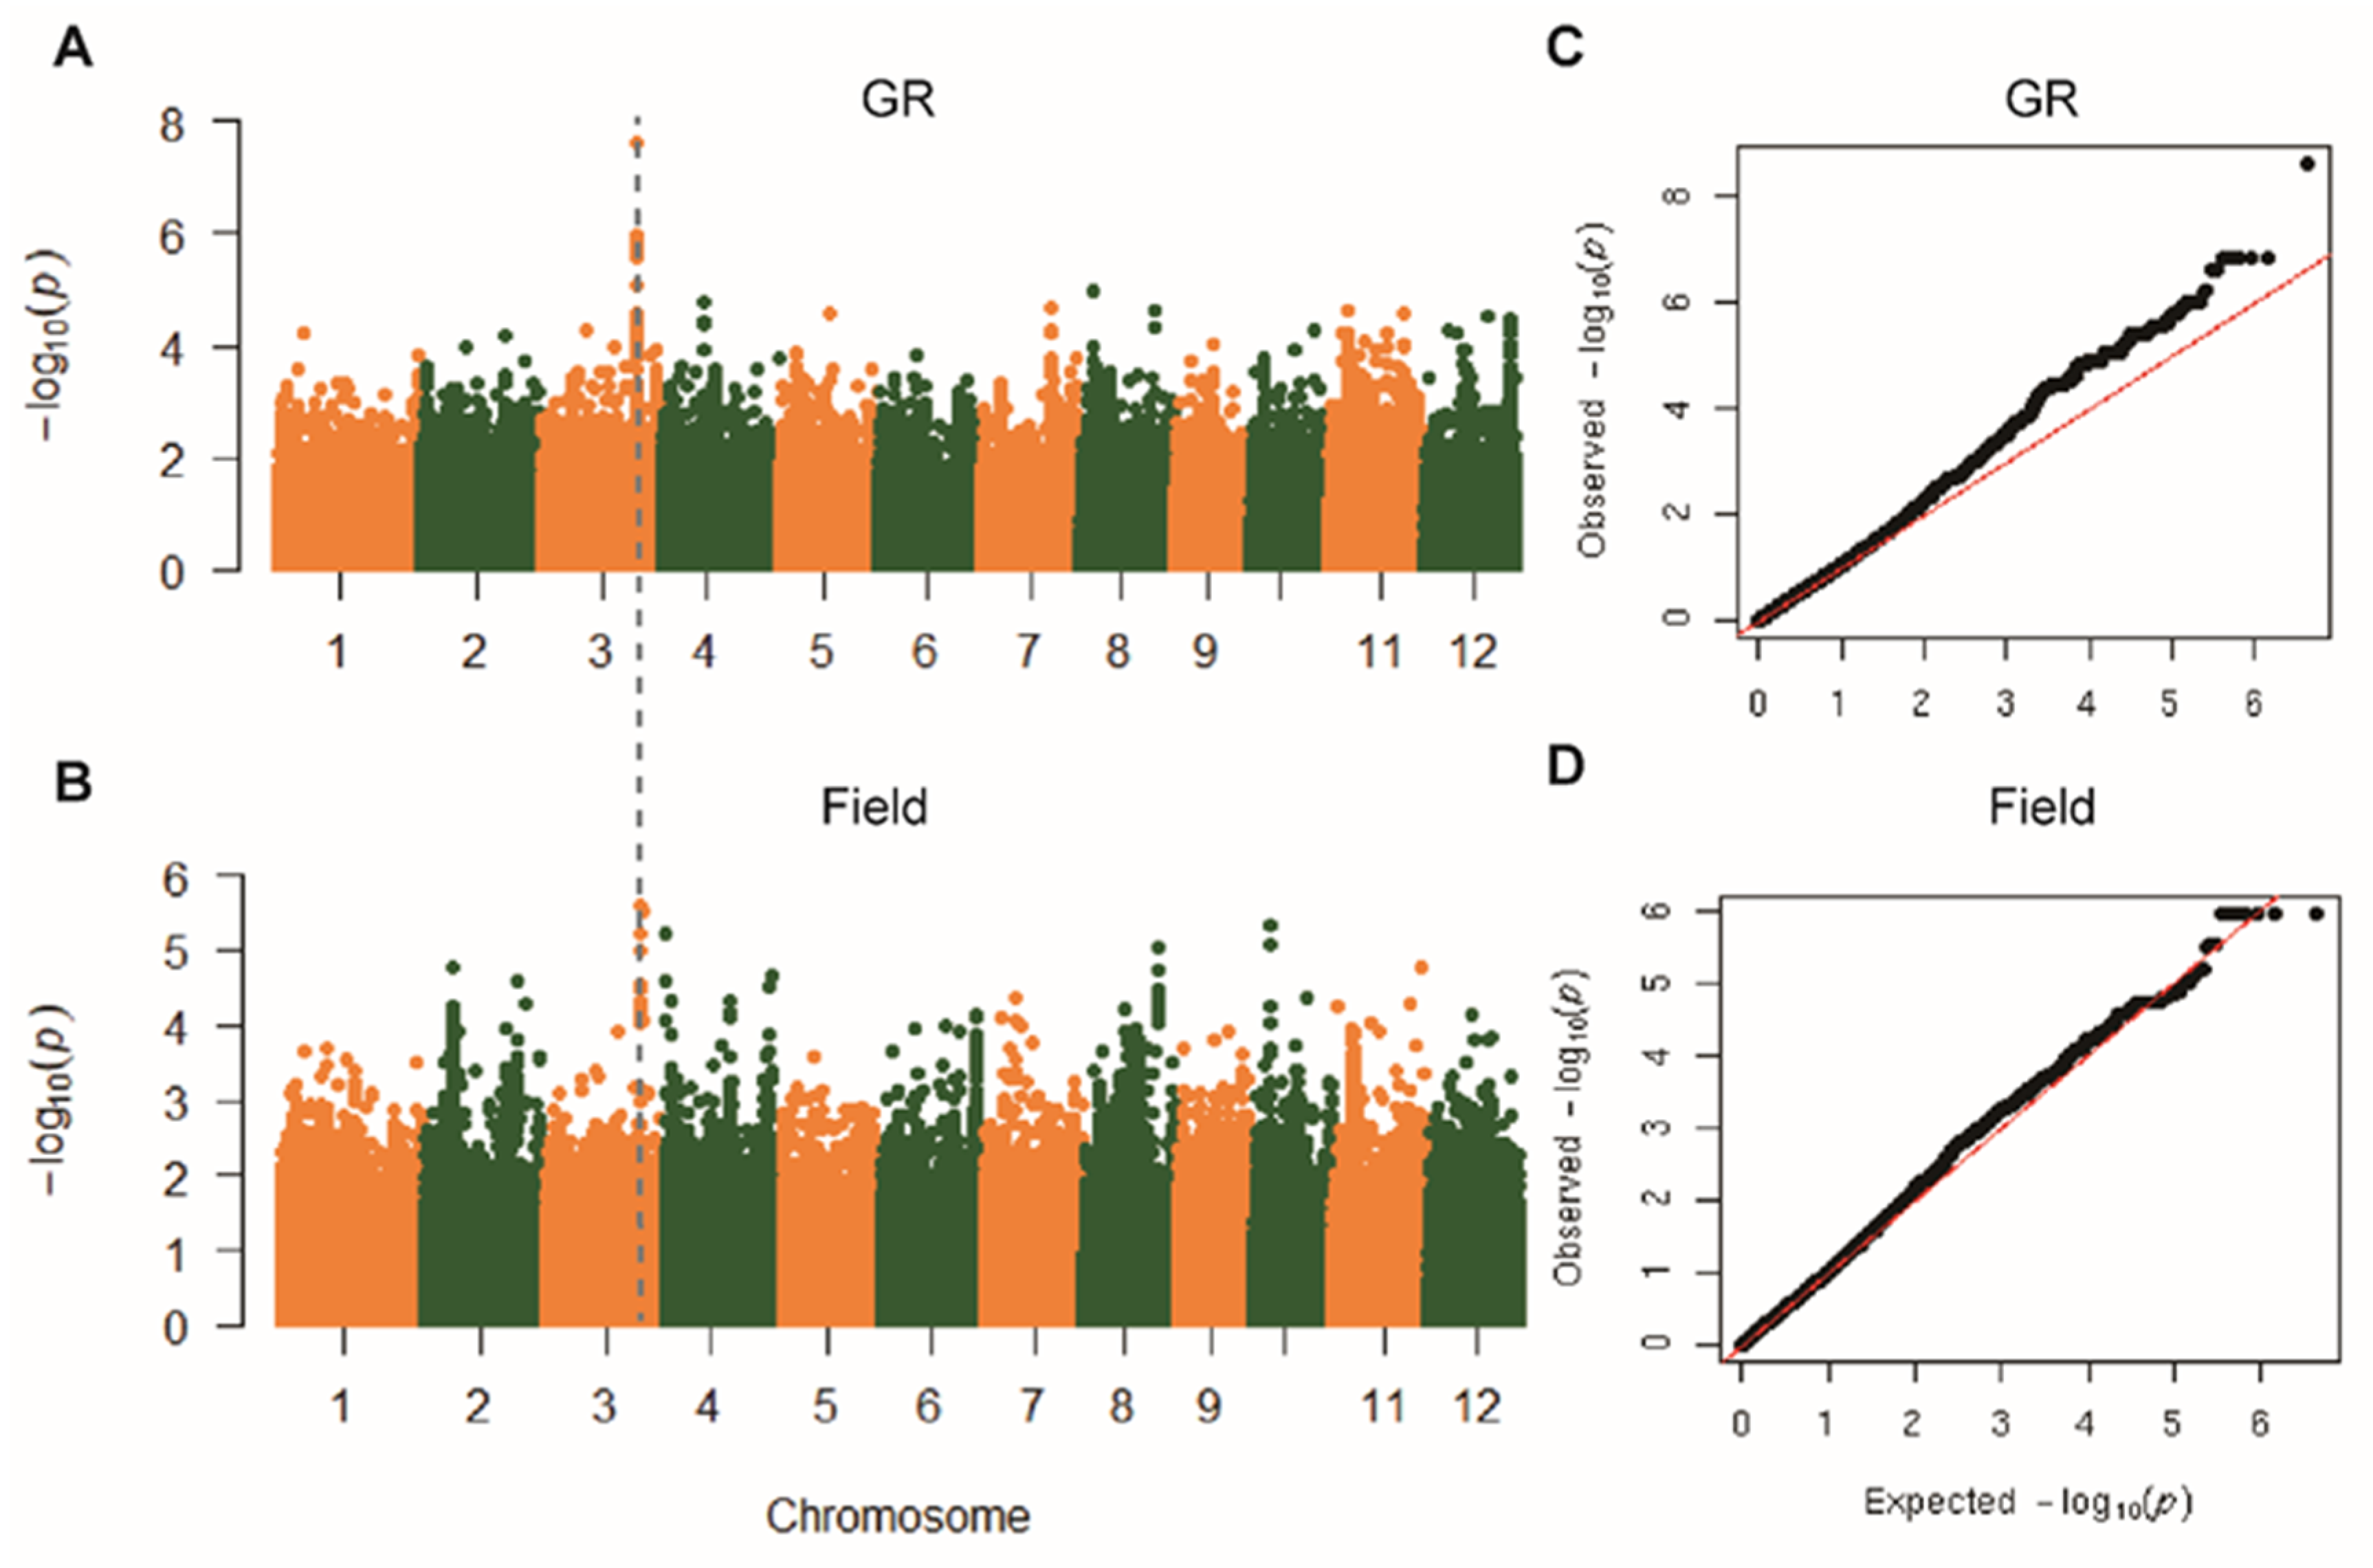
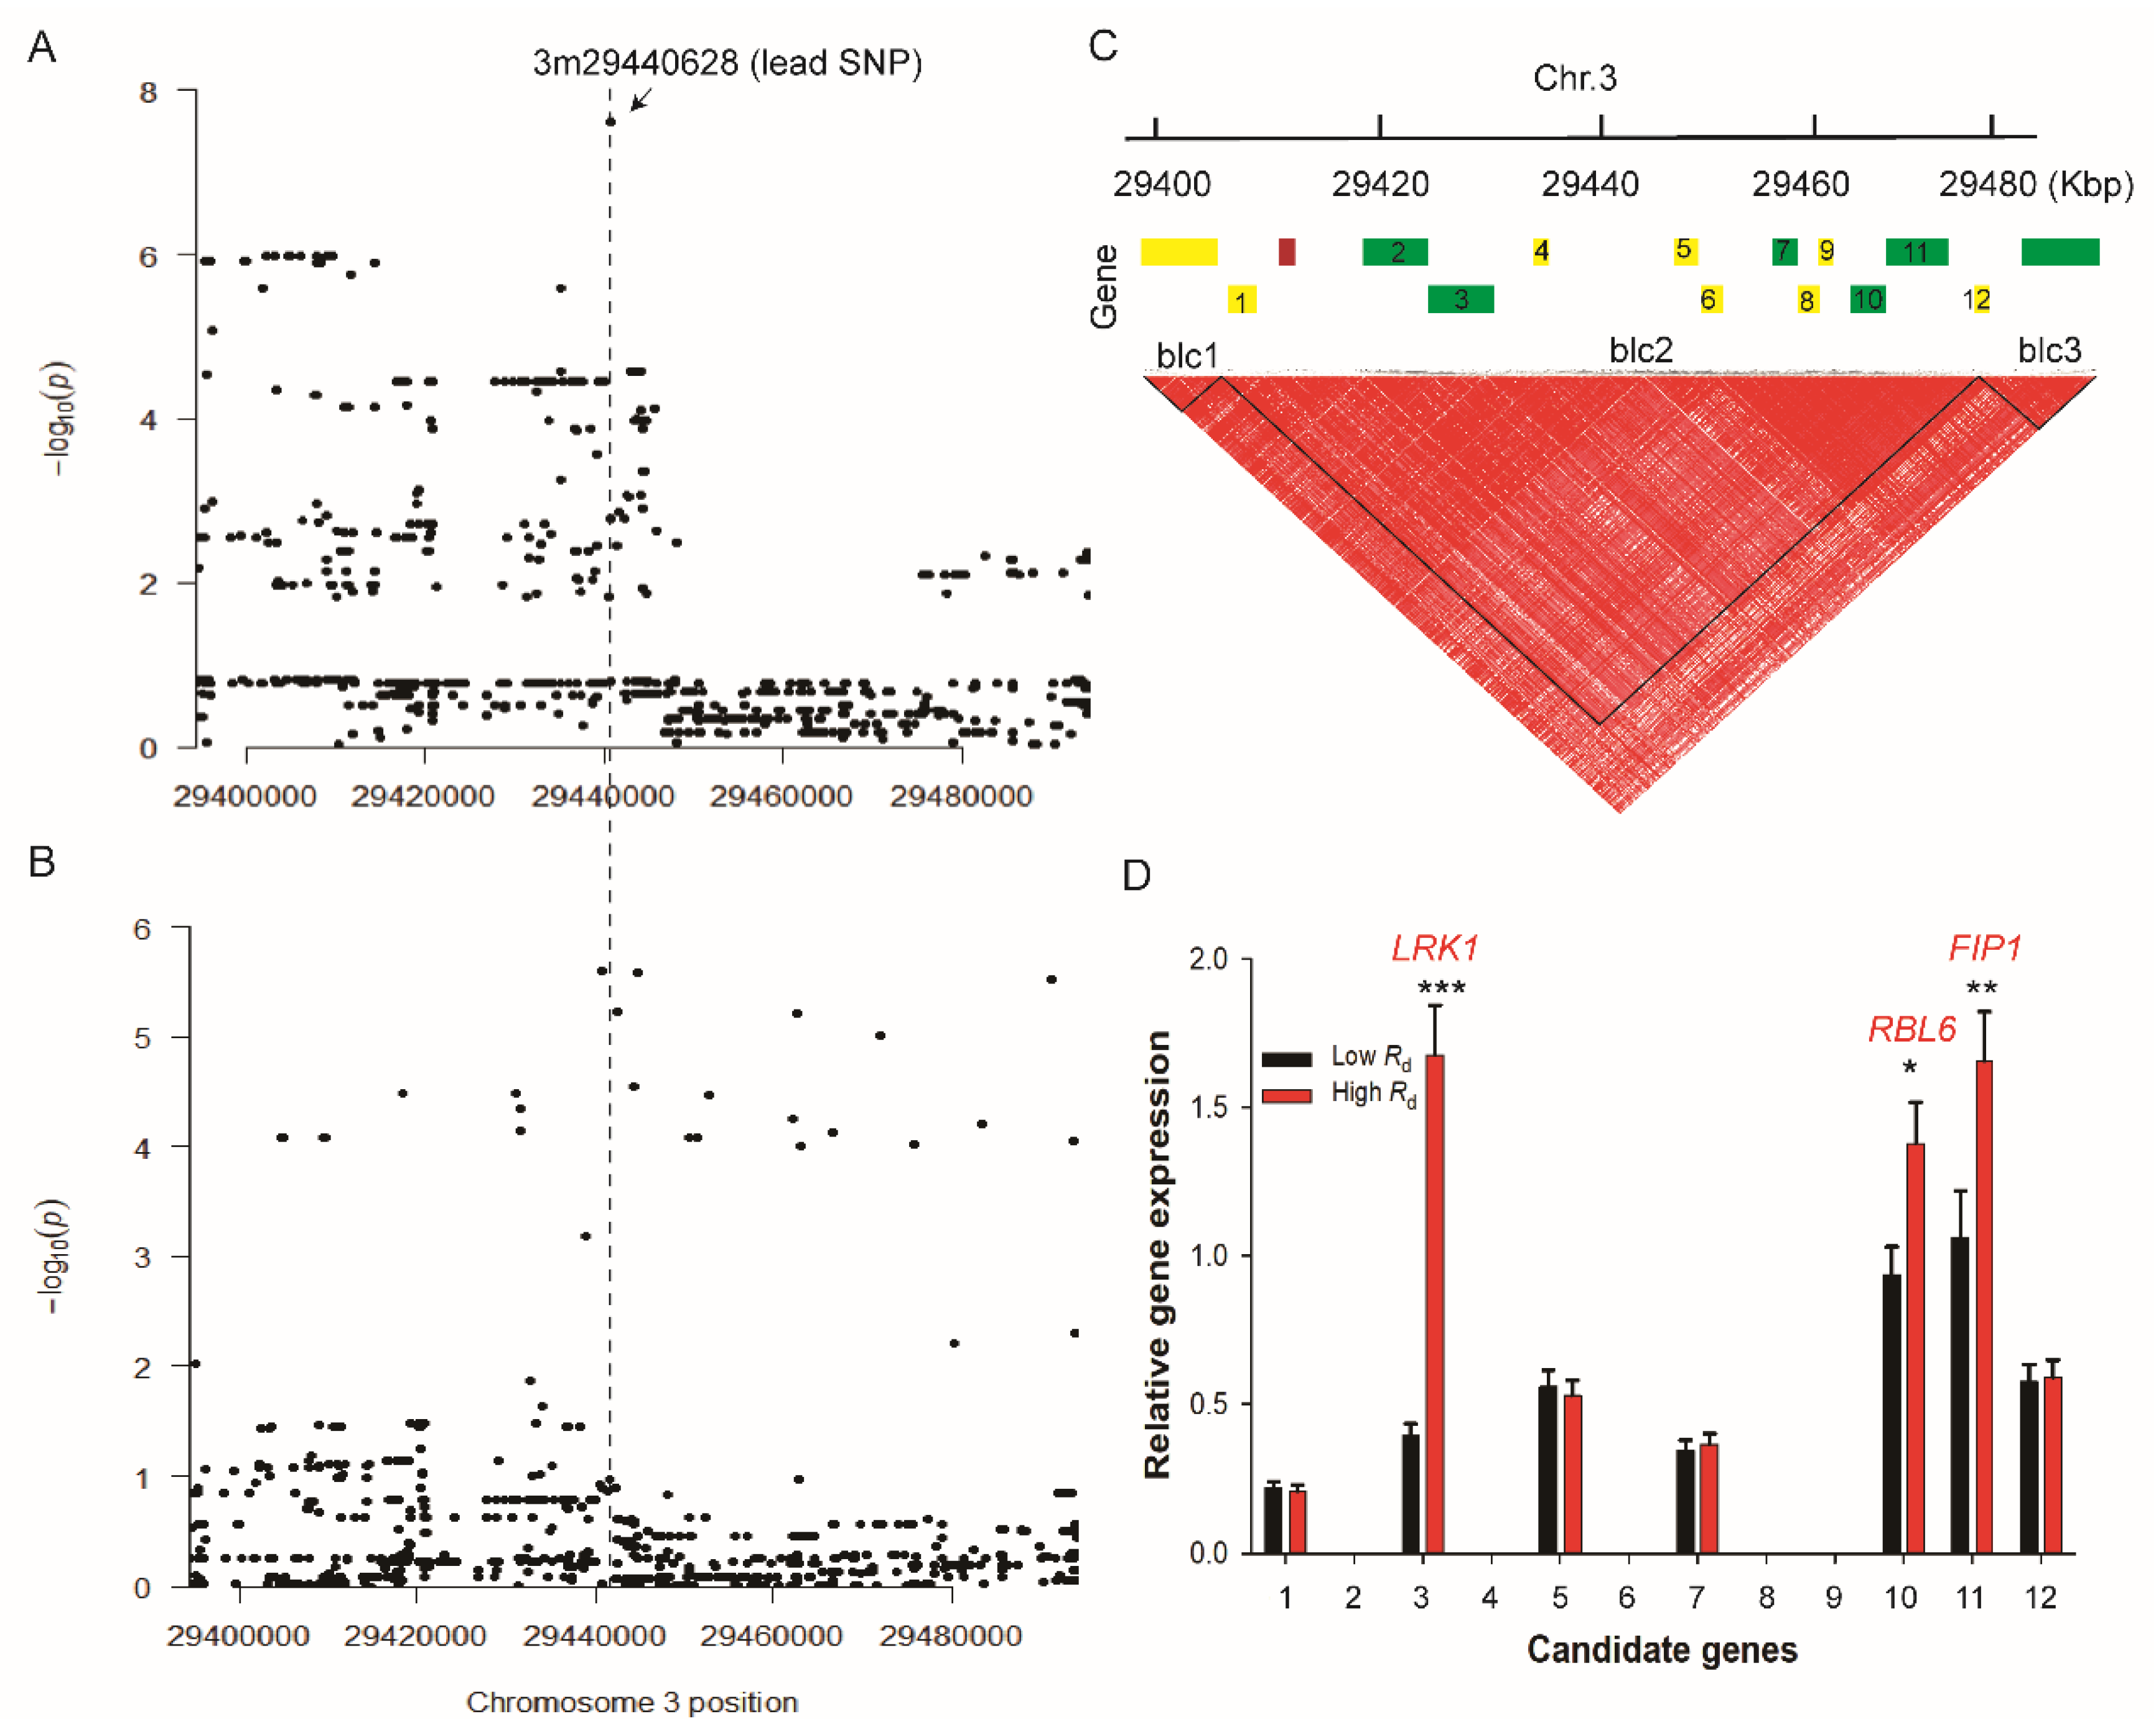
2.2. Genome-Wide Association Study on Rd

A genome-wide association study (GWAS) was then performed to identify loci underlying the genetic regulation of Rd. We applied an MLM method, which takes into account the population structure and therefore minimizes false positives rates compared to a general linear model, GLM [28]. A threshold of −log10 P > 6.0 was determined by 200 times permutations to detect a significant association [27]. There are 24 and 10 significantly associated SNPs for Rd collected from GR and field, respectively. These SNPs were termed as sigSNP (Table S6). We found that an overlapped genomic region on Chr. 3 for the identified sigSNPs from GWAS based on data from GR and field conditions (Figure 2A,B). The quantile–quantile (QQ) plots shows the upward deviation from the linear line occurred at around −log10P = 8 and −log10P = 6 in GR and field, respectively (Figure 2C,D). The lead SNP identified based on data from GR is 3m29440628 with a P-value of 2.46 e−8 (Table S6). In addition, we characterized some other sigSNPs specific for the field condition, including 4m151738, 10m5015229, 10m5015591, and 8m22334703 (Table S6). The ~100 kb genomic region surrounding the lead SNP was used to screen candidate genes following [23]. The overlapped genomic region identified based on Rd analysis between GR and field was shown in Figure 3A,B to compare the promising identified genes associated with Rd measured under both growth conditions. Within this region, there are 16 genes were selected according to the Michigan State University (MSU) Rice Genome Annotation Project Database (http://rice.plantbiology.msu.edu) (Table S7). Based on the haplotype analysis, we found that 12 candidate genes are in the same LD block based on D′ values, with lead SNP (Figure 3C; Table S8).
To further examine the expression patterns of these candidate genes, we compared the differential expression levels at night (11:30 pm) in 12 accessions with contrasting Rd values (highest and lowest). We used six accessions with high Rd and six others (accessions) with low Rd from the minicore population (Table S9). Consistently, we found that the three genes showed significantly higher expressions in the six accessions with high Rd (Figure 3D, Table S9). Notably, the gene expression level of LRK1 (Os03g51440) was up-regulated four-fold in these high Rd accessions (Figure 3D, Table S9). The remaining two genes are RBL6 (Os03g51510) and FIP1 (Os03g51520), with a moderate increase in their expression levels by about 0.6-fold (Figure 3D). In addition, we also identified some other genes associated with the specific sigSNPs for the field condition on chromosomes 4, 10, and 8 (Table S10). Some of these genes are annotated to be involved in photophosphorylation process, including PRC1 (Os08g35420) and CytoP450 genes (Os08g35510) or in carbon metabolic pathway, such as STPF1 (Os08g35440), SDMT (Os10g09360), PGM1 (Os04g01230), and SERP (Os04g01240), although all of these genes had lower sigSNPs peaks (Table S10).

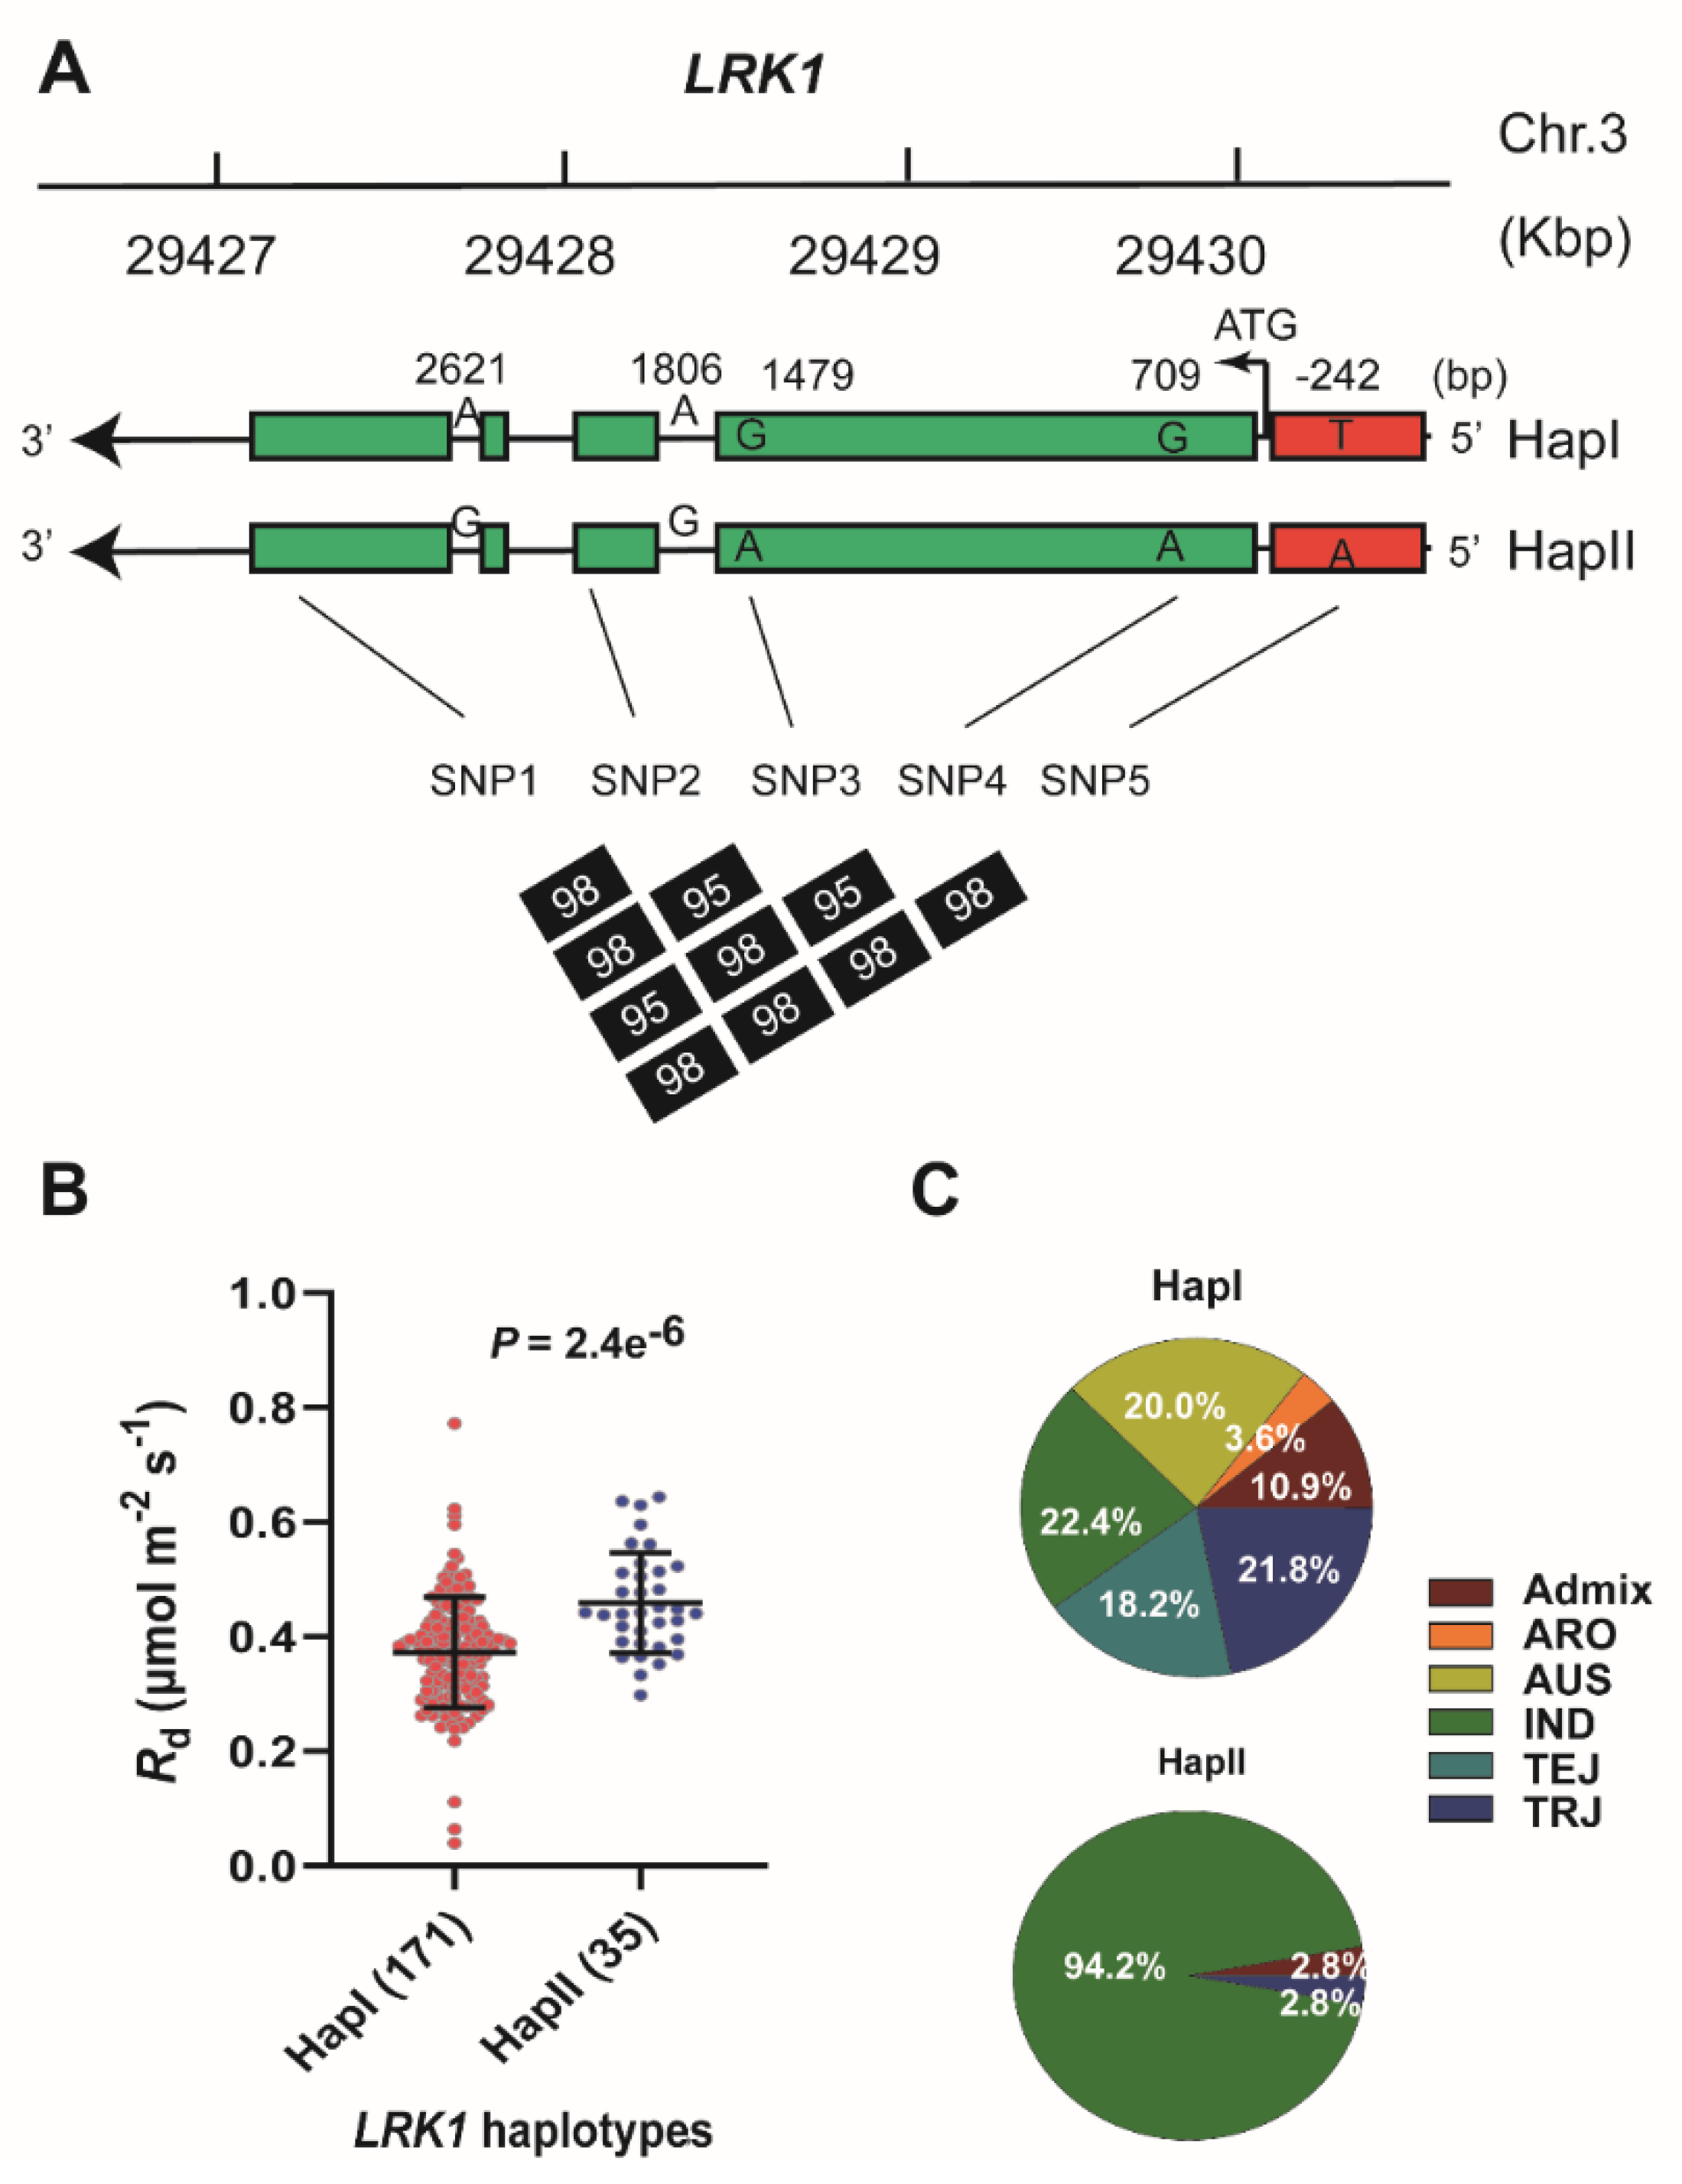
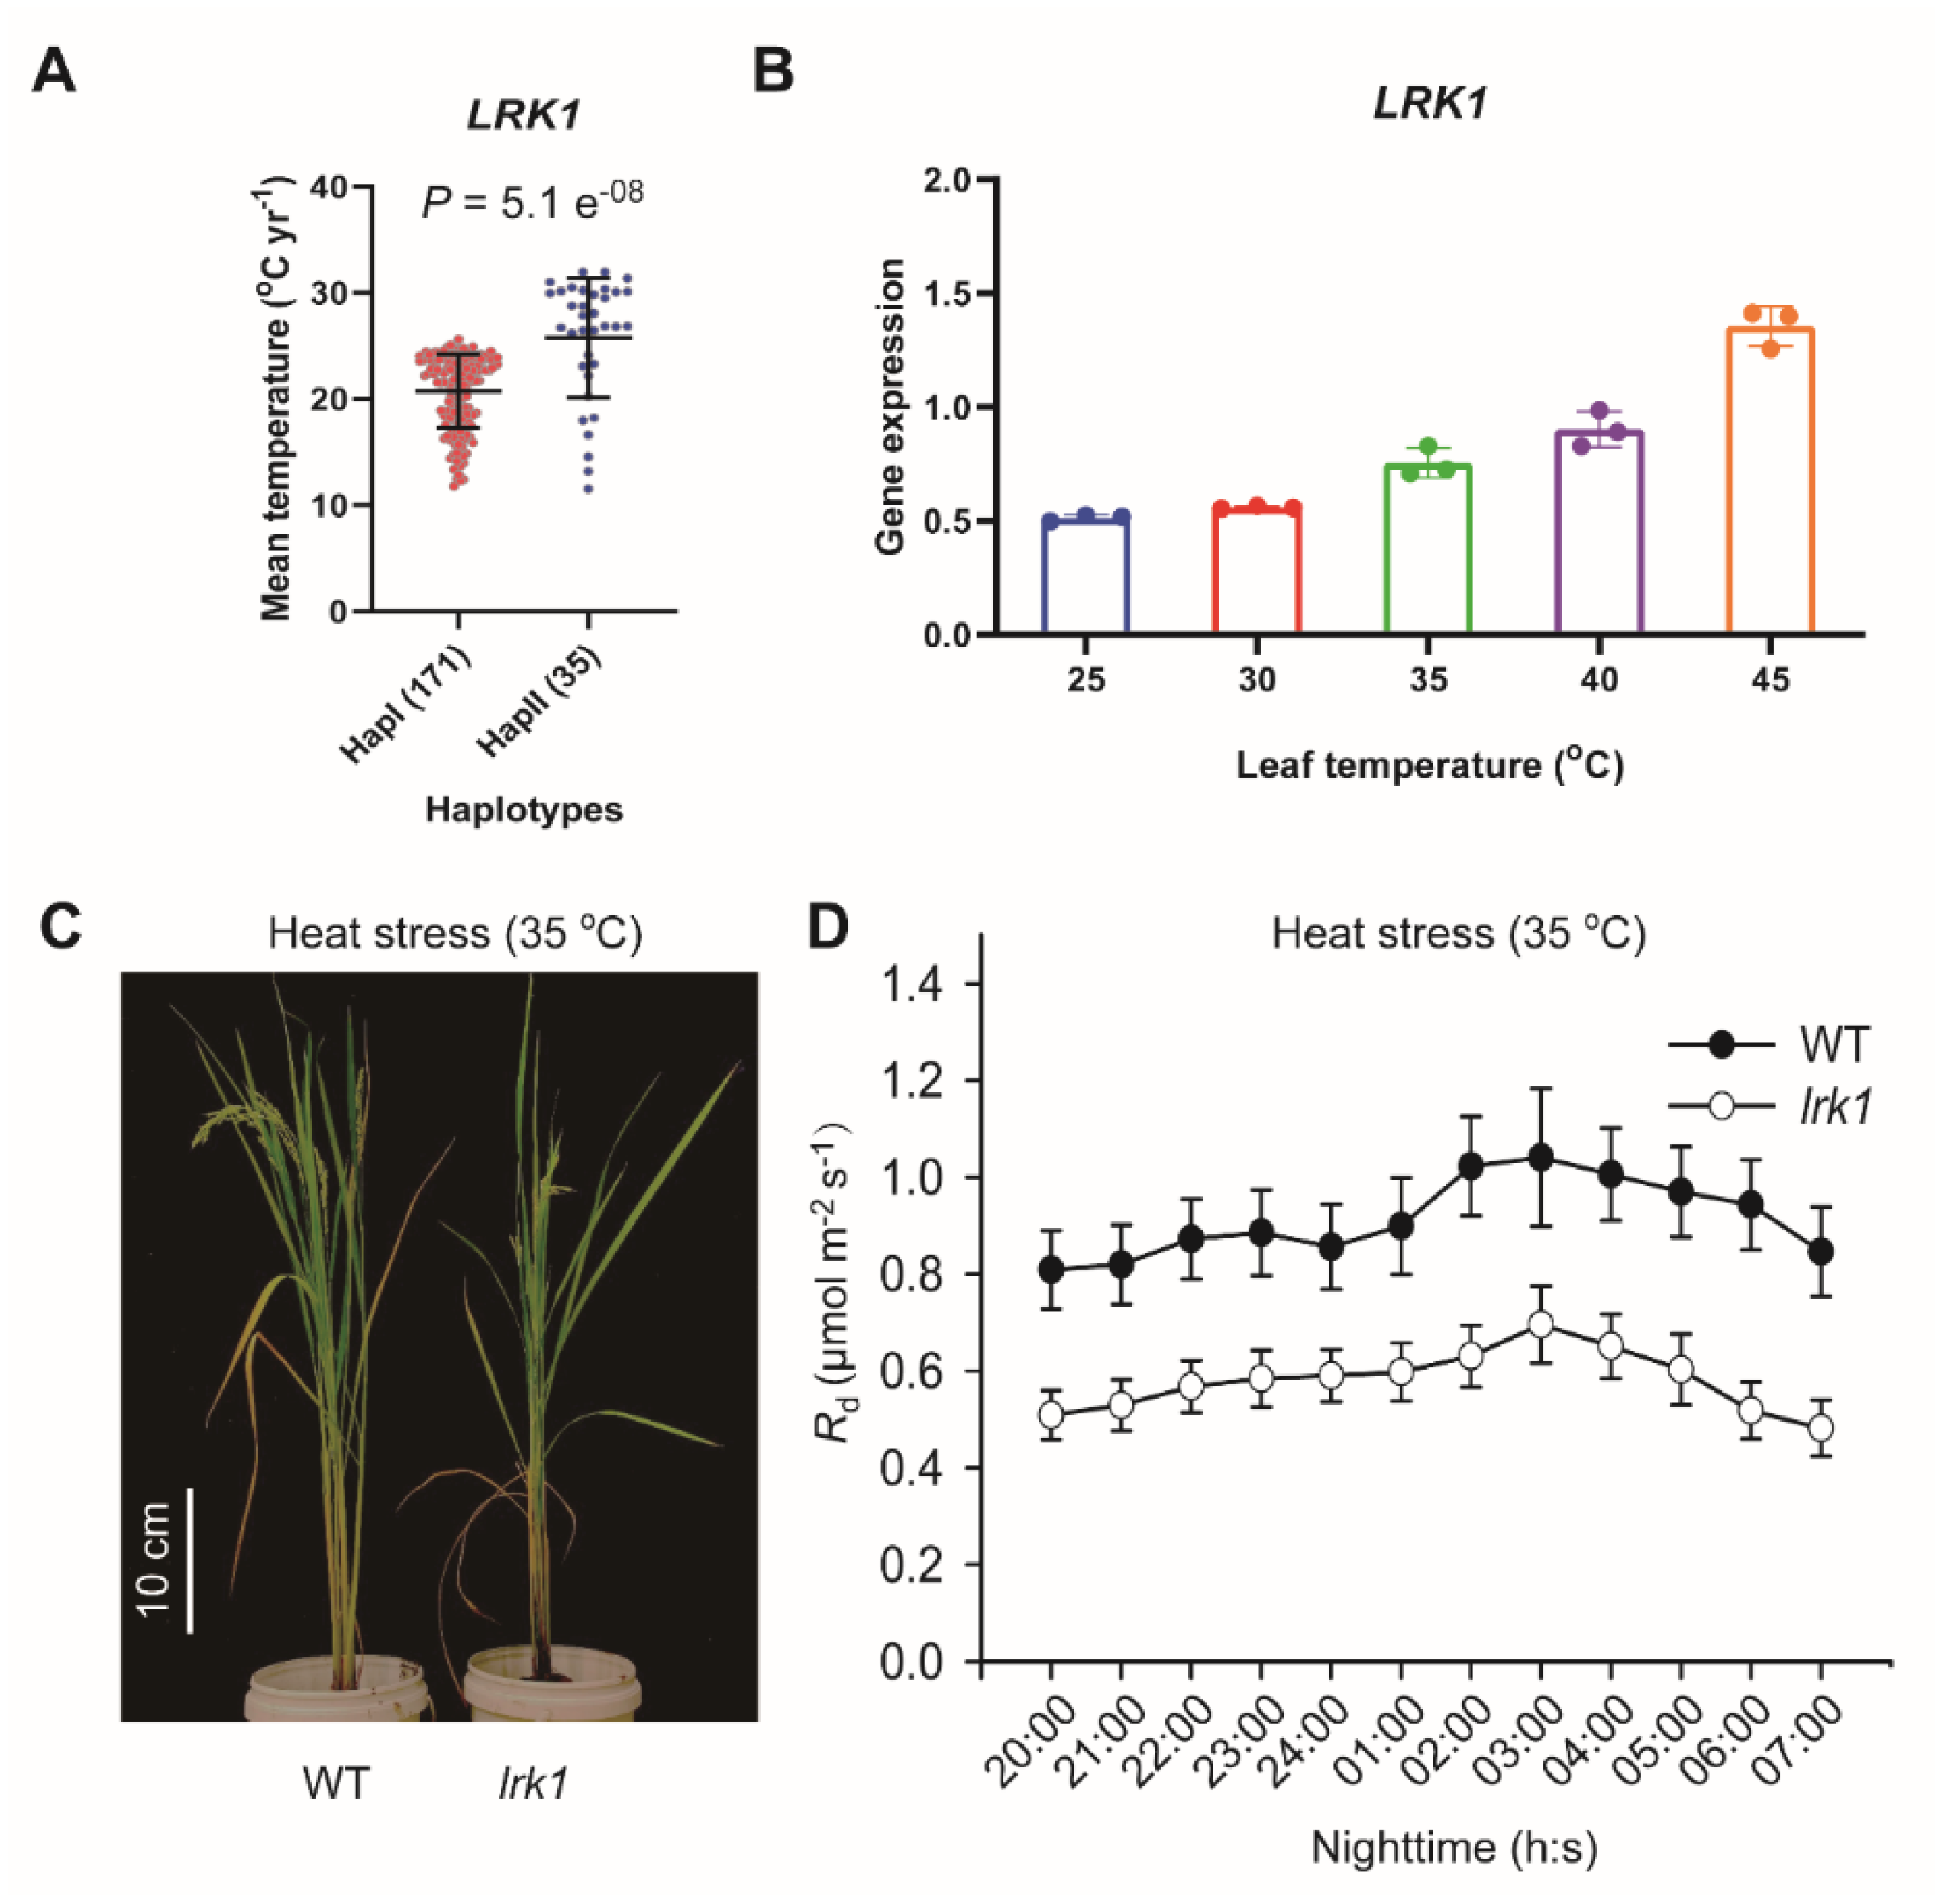
2.3. Haplotype Analysis of Candidate Genes Underlying Rd

We then focused on the lead SNP, because it shows the highest statistical significance level (Table S6). The functional allelic variance within the same LD block surrounding the lead SNP was further analyzed for three candidate genes including LRK1, RBL6, and FIP1 through haplotype analysis. Our results show that there are two haplotypes in LRK1 gene containing five SNPs with a P value above the genome-wide suggestive threshold (−log10P = 5) as previously proposed by [29], including the SNP located at promoter region (−242 bp from the ATP start codon). The suggestive threshold was used to determine the association at lower levels to identify the LRK1 haplotype variation. Haplotype I (HapI) and haplotype II (HapII) consist of major alleles “TGGAA” and minor alleles “AAAGG,” respectively (Figure 4A). Furthermore, we found that the D′ values between these SNPs across the minicore diversity panels ranged from 95 to 98%, suggesting that these SNPs are likely inherited together (Figure 4A) with a high degree of relatedness. There are 171 accessions in HapI, while HapII contains fewer numbers of accessions (merely 35 accessions). Significantly higher Rd values were observed for HapII accessions if compared to those of HapI ones (Figure 4B). Notably, most the accessions randomly selected, with extremely high Rd values and high LRK1 gene expression levels, are identified to belong to HapII (Table S9). In addition, HapI contains all subpopulations with different proportions (ranged from 3.6% to 22.4%) as depicted in Table S9. Interestingly, most accessions of HapII belong to indica, accounting for 94% (35 accessions of HapII).
Since the expression levels of FIP1 and RBC6 were also significantly altered between the two groups with contrasting Rd (as mentioned above), we further analyzed the allelic diversity at the promoter region of the two genes. Two SNPs were identified above the suggestive threshold located at 976 and 719 bp from the ATG start codon of FIP1, and one additional SNP above the suggestive threshold located at the third exon (Figure S2A). These SNPs were classified into three haplotypes and exhibited strong correlation with D′ values ranging from 94 to 99%. The HapII contains 150 accessions, which represents three and 13 times more than the number of those of HapI and HapIII, respectively (Figure S2B). Furthermore, the mean Rd value of HapIII accessions is 10% and 40% higher than that of HapI and HapII accessions, respectively (Figure S2B). Similar to HapII in the LRK1 gene, we found that most accessions belong to indica subpopulation (Figure S2C). For the RBC6 gene, we found two SNPs located at 608 and 230 bp from the start codon, and one SNP above the suggestive threshold located at the intron (Figure S3A). Relatively higher Rd values for HapI group containing 95 accessions were observed than that for HapII group with 111 accessions (Figure S3B). These accessions belong to different subpopulations encompassed in the minicore diversity panel with various proportions relative to the total accession numbers for either HapI or HapII (Figure S3C).

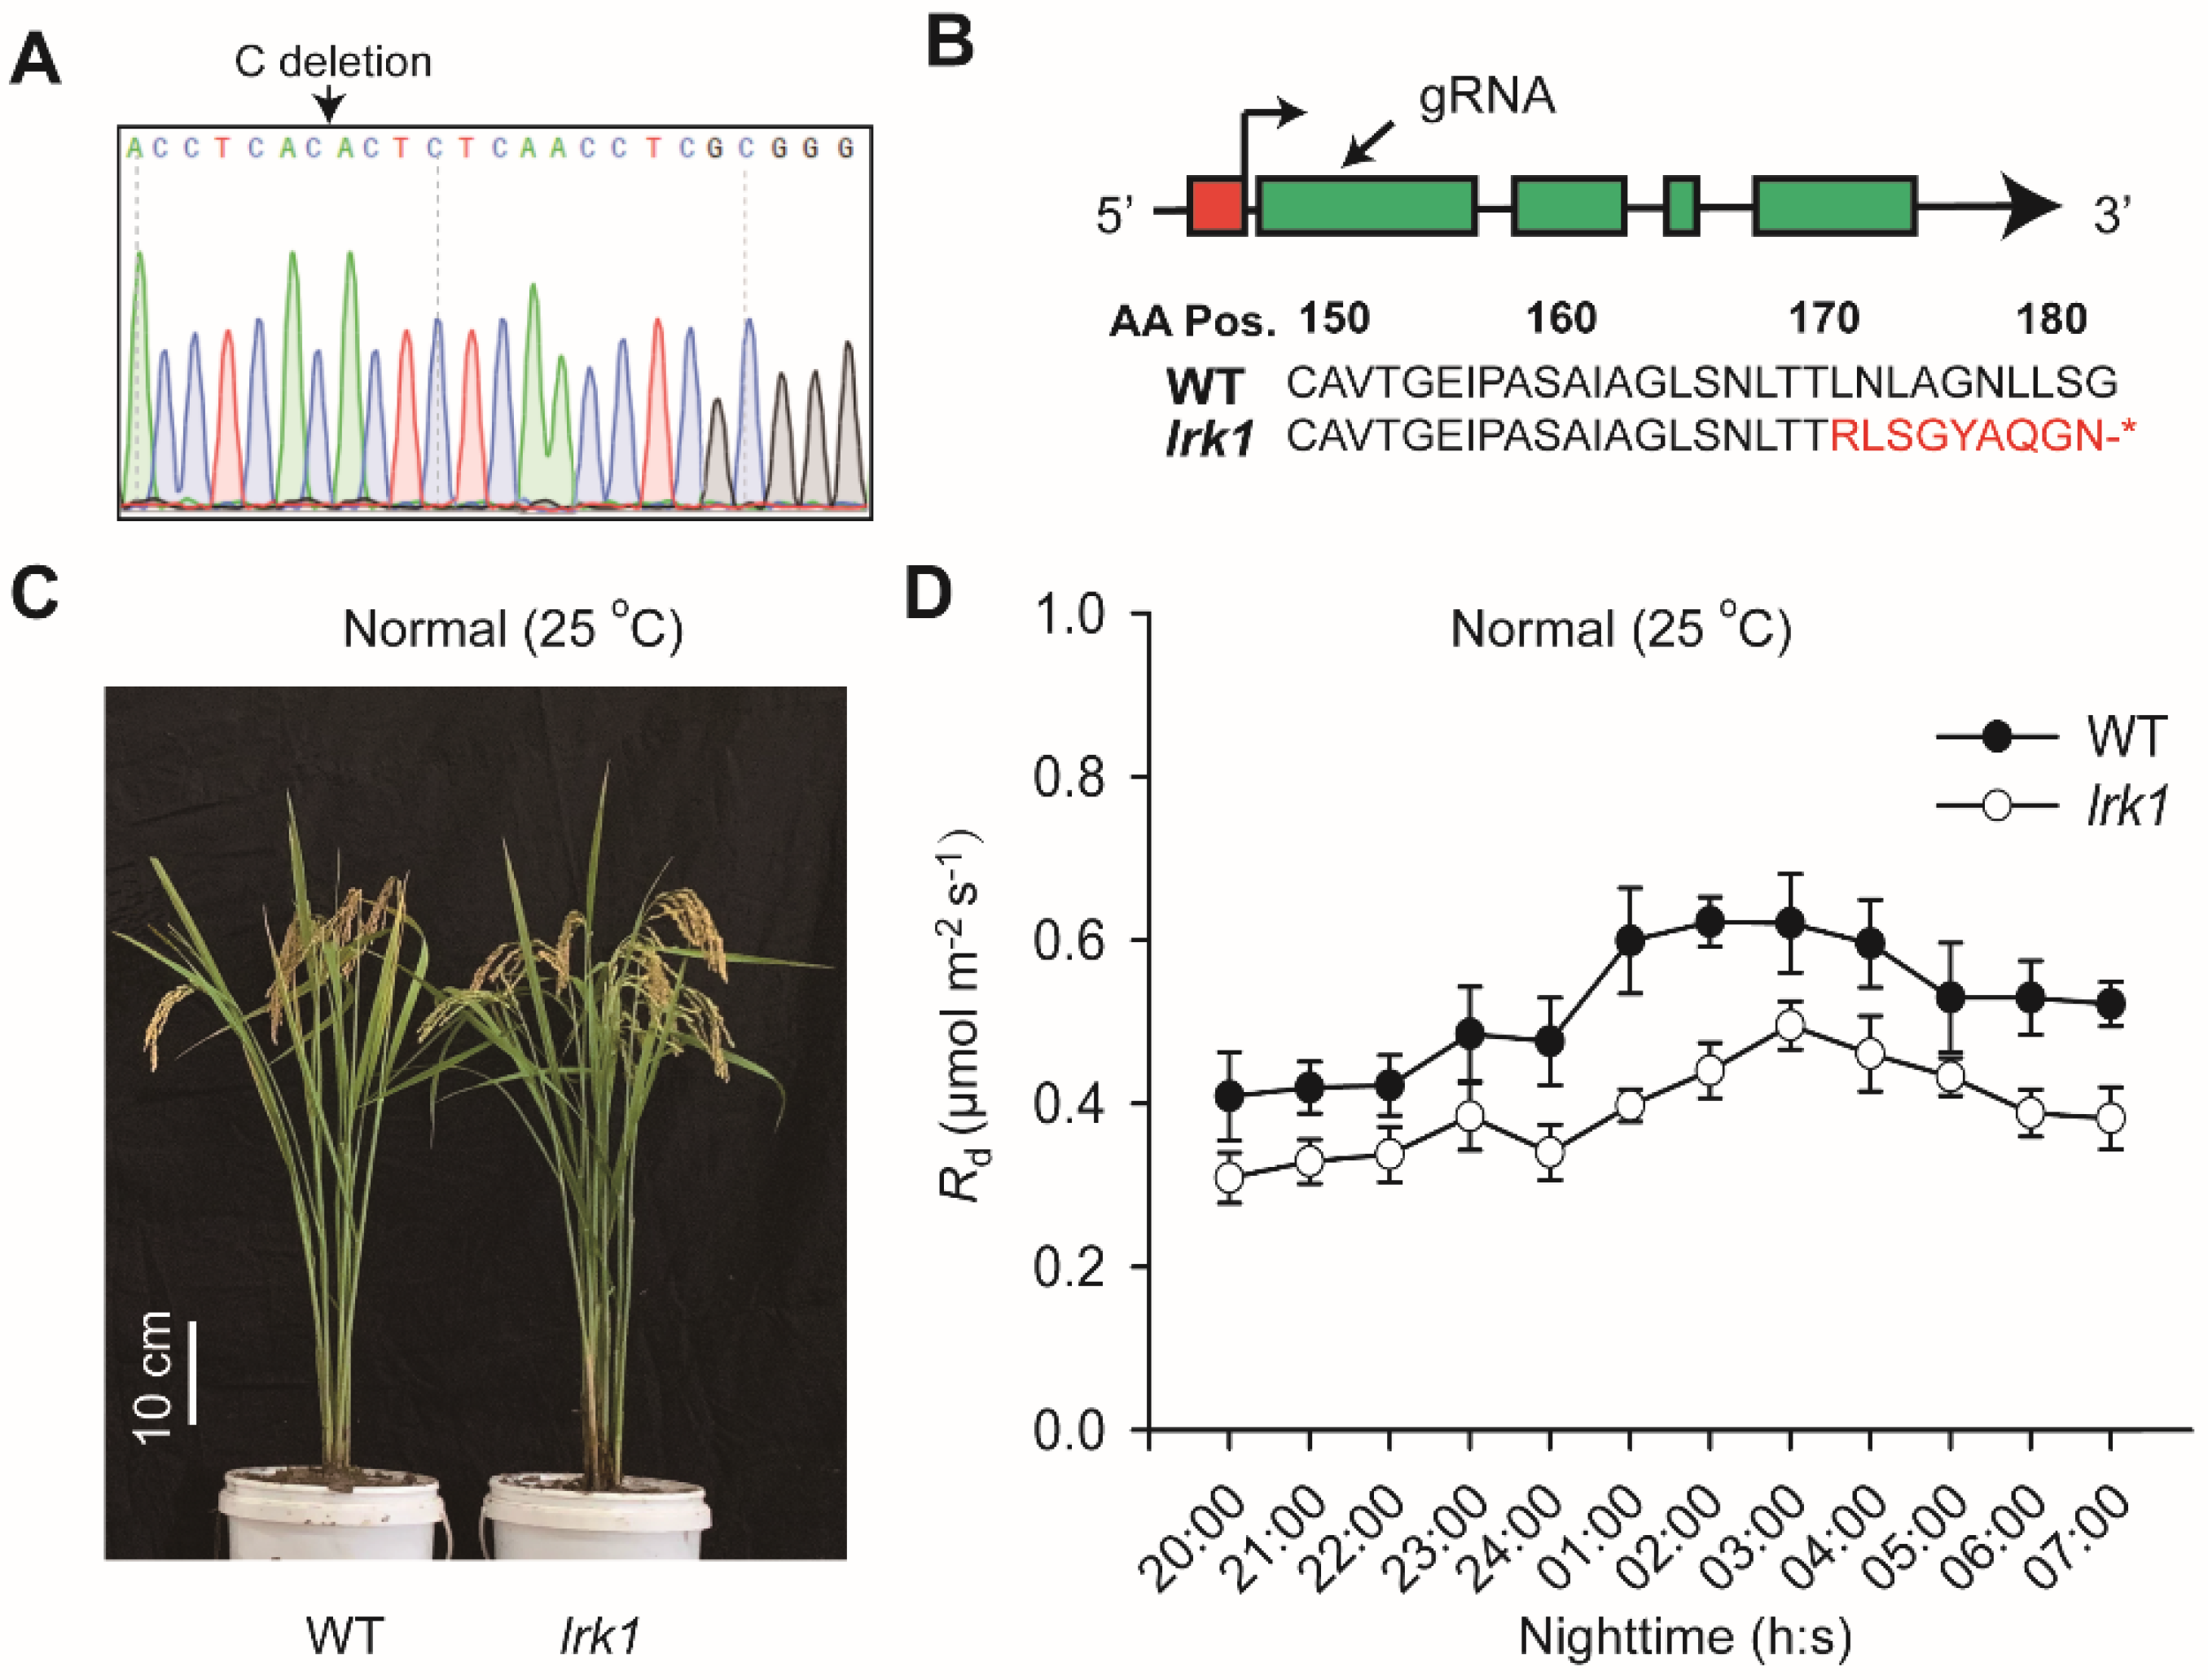
2.4. Biological Function of LRK1 Gene

In the present report, we mainly focused on understanding the biological function of the LRK1 gene because it shows the largest differential expression levels between the two contrasting Rd groups. Notably, there might be multiple genes controlling one complex trait. Therefore, FIP1 and RBC6 might also be potential candidate genes influencing Rd, though their effect was smaller than LRK1. The two genes can be interesting genes to follow up later. The LRK1 gene, annotated as a leucine rich repeat receptor kinase, belongs to leucine-rich repeat LRKs (LRR-RLKs) gene family based on UniProt database (www.uniprot.org). We found an orthologue gene in Arabidopsis (AT2G16250) in the same branch according to the phylogenetic tree analysis (Figure S4). We also identified some orthologues of LRK1 for other well-known model plants including Triticum aestivum, Nicotiana tabacum, Sorghum bicolor, and Zea mays, as well as in some diploid C4 grasses such as Sataria italica and Sataria viridis. This corroborates the importance of LRK1 biological function in Viridiplantae species and its (LRK1) evolutionarily conserved aspect. However, the biological function of this gene in different species was not yet well understood.
Based on GWAS, we demonstrated that the expression of LRK1 gene is strongly associated with Rd (Figure 3D). We then analyzed the expression pattern of LRK1 gene under different light and found that the LRK1 gene was highly expressed during the nighttime (20:00~07:00), but depressed under daytime especially at noon (12:00) for GR grown WT plants (Figure S5A). Consistently, the expression level of this gene is stimulated gradually after switching to dark from a high light condition (Figure S5B). These findings suggest that LRK1 gene acts like positive regulator underlying the Rd. Therefore, we used a homozygous rice mutant of this gene edited by CRISPR-CAS9, designated as lrk1, against ZH11, a common japonica rice cultivar (WT), to analyze the changes in Rd (Figure 5A). This line has a single “C” allele deletion at 508th nucleotide of LRK1, leading to an early stop codon at 180th amino acid (Figure 5B). The mRNA expression between WT and lrk1 was further confirmed by qPCR, suggesting absence of gene expression in lrk1 (Figure S6). In the same trend, no phenotypic difference was observed regarding the growth performance of WT and lrk1 grown in GR under light intensity of ~ 500 μmol × m−2 × s−1 and 25 °C air temperature (Figure 5C) as well as concerning Ahigh and Alow (Figure S7A,B), although Rd was 24% reduced in lrk1 mutant relative to WT during nighttime (Figure 5D).
We then compared the geoclimate parameters of the natural habitat with the haplotypes of LRK1. In this context, the accessions of HapI show significantly higher values of the mean annual temperature of the regions where accessions were collected than those (mean values) for accessions of HapII (Figure 6A). Our results of the qPCR analysis on 12 rice accessions prove that the accessions with HapII showed high expression levels of LRK1 (Table S9). We further recorded a gradual increase in the expression level of LRK1 following an increase in the temperature from 25 °C to 45 °C (Figure 6B), and each temperature treatment was maintained for 30 min.
Ultimately, we applied a long-term (30 days) heat treatment (plus 10 °C relative to normal temperature 25 °C) for both lrk1 and WT and found that lrk1 showed retarded growth compared to WT (Figure 6D), which could be potentially related to the dramatic decline in the Rd in lrk1 mutant by around 37% if compared to WT (Figure 6D). However, we did not find any substantial change in either Ahigh or Alow between WT and lrk1 grown under heat stress condition (Figure S7C,D). The Q10, defined as the ratio of Rd under 35 °C by that under 25 °C [30], of leaf Rd was dramatically reduced in the lrk1 mutant compared to WT exposed to heat stress treatment (Figure S8). Our results show also that plant height, tiller number and grain yield per plant were considerably decreased by at least 20% in lrk1 compared to WT exposed to the same temperature treatment (35 °C), while there was no difference between WT and lrk1 under normal temperature, 25 °C (Table S11).

3. Discussion

The respiratory reactions in metabolic process include glycolysis, the oxidative pentose phosphate pathway, the citric acid cycle, the mitochondrial electron transport chain (mETC), ATP synthase, and several other surrounding reactions [22,31]. The respiration rates can be influenced by genetic, environmental, and/or developmental factors [31,32,33]. However, thus far, the natural variation of respiration and the potential genetic mechanisms underlying and/or controlling this variation is largely unknown. In this report, we studied the leaf respiration rates at night (Rd). Specifically, we used GWAS to identify the functional genes that could be responsible for the variation in Rd, and we found that the variation in the LRK1 gene, a leucine repeat domain receptor kinase, was strongly associated with Rd in a rice minicore population.
The fraction of daily fixed carbon especially in Rd is considerably important (varying from 20 to 80%, depending on the species), given that half of whole-plant respiration takes place in leaves [20]. Thus, the natural variation in Rd is not only important for plant productivity, but also for the global carbon cycle. We observed an approximate 10-fold change (maximum/minimum) in Rd between maximum and minimum values in this rice minicore population (Table S2), suggesting a large natural variation of Rd in the rice population. Considering that the respiration is a major factor controlling plant light use efficiency [34], the identification of genetic factors monitoring the respiration rates might be useful in the future crop breeding and improvements.
To identify the genetic factors underlying the respiratory flux, we proceeded to the IRGA-gas exchange measurements, which has been proved to be the suitable technical tool to perform a rapid screening of Rd in a large genetic population [35]. Here, we showed that this IRGA-gas exchange measurement in rice minicore diversity panel constitutes a powerful method to identify the genetic basis underlying the natural variation in Rd. In fact, the difference in Rd between species has been shown to maintain under the same environment [31], suggesting a strong genetic control over Rd. On the one hand, we showed that the SNP heritability (hSNP2) of Rd determined herein under GR conditions was 0.48, which was significantly higher than that recorded under field conditions (Table S2), consistent with a strong genetic-environment interaction controlling Rd (Table S4), as also shown earlier in Hordeum spontaneum [36] and in Arabidopsis [22]; on the other hand, we observed a strongly positive correlation between Rd values recorded under GR and field conditions (Pearson correlation coefficient, r = 0.4), which implies is the presence of a strong genetic control over natural variation of Rd, which sustains under different conditions (Figure 3A,B).
Based on the GWAS analysis, we demonstrated that the LRK1 variation was tightly associated with Rd under both GR and field conditions. LRK1 is annotated as a leucine rich repeat receptor kinase from UniProt database (www.uniprot.org), which functions as transmembrane receptor proteins that ensure communication between cells (cell to cell) and between the cell and its surrounding environments, especially under stressful conditions [37]. LRKs are reported to be involved in the early steps of osmotic-stress signaling [38], plant responses to various environmental and developmental signals [39,40,41]. The molecular mechanism of how LRK influences Rd is still unknown; however, experimental data shown in this report reveals a new function for LRK in the plant primary metabolism, in addition to its earlier reported roles in the signaling events in response to the environmental changes [42].
In fact, we showed that LRK1 influences the respiratory flux under dark (Rd). Earlier, it was also demonstrated that LRK plays a prominent role in processes of some metabolic pathways induced by light such as sucrose and 3-phosphoglyceric acid (3-PGA) [37]. Indeed, we found that LRK1 gene was highly expressed during darkness while during the daytime its expression levels dropped to about 10% of that under dark (Figure S5A). This robustly confirms the role of LRK1 in the modulation of nighttime Rd (Figure 3D). In a canopy, shaded leaves commonly show low Rd [13,43,44]. Currently, we also showed that there are substantial diurnal variations in Rd (Figure 6D), and similar results have been reported earlier in this regard [13]. The light regulation of LRK1 expression might have contributed to these diurnal changes of Rd as observed in the present report (Figure S5).
In addition to light, we also corroborated the temperature dependency of the LRK1 function in rice plants. It is well-known that plant respiration is mostly influenced by temperature [45]. Hence, increasing the air temperature causes a substantial increase in the respiratory fluxes at both the leaf and canopy scales [46]. This temperature dependency of respiration might potentially be related to the LRK1 biological function. Here, we showed that the expression of LRK1 is increased with increasing the temperature treatment for 30 min each (Figure 6B). Furthermore, the HapII of LRK1, which is associated with higher LRK1 gene expression, mainly exists in the regions characterized by their higher average temperature than lines harboring the HapI (Figure 6A). Altogether, this implies that the temperature can regulate the LRK1 expression levels, and hence, influence the Rd.
When plants were grown under 35 °C for 30 days, we did not observe any significant change in the photosynthetic CO2 uptake rates in the lrk1 mutant if compared to WT, under either high or low light (Figure S7). Interestingly, the lrk1 mutant shows a retarded growth relative to WT under such treatment, except normal condition (Figure 5C), concomitantly with a decrease of 63% in the Rd for the mutant compared to that of WT (Figure 6D). This result raises a possibility that the decrease in the respiratory rate in lrk1 might have compromised the plant growth in this mutant. Though increased respiration has always been cited as a cost to plant light use efficiency [34], here we showed that maintaining a proper rate of night-time respiration is also required for plants to gain optimal growth. A delicate balance is needed between minimizing respiratory cost to gain higher light conversion efficiency and maintaining sufficient flux through respiration to maintain the normal plant growth.
In summary, we presented a survey of the natural variation of dark respiration (Rd) in rice diversity panel and we found a large natural variation of Rd. Results from GWAS and gene editing experiments demonstrate that the natural variation of LRK1 gene is a major factor contributing to the natural variation of Rd. We further showed that the expression of LRK1 is both a light and temperature regulated process, which might have contributed to the observed diurnal changes in Rd and temperature responses of Rd. Gene editing experiments using the CRISPR-CAS9 technique further demonstrated a damping in Rd, thereby leading to a decrease in the plant biomass production under elevated temperature. LRK1 represents a first identified regulator of leaf-based dark respiration under darkness, which might be used to identify a potential target to gain the altered respiration under either different light or temperature conditions.

4. Materials and Methods

4.1. Rice Minicore Population

In total, 206 rice accessions from a global rice minicore diversity panel were used for dark respiration (Rd) measurements. This minicore panel was developed by USDA-ARS from 97 countries [47]. To study the plasticity of Rd to environments, we performed experiments under both growth room (GR) and field conditions. For the GR condition, three plants were grown in one pot with two pots for each accession. Potted plants were daily watered and standard nutrition was also supplied to avoid any nutrient limitation. Air temperature, photosynthetic photon flux density (PPFD) and humidity were maintained at around 27 °C, 500 μmol × m−2 × s−1 and 60–70%, respectively. For field experiments, rice seeds were sown on seedbeds in the field after germination in Hainan (E110°02′, N18°48′), China on 30th May 2018. Seedlings were then transplanted into the field at the fourth leaf stage, which occurred on June 25th 2018. Plants were grown in rows with a row distance of 20 cm and plants in the same row were spaced by 20 cm. A local field management practice was settled down in the field for nutrition supply and pesticide application. For measurements of Rd and the other physiological traits described below, 60-day old plants were used. Prior to Rd measurements in the field, six plants for each accession were first dug out and transferred to GR for at least 24 h to ensure full acclimation to the same controlled stable environments.
The geoclimatic data of the minicore population, including total photosynthetic active radiation (PAR), diffuse light, direct light and mean air temperature for the original region from where each rice accession was collected, were downloaded from the National Oceanic and Atmospheric Administration database, NOAA (https://gis.ncdc.noaa.gov/) as previously reported in detail [48]. We collected the geoclimatic information for the years during which each accession was released (1914~1997).

4.2. Measurements of Rd and Leaf Physiological Traits

Nighttime Rd is not constant and it is reported to enhance late at night or early morning ‘morning rise’ in mature rice leaves [14]. In this study, we measured the Rd during the time interval, 02:00 pm~05:00 am, during which the respiratory rate reaches its maximum. We used four portable infrared gas-exchange systems (Li-6400XT; LI-COR, Lincoln, NE, USA) to measure Rd for 206 rice minicore accessions. During the measurements, flow rates in the leaf cuvette were adjusted to around 300 μmol × min−1, leaf temperature was maintained at around 25 °C. Field grown plants were adapted to GR for 24 h prior to measurements as mentioned above. Each measurement took about 2 min. All measurements of Rd for 206 rice accessions were finished within 3 days. Photosynthetic rates under high light (1500 μmol × m−2 × s−1) and low light (100 μmol × m−2 × s−1), termed Ahigh and Alow, respectively, were measured during the time period 9:30 am ~ 12:30 pm on the same dates during which Rd was measured. To minimize the effects of growth stage differences, we measured photosynthetic parameters from accession 1 towards 206 sequentially for the first and third replicates and then, conversely, from accession 206 towards 1 sequentially for the second and fourth replicates. In total, we conducted four replicates for each rice accession.
Leaf total chlorophyll content and leaf thickness were determined using a SPAD 502 Plus Chlorophyll Meter (Spectrum Technologies, Aurora, IL, USA), respectively. For each leaf, the SPAD values were recorded as the mean of five measurements at different positions of the leaf middle section. In this context, four replicates from four different plants were used to determine both leaf chlorophyll content and leaf thickness.

4.3. Heat Stress Treatments

Plants were grown in pots in GR with the PPFD set to be around 500 μmol × m−2 × s−1, air temperature set to be around 27/25 °C (day/night), terms as 25 °C, and air humidity set to be 60–80%. During the heat stress treatment, an electronic heater (Meiling Ltd., MDN-RD702, Shanghai, China) was used to elevate air temperature to be around 37/35 °C (day/night), terms as 35 °C, for 30 days. Water and nutrients were routinely added to avoid growth limitations.

4.4. Genome-Wide Association Analysis

Details of the DNA sequencing dataset for the minicore panel used for genome wide association study (GWAS) were as mentioned in [27]. Briefly, we used ANGSD (version 0.542, UC-Berkeley, CA, USA) to detect SNP [49]. We further filtered out those SNPs whose minor allele frequency (MAF) was less than 5% in the population. After SNP calling, we found that there was about 30% missing SNPs on average for each chromosome. To obtain the complete SNP matrix, these missing SNPs were imputed using Beagle (version 3.3.2, Beagle Team, Seattle, WA, USA) [50]. The imputed genotype dataset was then converted to a binary genotype file (BED) format for association mapping using PLINK (version 1.07, Center for Human Genetic Research, Boston, MA, USA) [51]. In total, 2.3 million filtered SNPs were obtained. We used the GEMMA software, which takes into account both population structure (Q) and genetic kinship (K) [52] with a multivariate linear mixed model (MLM) to perform GWAS. To reduce the effects of population stratification on SNP signal detection, we applied the first four principal components from principal component analysis (PCA) as covariates. The PC1 and PC2 explain 58.4% and 33.1% phenotypic variance of minicore population structure, respectively (Figure S1). The critical threshold of significance for SNP-trait association was −log10P > 6.0, which was determined by 200 permutations as proposed by [27]. The Manhattan plot and QQ plot for the GWAS results were generated using the R package qqman in R software (v3.5.4, R Foundation, Auckland, New Zealand) [53]. We used linkage disequilibrium (LD) analysis to investigate the degree of association of the candidate genes to the lead SNP via Haploview software (version 4.2, Broad Institute, Cambridge, MA, USA) as demonstrated by [54]. The LD blocks were defined using D′ value as reported previously [55]:
D = D / Dmax
When D is positive, Dmax = min[(p1q2) or (p2q1)]; when D is negative, Dmax = min[(p1q1) or (p2q2)]. The p and q stand for the allelic frequencies of two SNPs. D′ represents a relative measure of disequilibrium (D) compared to its maximum [55]. The values of D′ in a block were calculated following “Gabriel et al.” model [54]. In this study, a 95% confidence bound on D′ was generated. The genes identified in the LD block with lead SNP were considered as potential candidate genes associated with Rd.

4.5. Transcript Abundance Analysis

To further screen the candidate genes within the LD block, we quantified the gene expression levels using quantitative real-time PCR (qRT-PCR) analysis among the 12 selected accessions with contrasting Rd values from the whole minicore panel (206 accessions). The total RNA was extracted with ambion PureLinkTM RNA mini kit (Thermo Fisher Scientific, Waltham, MA, USA) according to manufacturer’s instruction and was then reverse transcribed to cDNA with SuperScript VILO cDNA Synthesis Kit (Invitrogen Life Technologies, Thermo Fisher). Reaction was performed using SYBR Green PCR Master Mix (Applied Biosystems, Waltham, MA, USA) and samples were analyzed using a Real-Time PCR System (ABI StepOnePlus, Applied Biosystems) with the following cycling parameters: 95 °C for 10 s, 55 °C for 20 s, and 72 °C for 20 s. Rice Actin1 gene (Os03g50885) was used as control. Relative expression of the target gene against Actin1 was calculated as: 2−ΔΔCT × (ΔCT = CT, gene of interest−CT, Actin1), as described by [56]. Three biological replicates were used. The primers used for screening the candidate genes expressions are listed in Table S1.

4.6. Development of CRISPR-edited LRK1 Lines

To elucidate the biological function of LRK1 (Os03g51440) identified based on the GWAS analysis on Rd measured under both GR and field environments, we obtained CRISPR/CAS9-edited ChSDG rice lines (lrk1) following the method described previously [25] using Zhonghua 11 (ZH11), a commonly used rice cultivar in China, as the wild type (WT). The sequence of guide RNA (sgRNA) for ChSDG is as follows: 5′- TCACCACTCTCAACCTCGCGGGG-3′, which was designed by CRISPR-P database with high score (0.863, http://crispr.hzau.edu.cn). The resulted mutation causes a single ‘C’ allele deletion at the 508th nucleotide position in the coding sequence of LRK1. Homozygous lines were sequenced using specific primers listed in Table S1.

4.7. Statistical Analysis

To evaluate the effects of genotype-environment interaction on the variance of Rd and other physiological traits in these 206 rice minicore accessions, two-way ANOVA analysis based on general linear model was conducted using StatView, ver. 5.0.1 (SAS Institute Inc., Cary, NC, USA). GCTA software (version 1.25.2) was employed, and a restricted maximum likelihood analysis was used to estimate the SNP heritability (h2SNP) of Rd as described by [57]. The h2SNP was calculated with 2.3 million filtered SNPs as mentioned above in GWAS imputation section.

Supplementary Materials

The following are available online at https://0-www-mdpi-com.brum.beds.ac.uk/1422-0067/21/14/4930/s1. Figure S1. Principal component analysis (PCA) on 2.3 million filtered SNPs in a minicore population encompassing 206 rice accessions. Figure S2. Haplotype analysis of FIP1 (Fip1 motif family protein). Figure S3. Haplotype analysis of RBC6 (ribosomal protein L6). Figure S4. Phylogenetic tree of LRK1 within other species constructed based on the comparison of protein sequences between spices. Figure S5. Light dependent gene expression of LRK1. Figure S6. The expression levels of LRK1 in WT and CRISPR-CAS9 edited rice lines (lrk1). Figure S7. Photosynthetic rates assessed in WT and lrk1 grown under either normal or heat stress conditions. Figure S8. Q10 of the leaf Rd throughout night-time in WT and lrk1 mutant. Table S1. List of primers used in this study. Table S2.SNP heritability (h2SNP) of dark respiration (Rd) under both growth room (GR) and field conditions. The SNP heritability is calculated as the ratio of the genotypic variance to phenotypic variance. Table S3. Pearson correlation (r) of Rd to other physiological traits under both GR and field conditions. Table S4. Interaction effects of genotype-environment on Rd under both GR and field conditions. Table S5. Correlation of Rd with the geoclimate factors of the regions from where each accession of the minicore panel was collected. Table S6. Significantly associated SNPs list with Rd under both growth conditions (GR and field). Table S7. Candidate gene list for different significantly associated SNPs with Rd under GR condition. Table S8. D′ values for linkage block sourounding lead SNP (3m29440628) within a 100 kb genomic region. Table S9. qPCR analysis for the 12 selected candiate genes in 12 rice accessions with contrasting Rd values (six with low Rd and six with high Rd). Results are shown as the mean ± SE. Table S10. Candidate gene list for different significantly associated SNPs to Rd trait in field condition. Table S11. Morphological traits in response to heat stress in WT and lrk1 mutant evaluated under GR conditions.

Author Contributions

Conceptualization, G.-Y.C. and X.-G.Z.; Methodology, J.E. and M.Q.; Investigation, M.Q., S.C., M.L., T.C., and J.E.; Writing, M.Q., J.E., and X.-G.Z.; Funding Acquisition, M.Q. and X.-G.Z.; Resources, X.-G.Z.; Supervision, G.-Y.C. and X.-G.Z. All authors have read and agreed to the published version of the manuscript.

Funding

This work was supported by the Chinese Strategic Leading project category B (XDB27020105), National Natural Science Foundation of China (31700201) and Sailing Project, Shanghai Municipal Science and Technology Commission, China (17YF1421800) and Chinese Strategic Leading project category A (XDA08020301).

Acknowledgments

We thank Chengcai Chu for providing rice minicore population seeds, and Hualing Mi for the inspiring discussions and/or comments during this project. We are especially grateful to Xinyu Liu for vector construction. We would also like to thank Shanghai Orizymes Biotech Co., Ltd. and Shanghai Applied Protein Technology Co., Ltd. for technical services on bioinformatics analysis.

Conflicts of Interest

The authors have no competing interest to declare.

References

  1. Xu, M.; DeBiase, T.; Qi, Y.; Goldstein, A.; Liu, Z.G. Ecosystem respiration in a young ponderosa pine plantation in the Sierra Nevada Mountains, California. Tree Physiol. 2001, 21, 309–318. [Google Scholar] [CrossRef] [PubMed] [Green Version]
  2. Raich, J.; Schlesinger, W. The global carbon dioxide flux in soil respiration and its relationship to vegetation and climate. Tellus B 1992, 44, 81–99. [Google Scholar] [CrossRef] [Green Version]
  3. Field, C.B. Plant physiology of the “missing” carbon sink. Plant Physiol. 2001, 125, 25–28. [Google Scholar] [CrossRef] [PubMed] [Green Version]
  4. Gonzalez-Meler, M.A.; Taneva, L.; Trueman, R.J. Plant respiration and elevated atmospheric CO2 concentration: Cellular responses and global significance. Ann. Bot. 2004, 94, 647–656. [Google Scholar] [CrossRef] [PubMed] [Green Version]
  5. Schimel, D.S. Terrestrial ecosystems and the carbon cycle. Glob. Chang. Biol. 1995, 1, 77–91. [Google Scholar] [CrossRef]
  6. Poorter, H.; Remkes, C.; Lambers, H. Carbon and Nitrogen Economy of 24 Wild Species Differing in Relative Growth Rate. Plant Physiol. 1990, 94, 621–627. [Google Scholar] [CrossRef] [Green Version]
  7. Atkin, O.K.; Botman, B.; Lambers, H. The Causes of Inherently Slow Growth in Alpine Plants: An Analysis Based on the Underlying Carbon Economies of Alpine and Lowland Poa Species. Funct. Ecol. 1996, 10, 698–707. [Google Scholar] [CrossRef]
  8. Loveys, B.R.; Scheurwater, I.; Pons, T.L.; Fitter, A.H.; Atkin, O.K. Growth temperature influences the underlying components of relative growth rate: An investigation using inherently fast- and slow-growing plant species. Plant Cell Environ. 2002, 25, 975–988. [Google Scholar] [CrossRef]
  9. Hoefnagel, M.H.N.; Atkin, O.K.; Wiskich, J.T. Interdependence between chloroplasts and mitochondria in the light and the dark. Biochim. Biophys. Acta Bioenerg. 1998, 1366, 235–255. [Google Scholar] [CrossRef] [Green Version]
  10. Atkin, O.K.; Edwards, E.J.; Loveys, B.R. Response of root respiration to changes in temperature and its relevance to global warming. New Phytol. 2000, 147, 141–154. [Google Scholar] [CrossRef]
  11. Qu, M.; Zheng, G.; Hamdani, S.; Essemine, J.; Song, Q.; Wang, H.; Chu, C.; Sirault, X.; Zhu, X.G. Leaf photosynthetic parameters related to biomass accumulation in a global rice diversity survey. Plant Physiol. 2017, 175, 248–258. [Google Scholar] [CrossRef] [Green Version]
  12. Huber, S.C. Biochemical Mechanism for Regulation of Sucrose Accumulation in Leaves during Photosynthesis. Plant Physiol. 1989, 91, 656–662. [Google Scholar] [CrossRef] [Green Version]
  13. Noguchi, K. Effects of Light Intensity and Carbohydrate Status on Leaf and Root Respiration. In Plant Respiration; Lambers, H., Ribas-Carbo, M., Eds.; Springer: Dordrecht, The Netherlands, 2005; pp. 63–83. ISBN 978-1-4020-3589-0. [Google Scholar]
  14. Lee, K.; Akita, S. Factors Causing the Variation in the Temperature Coefficient of Dark Respiration in Rice (Oryza sativa L.). Plant Prod. Sci. 2000, 3, 38–42. [Google Scholar] [CrossRef]
  15. Azcon-Bieto, J.; Day, D.A.; Lambers, H. The regulation of respiration in the dark in wheat leaf slices. Plant Sci. Lett. 1983, 32, 313–320. [Google Scholar] [CrossRef]
  16. Noguchi, K.; Nakajima, N.; Terashima, I. Acclimation of leaf respiratory properties in Alocasia odora following reciprocal transfers of plants between high- and low-light environments. Plant. Cell Environ. 2001, 24, 831–839. [Google Scholar] [CrossRef]
  17. Amthor, J.S. The McCree–de Wit–Penning de Vries–Thornley Respiration Paradigms: 30 Years Later. Ann. Bot. 2000, 86, 1–20. [Google Scholar] [CrossRef] [Green Version]
  18. Amthor, J.S. Crop Growth and Maintenance Respiration. In Respiration and Crop Productivity; Amthor, J.S., Ed.; Springer: New York, NY, USA, 1989; pp. 69–104. ISBN 978-1-4615-9667-7. [Google Scholar]
  19. Zagdanska, B. Respiratory energy demand for protein turnover and ion transport in wheat leaves upon water deficit. Physiol. Plant. 2006, 95, 428–436. [Google Scholar] [CrossRef]
  20. Atkin, O.K.; Scheurwater, I.; Pons, T.L. Respiration as a percentage of daily photosynthesis in whole plants is homeostatic at moderate, but not high, growth temperatures. New Phytol. 2007, 174, 367–380. [Google Scholar] [CrossRef]
  21. Barneix, A.; Cooper, H.; Stulen, I.; Lambers, H. Metabolism and translocation of nitrogen in two Lolium population with contrasting rates mature leaf respiraiion and yield. Physiol. Plant. 2007, 72, 631–636. [Google Scholar] [CrossRef]
  22. Leary, B.M.; Lee, C.P.; Atkin, O.K.; Cheng, R.; Brown, T.B.; Millar, A.H. Variation in leaf respiration rates at night correlates with carbohydrate and amino acid supply. Plant Physiol. 2017, 174, 2261–2273. [Google Scholar]
  23. Huang, X.; Wei, X.; Sang, T.; Zhao, Q.; Feng, Q.; Zhao, Y.; Li, C.; Zhu, C.; Lu, T.; Zhang, Z.; et al. Genome-wide asociation studies of 14 agronomic traits in rice landraces. Nat. Genet. 2010, 42, 961. [Google Scholar] [CrossRef] [PubMed]
  24. Huang, X.; Han, B. Natural variations and genome-wide association studies in crop plants. Annu. Rev. Plant Biol. 2014, 65, 531–551. [Google Scholar] [CrossRef]
  25. Hamdani, S.; Wang, H.; Zheng, G.; Perveen, S.; Qu, M.; Khan, N.; Khan, W.; Jiang, J.; Li, M.; Liu, X.; et al. Genome-wide association study identifies variation of glucosidase being linked to natural variation of the maximal quantum yield of photosystem II. Physiol. Plant. 2019, 166, 105–119. [Google Scholar] [CrossRef] [PubMed]
  26. Agrama, H.A.; Yan, W.G.; Lee, F.; Robert, F.; Chen, M.H.; Jia, M.; McClung, A. Genetic assessment of a mini-core subset developed from the USDA rice genebank. Crop Sci. 2009, 49, 1336–1346. [Google Scholar] [CrossRef]
  27. Wang, H.; Xu, X.; Vieira, F.G.; Xiao, Y.; Li, Z.; Wang, J.; Nielsen, R.; Chu, C. The Power of Inbreeding: NGS-Based GWAS of Rice Reveals Convergent Evolution during Rice Domestication. Mol. Plant 2016, 9, 975–985. [Google Scholar] [CrossRef] [PubMed] [Green Version]
  28. Zhou, X.; Stephens, M. Genome-wide efficient mixed-model analysis for association studies. Nat. Genet. 2012, 44, 821–824. [Google Scholar] [CrossRef] [Green Version]
  29. Yang, W.; Guo, Z.; Huang, C.; Duan, L.; Chen, G.; Jiang, N.; Fang, W.; Feng, H.; Xie, W.; Lian, X.; et al. Combining high-throughput phenotyping and genome-wide association studies to reveal natural genetic variation in rice. Nat. Commun. 2014, 5, 5087. [Google Scholar] [CrossRef]
  30. Berry, J.A.; Raison, J.K. Responses of Macrophytes to Temperature. In Physiological Plant Ecology I; Lange, O.L., Nobel, P.S., Osmond, C.B., Ziegler, H., Eds.; Springer: Berlin, Germany, 1981; pp. 277–338. ISBN 978-3-642-68090-8. [Google Scholar]
  31. Atkin, O.K.; Bloomfield, K.J.; Reich, P.B.; Tjoelker, M.G.; Asner, G.P.; Bonal, D.; Bönisch, G.; Bradford, M.G.; Cernusak, L.A.; Cosio, E.G.; et al. Global variability in leaf respiration in relation to climate, plant functional types and leaf traits. New Phytol. 2015, 206, 614–636. [Google Scholar] [CrossRef] [Green Version]
  32. Wright, I.J.; Reich, P.B.; Atkin, O.K.; Lusk, C.H.; Tjoelker, M.G.; Westoby, M. Irradiance, temperature and rainfall influence leaf dark respiration in woody plants: Evidence from comparisons across 20 sites. New Phytol. 2006, 169, 309–319. [Google Scholar] [CrossRef]
  33. Reich, P.B.; Tjoelker, M.G.; Pregitzer, K.S.; Wright, I.J.; Oleksyn, J.; Machado, J.-L. Scaling of respiration to nitrogen in leaves, stems and roots of higher land plants. Ecol. Lett. 2008, 11, 793–801. [Google Scholar] [CrossRef]
  34. Zhu, X.G.; Long, S.P.; Ort, D.R. What is the maximum efficiency with which photosynthesis can convert solar energy into biomass? Curr. Opin. Biotechnol. 2008, 19, 153–159. [Google Scholar] [CrossRef]
  35. Paul, V.; Pandey, R.; Anand, A. Measurement of plant respiration by infrared gas analyzer (IRGA). In Manual of ICAR Sponsored Training Programme for Technical Staff of ICAR Institutes on Physiological Techniques to Analyze the Impact of Climate Change on Crop Plants; ICAR-Indian Agricultural Research Institute (IARI): New Delhi, India, 2017. [Google Scholar]
  36. Poorter, H.; Van Rijn, C.P.E.; Vanhala, T.K.; Verhoeven, K.J.F.; De Jong, Y.E.M.; Stam, P.; Lambers, H. A genetic analysis of relative growth rate and underlying components in Hordeum spontaneum. Oecologia 2005, 142, 360–377. [Google Scholar] [CrossRef] [Green Version]
  37. Shiu, S.-H.; Karlowski, W.M.; Pan, R.; Tzeng, Y.-H.; Mayer, K.F.X.; Li, W.-H. Comparative analysis of the receptor-like kinase family in Arabidopsis and rice. Plant Cell 2004, 16, 1220–1234. [Google Scholar] [CrossRef] [Green Version]
  38. Osakabe, Y.; Arinaga, N.; Umezawa, T.; Katsura, S.; Nagamachi, K.; Tanaka, H.; Ohiraki, H.; Yamada, K.; Seo, S.-U.; Abo, M.; et al. Osmotic Stress Responses and Plant Growth Controlled by Potassium Transporters in Arabidopsis. Plant Cell 2013, 25, 609–624. [Google Scholar] [CrossRef] [Green Version]
  39. Diévart, A.; Clark, S.E. LRR-containing receptors regulating plant development and defense. Development 2004, 131, 251–261. [Google Scholar] [CrossRef] [Green Version]
  40. Zan, Y.; Ji, Y.; Zhang, Y.; Yang, S.; Song, Y.; Wang, J. Genome-wide identification, characterization and expression analysis of populus leucine-rich repeat receptor-like protein kinase genes. BMC Genomics 2013, 14, 318. [Google Scholar] [CrossRef] [Green Version]
  41. Song, W.Y.; Wang, G.L.; Chen, L.L.; Kim, H.S.; Pi, L.Y.; Holsten, T.; Gardner, J.; Wang, B.; Zhai, W.X.; Zhu, L.H.; et al. A receptor kinase-like protein encoded by the rice disease resistance gene, Xa21. Science 1995, 270, 1804–1806. [Google Scholar] [CrossRef] [Green Version]
  42. Zha, X.; Luo, X.; Qian, X.; He, G.; Yang, M.; Li, Y.; Yang, J. Over-expression of the rice LRK1 gene improves quantitative yield components. Plant Biotechnol. J. 2009, 7, 611–620. [Google Scholar] [CrossRef]
  43. Ehleringer, J.; Björkman, O. Quantum yiel for CO2 uptake in C3 and C4 plants. Dependence on temperature, CO2 and O2 concentration. Plant Physiol. 1977, 59, 86–90. [Google Scholar] [CrossRef] [Green Version]
  44. Lusk, C.H.; Reich, P.B. Relationships of leaf dark respiration with light environment and tissue nitrogen content in juveniles of 11 cold-temperate tree species. Oecologia 2000, 123, 318–329. [Google Scholar] [CrossRef]
  45. Atkin, O.K.; Tjoelker, M.G. Thermal acclimation and the dynamic response of plant respiration to temperature. Trends Plant Sci. 2003, 8, 343–351. [Google Scholar] [CrossRef]
  46. Slot, M.; Rey-Sánchez, C.; Gerber, S.; Lichstein, J.W.; Winter, K.; Kitajima, K. Thermal acclimation of leaf respiration of tropical trees and lianas: Response to experimental canopy warming, and consequences for tropical forest carbon balance. Glob. Chang. Biol. 2014, 20, 2915–2926. [Google Scholar] [CrossRef]
  47. Agrama, H.A.; Yan, W.; Jia, M.; Fjellstrom, R.; McClung, A.M. Genetic structure associated with diversity and geographic distribution in the USDA rice world collection. Nat. Sci. 2010, 2, 247–291. [Google Scholar] [CrossRef] [Green Version]
  48. Qu, M.; Hamdani, S.; Li, W.; Wang, S.; Tang, J.; Chen, Z.; Song, Q.; Li, M.; Zhao, H.; Chang, T.; et al. Rapid stomatal response to fluctuating light: An under-explored mechanism to improve drought tolerance in rice. Funct. Plant Biol. 2016, 43, 727–738. [Google Scholar] [CrossRef] [Green Version]
  49. Korneliussen, T.S.; Albrechtsen, A.; Nielsen, R. ANGSD: Analysis of Next Generation Sequencing Data. BMC Bioinform. 2014, 15, 356. [Google Scholar] [CrossRef] [Green Version]
  50. Browning, S.R.; Browning, B.L. Rapid and accurate haplotype phasing and missing-data inference for whole-genome association studies by use of localized haplotype clustering. Am. J. Hum. Genet. 2007, 81, 1084–1097. [Google Scholar] [CrossRef] [Green Version]
  51. Purcell, S.; Neale, B.; Todd-Brown, K.; Thomas, L.; Ferreira, M.A.R.; Bender, D.; Maller, J.; Sklar, P.; De Bakker, P.I.W.; Daly, M.J.; et al. PLINK: A tool set for whole-genome association and population-based linkage analyses. Am. J. Hum. Genet. 2007, 81, 559–575. [Google Scholar] [CrossRef] [Green Version]
  52. Turner, S.D. qqman: An R package for visualizing GWAS results using Q-Q and manhattan plots. BioRxiv 2014. [Google Scholar] [CrossRef]
  53. Barrett, J.C.; Fry, B.; Maller, J.; Daly, M.J. Haploview: Analysis and visualization of LD and haplotype maps. Bioinformatics 2004, 21, 263–265. [Google Scholar] [CrossRef] [Green Version]
  54. Gabriel, S.B.; Schaffner, S.F.; Nguyen, H.; Moore, J.M.; Roy, J.; Blumenstiel, B.; Higgins, J.; DeFelice, M.; Lochner, A.; Faggart, M.; et al. The structure of haplotype blocks in the human genome. Science 2002, 296, 2225–2229. [Google Scholar] [CrossRef] [Green Version]
  55. Devlin, B.; Risch, N. A comparison of linkage disequilibrium measures for fine-scale mapping. Genomics 1995, 29, 311–322. [Google Scholar] [CrossRef] [PubMed] [Green Version]
  56. Livak, K.J.; Schmittgen, T.D. Analysis of relative gene expression data using real-time quantitative PCR and the 2(-Delta Delta C (T)) Method. Methods 2001, 25, 402–408. [Google Scholar] [CrossRef] [PubMed]
  57. Yang, J.; Lee, S.H.; Goddard, M.E.; Visscher, P.M. GCTA: A tool for genome-wide complex trait analysis. Am. J. Hum. Genet. 2011, 88, 76–82. [Google Scholar] [CrossRef] [PubMed] [Green Version]
Figure 1. Natural variation of dark respiration (Rd) in 206 rice lines in a global rice minicore diversity panel. (A,B) Histogram of Rd under growth room (GR) and field conditions, respectively. (C,D) Frequency distribution of observed Rd under GR and field, respectively. indica includes Australica (AUS) and indica (IND); while, japonica encompasses temperate japonica (TEJ), tropical japonica (TRJ) and aromatic (ARO). Admix represents a mixture of indica and japonica. Different letters are significantly different at 5% level among subpopulations with the Tukey test.
Ijms 21 04930 g001
Figure 2. Genome-wide association study (GWAS) performed on the Rd trait under GR and field conditions. (A,B) Manhattan plots from the associate mapping of Rd using a linear mixed model (MLM) in GR and field, respectively. (C,D) QQ plots of expected versus observed P-values of Rd in GR and field, consecutively. The vertical dashed-line crossing both Manhattan plots at Chr.3 represents the overlapped genomic regions of significantly associated SNPs for both conditions (GR and field).
Ijms 21 04930 g002
Figure 3. Haplotype analysis of the genomic regions surrounding the lead SNP. (A,B) Zoom-out of Manhattan plot of the Rd trait to show the overlapped genomic regions in GR and field conditions, respectively. The vertical dashed-line represents the lead SNP position under both conditions (GR and field). (C) LD block covering 100 kb genomic regions centered the lead SNP (3m29440628) in GR. Three blocks (blcs) were obtained within this region. The numbers from 1 to 12 indicate EP1, SEC14, LRK1, EP2, EP3, EP4, MAF1, EP5, EP6, RBC6, FIP1, and EP7, respectively. Details about genes ID according to Michigan State University (MSU) Rice Genome Annotation Project Database (http://rice.plantbiology.msu.edu) are depicted in Table S1. Expressed, hypothetical and annotated proteins were highlighted in yellow, red, and green, respectively, according to the rice MSU database. (D) Relative gene expression levels of the 12 candidate genes against the housekeeping gene, actin1, in two groups of accessions, i.e., the group with high Rd and the group with low Rd, selected from the rice minicore panel. These 12 accessions with contrasting Rd values include six accessions having high Rd and six accessions with low Rd. The detailed genes expressions levels for 12 accessions are displayed in Table S8. Data are means of three biological replicates performed on three different leaves obtained from different plants ±SE.
Ijms 21 04930 g003
Figure 4. Haplotype analysis of LRK1. (A) Pair-wise LD between SNP markers on the promoter and coding region of LRK1 on Chr. 3. The LD was indicated as D′ values via Haploview software. Two haplotypes (HapI and HapII) were shown harboring five alternative SNPs at different position. The five SNPs from SNP1 to SNP5 are 3m29427828, 3m29428645, 3m29428974, 3m29429743, and 3m29430694 at +2621 bp, +1806 bp, +1479 bp, +709 bp, and −242 bp, respectively. SNP1 and SNP2 are located in intron, while SNP 3 and SNP4 are at exon of LRK1 gene body; however, SNP5 is on promoter region. (B) Comparison on Rd between HapI and HapII with the accessions number for each haplotype are indicated in brackets. A t-test was performed to estimate the P-value between the two haplotypes. (C) Pie-charts of two haplotypes. The percentage of each subpopulation relative to the overall population number was also indicated for each haplotype. Subpopulation includes admixture (admix), aromatic (ARO), aus (AUS), indica (IND), temperate japonica (TEJ), and tropical japonica (TRJ).
Ijms 21 04930 g004
Figure 5. Biological function of knock-out lines of LRK1. (A) DNA sequencing of CRISPR-CAS9 edited LRK1, designated lrk1. The arrow indicates the mutation site. (B) Target of gRNA in lrk1. The arrow indicates the position of guide RNA (gRNA) target. Amino acid (AA) changes due to CRSIPR-CAS9 led to a single “C” allele deletion at 508th nucletide (170th AA), and stop codon at the 180th AA in lrk1. (C) Performance of WT and lrk1 mutant grown in GR under ambient temperature (25 °C) and the vertical white bar displays the scaling bar of 10 cm length. (D) Rd dynamics during nighttime in 60-day old plants of WT and lrk1 mutant grown in GR at 25 °C. Each data point represents the mean of six different replicates performed on different plants ±SE.
Ijms 21 04930 g005
Figure 6. Response of LRK1 rice mutants to heat stress. (A) Comparison of haplotypes of LRK1 with the mean annual temperature of the regions from where each accession in the minicore panel was collected. (B) Temperature-dependent of LRK1 gene expression levels in 40-day old WT rice plants. Each temperature treatment was applied for 30 min at the leaves level. (C) Performance of WT and lrk1 grown in GR exposed to long-term heat stress (35 °C) for 30 days on 30-day old plants. The white vertical scaling bar represents 10 cm length. (D) Rd dynamics during nighttime for WT and lrk1 mutant measured at the end of heat treatment (60-day old plants including 30 days at normal temperature and 30 days exposure to 35 °C). For panel (D) each data point is the average of six different measurements conducted on six different plants ±SE.
Ijms 21 04930 g006

