Alterations in Concentration/Activity of Superoxide Dismutases in Context of Obesity and Selected Single Nucleotide Polymorphisms in Genes: SOD1, SOD2, SOD3


Abstract
:1. Introduction
2. Results
2.1. Intersexual Variability in Concentration/Activity of SOD Isozymes, Total Antioxidative Capacity (TAC) Values, Concentration of Malondialdehyde (MDA) and Metals: Copper, Zinc, and Cadmium
2.2. Alterations in Concentration/Activity of Superoxide Dismutase (SOD) Isozymes, TAC Values, Concentration of MDA and Metals: Copper, Zinc, and Cadmium, in Context of Obesity and Exposition to Cigarette Smoke
2.3. Selected Correlations between the Concentration/Activity of SODs and Concentration of Copper, Zinc, and Cadmium, and Other Parameters
2.4. Genotyping Results—Genotypic Frequency in Context of Obesity
2.5. Values of SOD Concentration/Activity, TAC, and Concentration of MDA, in Context of Genotypic Variability of the Chosen Single Nucleotide Polymorphisms in Genes: SOD1, SOD2, SOD3
2.6. Other Findings Regarding Genotypic Variability of Single Nucleotide Polymorphisms (SNPs): rs2234694 (SOD1), rs4880 (SOD2)
3. Discussion
4. Materials and Methods
4.1. Material
4.2. Characteristics of the Population Sample and the Criteria for Exclusion from the Study and Division into Groups
4.3. Methods
4.3.1. Selected Markers of Nicotine Exposure, Carbohydrate, and Lipid Metabolism and Inflammation
4.3.2. Concentration and Activity of Superoxide Dismutase Isozymes
4.3.3. Total Antioxidative Capacity and Malondialdehyde Concentration
4.3.4. Copper, Zinc, and Cadmium Concentration
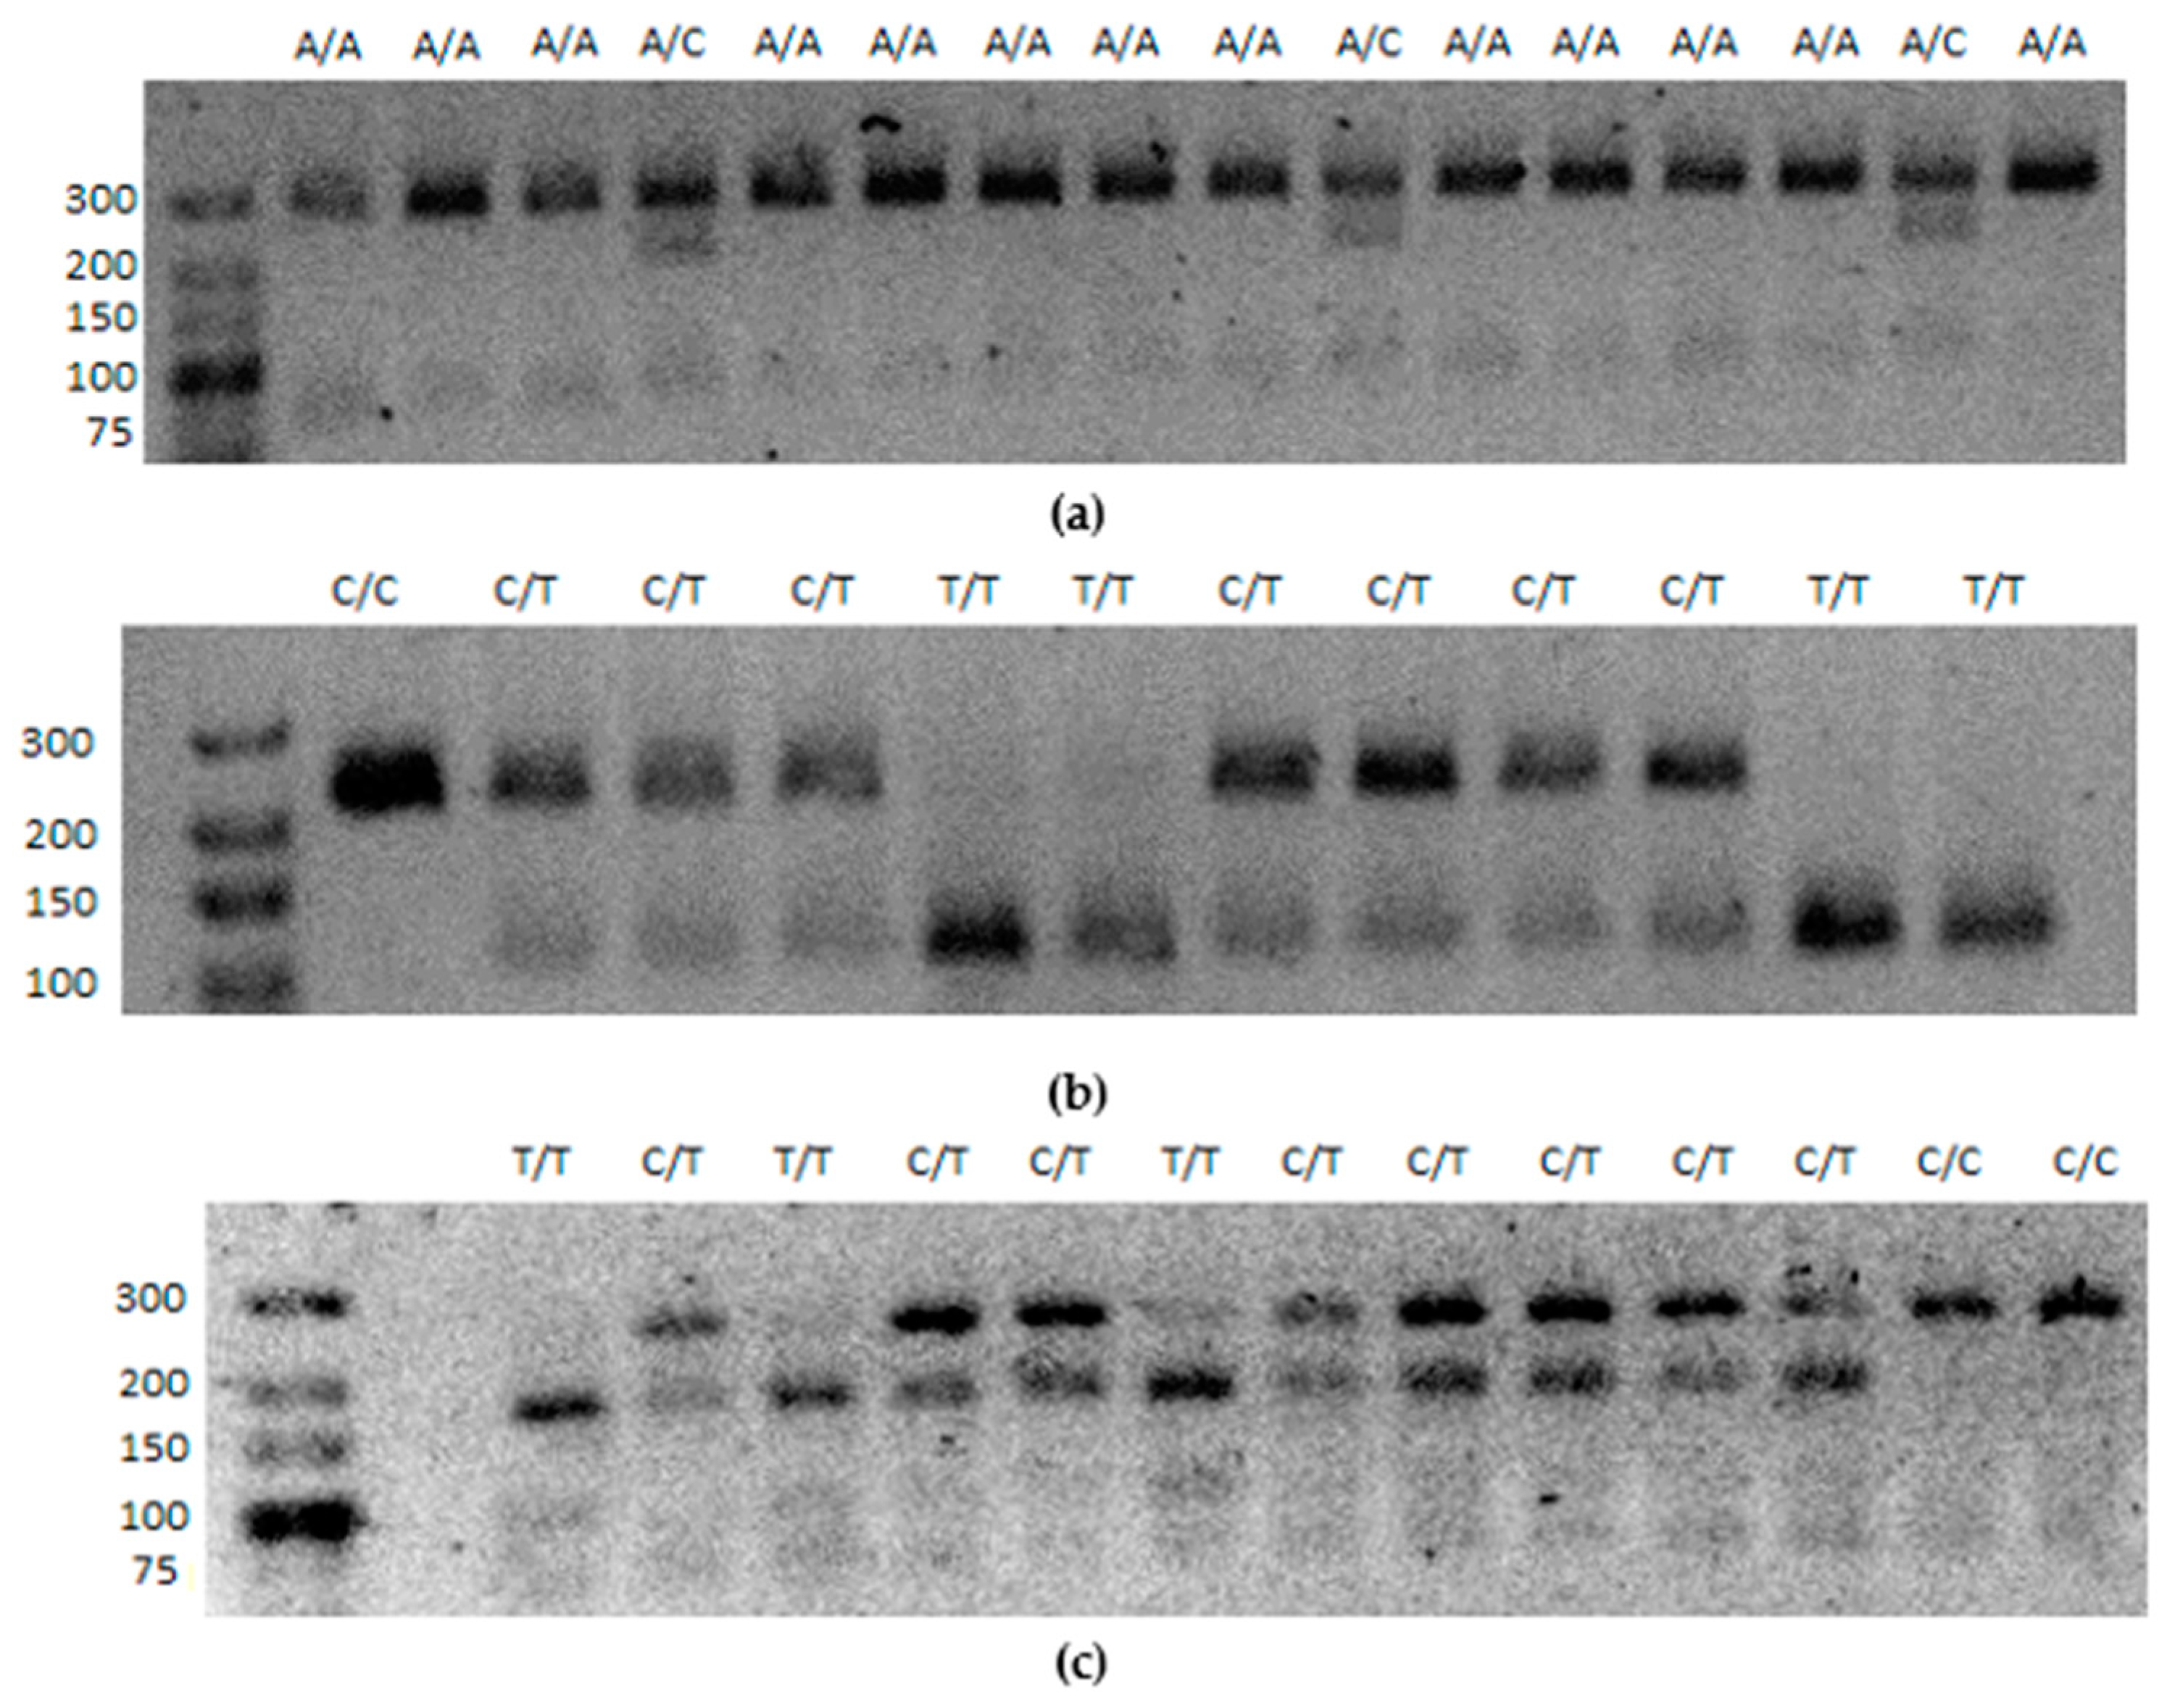
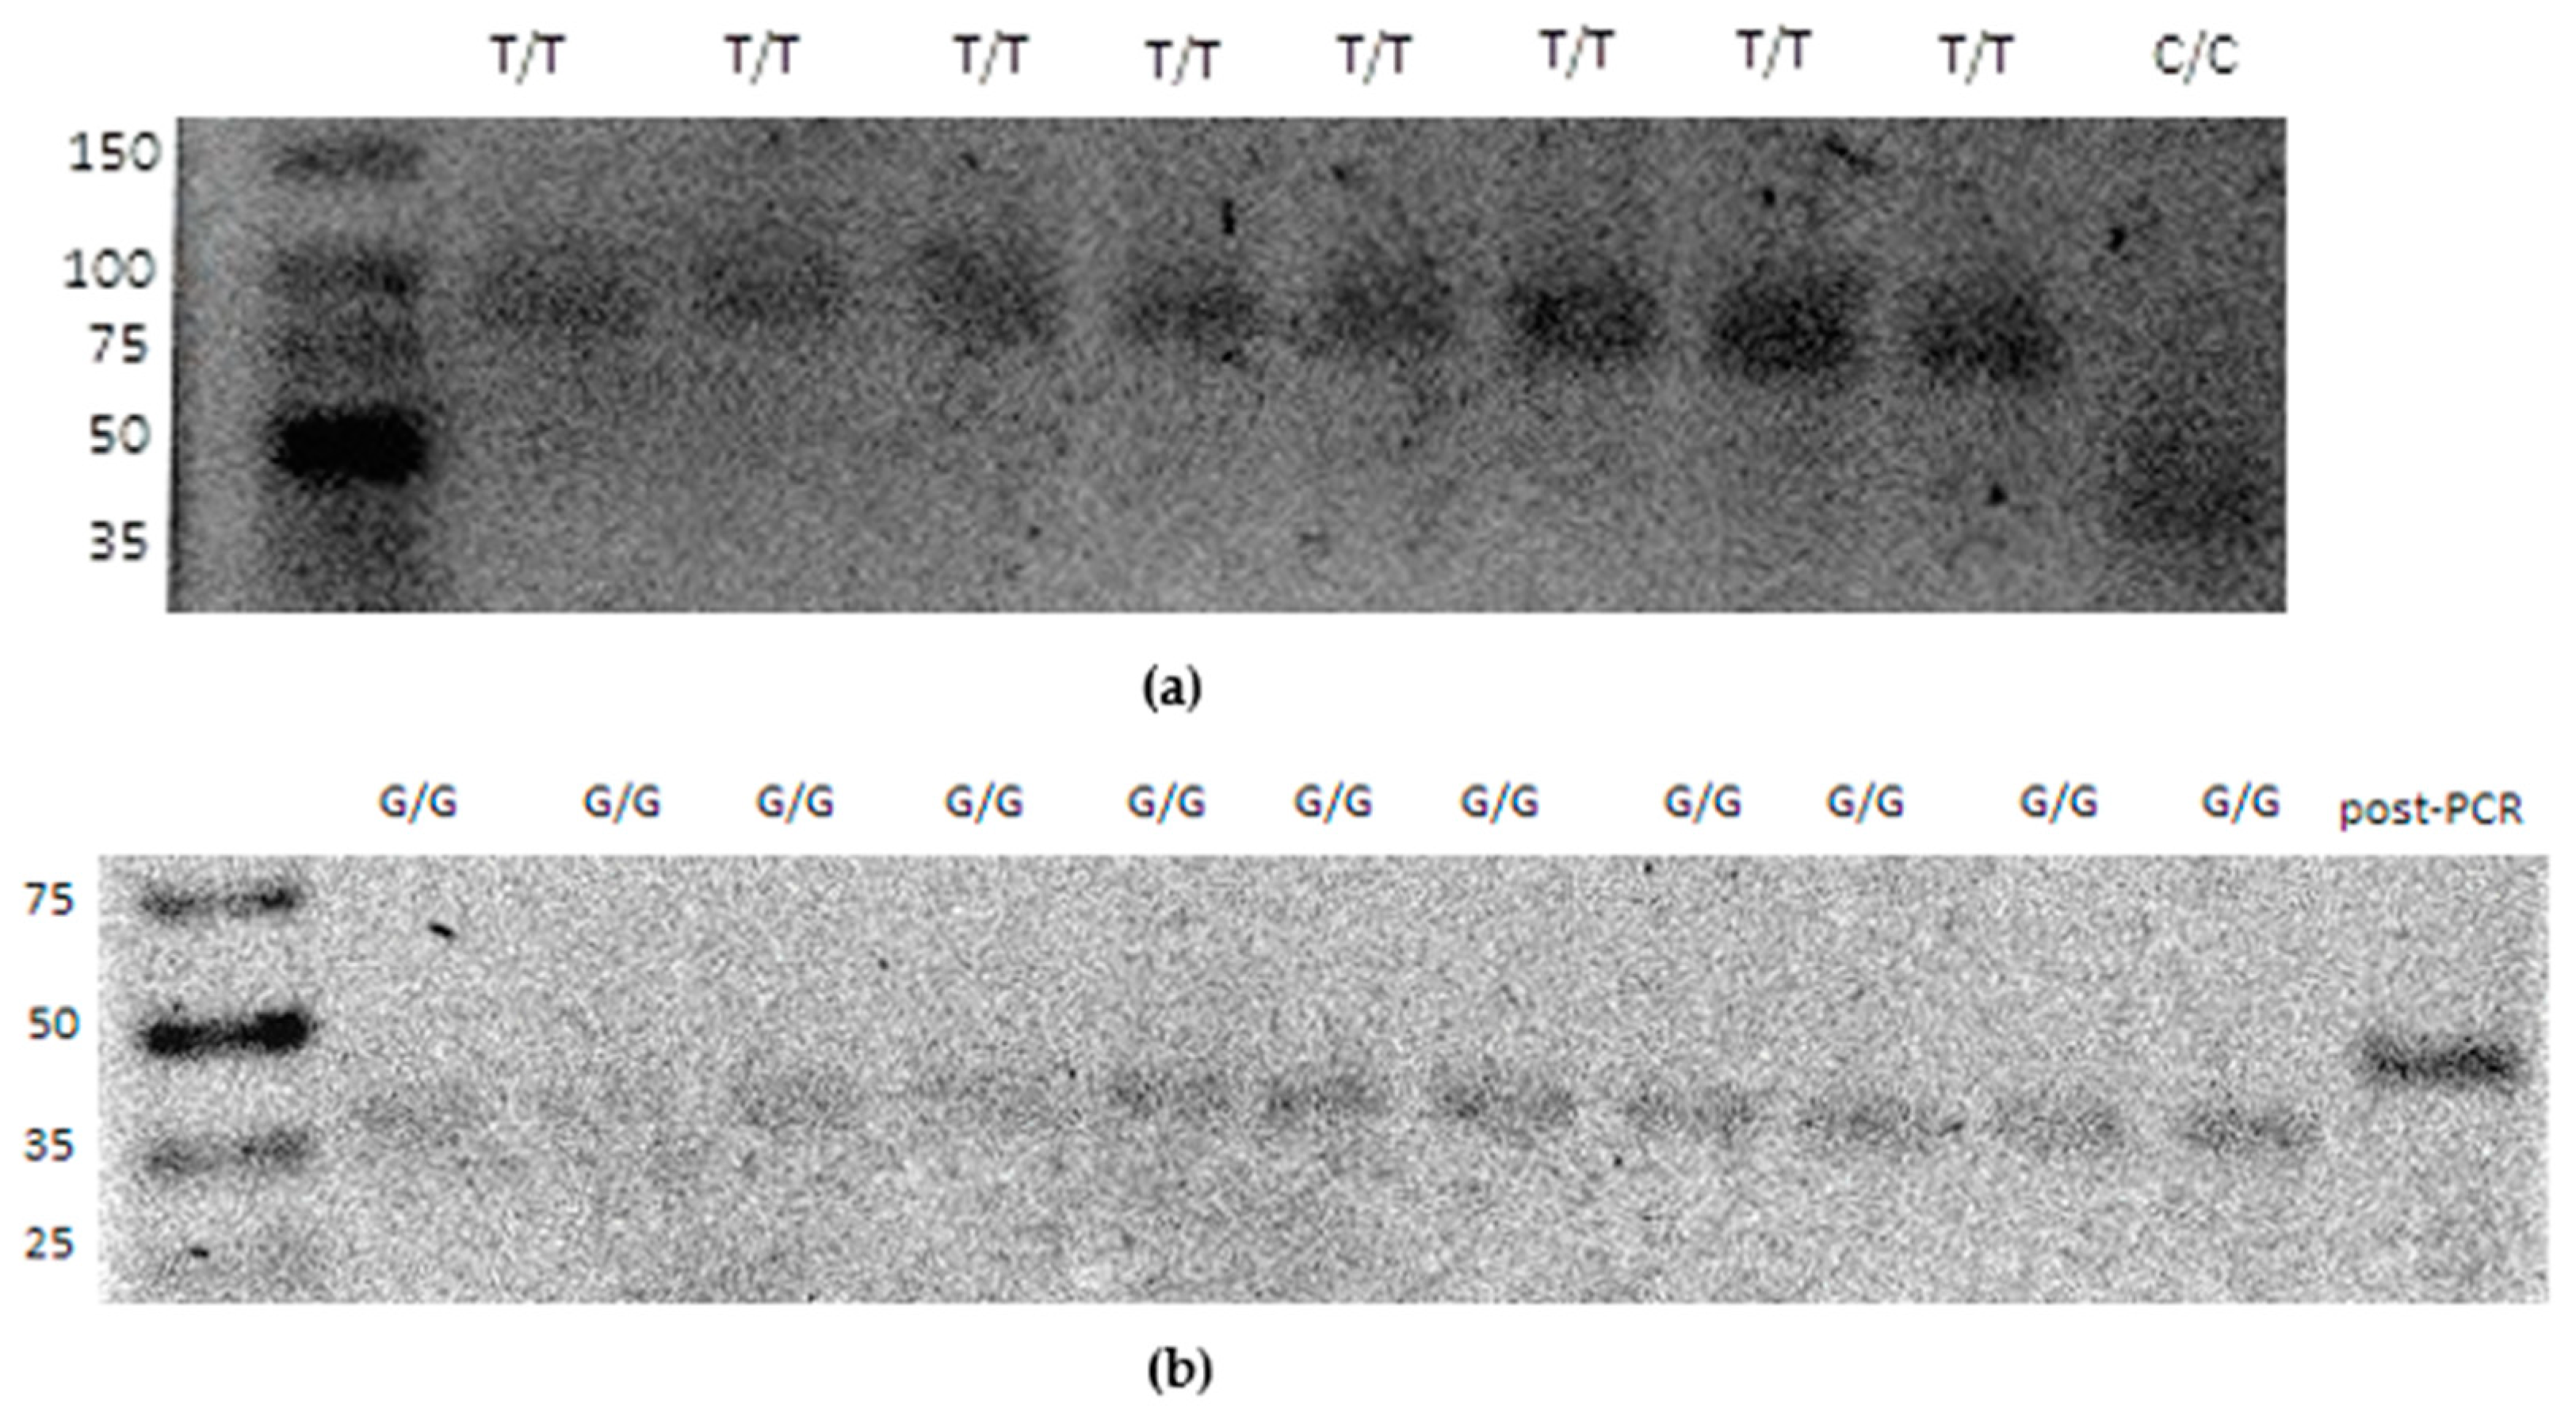
4.3.5. Genotyping
4.4. Statistical Analyses
5. Conclusions
Author Contributions
Funding
Conflicts of Interest
Abbreviations
| BMI | body mass index |
| GAPDH | glyceraldehyde 3-phosphate dehydrogenase |
| HOMA-IR | homeostatic model assessment - insulin resistance index |
| MDA | malondialdehyde |
| ROS | reactive oxygen species |
| SNP, SNPs | single nucleotide polymorphism(s) |
| SOD | superoxide dismutase |
| SOD1 | cytosolic, copper–zinc superoxide dismutase |
| SOD2 | mitochondrial, manganese superoxide dismutase |
| SOD3 | extracellular, copper–zinc superoxide dismutase |
| SODs | superoxide dismutase isozymes |
| TAC | total antioxidative capacity |
| UCP, UCPs | uncoupling protein(s) |
Appendix A

| Parameter | C/C or C/T Genotype (n = 27) (13 Women. 14 Men) | T/T Genotype (n = 23) (16 Women. 7 Men) |
|---|---|---|
| SOD1 (ng/mL) | {23.43; 33.91; 42.18} | {18.86; 28.40; 38.24} |
| SOD1 (ng/mg total protein) | {0.160; 0.266; 0.354} | {0.161; 0.212; 0.324} |
| SOD2 (ng/mL) | {21.97; 27.55; 32.85} | {22.34; 24.88; 36.75} |
| SOD2 (ng/mg total protein) | {0.168; 0.199; 0.252} | {0.176; 0.219; 0.287} |
| SOD3 (ng/mL) | {20.50; 27.79; 36.07} | {25.46; 29.21; 38.12} |
| SOD3 (ng/mg total protein) | {0.158; 0.232; 0.286} | {0.184; 0.259; 0.329} |
| SOD (U/L) | {1642; 2301; 2578} | {1602; 2336; 2763} |
| SOD (U/g total protein) | {11.61; 17.38; 21.08} | {13.20; 19.48; 22.94} |
| SOD (U/mg SODs) | {20.25; 24.32; 29.48} | {16.66; 23.31; 33.93} |
| Cu,Zn-SOD (U/L) | {495; 948; 1264} | {530; 780; 1252} |
| Cu,Zn-SOD (U/g total protein) | {3.90; 7.04; 9.94} | {4.05; 6.77; 10.29} |
| Cu,Zn-SOD (U/mg SOD1+SOD3) | {8.90; 14.50; 19.03} | {10.36; 15.86; 20.02} |
| Cu,Zn-SOD (% SOD activity) | {27.92; 41.26; 51.40} | {25.49; 35.12; 57.02} |
| Mn-SOD (U/L) | {1118; 1213; 1591} | {979; 1226; 1933} |
| Mn-SOD (U/g total protein) | {8.14; 9.97; 11.52} | {8.03; 10.08; 15.92} |
| Mn-SOD (U/mg SOD2) | {39.10; 49.55; 64.51} | {27.21; 40.84; 71.02} |
| TAC (mM UAE) | {0.266; 0.318; 0.359} | {0.249; 0.291; 0.335} |
| MDA (µmol/L) | {4.05; 5.21; 6.64} | {3.82; 4.94; 5.75} |
| Cu (µg/L) | {972; 1025; 1232} | {830; 986; 1155} |
| Zn (µg/L) | {853; 982; 1105} | {854; 926; 1018} |
| Zn/Cu | {0.81; 0.90; 1.03} | {0.84; 0.98; 1.17} |
| Parameter | C/C or C/T Genotype (n = 26) (13 Women. 13 Men) | T/T Genotype (n = 18) (7 Women. 11 Men) |
|---|---|---|
| SOD1 (ng/mL) | {29.64; 39.83; 49.45} | {30.12; 39.47; 49.28} |
| SOD1 (ng/mg total protein) | {0.225; 0.334; 0.437} | {0.274; 0.328; 0.393} |
| SOD2 (ng/mL) | {18.17; 22.63; 28.03} | {21.66; 25.01; 30.92} |
| SOD2 (ng/mg total protein) | {0.151; 0.192; 0.252} | {0.166; 0.211; 0.279} |
| SOD3 (ng/mL) | {23.57; 28.96; 32.98} | {25.60; 30.25; 32.67} |
| SOD3 (ng/mg total protein) | {29.64; 39.83; 49.45} | {30.12; 39.47; 49.28} |
| SOD (U/L) | {2016; 2219; 2419} | {1697; 2045; 2477} |
| SOD (U/g total protein) | {16.96; 18.70; 20.53} | {12.64; 16.55; 20.47} |
| SOD (U/mg SODs) | {19.53; 22.39; 26.49} | {18.03; 20.06; 25.31} |
| Cu,Zn-SOD (U/L) | {608; 772; 1010} | {610; 750; 852} |
| Cu,Zn-SOD (U/g total protein) | {5.12; 6.07; 7.87} | {4.81; 5.98; 7.65} |
| Cu,Zn-SOD (U/mg SOD1+SOD3) | {7.48; 11.10; 13.99} | {8.04; 10.24; 13.72} |
| Cu,Zn-SOD (% SOD activity) | {28.65; 34.93; 46.37} | {29.47; 36.11; 39.49} |
| Mn-SOD (U/L) | {1140; 1457; 1625} | {1047; 1389; 1460} |
| Mn-SOD (U/g total protein) | {9.71; 11.78; 13.87} | {8.96; 10.63; 12.68} |
| Mn-SOD (U/mg SOD2) | {42.12; 59.26; 80.08} | {36.92; 49.58; 68.37} |
| TAC (mM UAE) | {0.360; 0.391; 0.454} | {0.324; 0.377; 0.426} |
| MDA (µmol/L) | {6.10; 6.58; 10.35} | {5.91; 6.82; 8.46} |
| Cu (µg/L) | {935; 1056; 1126} | {960; 1148; 1308} |
| Zn (µg/L) | {894; 967; 1039} | {878; 936; 1024} |
| Zn/Cu | {0.79; 0.95; 1.09} | {0.72; 0.88; 1.01} |
| Parameter | C/C Genotype (n = 12) (8 Women. 4 Men) | T/C Genotype (n = 22) (12 Women. 10 Men) | T/T Genotype (n = 16) (9 Women. 7 Men) |
|---|---|---|---|
| SOD1 (ng/mL) | {19.32; 33.48; 37.87} | {20.69; 32.43; 49.33} | {17.95; 26.22; 36.78} |
| SOD1 (ng/mg total protein) | {0.178; 0.241; 0.326} | {0.161; 0.243; 0.354} | {0.146; 0.177; 0.270} |
| SOD2 (ng/mL) | {22.29; 25.93; 29.93} | {19.97; 24.31; 36.72} | {22.34; 28.30; 33.44} |
| SOD2 (ng/mg total protein) | {0.186; 0.217; 0.279} | {0.159; 0.215; 0.269} | {0.160; 0.203; 0.289} |
| SOD3 (ng/mL) | {20.64; 25.73; 33.03} | {20.84; 29.98; 40.05} | {18.80; 29.21; 36.24} |
| SOD3 (ng/mg total protein) | {0.165; 0.235; 0.319} | {0.158; 0.250; 0.310} | {0.160; 0.245; 0.270} |
| SOD (U/L) | {2106; 2347; 2590} | {1602; 2337; 2685} | {1539; 1882; 2430} |
| SOD (U/g total protein) | {15.94; 20.16; 23.07} | {12.37; 19.18; 20.71} | {9.97; 13.60; 20.19} |
| SOD (U/mg SODs) | {23.81; 27.00; 32.74} | {17.25; 21.64; 33.57} | {17.95; 25.27; 30.50} |
| Cu,Zn-SOD (U/L) | {604; 1106; 1388} | {530; 702; 1105} | {436; 991; 1164} |
| Cu,Zn-SOD (U/g total protein) | {4.88; 9.98; 11.86} | {3.98; 5.73; 9.68} | {2.72; 7.49; 8.96} |
| Cu,Zn-SOD (U/mg SOD1+SOD3) | {11.46; 14.58; 23.50} | {7.47; 13.52; 18.25} | {9.51; 17.37; 19.11} |
| Cu,Zn-SOD (% SOD activity) | {29.13; 42.88; 56.25} | {25.49; 33.76; 50.56} | {29.15; 37.86; 56.22} |
| Mn-SOD (U/L) | {1067; 1356; 1650} | {1004; 1251; 1885} | {1060; 1182; 1545} |
| Mn-SOD (U/g total protein) | {9.40; 11.07; 12.43} | {8.12; 9.98; 15.76} | {6.08; 9.60; 10.94} |
| Mn-SOD (U/mg SOD2) | {38.05; 48.09; 65.04} | {30.27; 43.54; 71.55} | {33.91; 41.48; 54.32} |
| TAC (mM UAE) | {0.214; 0.282; 0.321} | {0.266; 0.296; 0.345} | {0.265; 0.331; 0.389} |
| MDA (µmol/L) | {3.82; 5.06; 5.98} | {3.86; 5.13; 6.18} | {3.99; 5.11; 6.33} |
| Cu (µg/L) | {904; 976; 1175} | {853; 1010; 1184} | {988; 1026; 1141} |
| Zn (µg/L) | {821; 854; 928} | {902; 988; 1043} | {874; 981; 1062} |
| Zn/Cu | {0.75; 0.87; 1.09} | {0.84; 0.95; 1.09} | {0.86; 0.91; 1.03} |
| Parameter | C/C Genotype (n = 9) (4 Women. 5 Men) | T/C Genotype (n = 22) (10 Women. 12 Men) | T/T Genotype (n = 13) (6 Women. 7 Men) |
|---|---|---|---|
| SOD1 (ng/mL) | {31.89; 43.10; 50.97} | {27.15; 38.32; 49.45} | {33.01; 39.83; 43.27} |
| SOD1 (ng/mg total protein) | {0.309; 0.356; 0.426} | {0.215; 0.300; 0.437} | {0.274; 0.334; 0.402} |
| SOD2 (ng/mL) | {21.80; 24.82; 32.85} | {18.70; 22.70; 28.03} | {19.69; 23.96; 28.48} |
| SOD2 (ng/mg total protein) | {0.185; 0.208; 0.303} | {0.151; 0.188; 0.237} | {0.151; 0.194; 0.262} |
| SOD3 (ng/m) | {28.16; 31.22; 33.16} | {20.09; 27.35; 31.19} | {26.76; 30.60; 34.42} |
| SOD3 (ng/mg total protein) | {0.239; 0.274; 0.291} | {0.147; 0.202; 0.283} | {0.226; 0.272; 0.288} |
| SOD (U/L) | {1697; 1953; 2351} | {1995; 2128; 2475} | {1993; 2210; 2324} |
| SOD (U/g total protein) | {14.62; 16.99; 20.47} | {16.55; 18.70; 21.25} | {14.98; 17.31; 20.23} |
| SOD (U/mg SODs) | {16.34; 22.95; 24.45} | {19.41; 22.09; 25.99} | {18.60; 21.24; 25.05} |
| Cu,Zn-SOD (U/L) | {656; 763; 804} | {610; 713; 869} | {580; 774; 1010} |
| Cu,Zn-SOD (U/g total protein) | {5.66; 6.54; 7.05} | {5.05; 5.62; 7.61} | {4.79; 6.07; 8.16} |
| Cu,Zn-SOD (U/mg SOD1+SOD3) | {7.76; 10.10; 13.99} | {8.07; 10.86; 14.19} | {7.09; 11.10; 13.68} |
| Cu,Zn-SOD (% SOD activity) | {31.95; 34.31; 38.71} | {28.85; 34.17; 48.34} | {33.94; 39.49; 42.81} |
| Mn-SOD (U/L) | {1134; 1346; 1460} | {1125; 1441; 1603} | {1111; 1431; 1507} |
| Mn-SOD (U/g total protein) | {9.94; 11.24; 13.37} | {9.07; 11.70; 13.87} | {9.27; 11.44; 12.07} |
| Mn-SOD (U/mg SOD2) | {41.91; 52.03; 66.87} | {40.40; 56.72; 84.90} | {39.70; 61.44; 72.68} |
| TAC (mM UAE) | {0.312; 0.391; 0.405} | {0.331; 0.371; 0.412} | {0.378; 0.454; 0.463} |
| MDA (µmol/L) | {5.98; 6.72; 8.26} | {4.63; 6.53; 8.46} | {6.33; 7.65; 10.74} |
| Cu (µg/L) | {900; 1183; 1290} | {1002; 1075; 1126} | {927; 995; 1280} |
| Zn (µg/L) | {881; 952; 1024} | {900; 999; 1039} | {788; 932; 1074} |
| Zn/Cu | {0.72; 0.89; 1.02} | {0.79; 0.94; 1.09} | {0.67; 0.92; 1.05} |
| rs2234694 (SOD1) in the Control Group | |||
| Parameter | A/A Genotype (n = 43) (26 Women, 17 Men) | A/C Genotype (n = 7) (3 Women, 4 Men) | p |
| TChol (mg/dL) | {175; 194; 214} | {184; 194; 278} | 0.2533 |
| TG (mg/dL) | {70; 87; 127} | {60; 92; 152} | 0.9889 |
| HDL-Chol (mg/dL) | {48; 59; 76} | {47; 59; 84} | 0.6443 |
| LDL-Chol (mg/dL) | {99; 117; 130} | {98; 131; 176} | 0.2909 |
| CRP (mg/L) | {0.33; 0.64; 1.10} | {0.19; 0.93; 1.20} | 0.7220 |
| Glucose (mmol/L) | {4.50; 4.78; 4.94} | {4.28; 4.55; 5.28} | 0.7058 |
| Insulin (mU/L) | {4.90; 7.25; 9.00} | {4.70; 5.80; 10.00} | 0.6046 |
| HOMA-IR | {1.02; 1.50; 1.94} | {0.91; 1.09; 2.25} | 0.6243 |
| rs2234694 (SOD1) in the Obese Group | |||
| Parameter | A/A Genotype (n = 36) (15 Women, 21 Men) | A/C genotype (n = 8) (5 Men, 3 Women) | p |
| TChol (mg/dL) | {168; 205; 228} | {166; 200; 227} | 0.8540 |
| TG (mg/dL) | {84; 118; 181} | {120; 141; 162} | 0.4158 |
| HDL-Chol (mg/dL) | {43; 53; 64} | {42; 57; 60} | 0.9413 |
| LDL-Chol (mg/dL) | {98; 115; 155} | {96; 125; 142} | 0.8829 |
| CRP (mg/L) | {1.03; 1.38; 3.06} | {1.11; 2.84; 4.54} | 0.6082 |
| Glucose (mmol/L) | {4.94; 5.20; 5.61} | {4.67; 4.92; 5.28} | 0.2502 |
| ** Insulin (mU/L) | {10.00; 14.60; 19.30} | {7.80; 8.40; 9.90} | 0.0214 |
| ** HOMA-IR | {2.25; 3.21; 4.91} | {1.62; 1.75; 1.85} | 0.0218 |
| rs4880 (SOD2) in the Control Group | |||
| Parameter | C/C or C/T Genotype (n = 39) (24 Women, 15 Men) | T/T genotype (n = 11) (5 Women, 6 Men) | p |
| TChol (mg/dL) | {179; 197; 215} | {178; 190; 242} | 0.8041 |
| TG (mg/dL) | {67; 86; 115} | {75; 102; 145} | 0.3249 |
| HDL-Chol (mg/dL) | {48; 59; 76} | {46; 62; 77} | 0.6449 |
| LDL-Chol (mg/dL) | {98; 117; 133} | {99; 118; 155} | 0.9906 |
| CRP (mg/L) | {0.20; 0.64; 1.05} | {0.41; 0.89; 1.79} | 0.2008 |
| ** Glucose (mmol/L) | {4.50; 4.64; 4.89} | {4.72; 4.94; 5.17} | 0.0326 |
| ** Insulin (mU/L) | {4.70; 6.60; 8.20} | {6.50; 10.00; 15.20} | 0.0369 |
| ** HOMA-IR | {0.97; 1.35; 1.84} | {1.28; 2.25; 3.56} | 0.0306 |
Appendix B


References
- Chen, L.; Magliano, D.J.; Zimmet, P.Z. The worldwide epidemiology of type 2 diabetes mellitus—Present and future perspectives. Nat. Rev. Endocrinol. 2012, 8, 228–236. [Google Scholar] [CrossRef] [PubMed]
- Rabe, K.; Lehrke, M.; Parhofer, K.G.; Broedl, U.C. Adipokines and insulin resistance. Mol. Med. 2008, 14, 741–751. [Google Scholar] [CrossRef] [PubMed]
- Fantuzzi, G. Adipose tissue, adipokines, and inflammation. J. Allergy Clin. Immunol. 2005, 115, 911–919. [Google Scholar] [CrossRef] [PubMed]
- Kwon, H.; Pessin, J.E. Adipokines mediate inflammation and insulin resistance. Front. Endocrinol. 2013, 4, 71. [Google Scholar] [CrossRef] [Green Version]
- Massiéra, F.; Bloch-Faure, M.; Ceiler, D.; Murakami, K.; Fukamizu, A.; Gasc, J.M.; Quignard-Boulange, A.; Negrel, R.; Ailhaud, G.; Seydoux, J.; et al. Adipose angiotensinogen is involved in adipose tissue growth and blood pressure regulation. FASEB J. Off. Publ. Fed. Am. Soc. Exp. Biol. 2001, 15, 2727–2729. [Google Scholar] [CrossRef]
- Góralska, M.; Majewska-Szczepanik, M.; Szczepanik, M. Mechanizmy immunologiczne towarzyszące otyłości i ich rola w zaburzeniach metabolizmu. Postępy Hig. I Med. Doświadczalnej 2015, 69, 1384–1404. [Google Scholar]
- Tangvarasittichai, S. Oxidative stress, insulin resistance, dyslipidemia and type 2 diabetes mellitus. World J. Diabetes 2015, 6, 456. [Google Scholar] [CrossRef]
- Rains, J.L.; Jain, S.K. Oxidative stress, insulin signaling, and diabetes. Free Radic. Biol. Med. 2011, 50, 567–575. [Google Scholar] [CrossRef] [Green Version]
- Meigs, J.B.; Larson, M.G.; Fox, C.S.; Keaney, J.F.; Vasan, R.S.; Benjamin, E.J. Association of oxidative stress, insulin resistance, and diabetes risk phenotypes: The Framingham Offspring Study. Diabetes Care 2007, 30, 2529–2535. [Google Scholar] [CrossRef] [Green Version]
- Rosca, M.G.; Mustata, T.G.; Kinter, M.T.; Ozdemir, A.M.; Kern, T.S.; Szweda, L.I.; Brownlee, M.; Monnier, V.M.; Weiss, M.F. Glycation of mitochondrial proteins from diabetic rat kidney is associated with excess superoxide formation. Am. J. Physiol. Ren. Physiol. 2005, 289. [Google Scholar] [CrossRef] [Green Version]
- Hipkiss, A.R. Mitochondrial dysfunction, proteotoxicity, and aging: Causes or effects, and the possible impact of NAD+-controlled protein glycation. Adv. Clin. Chem. 2010, 50, 123–150. [Google Scholar] [CrossRef]
- Rivera-Nieves, J.; Thompson, W.C.; Levine, R.L.; Moss, J. Thiols mediate superoxide-dependent NADH modification of glyceraldehyde-3-phosphate dehydrogenase. J. Biol. Chem. 1999, 274, 19525–19531. [Google Scholar] [CrossRef] [Green Version]
- McClain, D.A.; Crook, E.D. Hexosamines and insulin resistance. Diabetes 1996, 45, 1003–1009. [Google Scholar] [CrossRef] [PubMed]
- Chung, S.S.M.; Ho, E.C.M.; Lam, K.S.L.; Chung, S.K. Contribution of polyol pathway to diabetes-induced oxidative stress. J. Am. Soc. Nephrol. 2003, 14, S233–S236. [Google Scholar] [CrossRef] [PubMed] [Green Version]
- Ravichandran, L.V.; Esposito, D.L.; Chen, J.; Quon, M.J. Protein kinase C-ζ phosphorylates insulin receptor substrate-1 and impairs its ability to activate phosphatidylinositol 3-kinase in response to insulin. J. Biol. Chem. 2001, 276, 3543–3549. [Google Scholar] [CrossRef] [PubMed] [Green Version]
- Ishizuka, T.; Kajita, K.; Natsume, Y.; Kawai, Y.; Kanoh, Y.; Miura, A.; Ishizawa, M.; Uno, Y.; Morita, H.; Yasuda, K. Protein kinase C (PKC) β modulates serine phosphorylation of insulin receptor substrate-1 (IRS-1)—effect of overexpression of PKCβ on insulin signal transduction. Endocr. Res. 2004, 30, 287–299. [Google Scholar] [CrossRef]
- Chen, S.; Cohen, M.P.; Lautenslager, G.T.; Shearman, C.W.; Ziyadeh, F.N. Glycated albumin stimulates TGF-β1 production and protein kinase C activity in glomerular endothelial cells. Kidney Int. 2001, 59, 673–681. [Google Scholar] [CrossRef] [Green Version]
- Garg, V.K.; Gupta, R.; Goyal, R.K. Hypozincemia in diabetes mellitus. J. Assoc. Physicians India 1994, 42, 720–721. [Google Scholar]
- Chausmer, A.B. Zinc, insulin and diabetes. J. Am. Coll. Nutr. 1998, 17, 109–115. [Google Scholar] [CrossRef]
- Abdel-Wahab, Y.H.A.; O’Harte, F.P.M.; Barnett, C.R.; Flatt, P.R. Characterization of insulin glycation in insulin-secreting cells maintained in tissue culture. J. Endocrinol. 1997, 152, 59–67. [Google Scholar] [CrossRef]
- Myers, M.G.; Leibel, R.L.; Seeley, R.J.; Schwartz, M.W. Obesity and leptin resistance: Distinguishing cause from effect. Trends Endocrinol. Metab. 2010, 21, 643–651. [Google Scholar] [CrossRef] [Green Version]
- Zhou, Y.; Rui, L. Leptin signaling and leptin resistance. Front. Med. 2013, 7, 207–222. [Google Scholar] [CrossRef] [PubMed]
- Banks, W.A.; Coon, A.B.; Robinson, S.M.; Moinuddin, A.; Shultz, J.M.; Nakaoke, R.; Morley, J.E. Triglycerides Induce Leptin Resistance at the Blood-Brain Barrier. Diabetes 2004, 53, 1253–1260. [Google Scholar] [CrossRef] [PubMed] [Green Version]
- Beck, B. Neuropeptides and obesity. Nutrition 2000, 16, 916–923. [Google Scholar] [CrossRef]
- Perry, J.J.P.; Shin, D.S.; Getzoff, E.D.; Tainer, J.A. The structural biochemistry of the superoxide dismutases. Biochim. Biophys. Acta Proteins Proteom. 2010, 1804, 245–262. [Google Scholar] [CrossRef] [PubMed] [Green Version]
- Lewandowski, Ł.; Kepinska, M.; Milnerowicz, H. Inhibition of copper-zinc superoxide dismutase activity by selected environmental xenobiotics. Environ. Toxicol. Pharmacol. 2018, 58, 105–113. [Google Scholar] [CrossRef]
- Marklund, S. Superoxide dismutase in human tissues, cells and extracellular fluid: Clinical implications. In Clinical Implications, Free Radical, Aging, and Degenerative Diseases; Johnson, J.J., Walford, R., Harman, D., Miquel, J., Eds.; Alan R. Liss, Inc.: New York, NY, USA, 1986; pp. 509–526. [Google Scholar]
- Marklund, S.L. Extracellular superoxide dismutase and other superoxide dismutase isoenzymes in tissues from nine mammalian species. Biochem. J. 1984, 222, 649–655. [Google Scholar] [CrossRef] [Green Version]
- Marklund, S.L.; Holme, E.; Hellner, L. Superoxide dismutase in extracellular fluids. Clin. Chim. Acta 1982, 126, 41–51. [Google Scholar] [CrossRef]
- Lewandowski, Ł.; Kepinska, M.; Milnerowicz, H. The copper-zinc superoxide dismutase activity in selected diseases. Eur. J. Clin. Investig. 2019, 49, e13036. [Google Scholar] [CrossRef] [Green Version]
- Stancill, J.S.; Happ, J.T.; Broniowska, K.A.; Hogg, N.; Corbett, J.A. Peroxiredoxin 1 plays a primary role in protecting pancreatic β-cells from hydrogen peroxide and peroxynitrite. Am. J. Physiol. Regul. Integr. Comp. Physiol. 2020, 318, R1004–R1013. [Google Scholar] [CrossRef]
- Echtay, K.S.; Roussel, D.; Jekabsons, M.B.; Stuart, J.A. Superoxide activates mitochondrial uncoupling proteins. Nature 2002, 415, 96–99. [Google Scholar] [CrossRef]
- Echtay, K.S.; Murphy, M.P.; Smith, R.A.J.; Talbot, D.A.; Brand, M.D. Superoxide activates mitochondrial uncoupling protein 2 from the matrix side. Studies using targeted antioxidants. J. Biol. Chem. 2002, 277, 47129–47135. [Google Scholar] [CrossRef] [PubMed] [Green Version]
- Krauss, S.; Zhang, C.-Y.; Scorrano, L.; Dalgaard, L.T.; St-Pierre, J.; Grey, S.T.; Lowell, B.B. Superoxide-mediated activation of uncoupling protein 2 causes pancreatic β cell dysfunction. J. Clin. Investig. 2003, 112, 1831–1842. [Google Scholar] [CrossRef] [PubMed]
- Kubisch, H.M.; Wang, J.; Bray, T.M.; Phillips, J.P. Targeted overexpression of Cu/Zn superoxide dismutase protects pancreatic β-cells against oxidative stress. Diabetes 1997, 46, 1563–1566. [Google Scholar] [CrossRef]
- Robbins, M.J.; Sharp, R.A.; Slonim, A.E.; Burr, I.M. Protection against streptozotocin-induced diabetes by superoxide dismutase. Diabetologia 1980, 18, 55–58. [Google Scholar] [CrossRef] [PubMed] [Green Version]
- Gandy, S.E.; Buse, M.G.; Crouch, R.K. Protective role of superoxide dismutase against diabetogenic drugs. J. Clin. Investig. 1982, 70, 650–658. [Google Scholar] [CrossRef] [Green Version]
- Asplund, K.; Grankvist, K.; Marklund, S.; Taljedal, I.B. Partial protection against streptozotocin-induced hyperglycaemia by superoxide dismutase linked to polyethylene glycol. Acta Endocrinol. 1984, 107, 390–394. [Google Scholar] [CrossRef] [PubMed]
- Kaneto, H.; Fujitani, Y.; Matsuzawa, Y. Beneficial effects of antioxidants in diabetes: Possible protection of pancreatic Beta-cells against glucose toxicity. Diabetes 1999, 48, 2398–2406. [Google Scholar] [CrossRef]
- Flekac, M.; Skrha, J.; Hilgertova, J.; Lacinova, Z.; Jarolimkova, M. Gene polymorphisms of superoxide dismutases and catalase in diabetes mellitus. BMC Med. Genet. 2008, 9, 30. [Google Scholar] [CrossRef] [Green Version]
- Olsen, D.A.; Petersen, S.V.; Oury, T.D.; Valnickova, Z.; Thøgersen, I.B.; Kristensen, T.; Bowler, R.P.; Crapo, J.D.; Enghild, J.J. The intracellular proteolytic processing of extracellular superoxide dismutase (EC-SOD) is a two-step event. J. Biol. Chem. 2004, 279, 22152–22157. [Google Scholar] [CrossRef] [Green Version]
- Sandström, J.; Nilsson, P.; Karlsson, K.; Marklund, S. 10-fold increase in human plasma extracellular superoxide dismutase content caused by a mutation in heparin-binding domain. J. Biol. Chem. 1994, 269, 19163–19166. [Google Scholar]
- Yamada, H. Polymorphism of extracellular superoxide dismutase (EC-SOD) gene: Relation to the mutation responsible for high EC-SOD level in serum. Jpn. J. Hum. Genet. 1997, 42, 353–356. [Google Scholar] [CrossRef] [PubMed]
- Dong, X.; Li, D.J.; Liu, H.; Zhao, Y.Y. SOD3 and eNOS genotypes are associated with SOD activity and NOx. Exp. Ther. Med. 2014, 8, 328–334. [Google Scholar] [CrossRef] [PubMed] [Green Version]
- Sutton, A.; Khoury, H.; Prip-Buus, C.; Cepanec, C.; Pessayre, D.; Francoise, D. The Ala16Val genetic dimorphism modulates the import of human manganese superoxide dismutase into rat liver mitochondria. Pharm. Genom. 2003, 13, 145–157. [Google Scholar]
- Becer, E.; Çırakoğlu, A. Association of the Ala16Val MnSOD gene polymorphism with plasma leptin levels and oxidative stress biomarkers in obese patients. Gene 2015, 568, 35–39. [Google Scholar] [CrossRef]
- Montano, M.A.E.; Barrio Lera, J.P.; Gottlieb, M.G.V.; Schwanke, C.H.A.; Rocha, M.I.U.M.; Manica-Cattani, M.F.; Santos, G.F.; Cruz, I.B.M. Association between manganese superoxide dismutase (MnSOD) gene polymorphism and elderly obesity. Mol. Cell. Biochem. 2009, 328, 33–40. [Google Scholar] [CrossRef]
- Junqueira, V.B.C.; Barros, S.B.M.; Chan, S.S.; Rodrigues, L.; Giavarotti, L.; Abud, R.L.; Deucher, G.P. Aging and oxidative stress. Mol. Asp. Med. 2004, 25, 5–16. [Google Scholar] [CrossRef]
- Kumar Maurya, P.; Kumar, P.; Siddiqui, N.; Tripathi, P.; Rizvi, S.I. Age-associated changes in erythrocyte glutathione peroxidase activity: Correlation with total antioxidant potential. Indian J. Biochem. Biophys. 2010, 47, 319–321. [Google Scholar]
- Rizvi, S.I.; Maurya, P.K. Alterations in antioxidant enzymes during aging in humans. Mol. Biotechnol. 2007, 37, 58–61. [Google Scholar] [CrossRef]
- Mendoza-Núñez, V.M.; Ruiz-Ramos, M.; Sánchez-Rodríguez, M.A.; Retana-Ugalde, R.; Muñoz-Sánchez, J.L. Aging-related oxidative stress in healthy humans. Tohoku J. Exp. Med. 2007, 213, 261–268. [Google Scholar] [CrossRef] [Green Version]
- Di Massimo, C.; Scarpelli, P.; Di Lorenzo, N.; Caimi, G.; Di Orio, F.; Ciancarelli, M.G.T. Impaired plasma nitric oxide availability and extracellular superoxide dismutase activity in healthy humans with advancing age. Life Sci. 2006, 78, 1163–1167. [Google Scholar] [CrossRef]
- Paik, H.Y.; Joung, H.; Lee, J.Y.; Lee, H.K.; King, J.C.; Keen, C.L. Serum extracellular superoxide dismutase activity as an indicator of zinc status in humans. Biol. Trace Elem. Res. 1999, 69, 45–57. [Google Scholar] [CrossRef] [PubMed]
- Demirbag, R.; Yilmaz, R.; Erel, O. The association of total antioxidant capacity with sex hormones. Scand. Cardiovasc. J. 2005, 39, 172–176. [Google Scholar] [CrossRef]
- Zhang, H.Q.; Li, N.; Zhang, Z.; Gao, S.; Yin, H.Y.; Guo, D.M.; Gao, X. Serum zinc, copper, and zinc/copper in healthy residents of Jinan. Biol. Trace Elem. Res. 2009, 131, 25–32. [Google Scholar] [CrossRef] [PubMed]
- Helgeland, K.; Haider, T.; Jonsen, J. Copper and zinc in human serum in Norway: Relationship to geography, sex and age. Scand. J. Clin. Lab. Investig. 1982, 42, 35–39. [Google Scholar] [CrossRef]
- Olsson, I.M.; Bensryd, I.; Lundh, T.; Ottosson, H.; Skerfving, S.; Oskarsson, A. Cadmium in blood and Urine—Impact of sex, age, dietary intake, iron status, and former smoking—Association of renal effects. Environ. Health Perspect. 2002, 110, 1185–1190. [Google Scholar] [CrossRef]
- Sánchez, C.; López-Jurado, M.; Aranda, P.; Llopis, J. Plasma levels of copper, manganese and selenium in an adult population in southern Spain: Influence of age, obesity and lifestyle factors. Sci. Total Environ. 2010, 408, 1014–1020. [Google Scholar] [CrossRef] [PubMed]
- Kim, Y.; Lee, B.K. Associations of blood lead, cadmium, and mercury with estimated glomerular filtration rate in the Korean general population: Analysis of 2008–2010 Korean National Health and Nutrition Examination Survey data. Environ. Res. 2012, 118, 124–129. [Google Scholar] [CrossRef] [PubMed]
- Berglund, M.; Lindberg, A.L.; Rahman, M.; Yunus, M.; Grandér, M.; Lönnerdal, B.; Vahter, M. Gender and age differences in mixed metal exposure and urinary excretion. Environ. Res. 2011, 111, 1271–1279. [Google Scholar] [CrossRef]
- Ruiz, P.; Mumtaz, M.; Osterloh, J.; Fisher, J.; Fowler, B.A. Interpreting NHANES biomonitoring data, cadmium. Toxicol. Lett. 2010, 198, 44–48. [Google Scholar] [CrossRef]
- Ustundag, B.; Gungor, S.; Aygün, A.D.; Turgut, M.; Yilmaz, E. Oxidative status and serum leptin levels in obese prepubertal children. Cell Biochem. Funct. 2007, 25, 479–483. [Google Scholar] [CrossRef]
- Torkanlou, K.; Bibak, B.; Abbaspour, A.; Abdi, H.; Saleh Moghaddam, M.; Tayefi, M.; Mohammadzadeh, E.; Safarian Bana, H.; Aghasizade, M.; Ferns, G.A.; et al. Reduced serum levels of zinc and superoxide dismutase in obese individuals. Ann. Nutr. Metab. 2016, 69, 232–236. [Google Scholar] [CrossRef] [PubMed]
- Pandey, G.; Shihabudeen, M.S.; David, H.P.; Thirumurugan, E.; Thirumurugan, K. Association between hyperleptinemia and oxidative stress in obese diabetic subjects. J. Diabetes Metab. Disord. 2015, 14, 1–6. [Google Scholar] [CrossRef] [Green Version]
- Stefanović, A.; Kotur-Stevuljević, J.; Spasić, S.; Bogavac-Stanojević, N.; Bujisić, N. The influence of obesity on the oxidative stress status and the concentration of leptin in type 2 diabetes mellitus patients. Diabetes Res. Clin. Pract. 2008, 79, 156–163. [Google Scholar] [CrossRef] [PubMed]
- Ferro, F.E.D.; De Sousa Lima, V.B.; Soares, N.R.M.; De Sousa Almondes, K.G.; Pires, L.V.; Cozzolino, S.M.F.; Do Nascimento Marreiro, D. Parameters of metabolic syndrome and its relationship with zincemia and activities of superoxide dismutase and glutathione peroxidase in obese women. Biol. Trace Elem. Res. 2011, 143, 787–793. [Google Scholar] [CrossRef] [PubMed]
- Erdeve, O.; Siklar, Z.; Kocaturk, P.A.; Dallar, Y.; Kavas, G.O. Antioxidant superoxide dismutase activity in obese children. Biol. Trace Elem. Res. 2004, 98, 219–227. [Google Scholar] [CrossRef]
- Arsulesei, V.; Bulughiana, S.; Stoica, B.; Anisie, E. Circulating chemerin, oxidative stress, inflammation and insulin resistance in morbid obesity. Rev. Chim. 2017, 68, 1014–1018. [Google Scholar] [CrossRef]
- Amirkhizi, F.; Siassi, F.; Djalali, M.; Shahraki, S. Impaired enzymatic antioxidant defense in erythrocytes of women with general and abdominal obesity. Obes. Res. Clin. Pract. 2014, 8, e26–e34. [Google Scholar] [CrossRef]
- Karaouzene, N.; Merzouk, H.; Aribi, M.; Merzouk, S.A.; Yahia Berrouiguet, A.; Tessier, C.; Narce, M. Effects of the association of aging and obesity on lipids, lipoproteins and oxidative stress biomarkers: A comparison of older with young men. Nutr. Metab. Cardiovasc. Dis. 2011, 21, 792–799. [Google Scholar] [CrossRef]
- Huang, Y.; Shih, C.; Huang, C.; Lin, C. Effects of cadmium on structure and enzymatic activity of Cu, Zn-SOD and oxidative status in neural cells. J. Cell. Biochem. 2006, 98, 577–589. [Google Scholar] [CrossRef]
- Bartosz, G. Non-enzymatic antioxidant capacity assays: Limitations of use in biomedicine. Free Radic. Res. 2010, 44, 711–720. [Google Scholar] [CrossRef]
- Sies, H. Total antioxidant capacity: Appraisal of a concept. J. Nutr. 2007, 137, 1493–1495. [Google Scholar] [CrossRef] [PubMed]
- Fraga, C.G.; Oteiza, P.I.; Galleano, M. In vitro measurements and interpretation of total antioxidant capacity. Biochim. Biophys. Acta Gen. Subj. 2014, 1840, 931–934. [Google Scholar] [CrossRef]
- Caraballo, R.; Giovino, G.; Pechacek, T. Self-reported cigarette smoking vs. serum cotinine among U.S. adolescents. Nicotine Tob. Res. 2004, 6, 19–25. [Google Scholar] [CrossRef]
- Wagenknecht, L.E.; Burke, G.L.; Perkins, L.L.; Haley, N.J.; Friedman, G.D. Misclassification of smoking status in the CARDIA study: A comparison of self-report with serum cotinine levels. Am. J. Public Health 1992, 82, 33–36. [Google Scholar] [CrossRef] [PubMed] [Green Version]
- Kim, S. Overview of cotinine cutoff values for smoking status classification. Int. J. Environ. Res. Public Health 2016, 13, 1236. [Google Scholar] [CrossRef] [PubMed]
- Scanu, A.M. Lipoprotein(a), friedewald formula, and NCEP guidelines. Am. J. Cardiol. 2001, 87, 608–609. [Google Scholar] [CrossRef]
- Okado-Matsumoto, A.; Fridovich, I. Assay of superoxide dismutase: Cautions relevant to the use of cytochrome c, a sulfonated tetrazolium, and cyanide. Anal. Biochem. 2001, 298, 337–342. [Google Scholar] [CrossRef]
- Iqbal, J.; Whitney, P. Use of cyanide and diethyldithiocarbamate in the assay on superoxide dismutases. Free Radic. Biol. Med. 1991, 10, 69–77. [Google Scholar] [CrossRef]
- Mejbaum-Katzenellenbogen, W.; Mochnacka, I. Metody oznaczania białek i aminokwasów. In Kurs Praktyczny z Biochemii; Państwowe Wydawnictwo Naukowe: Warszawa, Poland, 1966. [Google Scholar]
| Parameter | Women (n = 33) | Men (n = 35) | p |
|---|---|---|---|
| ** SOD1 (ng/mL) | {18.14; 23.43; 33.01} | {35.28; 43.27; 51.97} | <0.000001 |
| ** SOD1 (ng/mg total protein) | {0.135; 0.187; 0.271} | {0.270; 0.348; 0.442} | <0.000001 |
| SOD2 (ng/mL) | {21.80; 23.61; 32.70} | {20.19; 26.04; 32.85} | 0.9251 |
| SOD2 (ng/mg total protein) | {0.168; 0.203; 0.262} | {0.152; 0.217; 0.298} | 0.9052 |
| ** SOD3 (ng/mL) | {27.71; 31.69; 37.88} | {23.24; 27.85; 32.01} | 0.0214 |
| SOD3 (ng/mg total protein) | {0.195; 0.270; 0.322} | {0.183; 0.239; 0.277} | 0.0643 |
| SOD (U/L) | {1700; 1971; 2359} | {1749; 2301; 2522} | 0.2412 |
| SOD (U/g total protein) | {13.20; 16.54; 20.24} | {12.64; 18.89; 21.29} | 0.3026 |
| SOD (U/mg SODs) | {18.60; 23.30; 28.20} | {18.03; 22.81; 25.90} | 0.3374 |
| Cu,Zn-SOD (U/L) | {514; 771; 1106} | {573; 854; 1184} | 0.5977 |
| Cu,Zn-SOD (U/g total protein) | {4.23; 6.07; 8.64} | {4.35; 6.71; 10.23} | 0.5234 |
| Cu,Zn-SOD (U/mg SOD1+SOD3) | {8.91; 14.29; 19.03} | {7.76; 12.27; 15.86} | 0.2030 |
| Cu,Zn-SOD (% SOD activity) | {28.60; 40.32; 55.59} | {32.40; 37.89; 49.68} | 0.5476 |
| Mn-SOD (U/L) | {979; 1226; 1516} | {1098; 1240; 1582} | 0.5194 |
| Mn-SOD (U/g total protein) | {6.86; 9.99; 12.33} | {8.60; 10.30; 12.53} | 0.5314 |
| Mn-SOD (U/mg SOD2) | {33.27; 44.54; 69.62} | {37.76; 50.76; 66.51} | 0.5265 |
| ** TAC (mM UAE) | {0.219; 0.268; 0.308} | {0.345; 0.382; 0.408} | <0.000001 |
| ** MDA (µmol/L) | {3.36; 4.43; 6.60} | {5.29; 6.22; 7.30} | 0.0085 |
| ** Cu (µg/L) | {976; 1108; 1303} | {912; 972; 1059} | 0.0144 |
| ** Zn (µg/L) | {845; 895; 932} | {961; 1034; 1116} | <0.00001 |
| ** Zn/Cu | {0.74; 0.87; 0.91} | {0.94; 1.03; 1.18} | <0.00001 |
| ** Cd (mg/g Hb) | {1.68; 2.46; 3.56} | {1.12; 1.62; 2.63} | 0.0125 |
| Parameter | Control Group (n = 24) | Obese Group (n = 9) | p |
|---|---|---|---|
| SOD1 (ng/mL) | 23.45 ± 10.52 | 27.54 ± 7.94 | 0.3002 |
| SOD1 (ng/mg total protein) | 0.184 ± 0.083 | 0.236 ± 0.059 | 0.0982 |
| SOD2 (ng/mL) | {21.16; 23.21; 31.84} | {22.63; 25.35; 32.70} | 0.4141 |
| SOD2 (ng/mg total protein) | 0.203 ± 0.058 | 0.251 ± 0.080 | 0.0691 |
| SOD3 (ng/mL) | 31.25 ± 8.92 | 31.78 ± 4.75 | 0.8747 |
| SOD3 (ng/mg total protein) | 0.247 ± 0.076C | 0.302 ± 0.054 | 0.0903 |
| SOD (U/L) | 2091 ± 677 | 2018 ± 267 | 0.6667 |
| SOD (U/g total protein) | 16.17 ± 5.91 | 16.62 ± 3.29 | 0.8308 |
| SOD (U/mg SODs) | 25.52 ± 9.57 | 21.03 ± 4.74 | 0.1923 |
| Cu,Zn-SOD (U/L) | 896 ± 516 | 720 ± 160 | 0.1585 |
| Cu,Zn-SOD (U/g total protein) | 6.43 ± 3.80 | 6.38 ± 0.91 | 0.9566 |
| Cu,Zn-SOD (U/mg SOD1+SOD3) | 15.44 ± 7.99 | 11.54 ± 4.10 | 0.0814 |
| Cu,Zn-SOD (% SOD activity) | 43.36 ± 20.30 | 36.91 ± 8.22 | 0.2033 |
| Mn-SOD (U/L) | 1243 ± 558 | 1201 ± 261 | 0.8311 |
| Mn-SOD (U/g total protein) | 9.85 ± 4.58 | 10.58 ± 2.88 | 0.6625 |
| Mn-SOD (U/mg SOD2) | 51.04 ± 28.29 | 46.48 ± 19.86 | 0.6614 |
| * TAC (mM UAE) | 0.252 ± 0.047 | 0.353 ± 0.087 | 0.0222 |
| * MDA (µmol/L) | 4.01 ± 1.62 | 7.33 ± 1.92 | <0.0001 |
| * Cu (µg/L) | 1032 ± 174 | 1229 ± 91 | 0.0087 |
| Zn (µg/L) | 904 ± 78 | 879 ± 130 | 0.5005 |
| * Zn/Cu | 0.893 ± 0.106 | 0.758 ± 0.150 | 0.0140 |
| * Cd (mg/g Hb) | 2.19 ± 0.92 | 3.29 ± 1.48 | 0.0250 |
| Parameter | Control Group (n = 17) | Obese Group (n = 18) | p |
|---|---|---|---|
| SOD1 (ng/mL) | 38.65 ± 11.21 | 47.49 ± 13.76 | 0.0575 |
| SOD1 (ng/mg total protein) | 0.328 ± 0.133 | 0.393 ± 0.106 | 0.1275 |
| SOD2 (ng/mL) | {24.71; 29.83; 34.94} | {17.84; 22.22; 29.67} | 0.0697 |
| SOD2 (ng/mg total protein) | {0.183; 0.250; 0.298} | {0.147; 0.187; 0.273} | 0.2968 |
| SOD3 (ng/mL) | 27.09 ± 8.04 | 27.46 ± 6.37 | 0.8857 |
| SOD3 (ng/mg total protein) | 0.222 ± 0.083 | 0.240 ± 0.072 | 0.4982 |
| SOD (U/L) | 2157 ± 611 | 2262 ± 330 | 0.5392 |
| SOD (U/g total protein) | 17.42 ± 6.13 | 19.07 ± 3.90 | 0.3559 |
| SOD (U/mg SODs) | 22.84 ± 7.39 | 21.51 ± 5.81 | 0.5601 |
| Cu,Zn-SOD (U/L) | {530; 1050; 1301} | {580; 795; 1071} | 0.4827 |
| Cu,Zn-SOD (U/g total protein) | {4.35; 8.98; 10.77} | {4.79; 6.31; 9.40} | 0.5904 |
| Cu,Zn-SOD (U/mg SOD1+SOD3) | 13.80 ± 5.15 | 10.58 ± 4.68 | 0.0648 |
| Cu,Zn-SOD (% SOD activity) | 41.04 ± 12.11 | 36.97 ± 11.61 | 0.3181 |
| * Mn-SOD (U/L) | 1105 ± 979 | 1377 ± 296 | 0.0015 |
| * Mn-SOD (U/g total protein) | 8.90 ± 1.88 | 11.97 ± 2.55 | 0.0006 |
| * Mn-SOD (U/mg SOD2) | 44.43 ± 14.80 | 59.76 ± 19.18 | 0.0145 |
| TAC (mM UAE) | 0.364 ± 0.043 | 0.396 ± 0.053 | 0.0581 |
| MDA (µmol/L) | 6.04 ± 1.08 | 7.01 ± 3.18 | 0.2350 |
| Cu (µg/L) | 993 ± 168 | 983 ± 94 | 0.8293 |
| Zn (µg/L) | 1038 ± 132 | 1022 ± 90 | 0.6960 |
| Zn/Cu | 1.03 ± 0.17 | 1.06 ± 0.17 | 0.5876 |
| Cd (mg/g Hb) | 1.66 ± 0.97 | 2.04 ± 1.14 | 0.3178 |
| Parameter | Non-Exposed (n = 41) (24 Women, 17 Men) | Exposed (n = 9) (5 Women, 4 Men) | p |
|---|---|---|---|
| SOD1 (ng/mL) | {18.86; 28.56; 37.42} | {22.52; 30.24; 42.25} | 0.7706 |
| SOD1 (ng/mg total protein) | {0.160; 0.211; 0.296} | {0.212; 0.242; 0.379} | 0.2788 |
| SOD2 (ng/mL) | {21.73; 25.93; 33.21} | {21.97; 28.30; 36.70} | 0.7589 |
| SOD2 (ng/mg total protein) | {0.169; 0.210; 0.268} | {0.168; 0.224; 0.289} | 0.6714 |
| SOD3 (ng/mL) | {25.51; 29.57; 36.60} | {13.42; 20.66; 38.77} | 0.1879 |
| SOD3 (ng/mg total protein) | {0.179; 0.243; 0.294} | {0.103; 0.159; 0.286} | 0.1779 |
| SOD (U/L) | {1569; 2290; 2522} | 2087; 2603; 2803} | 0.0910 |
| SOD (U/g total protein) | {12.15; 17.38; 20.71} | {15.61; 20.52; 22.62} | 0.1926 |
| SOD (U/mg SODs) | {18.80; 24.32; 30.46} | {17.84; 22.57; 32.37} | 0.9650 |
| Cu,Zn-SOD (U/L) | {495; 854; 1264} | {607; 847; 948} | 0.6911 |
| Cu,Zn-SOD (U/g total protein) | {4.05; 6.90; 10.29} | {4.77; 6.26; 8.42} | 0.6193 |
| Cu,Zn-SOD (U/mg SOD1+SOD3) | {9.21; 15.27; 19.07} | {7.95; 14.90; 20.60} | 0.9185 |
| Cu,Zn-SOD (% SOD activity) | {29.80; 45.53; 55.59} | {24.57; 30.42; 33.13} | 0.0592 |
| ** Mn-SOD (U/L) | {1004; 1199; 1591} | {1326; 1555; 2014} | 0.0146 |
| ** Mn-SOD (U/g total protein) | {6.92; 9.97; 11.66} | {11.05; 11.63; 15.76} | 0.0419 |
| Mn-SOD (U/mg SOD2) | {34.94; 42.81; 65.51} | {33.32; 59.06; 65.93} | 0.6929 |
| TAC (mM UAE) | {0.249; 0.295; 0.354} | {0.287; 0.304; 0.347} | 0.5321 |
| MDA (µmol/L) | {3.86; 5.02; 6.18} | {4.40; 5.19; 5.23} | 0.9683 |
| Cu (µg/L) | 1014 ± 170 | 1075 ± 90 | 0.3597 |
| Zn (µg/L) | 951 ± 111 | 979 ± 103 | 0.5348 |
| Zn/Cu | 0.95 ± 0.14 | 0.95 ± 0.21 | 0.9811 |
| ** Cd (mg/g Hb) | {1.09; 1.93; 2.58} | {5.32; 6.30; 12.12} | <0.0001 |
| Parameter | Non-Exposed (n = 27) (9 Women, 18 Men) | Exposed (n = 17) (11 Women, 6 Men) | p |
|---|---|---|---|
| SOD1 (ng/mL) | {30.44; 37.10; 49.28} | {27.20; 39.83; 45.23} | 0.5469 |
| SOD1 (ng/mg total protein) | {0.267; 0.328; 0.426} | {0.206; 0.287; 0.393} | 0.4778 |
| SOD2 (ng/mL) | {19.69; 23.26; 32.70} | {20.27; 24.52; 26.62} | 0.6636 |
| SOD2 (ng/mg total protein) | {0.151; 0.207; 0.279} | {0.157; 0.191; 0.228} | 0.4478 |
| SOD3 (ng/mL) | {25.64; 30.02; 33.84} | {17.34; 27.96; 31.34} | 0.1649 |
| SOD3 (ng/mg total protein) | {0.202; 0.272; 0.296} | {0.142; 0.243; 0.277} | 0.0853 |
| SOD (U/L) | {1971; 2187; 2398} | {1723; 2223; 2477} | 1.000 |
| SOD (U/g total protein) | {15.31; 17.55; 20.78} | {13.75; 18.50; 20.47} | 0.8763 |
| SOD (U/mg SODs) | {17.95; 21.24; 25.63} | {20.11; 22.95; 25.73} | 0.3488 |
| Cu,Zn-SOD (U/L) | {580; 771; 1068} | {652; 756; 852} | 0.6540 |
| Cu,Zn-SOD (U/g total protein) | {5.04; 6.06; 8.90} | {5.06; 5.79; 6.62} | 0.4380 |
| Cu,Zn-SOD (U/mg SOD1+SOD3) | {7.21; 9.62; 14.29} | {8.92; 10.54; 13.68} | 0.8763 |
| Cu,Zn-SOD (% SOD activity) | {29.94; 37.89; 42.81} | {28.02; 34.31; 41.72} | 0.3907 |
| Mn-SOD (U/L) | {1105; 1431; 1495} | {1111; 1460; 1686} | 0.3625 |
| Mn-SOD (U/g total protein) | {9.27; 11.33; 13.28} | {8.73; 12.07; 13.85} | 0.9243 |
| Mn-SOD (U/mg SOD2) | {37.26; 56.35; 72.68} | {42.08; 63.77; 82.98} | 0.4668 |
| TAC (mM UAE) | {0.360; 0.386; 0.426} | {0.330; 0.351; 0.420} | 0.8559 |
| MDA (µmol/L) | {5.83; 6.60; 9.93} | {6.22; 6.72; 8.57} | 0.3653 |
| Cu (µg/L) | 1061 ± 158 | 1103 ± 142 | 0.3889 |
| Zn (µg/L) | {892; 967; 1075} | {860; 932; 1016} | 0.3947 |
| Zn/Cu | 0.96 ± 0.22 | 0.86 ± 0.16 | 0.1263 |
| * Cd (mg/g Hb) | 2.45 ± 1.37 | 12.54 ± 7.89 | <0.0001 |
| Variable | Age (years) | TChol (mg/dL) | TG (mg/dL) | HDL-Chol (mg/dL) | LDL-Chol (mg/dL) | CRP (mg/L) | Glucose (mmol/L) | Insulin (mU/L) | BMI | HOMA-IR |
|---|---|---|---|---|---|---|---|---|---|---|
| Cu (µg/L) | 0.25 | 0.48 | 0.25 | 0.37 | 0.34 | |||||
| Zn (µg/L) | 0.28 | −0.42 | 0.24 | 0.22 | ||||||
| Cd (mg/g Hb) | 0.41 | 0.23 | ||||||||
| SOD1 (ng/mL) | 0.32 | −0.48 | 0.28 | 0.30 | ||||||
| SOD2 (ng/mL) | ||||||||||
| SOD3 (ng/mL) | ||||||||||
| SOD (U/L) | −0.24 | −0.26 | −0.26 | −0.31 | −0.21 | −0.28 | ||||
| Cu,Zn-SOD (U/L) | −0.37 | −0.25 | −0.26 | −0.26 | ||||||
| Mn-SOD (U/L) | ||||||||||
| Cu,Zn-SOD (% SOD activity) | −0.41 | 0.23 | −0.26 | |||||||
| TAC (mM UAE) | 0.43 | 0.30 | −0.37 | 0.32 | 0.42 | 0.23 | 0.59 | 0.23 | ||
| MDA (µmol/L) | 0.28 | 0.23 | −0.33 | 0.34 | 0.27 | 0.24 | 0.48 |
| Variable | SOD1 (ng/mL) | SOD2 (ng/mL) | SOD3 (ng/mL) | SOD (U/L) | Cu,Zn-SOD (U/L) | Mn-SOD (U/L) | Cu,Zn-SOD (% SOD activity) | TAC (mM UAE) | MDA (µmol/L) | Cu (µg/L) | Zn (µg/L) | Cd (mg/g Hb) |
|---|---|---|---|---|---|---|---|---|---|---|---|---|
| SOD1 (ng/mL) | −0.29 | 0.23 | 0.19 | 0.33 | 0.24 | 0.36 | ||||||
| SOD2 (ng/mL) | −0.29 | |||||||||||
| SOD3 (ng/mL) | 0.23 | 0.19 | 0.24 | |||||||||
| SOD (U/L) | 0.19 | 0.66 | 0.64 | −0.24 | ||||||||
| Cu,Zn-SOD (U/L) | 0.33 | 0.19 | 0.66 | 0.78 | −0.31 | |||||||
| Mn-SOD (U/L) | 0.64 | −0.55 | −0.30 | 0.22 | ||||||||
| Cu,Zn-SOD (% SOD activity) | 0.24 | 0.24 | 0.78 | −0.55 | −0.28 | |||||||
| TAC (mM UAE) | 0.36 | 0.33 | 0.22 | |||||||||
| MDA (µmol/L) | −0.31 | −0.28 | 0.33 | 0.24 |
| SNP (Gene) | Genotype | Control Group (n = 50) | Obese Group (n = 44) | p |
|---|---|---|---|---|
| rs2234694 (SOD1) | A/A | 43 (42.02) | 36 (36.98) | 0.5807 |
| A/C | 7 (7.98) | 8 (7.02) | ||
| rs5746105 (SOD2) | C/C | 3 (5.32) | 7 (4.68) | 0.2985 |
| C/T | 24 (22.87) | 19 (20.13) | ||
| T/T | 23 (21.81) | 18 (19.19) | ||
| rs4880 (SOD2) | C/C | 8 (5.32) | 2 (4.68) | 0.0015 |
| C/T | 31 (38.30) | 41 (33.70) | ||
| T/T | 11 (6.38) | 1 (5.62) | ||
| rs927450 (SOD2) | T/T | 16 (15.43) | 13 (13.57) | 0.8364 |
| T/C | 22 (23.40) | 22 (20.60) | ||
| C/C | 12 (11.17) | 9 (9.83) | ||
| rs8192287 (SOD3) | G/G | 50 | 44 | 1.0000 |
| Parameter | A/A Genotype (n = 43) (26 Women, 17 Men) | A/C Genotype (n = 7) (3 Women, 4 Men) | p |
|---|---|---|---|
| SOD1 (ng/mL) | {18.86; 29.15; 42.18} | {24.08; 32.03; 33.91} | 0.7427 |
| SOD1 (ng/mg total protein) | {0.16; 0.23; 0.34} | {0.18; 0.24; 0.30} | 0.9782 |
| SOD2 (ng/mL) | {22.32; 27.21; 34.69} | {18.80; 21.97; 32.99} | 0.2090 |
| SOD2 (ng/mg total protein) | {0.17; 0.22; 0.27} | {0.17; 0.18; 0.28} | 0.3544 |
| ** SOD3 (ng/mL) | {25.51; 30.30; 38.00} | {18.38; 20.66; 26.04} | 0.0165 |
| ** SOD3 (ng/mg total protein) | {0.18; 0.25; 0.30} | {0.14; 0.16; 0.24} | 0.0304 |
| SOD (U/L) | {1711; 2336; 2681} | {1528; 2290; 2553} | 0.5649 |
| SOD (U/g total protein) | {13.20; 18.89; 20.71} | {12.05; 19.47; 21.40} | 0.8268 |
| SOD (U/mg SODs) | {18.33; 23.81; 30.97} | {22.80; 25.27; 34.03} | 0.3391 |
| Cu,Zn-SOD (U/L) | {532; 847; 1252} | {411; 1078; 1264} | 0.9346 |
| Cu,Zn-SOD (U/g total protein) | {4.23; 6.77; 9.94} | {2.86; 8.42; 11.42} | 0.9782 |
| Cu,Zn-SOD (U/mg SOD1+SOD3) | {8.86; 14.79; 19.07} | {9.51; 18.30; 26.34} | 0.4908 |
| Cu,Zn-SOD (% SOD activity) | {27.92; 35.12; 54.55} | {27.24; 43.27; 53.06} | 1.0000 |
| Mn-SOD (U/L) | {1004; 1261; 1676} | {1098; 1145; 1223} | 0.3495 |
| Mn-SOD (U/g total protein) | {8.03; 10.07; 14.65} | {8.14; 9.51; 11.05} | 0.5465 |
| Mn-SOD (U/mg SOD2) | {33.37; 42.81; 66.46} | {33.91; 53.65; 65.93} | 0.6714 |
| TAC (mM UAE) | {0.25; 0.30; 0.35} | {0.27; 0.35; 0.36} | 0.7635 |
| ** MDA (µmol/L) | {3.86; 5.02; 5.83} | {4.48; 6.64; 7.96} | 0.0423 |
| Cu (µg/L) | {921; 997; 1182} | {853; 1059; 1241} | 0.6027 |
| Zn (µg/L) | {846; 929; 1021} | {902; 965; 1132} | 0.3942 |
| Zn/Cu | {0.81; 0.91; 1.03} | {0.83; 0.90; 1.07} | 0.9129 |
| Cd (mg/g Hb) | {1.62; 2.43; 3.51} | {1.12; 1.49; 5.77} | 0.5027 |
| Cotinine (ng/mL) | {0.00; 0.00; 8.18} | {0.00; 0.00; 12.54} | 0.5649 |
| Age (years) | {24; 34; 47} | {28; 38; 49} | 0.5649 |
| BMI | {21.36; 23.57; 26.79} | {20.68; 21.72; 27.45} | 0.7635 |
| Parameter | A/A Genotype (n = 36) (15 Women, 21 Men) | A/C Genotype (n = 8) (5 Men, 3 Women) | p |
|---|---|---|---|
| ** SOD1 (ng/mL) | {31.85; 41.92; 51.50} | {23.06; 29.06; 37.58} | 0.0215 |
| ** SOD1 (ng/mg total protein) | {0.27; 0.36; 0.43} | {0.16; 0.25; 0.34} | 0.0498 |
| ** SOD2 (ng/mL) | {18.70; 22.63; 28.03} | {24.01; 27.17; 35.76} | 0.0460 |
| ** SOD2 (ng/mg total protein) | {0.15; 0.19; 0.25} | {0.20; 0.23; 0.30} | 0.0460 |
| SOD3 (ng/mL) | {23.40; 30.02; 33.56} | {26.68; 27.75; 30.84} | 0.5095 |
| SOD3 (ng/mg total protein) | {0.18; 0.26; 0.29} | {0.19; 0.27; 0.29} | 0.9390 |
| SOD (U/L) | {1953; 2198; 2477} | {1610; 2031; 2332} | 0.4590 |
| SOD (U/g total protein) | {15.31; 18.34; 20.28} | {12.17; 15.98; 22.80} | 0.6944 |
| SOD (U/mg SODs) | {18.03; 21.98; 25.73} | {20.82; 21.74; 24.06} | 0.7895 |
| Cu,Zn-SOD (U/L) | {610; 764; 886} | {390; 713; 1002} | 0.7895 |
| Cu,Zn-SOD (U/g total protein) | {5.18; 6.05; 7.65} | {3.78; 5.54; 8.07} | 0.6713 |
| Cu,Zn-SOD (U/mg SOD1+SOD3) | {7.86; 10.24; 13.68} | {8.03; 12.99; 17.43} | 0.3195 |
| Cu,Zn-SOD (% SOD activity) | {29.47; 34.45; 41.49} | {22.67; 38.93; 50.30} | 0.7654 |
| Mn-SOD (U/L) | {1174; 1441; 1582} | {886; 1096; 1551} | 0.2477 |
| Mn-SOD (U/g total protein) | {9.48; 11.45; 13.37} | {7.14; 10.13; 14.10} | 0.5187 |
| Mn-SOD (U/mg SOD2) | {41.91; 59.56; 75.75} | {24.17; 43.71; 60.09} | 0.1385 |
| TAC (mM UAE) | {0.33; 0.39; 0.45} | {0.34; 0.38; 0.44} | 0.9390 |
| MDA (µmol/L) | {5.71; 6.82; 8.69} | {6.16; 6.58; 9.25} | 0.6869 |
| Cu (µg/L) | {945; 1056; 1154} | {975; 1134; 1312} | 0.2763 |
| Zn (µg/L) | {890; 989; 1074} | {836; 908; 944} | 0.0622 |
| Zn/Cu | {0.82; 0.94; 1.07} | {0.72; 0.78; 0.89} | 0.0699 |
| Cd (mg/g Hb) | {1.59; 3.92; 7.32} | {1.70; 3.43; 6.15} | 0.9860 |
| Cotinine (ng/mL) | {0.00; 0.00; 15.18} | {0.00; 0.00; 13.11} | 0.8423 |
| Age (years) | {38; 46; 56} | {39; 52; 58} | 0.7540 |
| BMI | {31.42; 32.29; 34.25} | {31.57; 32.87; 34.99} | 0.7090 |
| Parameter | C/C or C/T Genotype (n = 39) (24 Women, 15 Men) | T/T Genotype (n = 11) (5 Women, 6 Men) | p |
|---|---|---|---|
| SOD1 (ng/mL) | {19.78; 32.03; 42.16} | {16.72; 28.56; 35.31} | 0.5478 |
| SOD1 (ng/mg total protein) | {0.17; 0.24; 0.35} | {0.13; 0.18; 0.27} | 0.3187 |
| SOD2 (ng/mL) | {22.12; 24.88; 33.44} | {20.19; 28.11; 30.25} | 0.7105 |
| SOD2 (ng/mg total protein) | {0.17; 0.22; 0.28} | {0.14; 0.21; 0.25} | 0.5300 |
| SOD3 (ng/mL) | {25.46; 30.02; 37.88} | {15.70; 22.72; 29.21} | 0.0663 |
| ** SOD3 (ng/mg total protein) | {0.18; 0.24; 0.30} | {0.11; 0.16; 0.25} | 0.0486 |
| ** SOD (U/L) | {1865; 2359; 2685} | {1411; 1642; 1899} | 0.0007 |
| ** SOD (U/g total protein) | {13.39; 20.02; 21.94} | {9.52; 11.18; 14.53} | 0.0005 |
| SOD (U/mg SODs) | {19.32; 23.86; 32.37} | {17.20; 24.79; 26.62} | 0.4338 |
| ** Cu,Zn-SOD (U/L) | {532; 948; 1301} | {411; 573; 642} | 0.0202 |
| ** Cu,Zn-SOD (U/g total protein) | {4.23; 8.42; 10.77} | {2.68; 4.80; 5.19} | 0.0189 |
| Cu,Zn-SOD (U/mg SOD1+SOD3) | {10.36; 15.81; 20.02} | {8.82; 11.81; 18.17} | 0.3618 |
| Cu,Zn-SOD (% SOD activity) | {29.80; 41.26; 54.55} | {27.24; 31.25; 49.68} | 0.5173 |
| Mn-SOD (U/L) | {1033; 1326; 1885} | {609; 1155; 1261} | 0.0539 |
| ** Mn-SOD (U/g total protein) | {8.81; 10.61; 15.06} | {5.43; 8.60; 10.07} | 0.0165 |
| Mn-SOD (U/mg SOD2) | {35.97; 43.99; 65.93} | {19.80; 40.36; 54.32} | 0.3618 |
| TAC (mM UAE) | {0.25; 0.30; 0.35} | {0.22; 0.30; 0.40} | 0.4178 |
| MDA (µmol/L) | {3.86; 5.10; 5.83} | {4.05; 5.40; 6.80} | 0.3915 |
| Cu (µg/L) | {865; 995; 1184} | {989; 1021; 1102} | 0.2753 |
| Zn (µg/L) | {853; 929; 1020} | {895; 992; 1132} | 0.3540 |
| Zn/Cu | {0.81; 0.91; 1.06} | {0.88; 0.91; 1.07} | 0.9632 |
| Cd (mg/g Hb) | {1.64; 2.43; 4.26} | {1.03; 2.18; 2.79} | 0.2266 |
| Cotinine (ng/mL) | {0.00; 0.00; 8.29} | {0.00; 0.00; 0.00} | 0.3302 |
| Age (years) | {25; 33; 47} | {27; 40; 49} | 0.4178 |
| BMI | {21.15; 22.83; 26.44} | {23.32; 24.69; 27.44} | 0.0673 |
| rs2234694 (SOD1), Obese Group | |||
| Parameter | A/A Genotype (n = 36) | A/C Genotype (n = 8) | p |
| Glucose (mmol/L) | {4.94; 5.20; 5.61} | {4.67; 4.92; 5.28} | 0.2502 |
| ** Insulin (mU/L) | {10.00; 14.60; 19.30} | {7.80; 8.40; 9.90} | 0.0214 |
| ** HOMA-IR | {2.25; 3.21; 4.91} | {1.62; 1.75; 1.85} | 0.0218 |
| rs4880 (SOD2), Non-Obese Group | |||
| Parameter | C/C or C/T Genotype (n = 39) | T/T Genotype (n = 11) | p |
| ** Glucose (mmol/L) | {4.50; 4.64; 4.89} | {4.72; 4.94; 5.17} | 0.0326 |
| ** Insulin (mU/L) | {4.70; 6.60; 8.20} | {6.50; 10.00; 15.20} | 0.0369 |
| ** HOMA | {0.97; 1.35; 1.84} | {1.28; 2.25; 3.56} | 0.0306 |
| Structure of the Population Sample | ||||
| Variable (Categorical) | Control Group | Obese Group | ||
| Total count | 50 | 44 | ||
| Sex | M: 21 | F: 29 | M: 24 | F: 20 |
| Exposed to cigarette smoke | NO: 41 | YES: 9 | NO: 27 | YES: 17 |
| Sex (not exposed) | M: 17 | F: 24 | M: 18 | F: 9 |
| Sex (exposed) | M: 4 | F: 5 | M: 6 | F:11 |
| Characteristics of the Population Sample | ||||
| Variable | Control Group | Obese Group | p | |
| ** Age (years) | {25; 34; 47} | {37; 47; 57} | <0.0001 | |
| TChol (mg/dL) | {179; 194; 215} | {168; 204; 227} | 0.5809 | |
| ** TG (mg/dL) | {67; 88; 127} | {87; 134; 178} | 0.0049 | |
| ** HDL-Chol (mg/dL) | {48; 59; 76} | {43; 53; 62} | 0.0320 | |
| LDL-Chol (mg/dL) | {99; 117; 133} | {98; 116; 142} | 0.7743 | |
| ** CRP (mg/L) | {0.33; 0.65; 1.10} | {1.11; 1.41; 3.31} | <0.00001 | |
| ** Glucose (mmol/L) | {4.50; 4.78; 4.94} | {4.89; 5.17; 5.61} | <0.00001 | |
| ** Insulin (mU/L) | {4.90; 6.90; 9.00} | {9.50; 13.95; 18.00} | <0.00001 | |
| ** BMI | {21.30; 23.48; 26.79} | {31.51; 32.29; 34.25} | <0.00001 | |
| ** HOMA-IR | {1.00; 1.49; 1.94} | {1.85; 3.06; 4.23} | <0.00001 | |
| SNP (Gene) | Primers. 5′–3′ Sequence (Base Pair Count) | Melting T (°C) | Annealing T (°C) | GC Content (%) |
|---|---|---|---|---|
| rs2234694 (SOD1) | Forward: CTATCCAGAAAACACGGTGGGCC(23) | 64.2 | 55.0 | 70.6 |
| Reverse: TCTATATTCAATAAATGCTACAAAACC(27) | 55.9 | 50.0 | ||
| rs5746105 (SOD2) | Forward: GAGCTCGGTTGATAAAACCAGGG(23) | 62.4 | 58.0 | 52.2 |
| Reverse: ACTCAACAAATTTCATAACCCCGA(24) | 57.6 | 37.5 | ||
| rs4880 (SOD2) | Forward: GCCTGCGTAGACGGTCC(17) | 60.0 | 57.0 | 70.6 |
| Reverse: TCGGTGACGTTCAGGTTGTT(20) | 57.3 | 50.0 | ||
| rs927450 (SOD2) | Forward: CCTGGAAACCTACATTAAGACTTTG(25) | 57.9 | 57.0 | 40.0 |
| Reverse: CTCTGGGGCCTACACTCTTT(20) | 58.7 | 55.0 | ||
| rs8192287 (SOD3) | Forward: TTATGAGTGCGGCTAGTGCC(20) | 60.2 | 57.0 | 55.0 |
| Reverse: TACTCGCCCAGTGACAACAC(20) | 60.0 | 55.0 |
| SNP (Gene) | Amplicon Length | Restrictase Restriction Site | Restriction Conditions | Genotype Restriction Fragments |
|---|---|---|---|---|
| rs2234694 (SOD1) | 278 bp | HhaI, Thermo Fisher Scientific, cat. no. ER1851 | 37.0 °C, 10 U HhaI, 1.5 h | A/A: 278 bp |
| A/C: 278 bp, 207 bp, 71 bp | ||||
| C/C: 207 bp, 71 bp | ||||
| rs5746105 (SOD2) | 259 bp | TasI (Tsp509I), Thermo Fisher Scientific, cat. no. ER1351 | 65.0 °C, 3 U TasI, 2.5 h | C/C: 231 bp, 16 bp, 12 bp |
| C/T: 231 bp, 110 bp, 121 bp, 16 bp, 12 bp | ||||
| T/T: 110 bp, 121 bp, 16 bp, 12 bp | ||||
| rs4880 (SOD2) | 231 bp | BsaWI, New England Biolabs, cat. no. R0567S | 60.0 °C, 3 U BsaWI, 2.5 h | C/C: 231 bp |
| C/T: 231 bp, 81 bp, 150 bp | ||||
| T/T: 81 bp, 150 bp | ||||
| rs927450 (SOD2) | 83 bp | BstUI, Thermo Fisher Scientific, cat. no. ER0921 | 37.0 °C, 3 U BstUI, 2.5 h | T/T: 81 bp |
| T/C: 81 bp, 35 bp, 48 bp | ||||
| C/C: 35 bp, 48 bp | ||||
| rs8192287 (SOD3) | 47 bp | MaeIII, Sigma-Aldrich. cat. no. 10822230001 | 55.0 °C, 3 U MaeIII, 2.5 h | T/T: 47 bp |
| T/G: 47 bp, 32 bp. 15 bp | ||||
| G/G: 32 bp, 15 bp |
© 2020 by the authors. Licensee MDPI, Basel, Switzerland. This article is an open access article distributed under the terms and conditions of the Creative Commons Attribution (CC BY) license (http://creativecommons.org/licenses/by/4.0/).
Share and Cite
Lewandowski, Ł.; Kepinska, M.; Milnerowicz, H. Alterations in Concentration/Activity of Superoxide Dismutases in Context of Obesity and Selected Single Nucleotide Polymorphisms in Genes: SOD1, SOD2, SOD3. Int. J. Mol. Sci. 2020, 21, 5069. https://0-doi-org.brum.beds.ac.uk/10.3390/ijms21145069
Lewandowski Ł, Kepinska M, Milnerowicz H. Alterations in Concentration/Activity of Superoxide Dismutases in Context of Obesity and Selected Single Nucleotide Polymorphisms in Genes: SOD1, SOD2, SOD3. International Journal of Molecular Sciences. 2020; 21(14):5069. https://0-doi-org.brum.beds.ac.uk/10.3390/ijms21145069
Chicago/Turabian StyleLewandowski, Łukasz, Marta Kepinska, and Halina Milnerowicz. 2020. "Alterations in Concentration/Activity of Superoxide Dismutases in Context of Obesity and Selected Single Nucleotide Polymorphisms in Genes: SOD1, SOD2, SOD3" International Journal of Molecular Sciences 21, no. 14: 5069. https://0-doi-org.brum.beds.ac.uk/10.3390/ijms21145069