Article

Downregulation of GLI3 Expression Mediates Chemotherapy Resistance in Acute Myeloid Leukemia

Department of Oncology, Hematology and Bone Marrow Transplantation with Section Pneumology, Hubertus Wald University Cancer Center, University Medical Center Hamburg-Eppendorf, 20251 Hamburg, Germany
*
Author to whom correspondence should be addressed.
Int. J. Mol. Sci. 2020, 21(14), 5084; https://0-doi-org.brum.beds.ac.uk/10.3390/ijms21145084
Submission received: 26 June 2020 / Revised: 15 July 2020 / Accepted: 17 July 2020 / Published: 18 July 2020
(This article belongs to the Special Issue Hedgehog Signaling 2.0)

Abstract

:
Aberrant activation of the hedgehog (HH) pathway is observed in many neoplasms, including acute myeloid leukemia (AML). The glioma-associated oncogene homolog (GLI) transcription factors are the main downstream effectors of the HH signaling cascade and are responsible for the proliferation and maintenance of leukemic stem cells, which support chemotherapy resistance and leukemia relapse. Cytarabine (Ara-C)-resistant variants of AML cell lines were established through long-term cultivation with successively increasing Ara-C concentrations. Subsequently, differences in GLI expression were analyzed by RT-qPCR. GLI3 mRNA levels were detectable in parental Kasumi-1, OCI-AML3, and OCI-AML5 cells, whereas GLI3 expression was completely silenced in all resistant counterparts. Therefore, we generated GLI3-knockdown cell lines using small hairpin RNAs (shRNA) and evaluated their sensitivity to Ara-C in vitro. The knockdown of GLI3 partly abolished the effect of Ara-C on colony formation and induction of apoptosis, indicating that GLI3 downregulation results in Ara-C resistance. Moreover, we analyzed the expression of several genes involved in Ara-C metabolism and transport. Knockdown of GLI3 resulted in the upregulation of SAM and HD domain-containing protein 1 (SAMHD1), cytidine deaminase (CDA), and ATP-binding cassette C11 (ABCC11)/multidrug resistance-associated protein 8 (MRP8), each of which has been identified as a predictive marker for Ara-C response in acute myeloid leukemia. Our results demonstrate that GLI3 downregulation is a potential mechanism to induce chemotherapy resistance in AML.

Graphical Abstract

1. Introduction

Attaining sustained long-term remission in acute myeloid leukemia (AML) patients presents a notable therapeutic challenge. Despite high initial response rates to chemotherapy, the majority of patients suffer from a relapse, ultimately leading to death in most cases [1,2]. Growing evidence indicates that relapse is caused by a small population of leukemic stem cells (LSCs) resistant to chemotherapy, which serve as reservoir for leukemic blasts [3,4]. In the bone marrow niche, hematopoietic stem cells (HSC) maintain their stemness and survival by bidirectional crosstalk with the bone marrow microenvironment [5]. LSCs are able to infiltrate the niche and alter homeostatic processes to maintain their quiescence, survival, and resistance to chemotherapy [6]. The interaction of LSC with the microenvironment involves a variety of stem cell signaling pathways, including the hedgehog (HH) signaling pathway [7].
The HH signaling pathway is a highly conserved signaling cascade that plays a critical role during embryogenesis and is strongly involved in many basic cellular functions, including cell differentiation and proliferation and stem cell maintenance [8]. It is well established that aberrant hedgehog signaling is associated with a wide variety of neoplasms [9], which results in the activation of the GLI transcription factors, the main downstream effectors of the HH signaling cascade. In previous work, we could show that GLI expression represents a negative prognostic factor in AML [10].
The GLI transcription factors consist of three members with specialized function and distinct regulation mechanisms: GLI1, GLI2, and GLI3. GLI1 and GLI2 represent transcriptional activators, whereas GLI3 occurs predominantly in its repressor form and functions as a strong repressor of GLI-mediated transcription [11,12,13]. In the canonical HH pathway, SMO regulates the level of GLI activity by shifting the balance between transcriptional stimulation through activated GLI2 and inhibition through GLI3 in its repressor form (GLI3R), while GLI1 is not expressed in resting cells [13,14,15]. However, GLI transcription factors represent central hubs in the oncogenic signaling network and can get activated non-canonically by cross-talk with a variety of pathways, including FLT3, PI3K-AKT, RAS–RAF–MEK, or TGFβ [16,17]. In AML cells, HH activation is largely independent of SMO activity but is strongly suppressed by GLI3R protein expression [18]. Analysis of The Cancer Genome Atlas AML data set has shown that GLI3 expression is epigenetically silenced in the majority of AML patient samples [18]. Consistent with these findings, we could show that GLI3 expression is absent in most AML patients as determined by qPCR analysis [10].
Several studies have supported the role of activated GLI signaling in the development of resistance to chemotherapy in multiple cancers, including AML, gastric cancer, and ovarian cancer [19,20,21]. While it has been shown that chemotherapy resistance can be caused by aberrant activation of the transcriptional activators GLI1 or GLI2 [22,23], changes in GLI3 expression have never been described in this context in AML. We hypothesized that the transcriptional repressor GLI3 may represent a major switch involved in sensitivity to chemotherapy.

2. Results

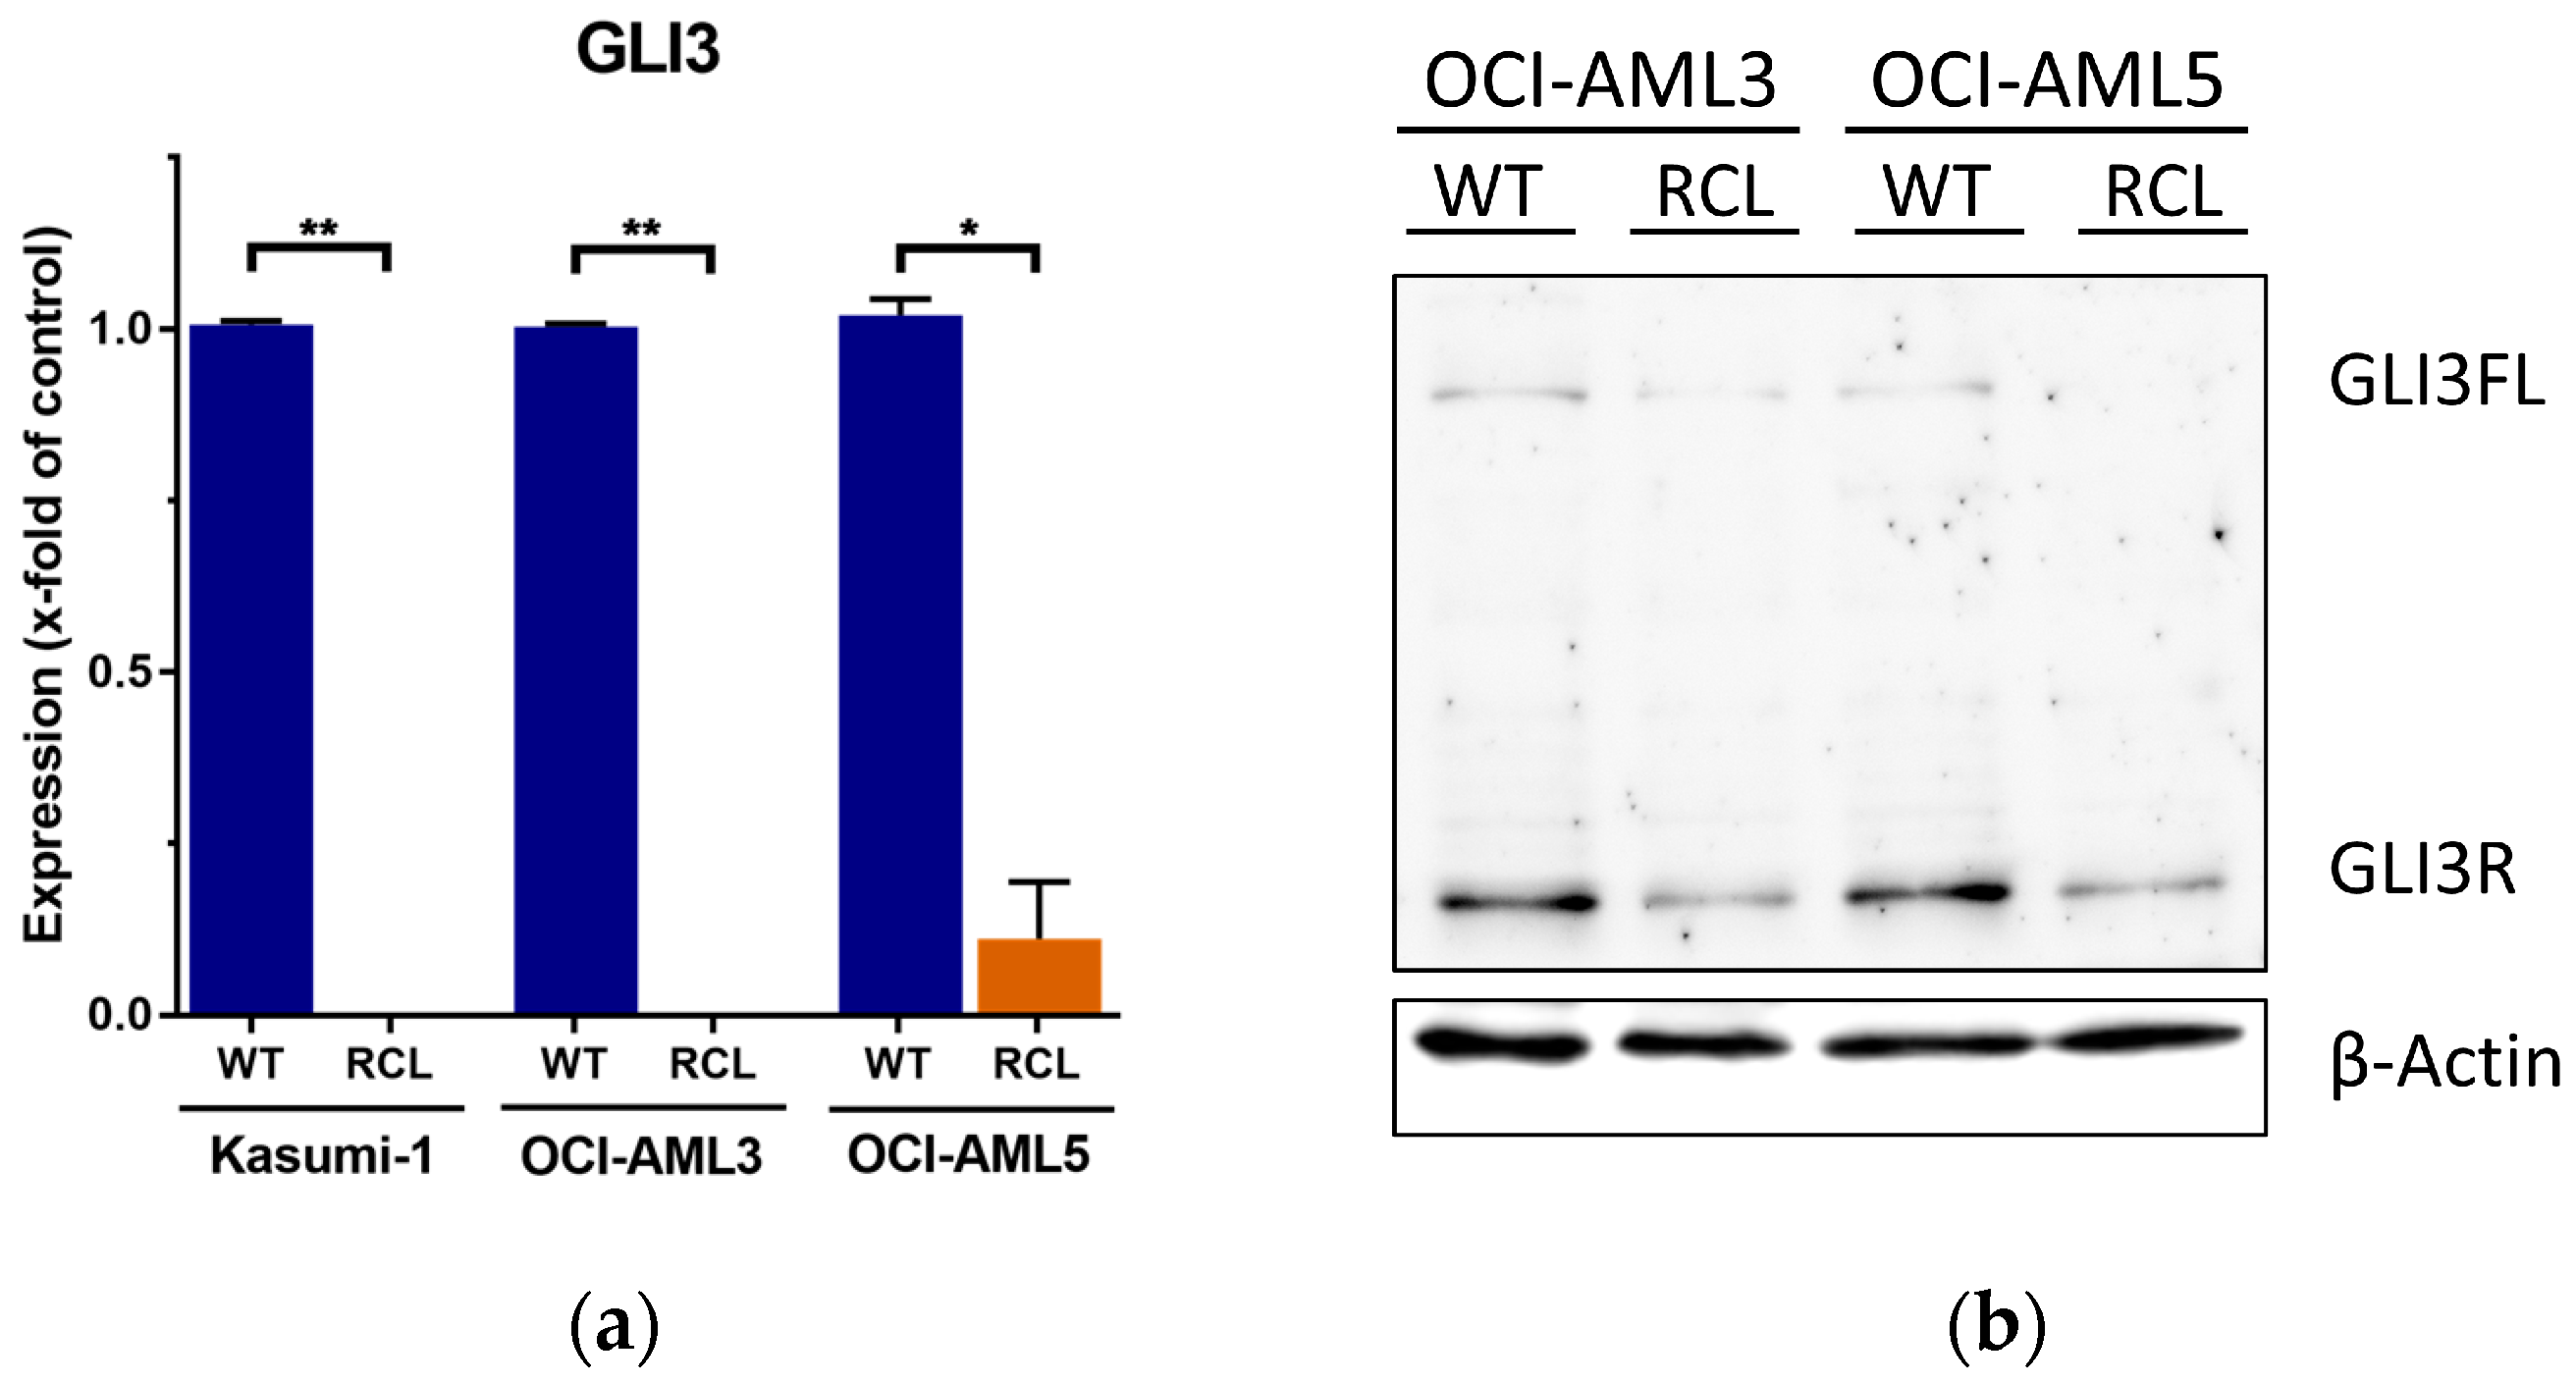
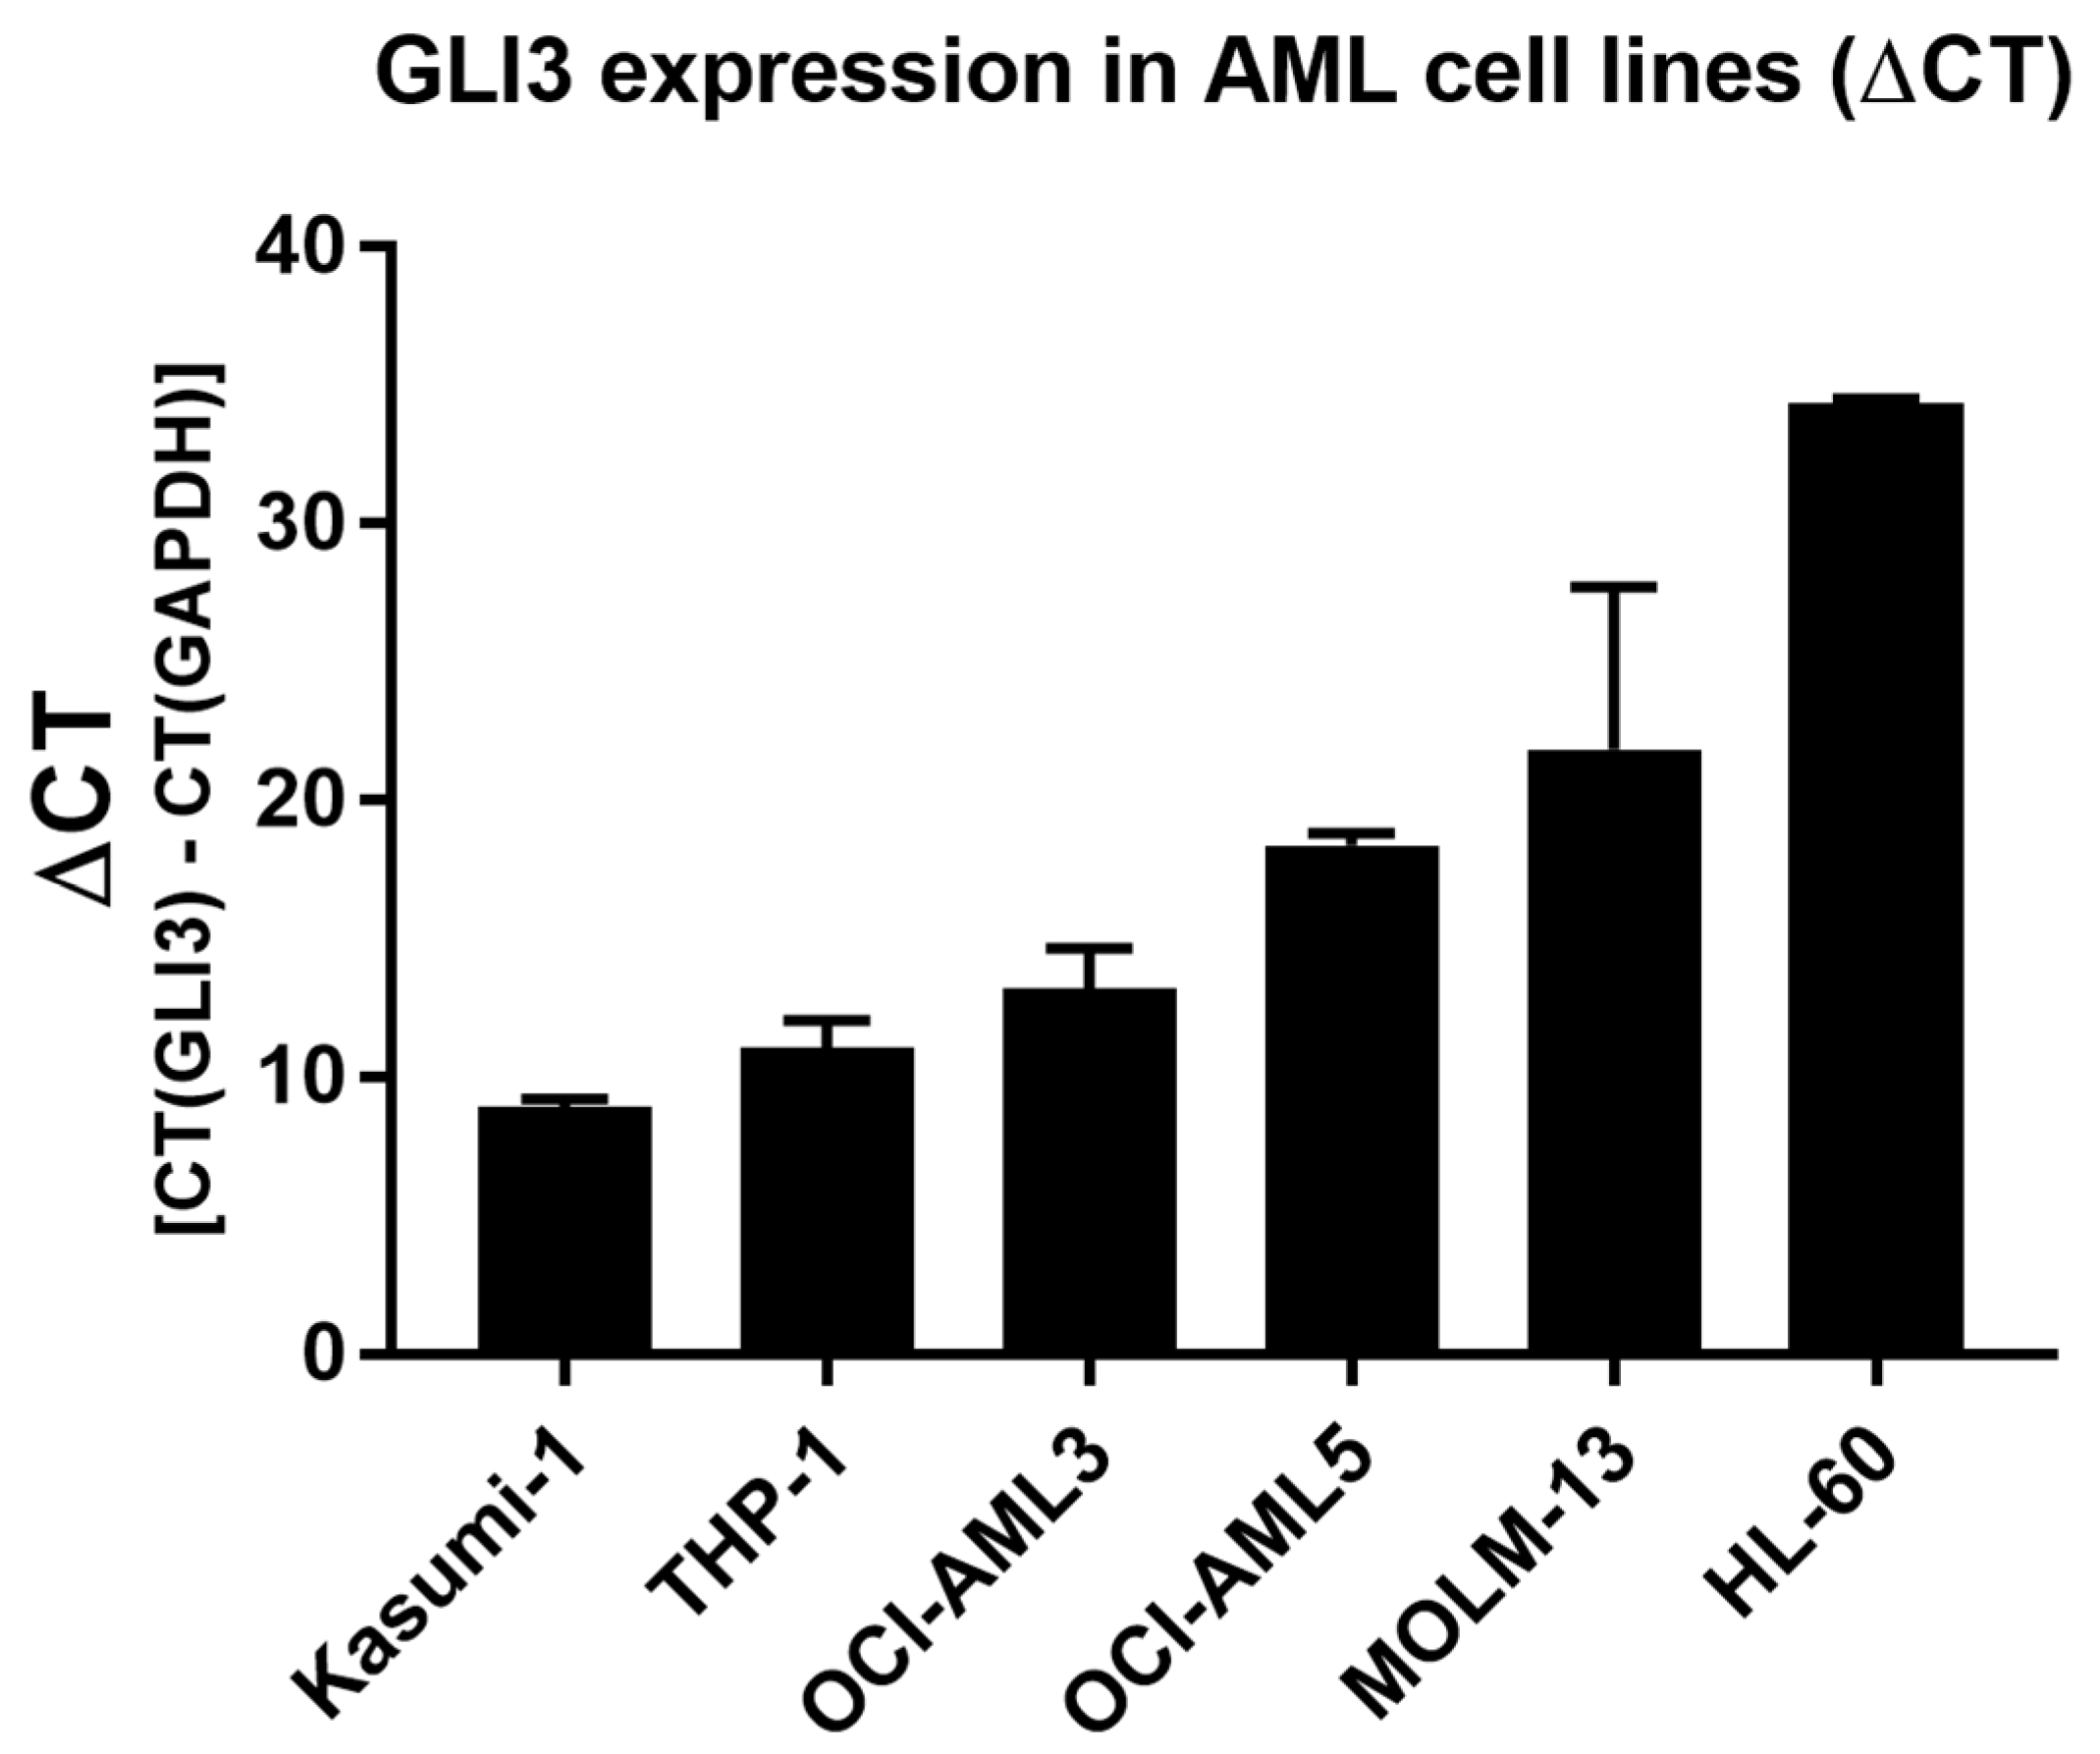
2.1. GLI3 Expression Silenced in Cytarabine (Ara-C)-Resistant Cell Lines

To better understand the role of the hedgehog pathway in the development of drug resistance and relapse in AML, we generated Ara-C-resistant variants of the AML cell lines Kasumi-1, OCI-AML3, and OCI-AML5 through long-term cultivation with successively increasing Ara-C concentrations. Ara-C resistance was characterized by an IC80 value (80% inhibitory concentration) for cell growth above 10,000 nM (refer to Figure 1 for relative number of viable cells and Figure A1 for cell viability, respectively).
Subsequently, GLI expression was analyzed in resistant variants and compared to that in their respective parental cell lines. We could not detect consistently significant changes in GLI1 and GLI2 mRNA expression (Appendix A, Figure A2). However, RT-qPCR analysis revealed that GLI3 expression was completely silenced in Ara-C-RCL Kasumi-1, OCI-AML3, and OCI-AML5, whereas GLI3 mRNA levels were detectable in their parental counterparts (Figure 2a). Moreover, we could show that resistant OCI-AML3 and OCI-AML5 cells had lower protein levels of both full length GLI3 and its repressor form compared to their parental cell line, using western blot analysis (Figure 2b).

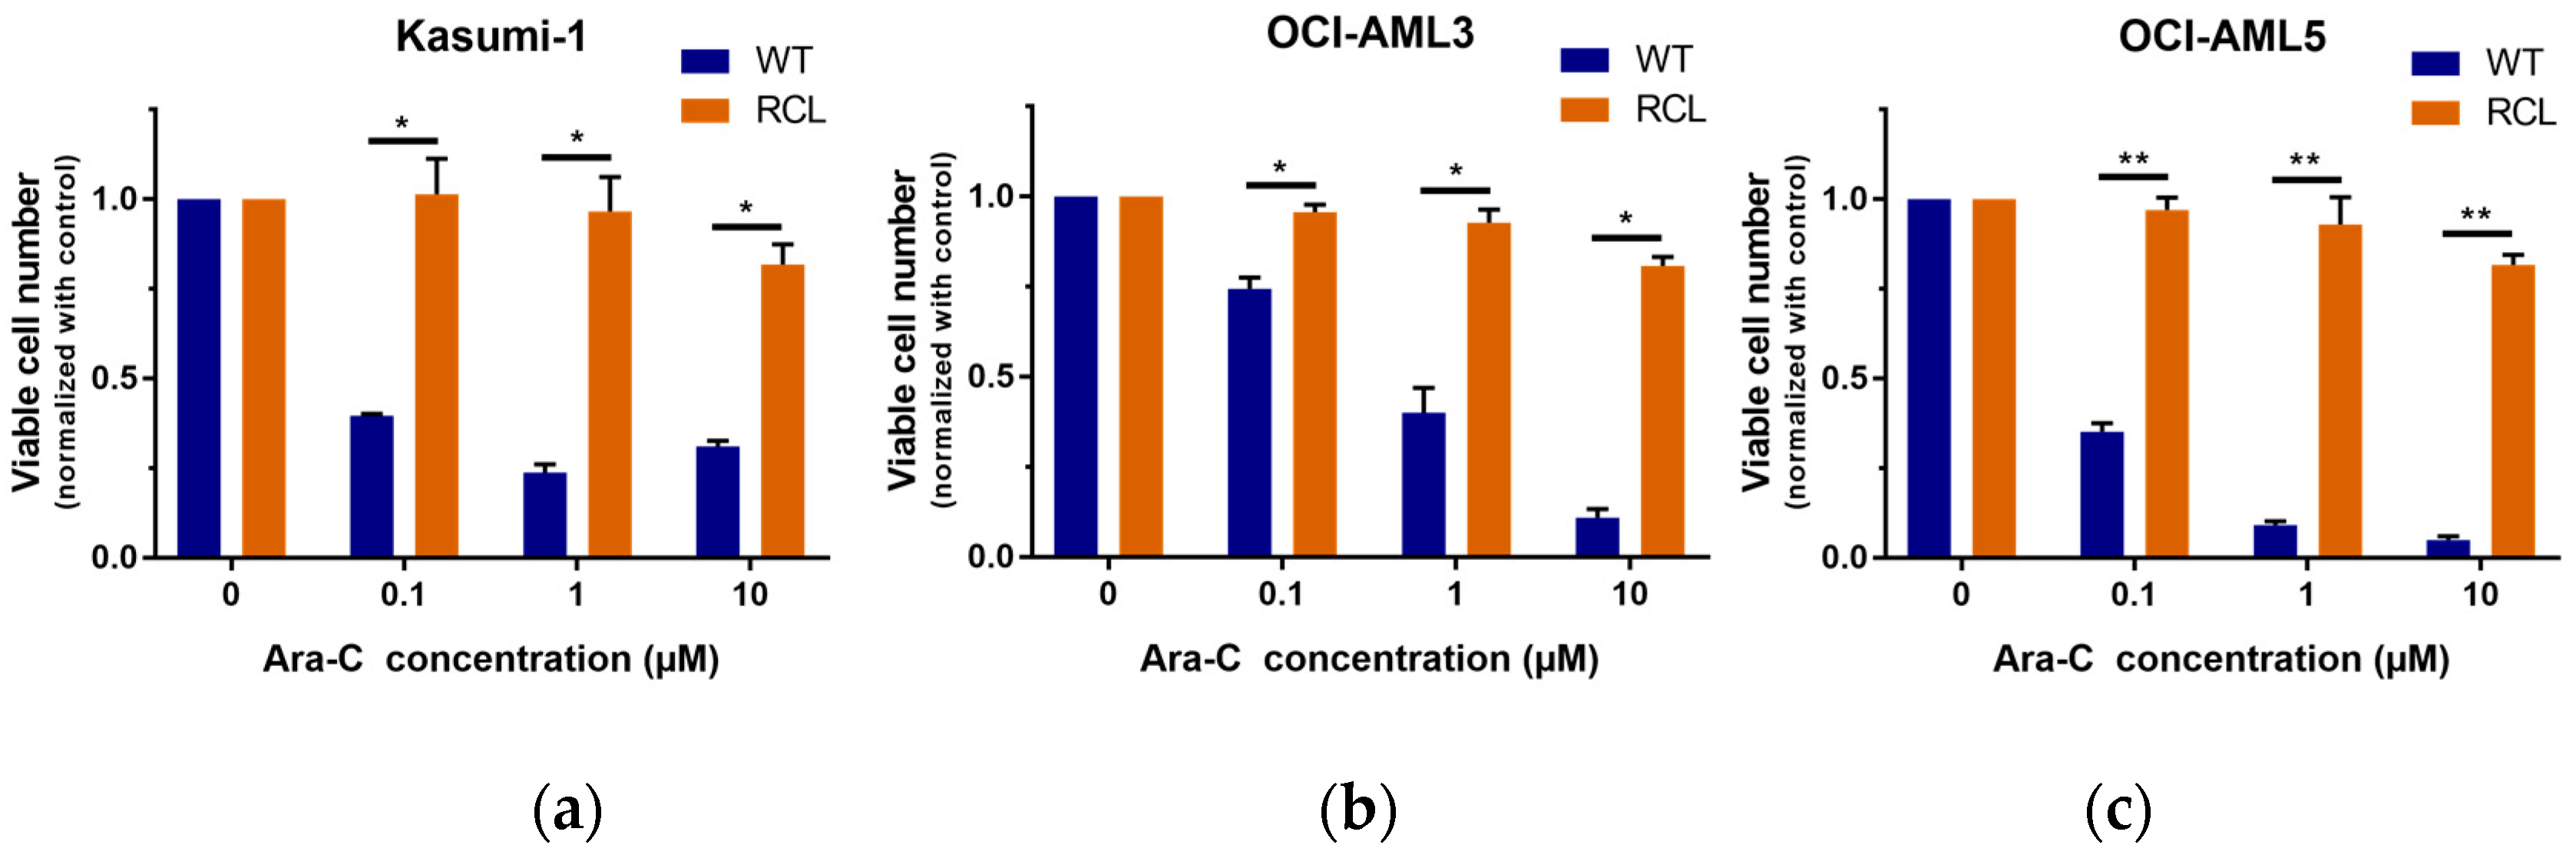
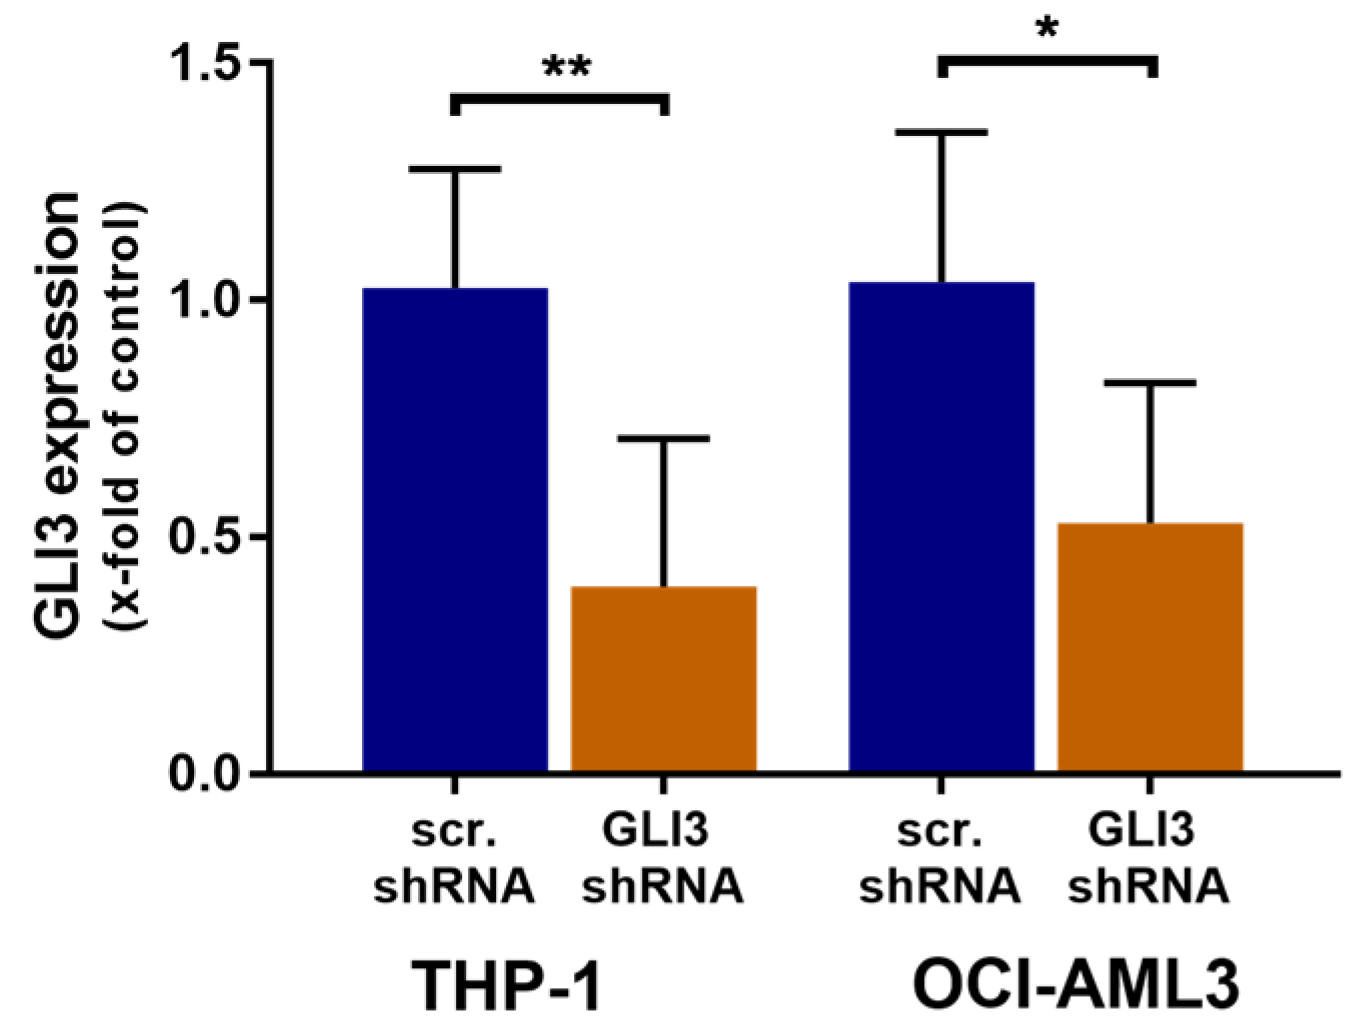
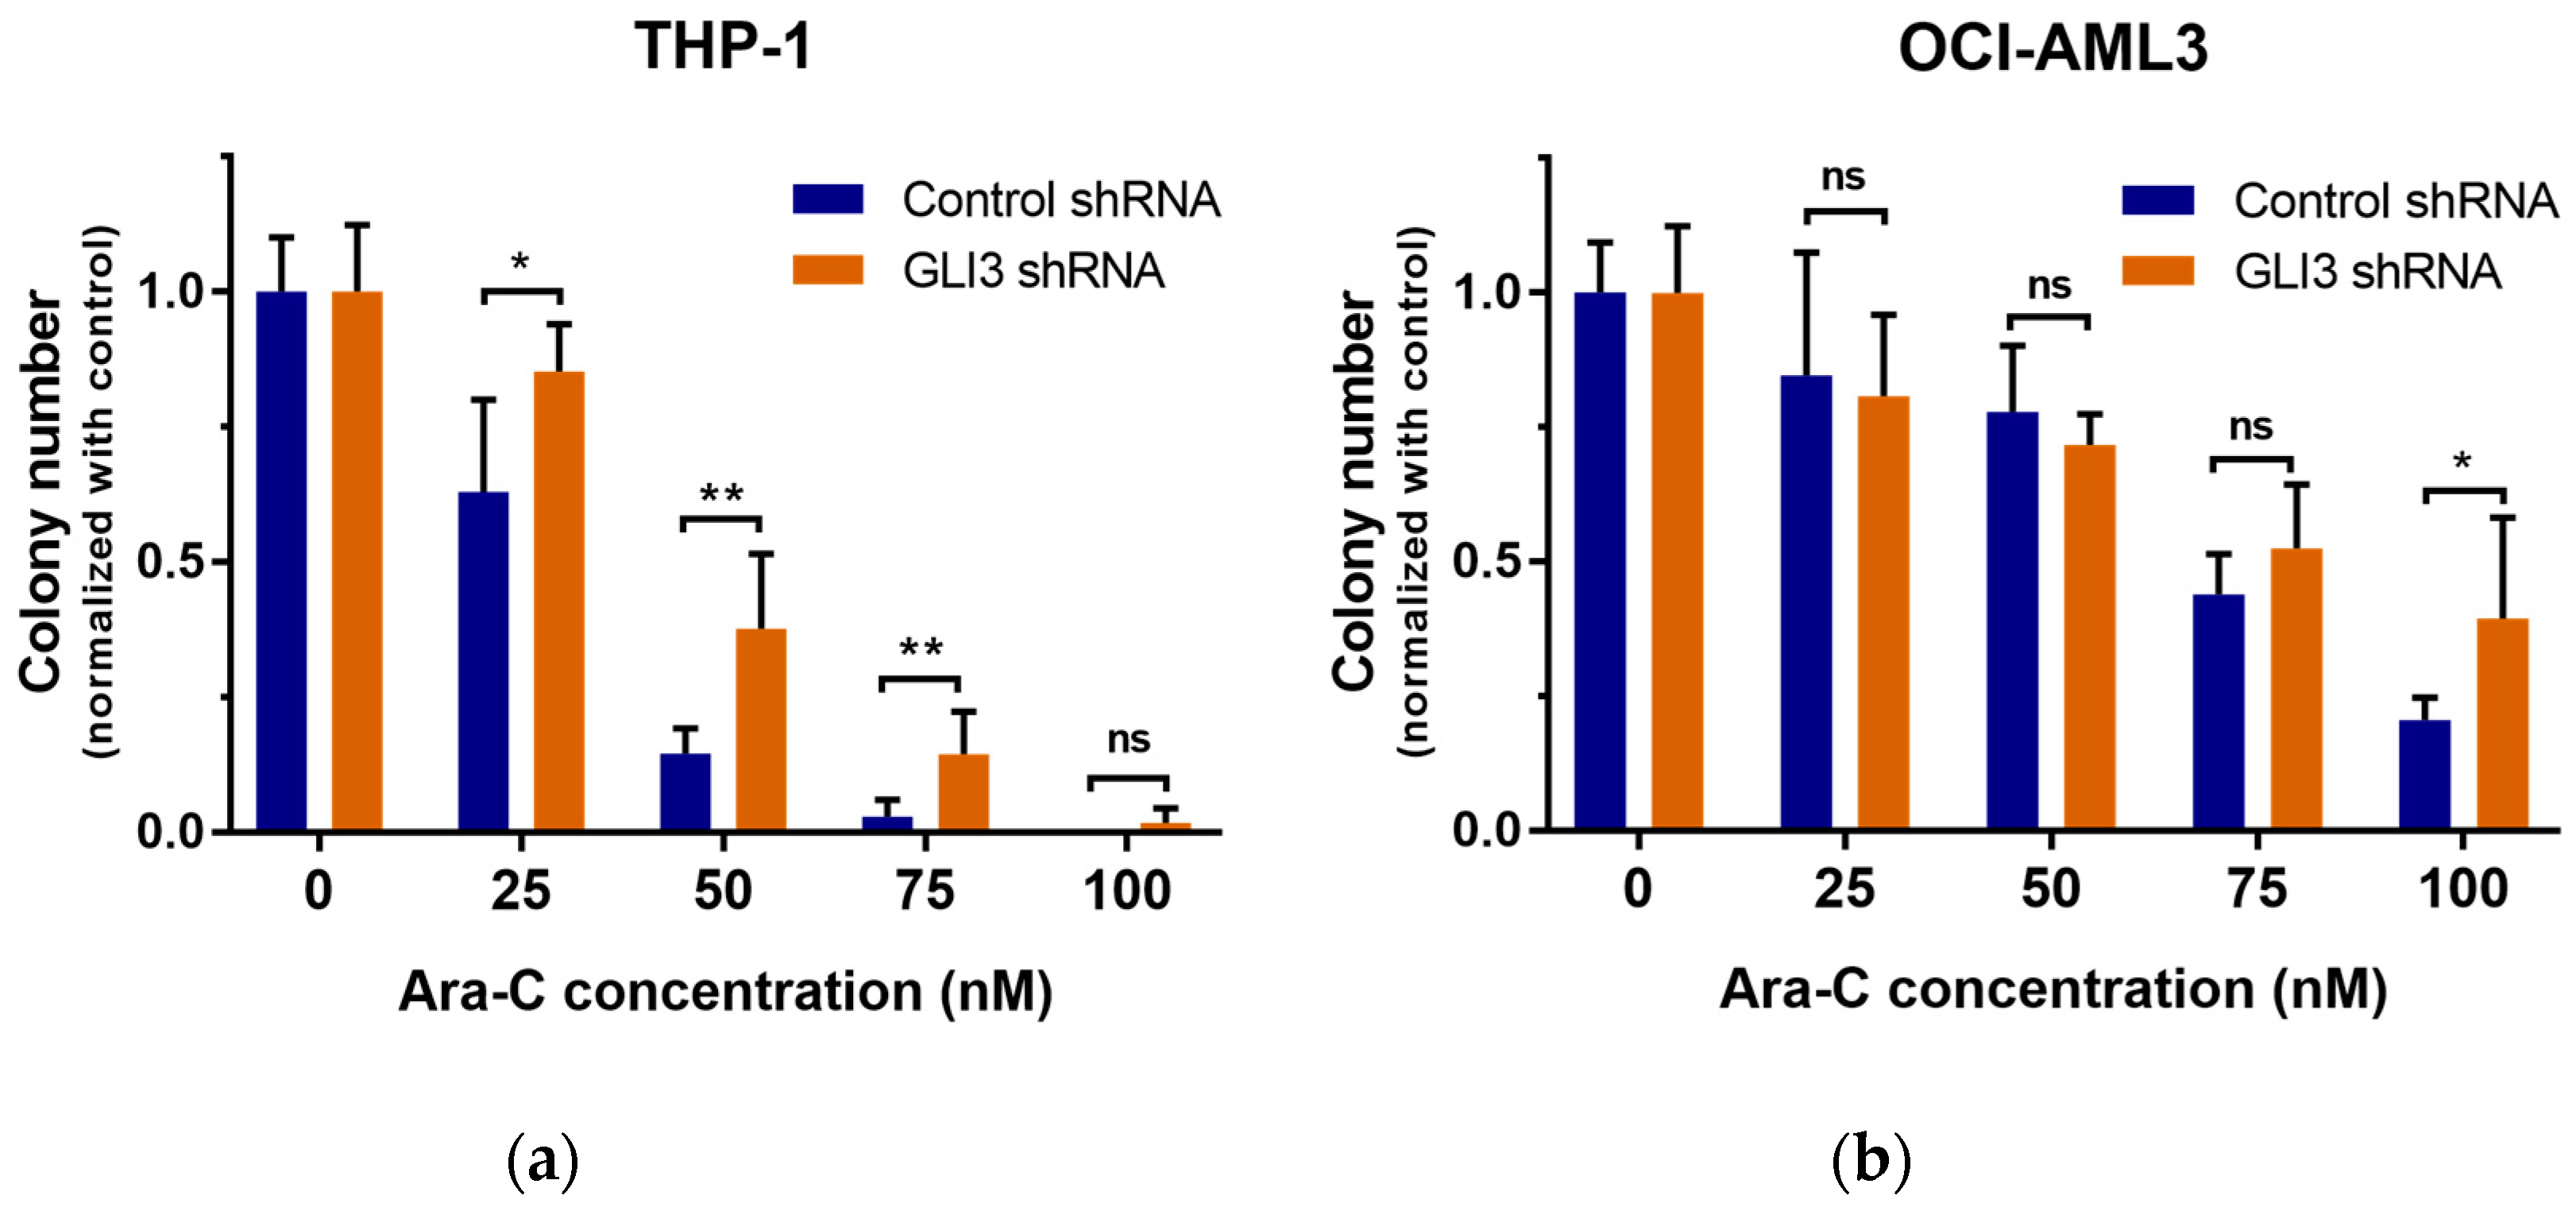
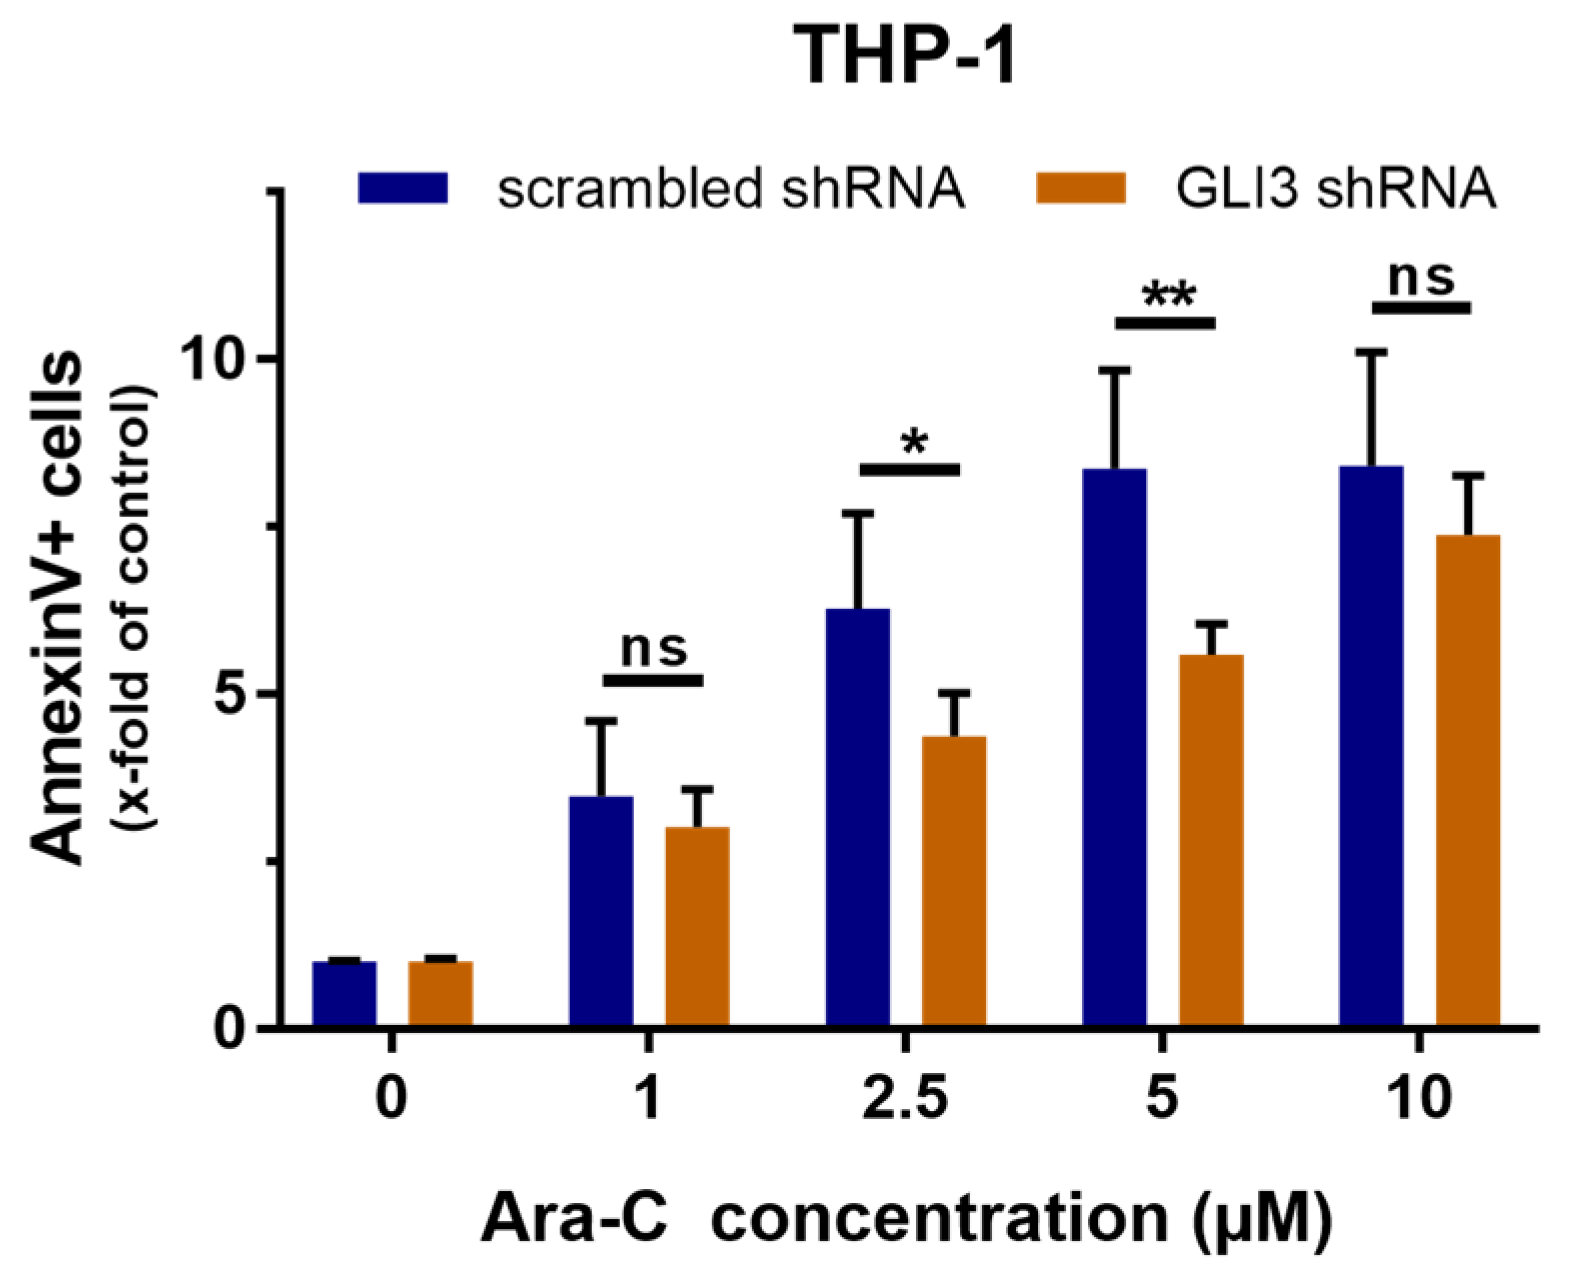
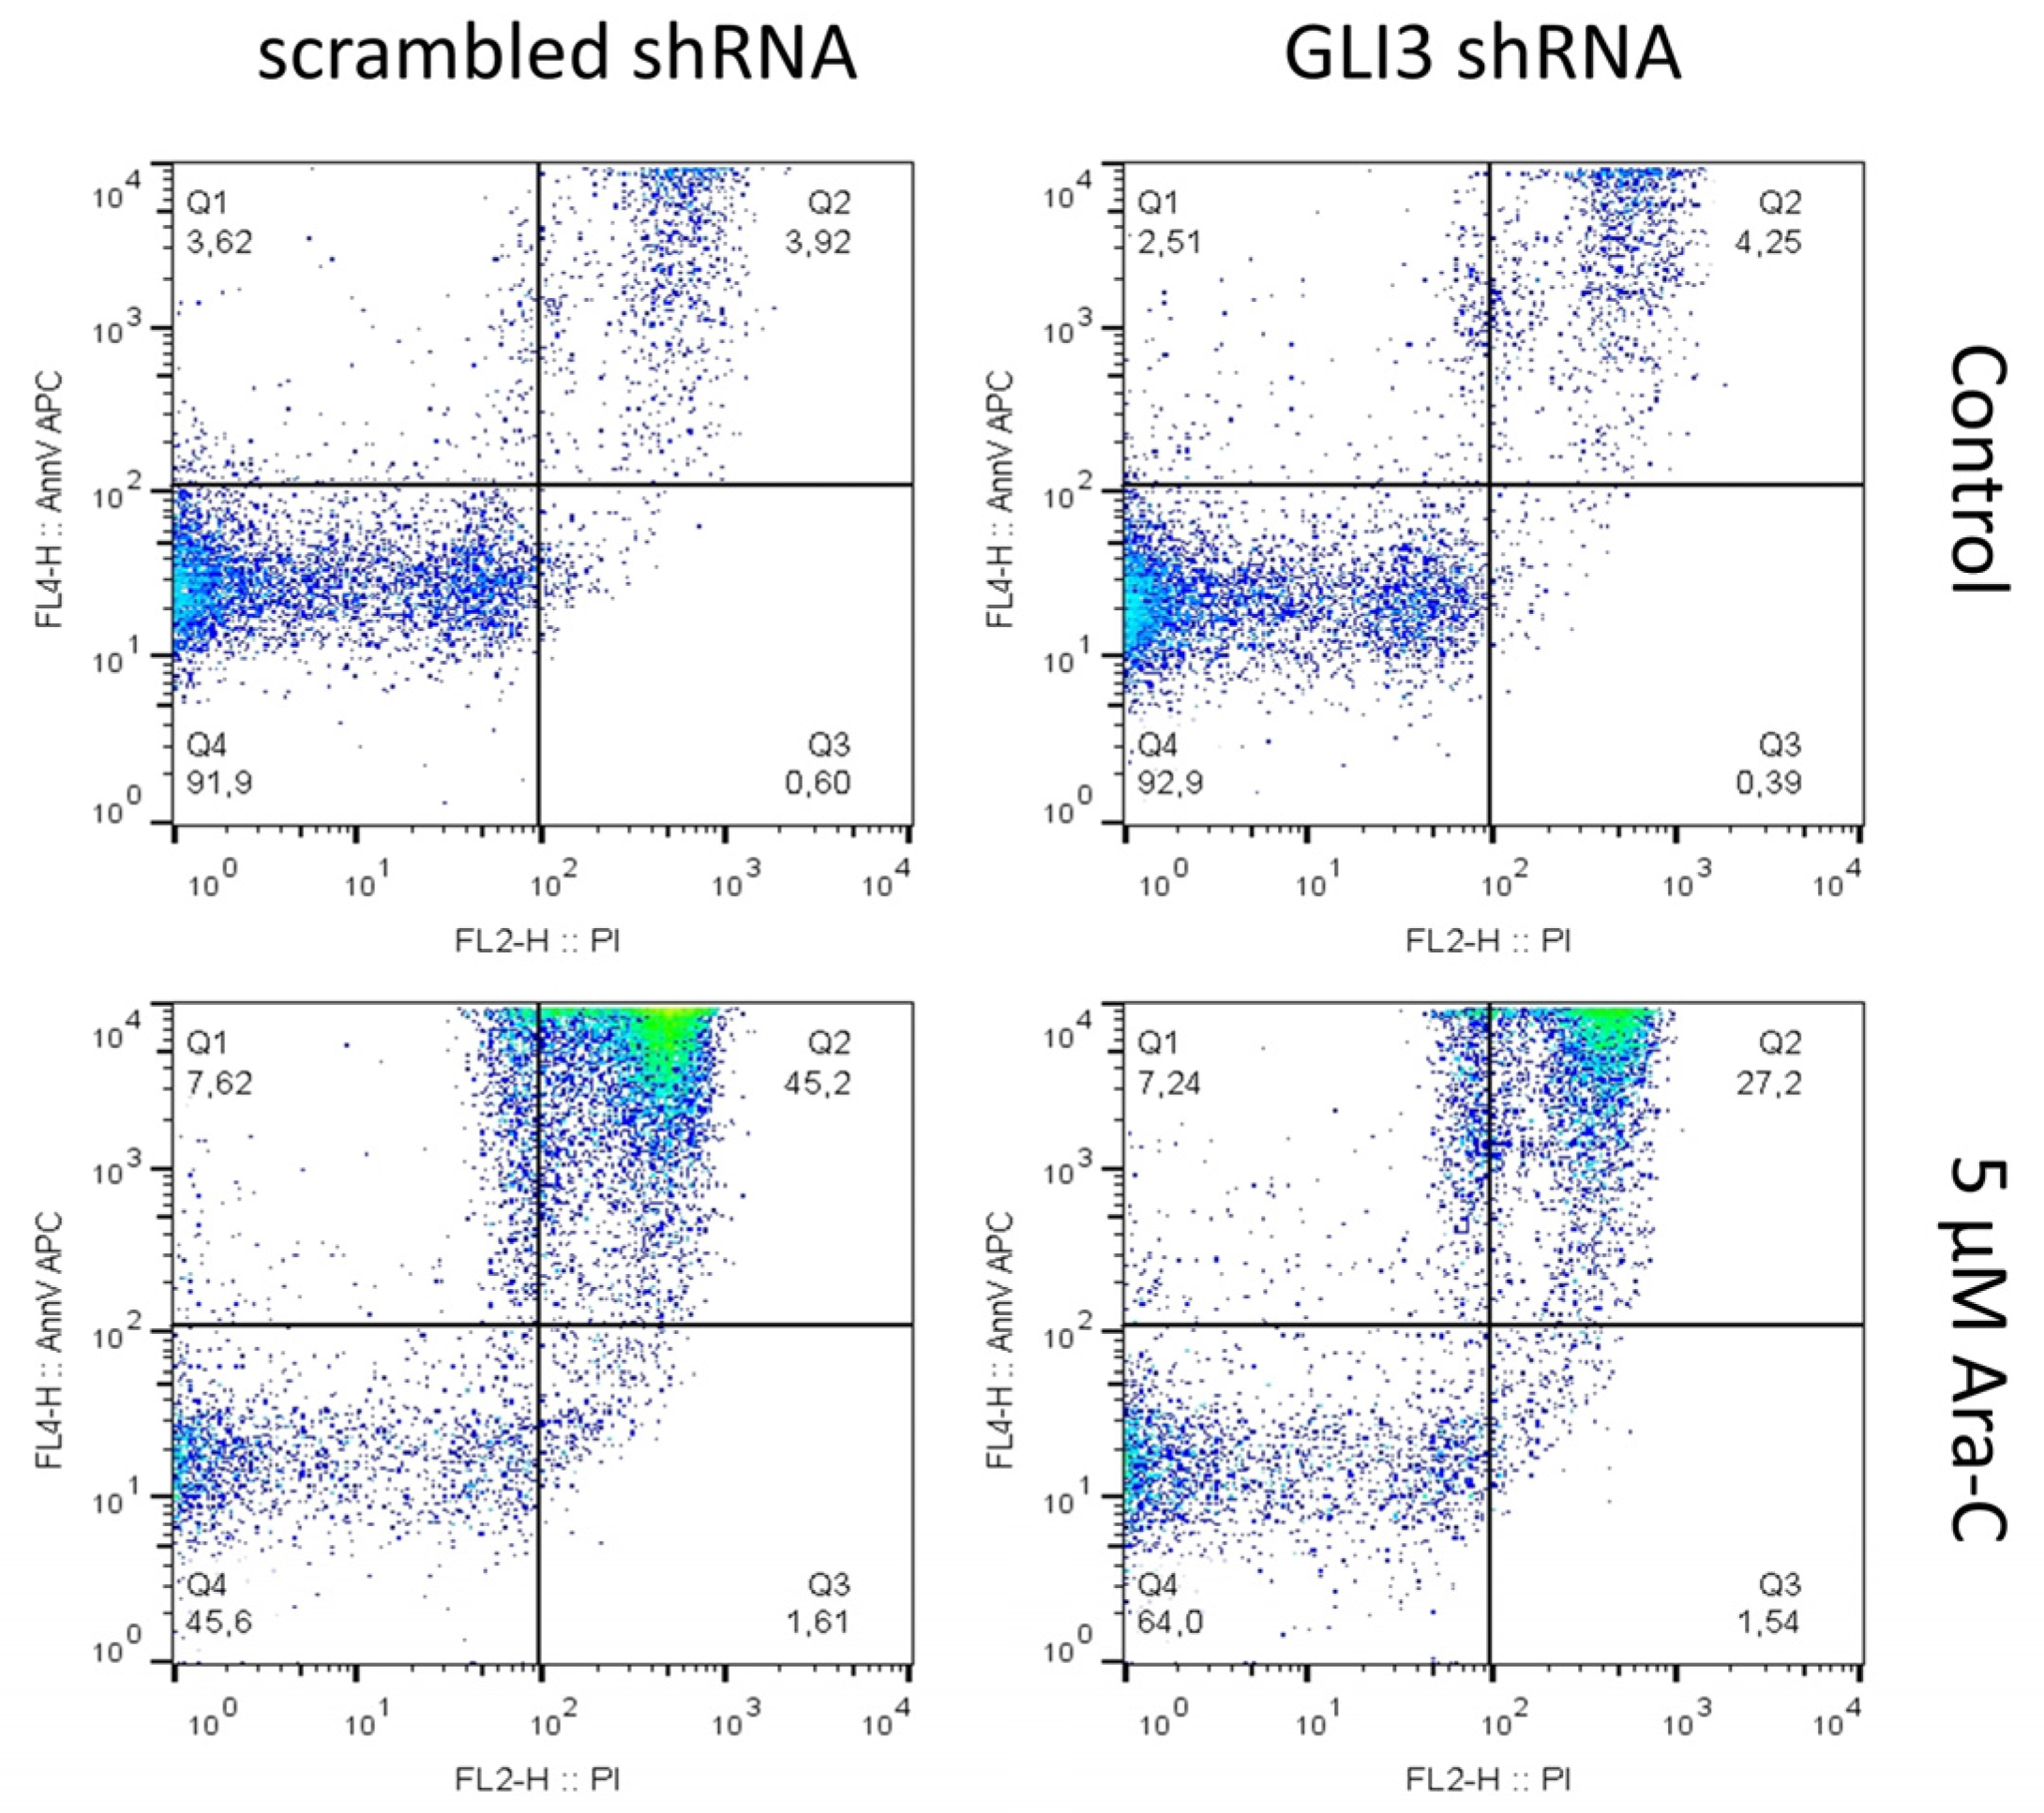
2.2. GLI3 Knockdown Promotes Resistance to Chemotherapy

For shRNA experiments, we chose the AML cell lines THP-1 and OCI-AML3 that express the highest levels of GLI3 (Figure A3). To investigate whether GLI3 silencing alone imparted drug resistance, we generated GLI3-knockdown cells by lentiviral transduction of two distinct GLI3-specific shRNAs. AML cells with GLI3 knockdown were compared with control cells containing nontargeting shRNA. Compared with the control, GLI3 expression was reduced to 39.6% (± 31.1%) in THP-1 cells and to 53.7% (± 31.4%) in OCI-AML3 cells (Figure 3).
We performed colony formation assays to investigate whether GLI3 knockdown affects the ability of leukemic cells to form colonies upon exposure to Ara-C. GLI3-knockdown and scrambled shRNA control AML cell lines THP-1 and OCI-AML3 were treated with Ara-C concentrations ranging from 25 to 100 nM. Colony numbers were counted on day 7 and normalized to the untreated control. For both GLI3-knockdown cell lines, Ara-C treatment reduced the colony numbers significantly compared to the control cells (Figure 4a,b).
THP-1 cells transduced with either GLI3-targeted shRNA or non-targeting control shRNA were investigated for apoptosis induction upon Ara-C treatment. Cells were treated with Ara-C concentration ranging from 1 µM to 10 µM, and apoptosis rates were determined by flow cytometry. GLI3 knockdown had the most pronounced effect on apoptosis rates in the presence of high concentrations of Ara-C, with significant differences observed at 2.5 and 5 µM (Figure 5).

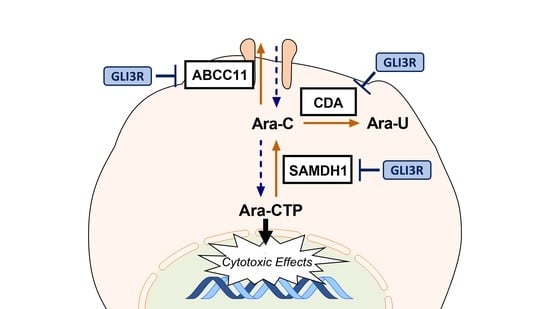
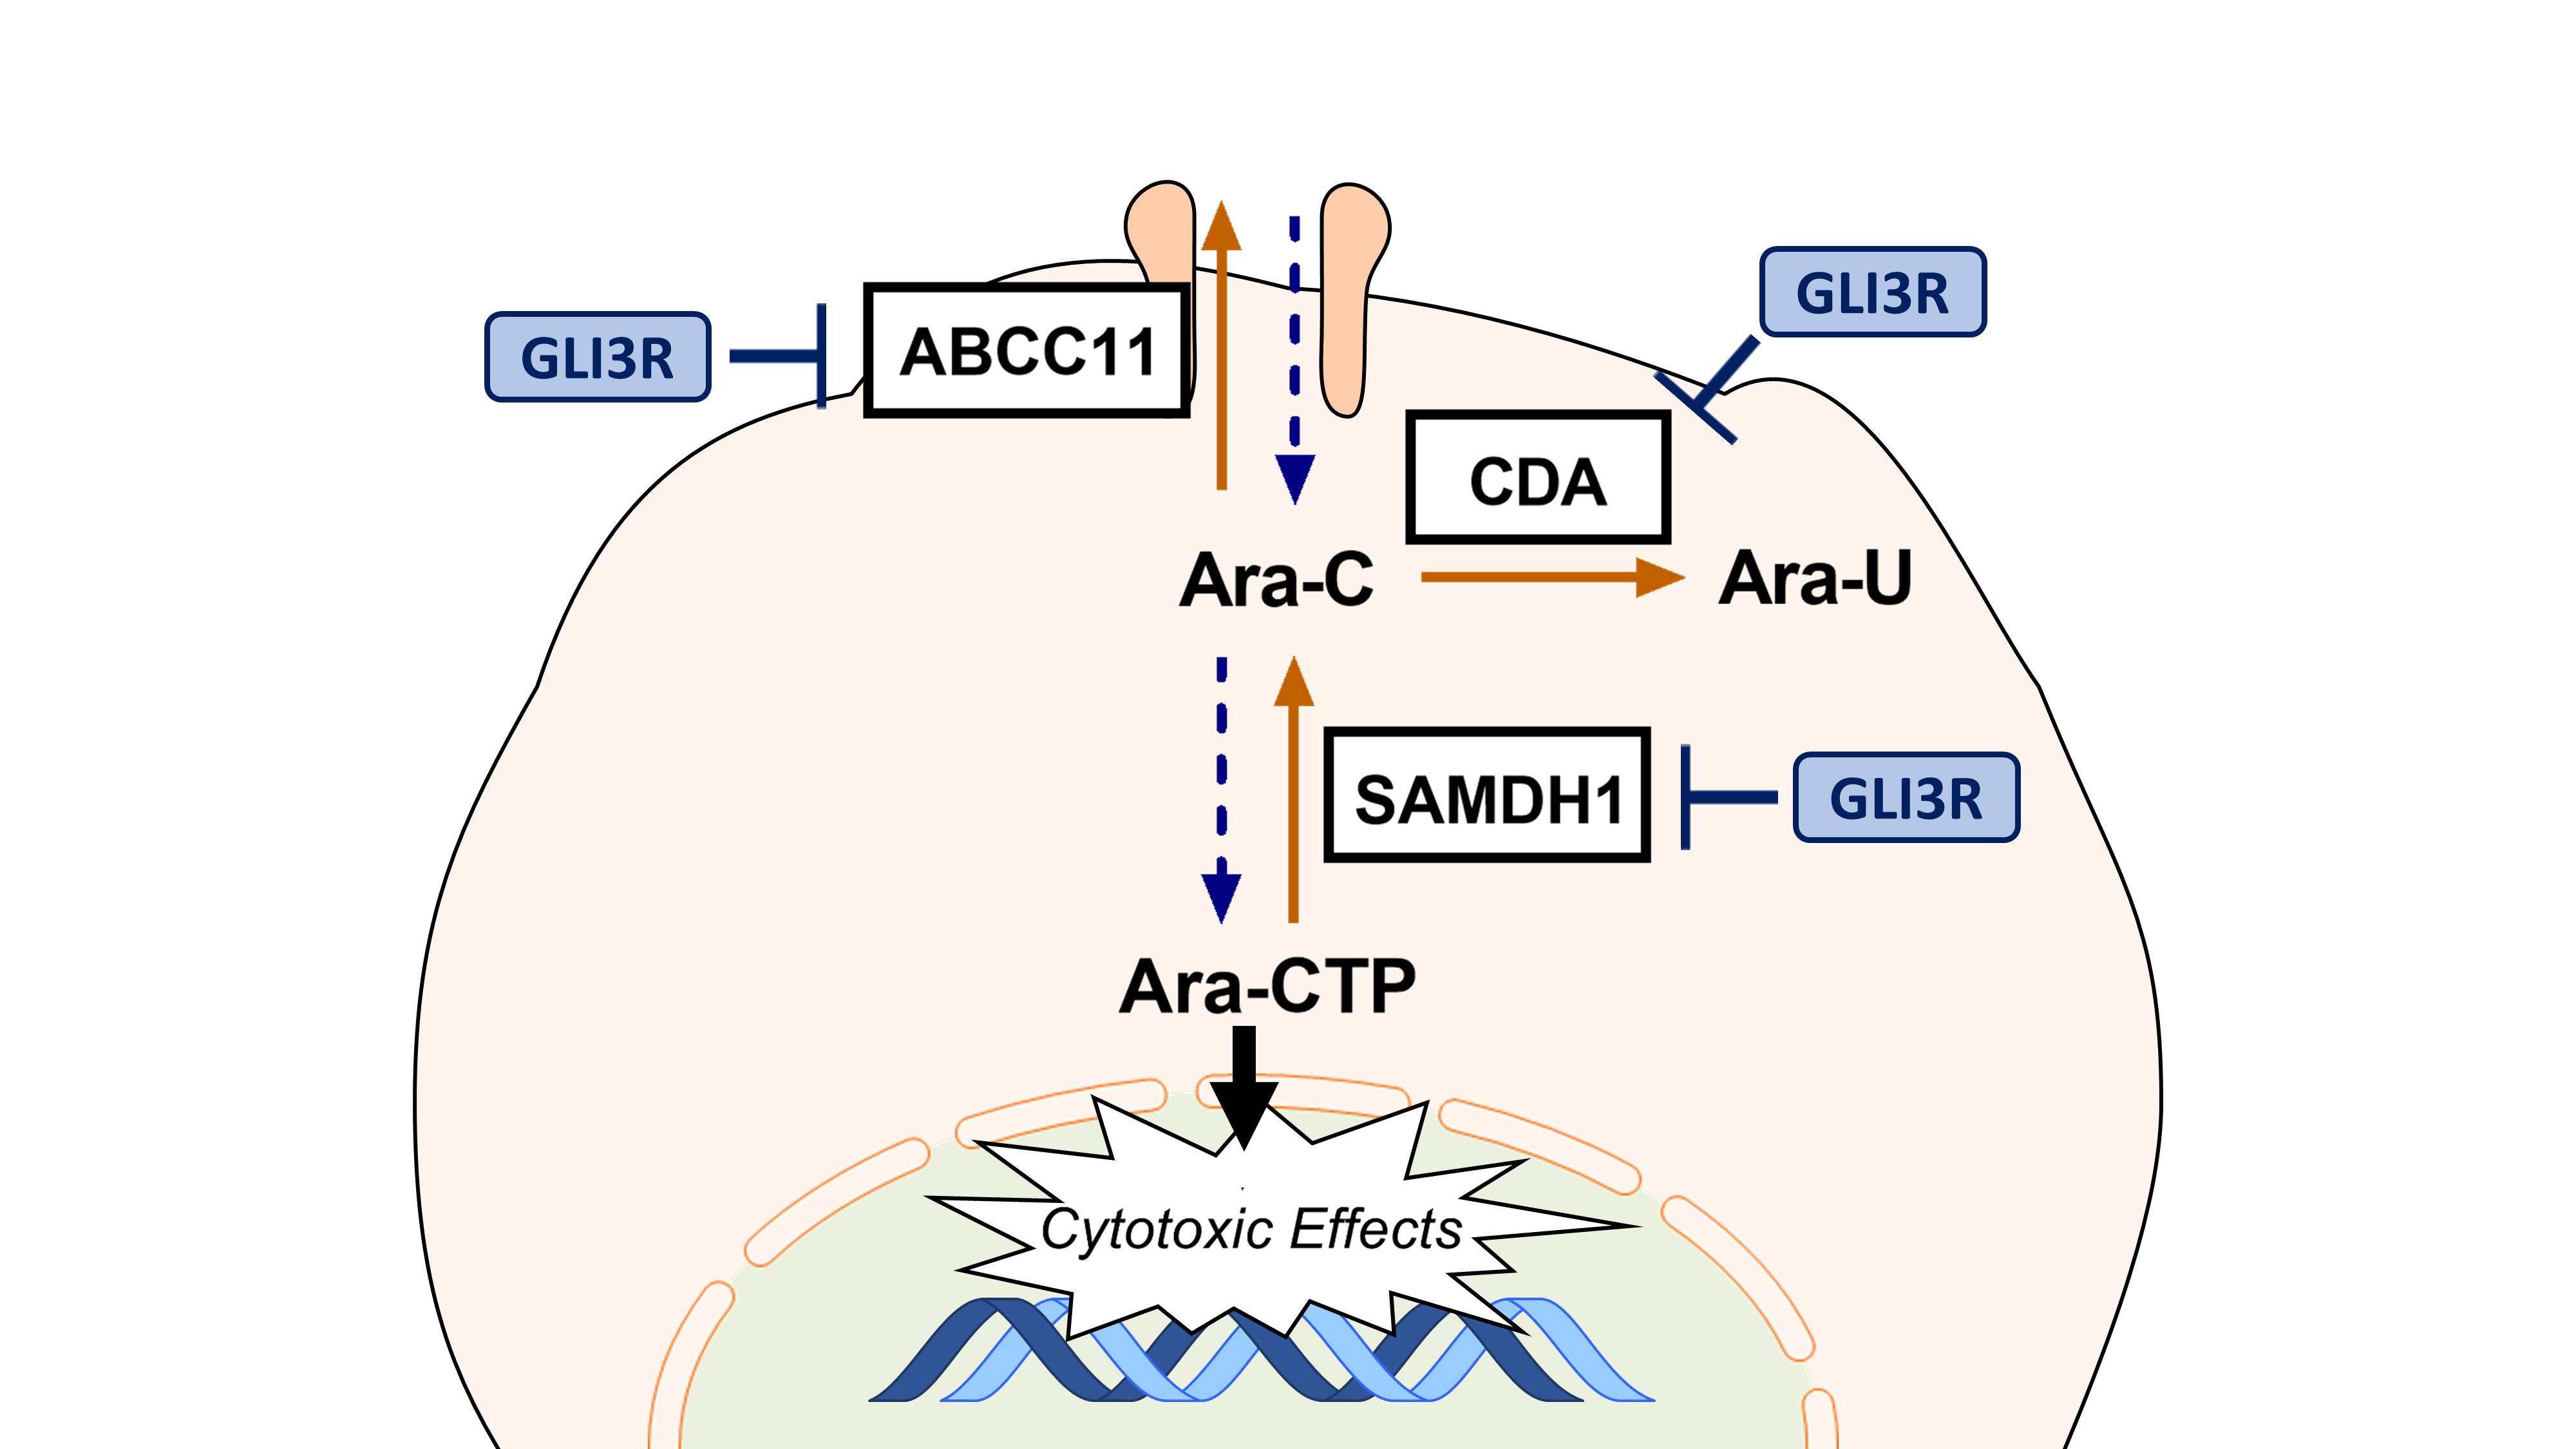
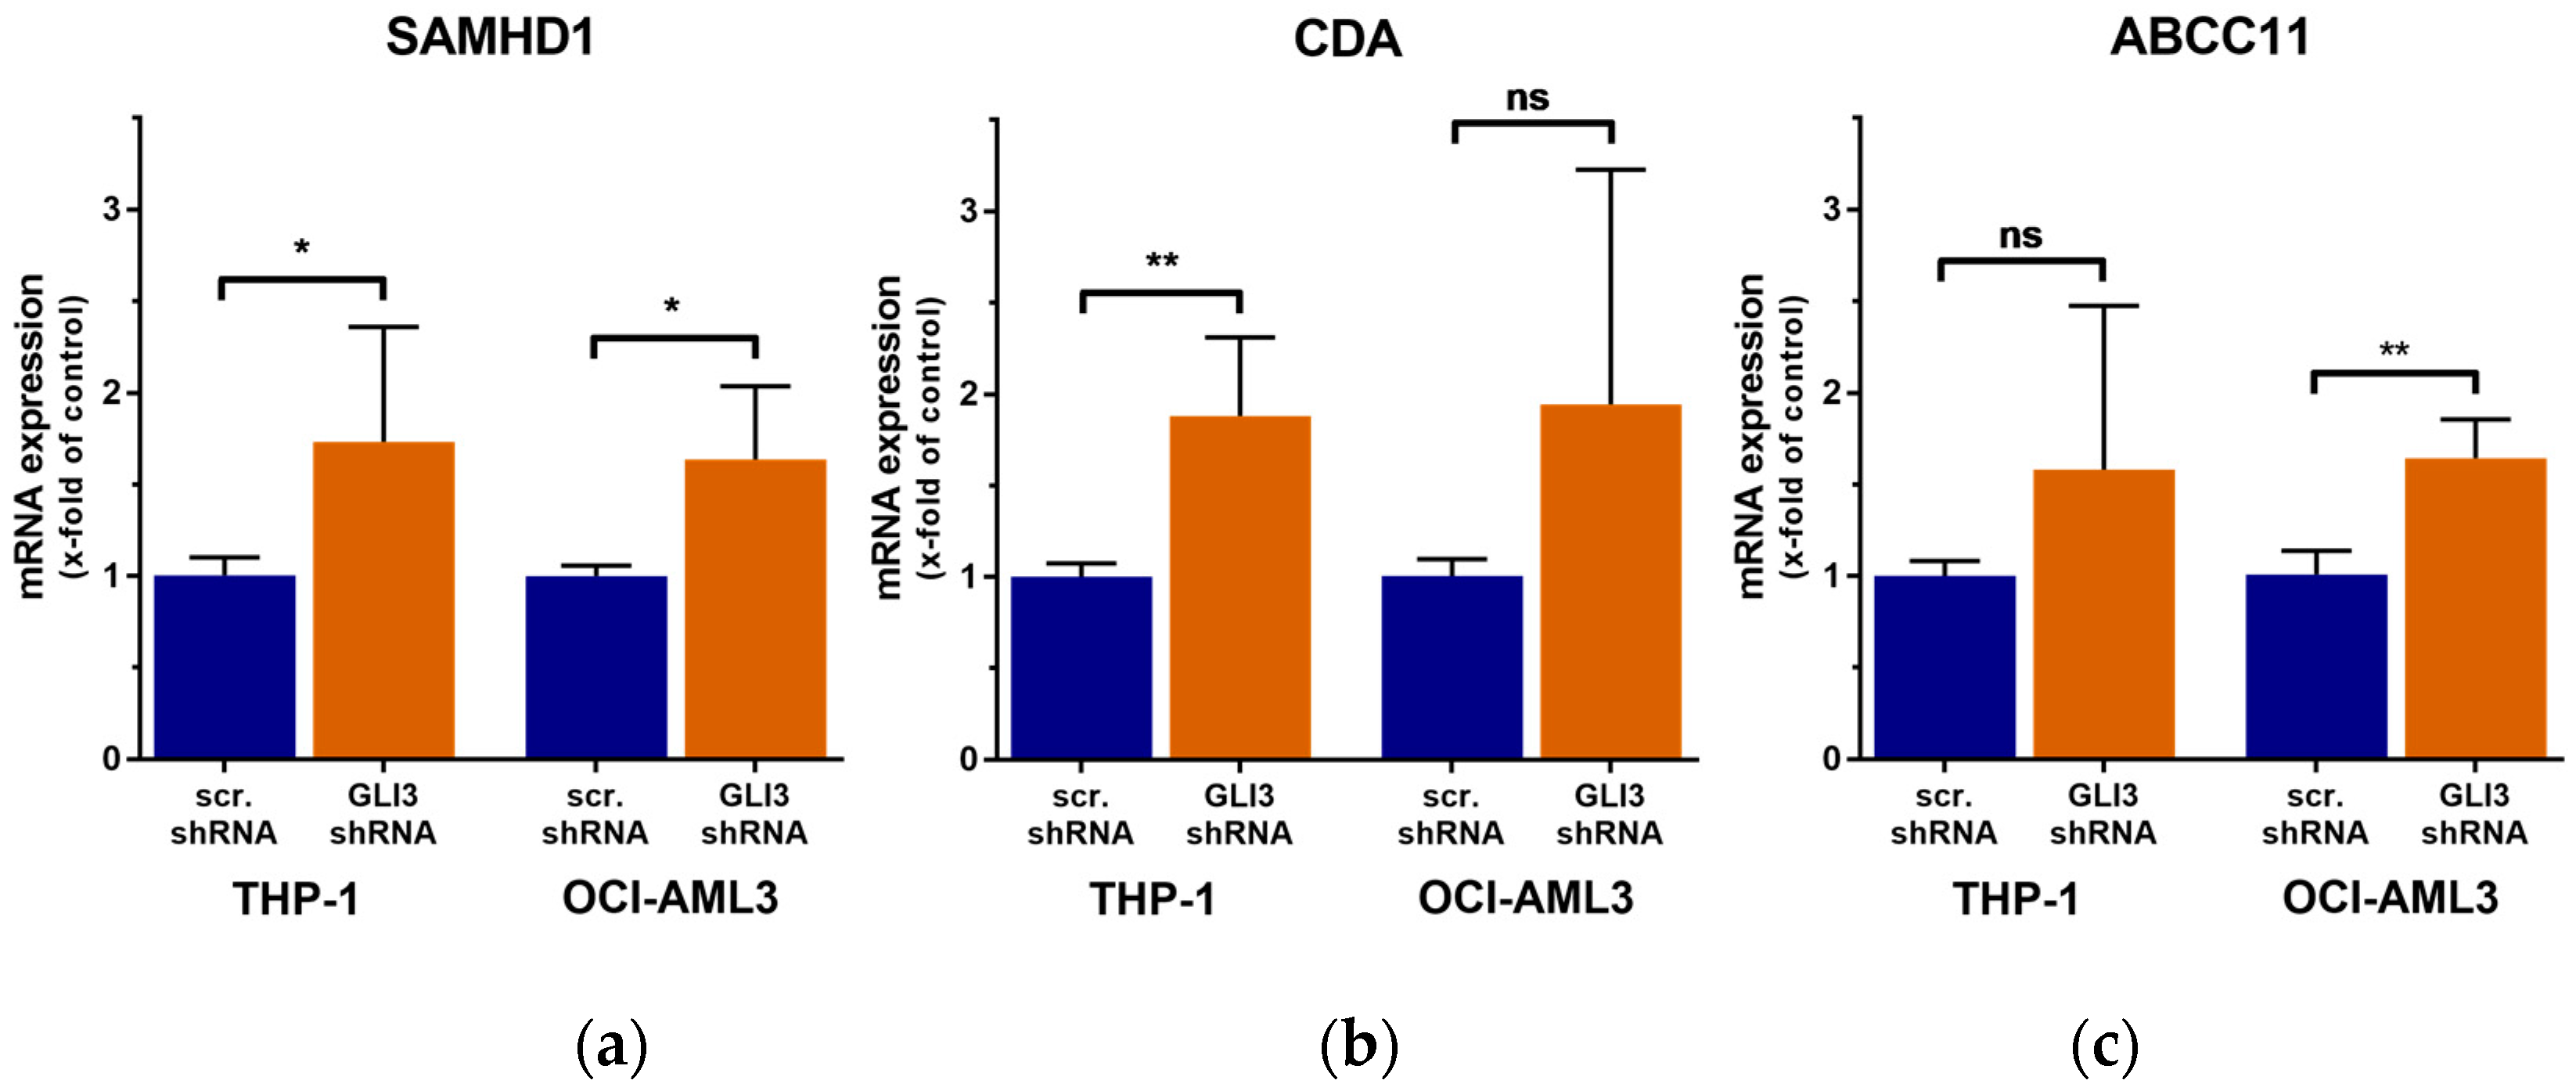
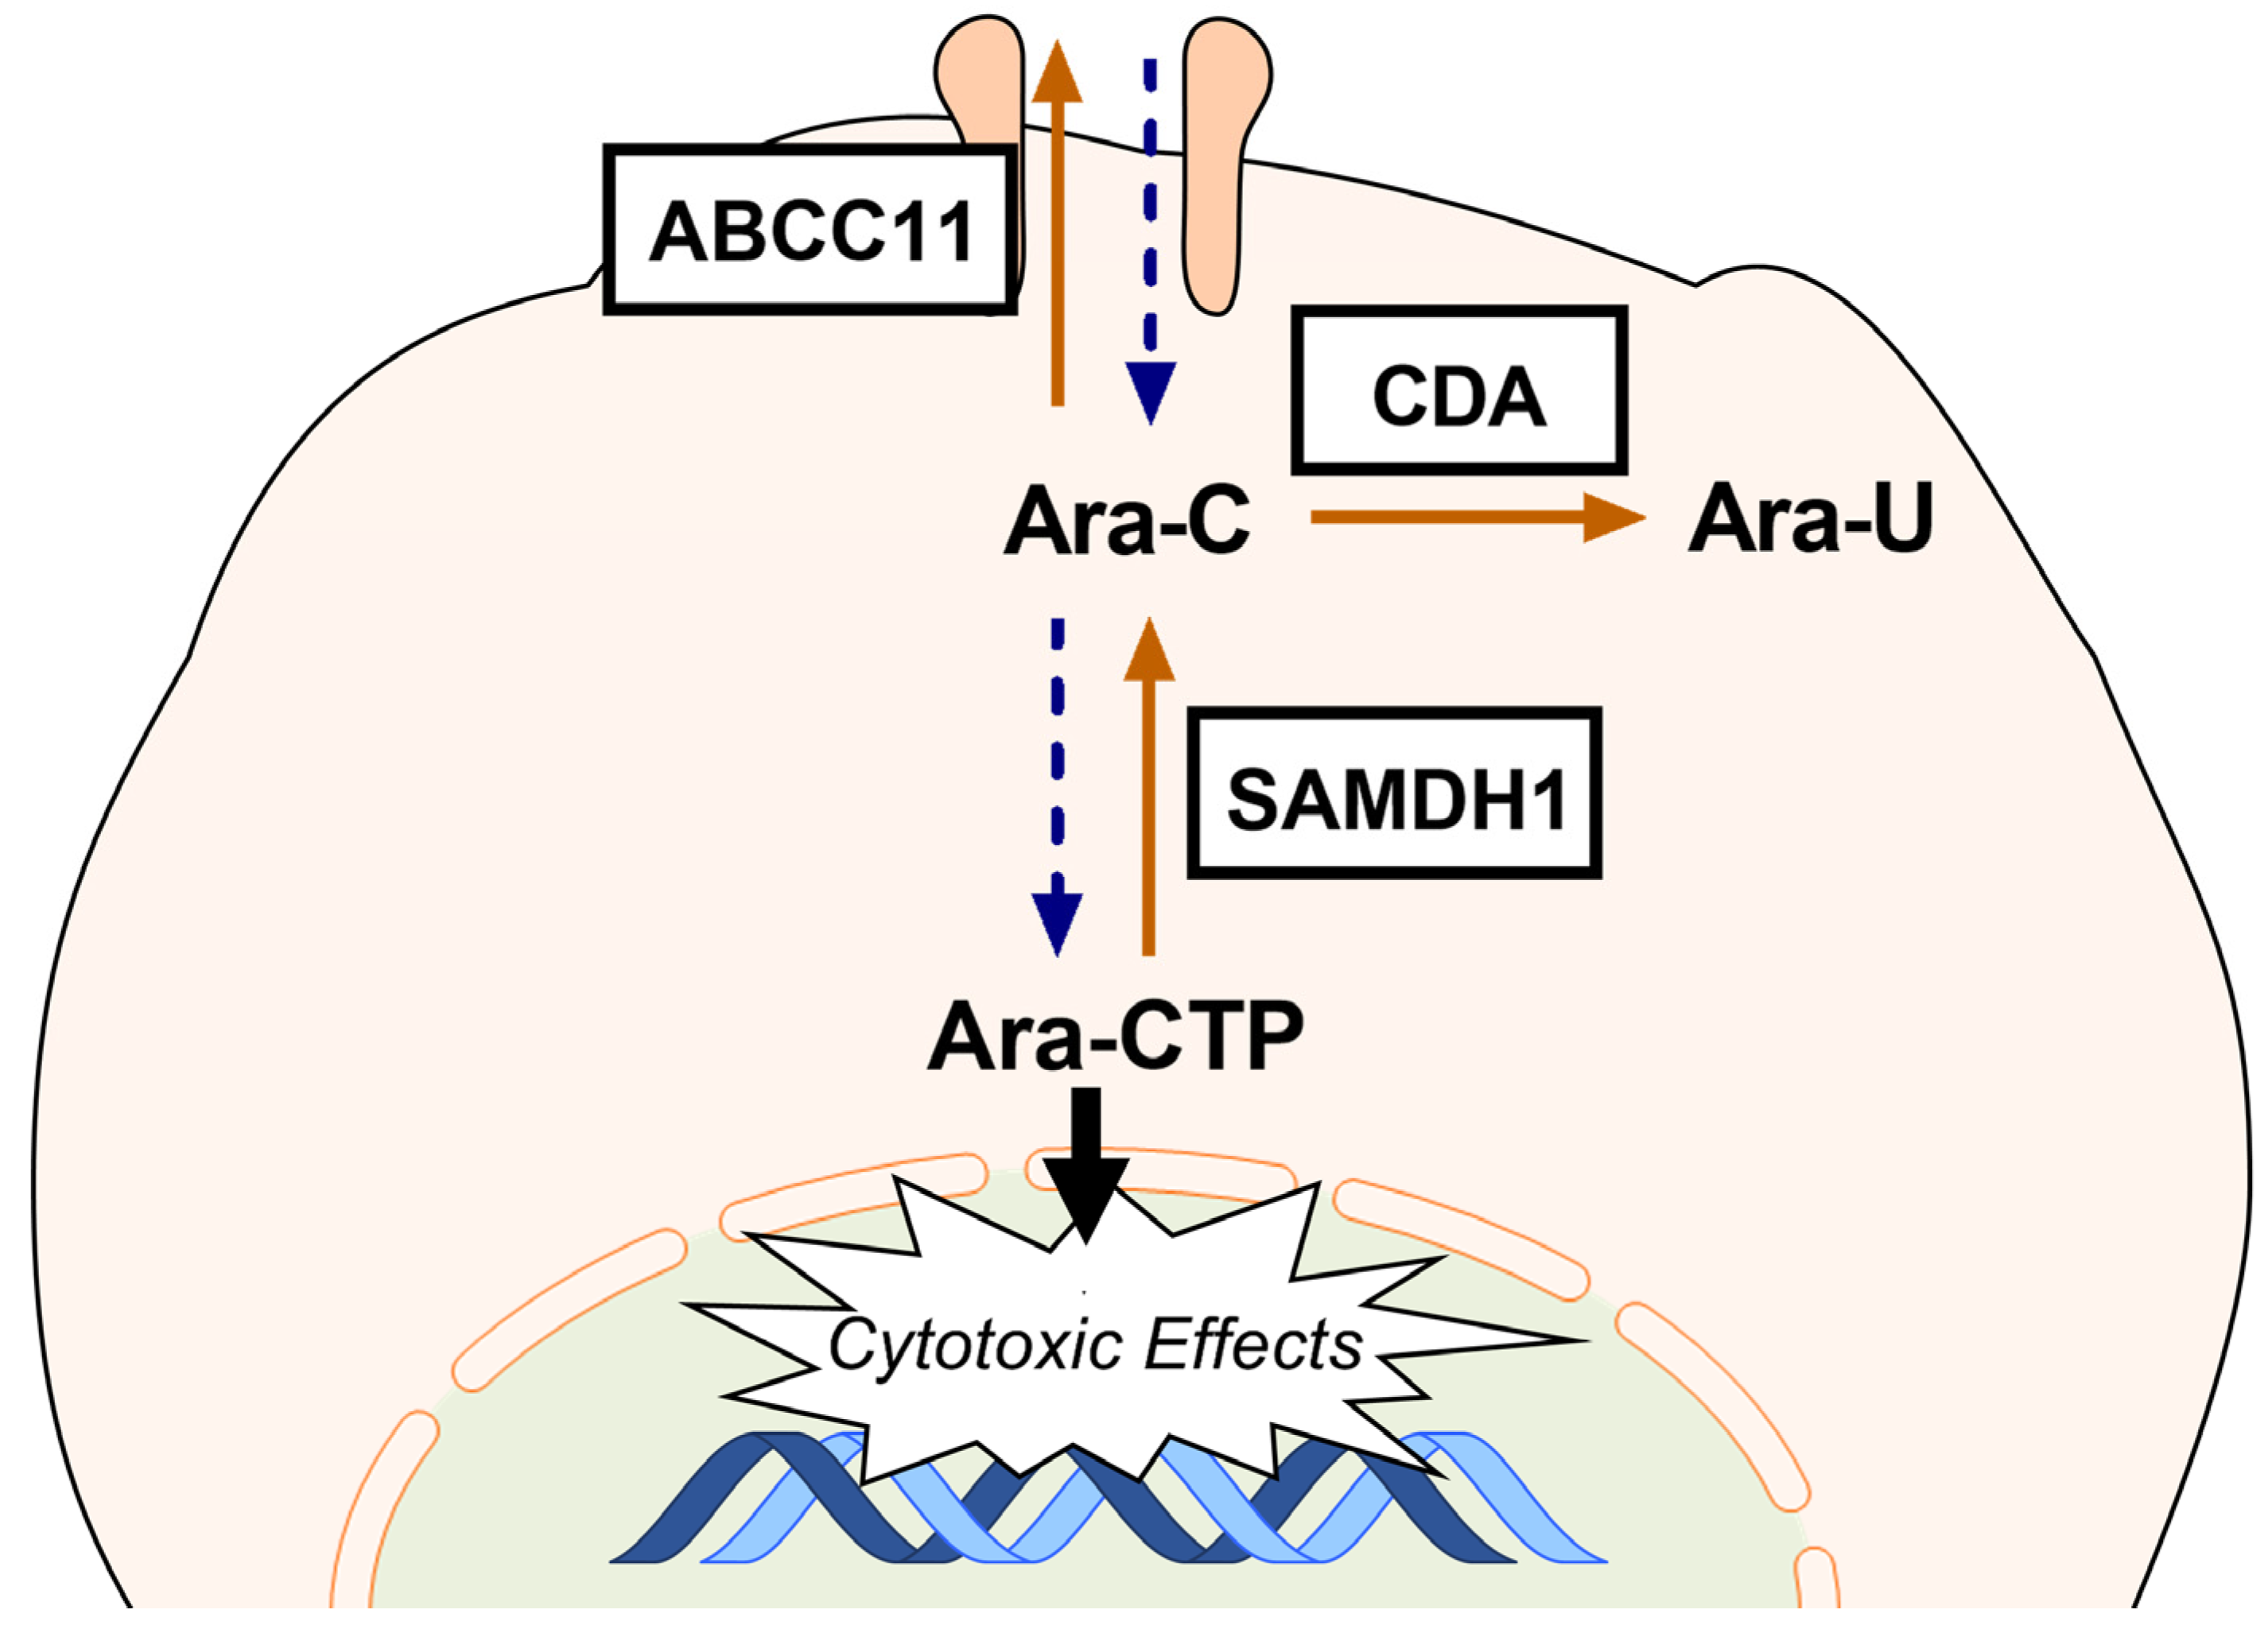
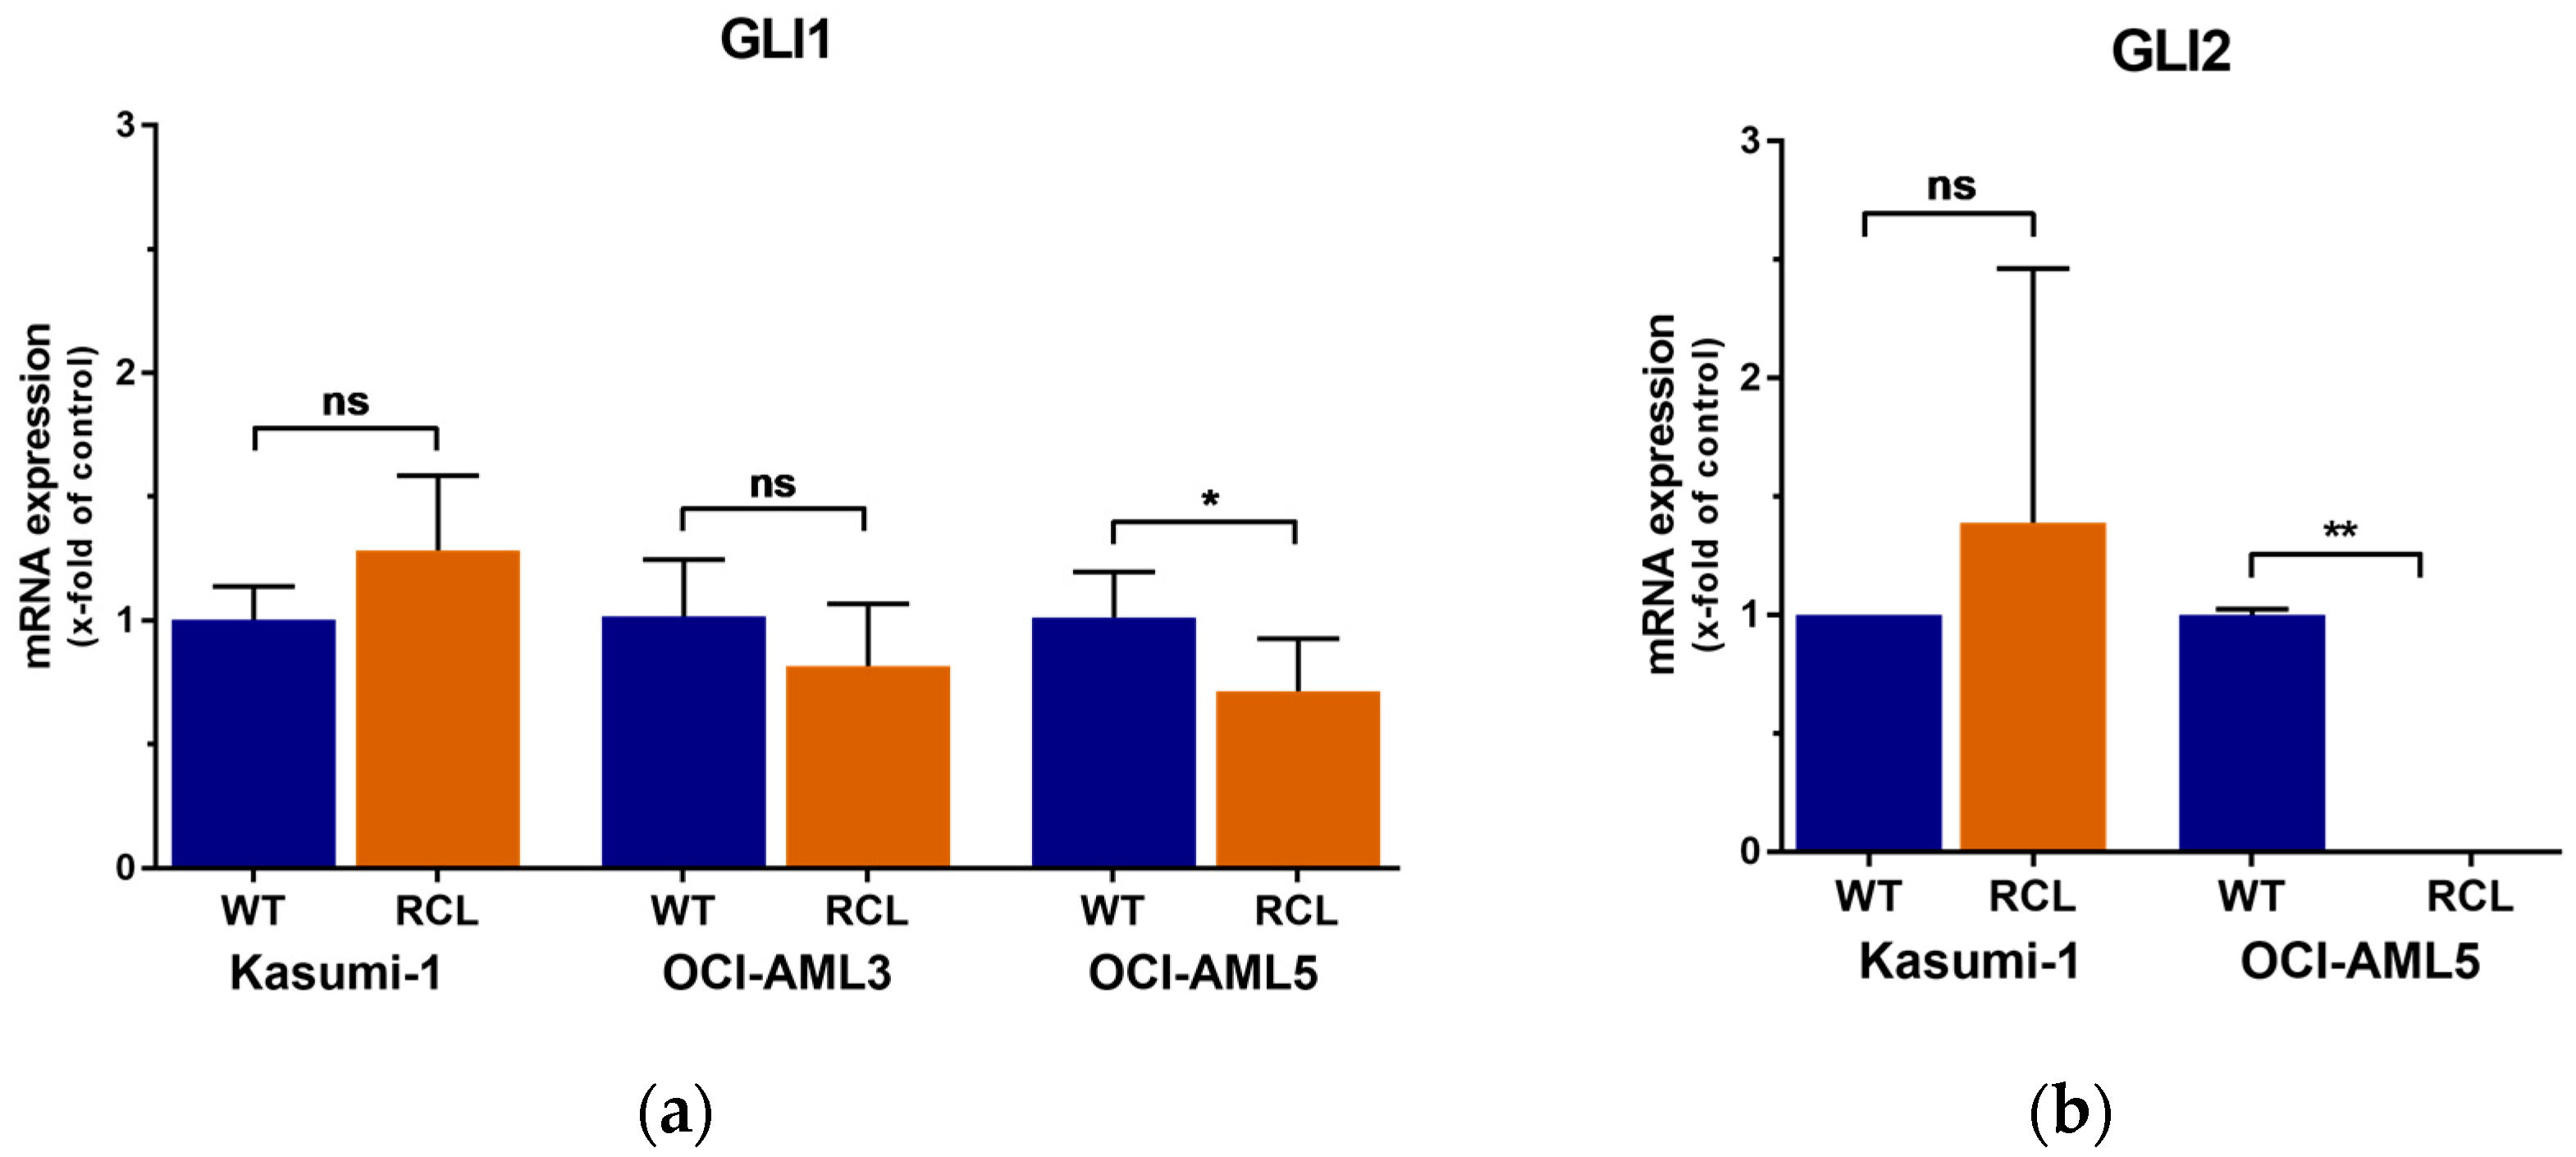
2.3. GLI3 Knockdown Impacts the Expression of Ara-C Resistance Genes

Because GLI3 knockdown reduced the sensitivity of AML cells to Ara-C, we next assessed whether gene knockdown was associated with expression changes of several genes involved in Ara-C metabolism and transport. RT-qPCR analysis revealed that SAMHD1, CDA, and ABCC11 (MRP8) were upregulated in GLI3-knockdown cells compared to cells transduced with control shRNA (Figure 6).
SAMHD1 and CDA are two key enzymes of the Ara-C metabolism that strongly reduce the intracellular level of the active Ara-C metabolite by promoting the conversion of Ara-C to an inactive state. In addition, GLI3 knockdown increased the expression of ABCC11, a membrane transporter with the ability to efflux nucleoside analogues, such as Ara-C, inhibiting their intracellular accumulation (Figure 7).

3. Discussion

Despite high responses to initial chemotherapy, the vast majority of AML patients relapses after remission due to persistent subpopulation of LSC, because of their drug-resistant phenotype. The LSC hypothesis is of substantial clinical relevance, offering an explanation for minimal residual disease, relapse, and therapy failure and highlighting the need to target these cells in order to achieve long-lasting remissions [24,25].
In mammals, three GLI transcription factors function as central mediators of HH signaling. GLI1 only functions as a transcriptional activator [26], while GLI2 and GLI3 can function both as activating and as inhibitory regulators [27]. Full-length GLI3 (GLI3FL), after phosphorylation and nuclear translocation, acts as a weak transcriptional activator [28]. The proteolytically processing of GLI2FL to its repressor form is not present in cultured cell lines or, at best, is inefficient. The majority of GLI2FL is degraded completely by the proteasome. In contrast, GLI3FL is efficiently processed to the truncated GLI3-repressor form that acts as a strong negative regulator of GLI-mediated transcription [11]. In the absence of HH signaling, GLI3 is predominantly in its repressor form and functions as a strong repressor of GLI-mediated transcription. The level of GLI signaling activity is largely determined by the balance between the transcriptional activators GLI1 and GLI2 and the repressor GLI3R [14,15].
To investigate the molecular changes underlying resistance to chemotherapy, we generated Ara-C-resistant strains of several AML cell lines and performed gene expression analysis of the HH pathway members using RT-qPCR and western blot. We showed that GLI3 expression was silenced in AML cells with acquired Ara-C resistance. A tumor suppressor role for GLI3R has been demonstrated in a medulloblastoma mouse model driven by GLI2ΔN expression. GLI2ΔN is a constitutively active GLI2 isoform. In the absence of cilia, GLI2ΔN induces medulloblastoma early in life by elimination of GLI3R [29]. The primary cilium is required for proteolytical processing of GLI3 to its repressor form [30]. Interestingly, it has been shown that primary cilia are absent in a high proportion of AML cells, possibly resulting in reduced intracellular GLI3R levels in most cases [31]. In line with this hypothesis, we could observe the absence of GLI3 expression in 74% of AML patient samples [10]. Consistent with these results, genetic analysis of The Cancer Genome Atlas AML dataset by Chaudhry et al. demonstrated that GLI3 expression is epigenetically silenced in most AML patients [18]. In agreement with these findings, when analyzing AML cell lines by RT-qPCR, GLI3 expression could not be detected in HL-60 cells, while low expression was found in MOLM-13 and OCI-AML5 AML cell lines. The highest GLI3 mRNA levels could be detected in Kasumi-1, THP-1, and OCI-AML3 cells (Appendix A, Figure A3). As previously mentioned, GLI3 is epigenetically silenced in a large number of AML cells, which suggests that GLI3 expression was also downregulated through epigenetic mechanisms in the Ara-C-resistant subclones. Accordingly, it has been demonstrated that GLI3 expression could be restored in AML cells treated with decitabine, a hypomethylating agent [18].
We showed that downregulation of GLI3 using shRNA reduced cell sensitivity towards Ara-C treatment. This effect was especially obvious in clonogenic assays of AML cells. This indicates that GLI3 downregulation might specifically protect leukemic stem or progenitor cells from the cytotoxic effects of Ara-C. Even though GLI3 silencing has never been described in the context of Ara-C resistance in AML, the association of HH pathway activity with chemotherapy resistance is well established in leukemia and other cancers. Queiroz and colleagues showed that activation of the HH pathway was associated with a multidrug-resistant phenotype of myeloid leukemia cells by upregulation of p-glycoprotein, a drug efflux pump [32]. Several studies demonstrated that the combination of Ara-C with the SMO inhibitor cyclopamine or the GLI inhibitor GANT-61 significantly enhanced the sensitivity of AML cell lines and primary CD34+ AML cells to Ara-C [21,33,34]. In a recent study, GLI1 expression was significantly higher in refractory patients compared to non-refractory cases. In addition, high expression of GLI1 was associated with rapid and repeated relapse. The authors could reverse resistance in the multiple drug-resistant HL-60 AML cell line using the SMO inhibitor NVP-LDE225, resulting in decreased protein expression of MRP1, which is a membrane drug transporter protein responsible for drug resistance and a poor prognosis in AML patients [35]. Furthermore, activated GLI signaling results in the upregulation of several drug transporters, including the ABC transporters ABCB1, ABCB2, and ABCG2, DNA repair mechanisms, and drug-modifying enzymes of the UDP glucuronosyltransferase (UGT1A) family [22,36,37,38]. However, while the role of GLI signaling in drug resistance is well established, the involvement of GLI3 gene expression in the development of chemotherapy resistance has not been investigated.
We could show that GLI3 downregulation resulted in increased expression of SAMHD1, CDA, and ABCC11 (MRP8). ATP-binding cassette C11 (ABCC11) is a member of the multidrug resistance-associated protein (MRP) family of ATP-binding cassette transporters, which functions as a nucleotide efflux pump and has been shown to reduce the intracellular levels of several clinically relevant nucleotide analogs, including the anticancer fluoropyrimidines and antiviral agents [39]. The expression of the efflux transporter ABCC11 correlates with poor prognosis in AML. Cells transfected with ABCC11 were resistant to Ara-C and showed reduced intracellular levels of Ara-C and its metabolites [40]. Intracellularly, Ara-C is activated through three phosphorylation steps leading to its active metabolite cytidine-5′-triphosphate (Ara-CTP), with phosphorylation of Ara-C to Ara-CMP by deoxycytidine kinase (DCK) being the rate-limiting step in its activation [41]. SAMHD1 is a phosphohydrolase that cleaves deoxynucleoside triphosphates (dNTP) into inorganic triphosphate and deoxyribonucleosides [42]. In leukemic cells exposed to Ara-C, SAMHD1 drastically reduces Ara-CTP levels through hydrolyzing Ara-CTP into inactive Ara-C [43]. Schneider et al. showed that inactivation of SAMHD1 strongly sensitizes AML cells to the cytotoxic effects of Ara-C in vitro and in vivo. Moreover, they showed that SAMHD1 expression is a negative predictor of the response to Ara-C-based treatment in AML patients [44]. In the activation of Ara-C, DCK competes with cytidine deaminase (CDA), which irreversibly deaminates Ara-C to its inactive uracil derivative uracil arabinoside (Ara-U) [45]. Ohta et al. showed that high CDA activity mediates the resistance of U937 monocytoid leukemia cells to Ara-C [46]. In an ex vivo cytotoxicity assay of AML patient samples, CDA expression was significantly lower in the Ara-C-sensitive group compared with intermediately sensitive or resistant samples and was found to be a strong predictor of Ara-C response [47]. In AML patients, high activity and expression of CDA was associated with poor initial response and predictive of remission duration [48,49].
In conclusion, we describe that loss of GLI3R through GLI3 gene silencing in AML cells results in acquired Ara-C resistance. GLI3R functions as a strong repressor of GLI-mediated transcription, and its downregulation by shRNA significantly reduces the effect of Ara-C in AML cells by modulating key enzymes involved in Ara-C metabolism.

4. Materials and Methods

4.1. Cell Lines and Cell Culture

The cell lines used in this study were either purchased from the DSMZ (Deutsche Sammlung von Mikroorganismen und Zellkulturen GmbH, Braunschweig, Germany) or authenticated by the Multiplex human Cell Authentication test (Multiplexion GmbH, Heidelberg, Germany). THP1 cells were maintained in RPMI 1640 medium (Gibco, Thermo Fisher Scientific, Waltham, MA, USA) supplemented with 10% fetal bovine serum (FBS Superior, Biochrom GmbH, Berlin, Germany). Kasumi-1 cells were cultured in RPMI 1640 medium supplemented with 20% FBS. OCI-AML3 cells were maintained in α-MEM medium (Gibco, Thermo Fisher Scientific, Waltham, MA, USA) supplemented with 20 % FBS. OCI-AML5 cells were cultured in α-MEM mediumsupplemented with 20 % FBS and 10 ng/mL GM-CSF (PeproTech GmbH, Hamburg, Germany). All cells were maintained in a humidified incubator with 5 % CO2 at 37 °C.

4.2. Generation of Ara-C-Resistant Cell Lines

Kasumi-1, OCI-AML3, and OCI-AML5 cells were cultivated with their respective IC95 Ara-C concentration continuously for several months. Cell viability was measured twice a week on day 3 and day 7, and Ara-C dose was adjusted according to cellular IC95 rates. Cells were routinely tested for Ara-C resistance in proliferation assays with Ara-C concentration up to 10,000 nM. Resistance was defined as IC80 > 10,000 nM Ara-C. All cell lines (resistant and parental) were routinely checked to ensure there was no mycoplasma contamination, using MycoAlert Mycoplasma Detection kit (Lonza Group AG, Basel, Swiss).

4.3. Lentiviral Transduction of AML Cell Lines with GLI3-Specific shRNA

Two different pLKO.1-puro vectors encoding GLI3 (#1, TRCN0000416117, sequence 5′-CCGGACAAGAGGTCCAAGATCAAACCTCGAGGTTTGATCTTGGACCTCTTGTTTTTTTG-3′ and #2, TRCN0000020506, sequence 5′-CCGGGCCATCCACATGGAATATCTTCTCGAGAAGATATTCCATGTGGATGGCTTTTT-3′) or scrambled shRNA (SHC002, non-target shRNA vector) were purchased from Sigma-Aldrich (Taufkirchen, Germany). We used the Lentiviral Gene Ontology Vector (LeGO) system for cloning and transfection into the AML cell lines (LeGO-C/Zeo and LeGO-G/Puro, respectively) [50]. Lentiviral particle-containing supernatants were generated in HEK293T cells co-transfected with the plasmids LeGO-C/Zeo + GLI3 shRNA (#1), LeGO-G/Puro + GLI3 shRNA (#2), or LeGO-G/Puro + scrambled shRNA in combination with pMD2.G-VSV-G and psPAX2-Gag-Pol, using calcium phosphate co-precipitation. THP-1 or OCI-AML3 were transduced either with non-targeting shRNA (negative control) or with two shRNA against GLI3, simultaneously. On day 3 after transduction, the transduced cells were selected by treatment with puromycin (2 μg/mL; Sigma-Aldrich, Taufkirchen, Germany) and/or zeocin (500 µg/mL; Thermo Fisher Scientific, Waltham, MA, USA) for 7 days prior to functional assays. The knock-down efficiency for GLI3 was determined using quantitative PCR analysis after 7 days of zeocin and/or puromycin selection. All work with lentiviral particles was done in an S2 facility after approval according to German law.

4.4. Proliferation Assay

Ara-C-resistant and parental cells of the AML cell lines Kasumi-1, OCI-AML3, and OCI-AML5 were plated in 24-well plates at a density of 150,000 cells/well in 500 µL of cell culture medium and cultured with increasing concentrations of Ara-C for 3 days. The number of viable cell was determined after 3 days with the Trypan Blue dye exclusion method, using the cell viability analyzer Vi-Cell ™ XR (Beckman Coulter, Brea, CA, USA).

4.5. Apoptosis Assay

THP-1 cells were seeded in 96-well plates at a density of 200,000 cells/well in 200 µL of cell culture medium and incubated with increasing concentrations of Ara-C for 48 h. For shRNA experiments, GLI3-knockdown AML cells were compared to the negative control containing non-targeting shRNA. Induction of apoptosis was measured after 48 h by flow cytometry using APC (allophycocyanin)-conjugated Annexin-V (MabTag GmbH, Friesoythe, Germany) and propidium iodide. Data analysis was performed using the FACS Calibur (BD Biosciences, San Jose, CA, USA) and FlowJo X (Version 10.0.7, BD Life Sciences, FlowJo, LLC, Ashland, OR, USA) Software.

4.6. Colony Formation Assay

Cell lines were seeded in cell culture dishes (35 × 10 mm, Sarstedt AG & Co. KG, Nümbrecht, Germany) at a density of 250 cells/mL in 1 mL of methylcellulose-based semi-solid medium (Methocult H4230, Stemcell Technologies, Vancouver, BC, Canada) supplemented with different concentrations of Ara-C. For shRNA experiments, the colony formation capacity of AML cell lines with GLI3 knockdown were compared to that of the negative controls containing non-targeting shRNA. After 7 days, the number of colonies was counted using an inverted microscope (Axiovert 25, Zeiss, Jena, Germany).

4.7. Protein Isolation and Western Blot Analysis

Proteins of OCI-AML3 and OCI-AML5 cells were extracted using the trichloroacetic acid method. Protein concentration was determined using the DC Protein Assay (Bio-Rad Laboratories, Inc., Hercules, CA, USA). For each sample, a total of 20 μg of protein was separated using a 4–12% tris-glycine SDS-polyacrylamide gel (Thermo Fisher Scientific, Waltham, MA, USA). The proteins were transferred to a nitrocellulose membrane, and the membrane was incubated with either polyclonal goat IgG anti-human/mouse GLI3 (AF3690, 1:2000, R&D Systems) or mouse anti-human β-ACTIN (sc-47778, 1:5000, Santa Cruz Biotechnology, Dallas, TX, USA) at 4 °C overnight. HRP-linked anti-goat immunoglobulins (P0449, 1:10,000) and anti-mouse IgG (NXA931, 1:10,000) secondary antibodies were purchased from Dako (Glostrup, Denmark) and GE Healthcare (Chicago, IL, USA), respectively. Membranes were incubated with secondary antibodies for 1 h at room temperature. Imaging was performed using the Amersham ECL Prime Western Blotting Detection Reagent (GE Healthcare, Chicago, IL, USA) and the Fusion SL 4 3500 WL chemiluminescence system (Vilber Lourmat, Eberhardzell, Germany).

4.8. Reverse Transcription and Quantitative PCR

Exon-spanning primers were designed with Primer 3 software (Whitehead Institute for Biomedical Research, Boston, MA, USA) or obtained from the GETPrime qPCR primer database [51]. RNA was extracted using innuPREP RNA Mini Kit 2.0 (Analytik Jena, Jena, Germany) and reverse-transcribed into cDNA using PrimeScript™ RT Master Mix (TaKaRa Bio Inc., Kusatsu, Japan). RT-qPCR analyses were carried out on the LightCycler 1.2 (Roche, Basel, Swiss) using the TB Green Premix Ex Taq II (TaKaRa Bio Inc., Kusatsu, Japan) over 40 PCR cycles. The relative expression of the target genes was normalized to that of the reference gene glyceraldehyde 3-phosphate dehydrogenase (GAPDH) and calculated using the Pfaffl method [52]. Primers are listed in Appendix A (Table A1).

4.9. Statistical Analysis

Data from the in vitro assays were statistically analyzed by the Welch’s t-test using GraphPad Prism 7 (GraphPad Software, Inc., San Diego, CA, USA). A p value < 0.05 was considered to be statistically significant.

Author Contributions

Conceptualization, F.F., W.F., and J.W.; Investigation, F.F., V.T., and J.M.; Methodology, F.F., V.T., and J.M.; Supervision, L.B., C.B., and J.W.; Writing —original draft, F.F., W.F., and J.W.; Writing—review & editing, L.B., V.T., J.M., and C.B. All authors have read and agreed to the published version of the manuscript.

Funding

This research was kindly supported by the Deutsche José Carreras Leukämie-Stiftung (Grant number PSD 04/2017).

Acknowledgments

The LeGO Vectors were kindly provided by Kristoffer Riecken, Department for Stem Cell Transplantation at the University Medical Center Hamburg-Eppendorf.

Conflicts of Interest

W. Fiedler has an advisory and consulting role for Amgen, Morphosys; has an advisory role for ARIAD/Incyte, Novartis, Pfizer; Celgene, Jazz Pharmaceuticals, Daiichi Sankyo; has royalties for Amgen; received support for meeting attendance from Amgen, Gilead, Servier, BMS, Daiichi Sankyo; and received research funding from Amgen, Pfizer, outside the submitted work. Bokemeyer reports personal fees from Sanofi Aventis, personal fees from Merck KgA, personal fees from Bristol-Myers Squibb, personal fees from Merck Sharp & Dohme, personal fees from Lilly Imclone, personal fees from Bayer Healthcare, personal fees from GSO Contract Research, personal fees from AOK Rheinland-Hamburg, personal fees from Novartis, outside the submitted work. No potential conflicts of interest were disclosed by the other authors. The funders had no role in the design of the study; in the collection, analyses, or interpretation of data; in the writing of the manuscript, or in the decision to publish the results.

Abbreviations

AMLacute myeloid leukemia
LSCleukemic stem cells
HSChematopoietic stem cells
HHhedgehog (signaling pathway)
GLIglioma-associated oncogene homolog family zinc finger protein
GLI3FLGLI3, full length
GLI3RGLI3, repressor form
Ara-Ccytarabine, cytosine arabinoside
Ara-Uuracil arabinoside
Ara-CTParacytidine-5′-triphosphate
SAMHD1SAM and HD domain-containing protein 1
CDAcytidine deaminase
ABCC11ATP-binding cassette C11
MRP8multidrug resistance-associated protein 8
WTwildtype
RCLresistant cell line
shRNAsmall hairpin RNA
APCallophycocyanin

Appendix A

Table A1. Primers used in this study.
GeneSenseAnti-Sense
GAPDHGTCAGTGGTGGACCTGACCTTGCTGTAGCCAAATTCGTTG
GLI1CTACATCAACTCCGGCCAATCGGCTGACAGTATAGGCAGA
GLI2GGCCATCCACATGGAATATCTGAAGAGCTGCTACGGGAAT
GLI3GGCCATCCACATGGAATATCTGAAGAGCTGCTACGGGAAT
SAMHD1ATTGAAAGACGCACGAGAGAAGAGATTCATAGTCCTCCCT
CDAGAGAATCTTCAAAGGGTGCATTGTACCCTTCTGAGACGG
ABCC11CCTACTTCATTATTGGATACACTGCCTTGTCATGAATACCGCCAG
Figure A1. Cell viability of resistant and parental cell lines following treatment with increasing Ara-C concentrations. Resistant (RCL) and wildtype (WT) variants of AML cell lines Kasumi-1 (a), OCI-AML3 (b), OCI-AML5 (c) were plated with different concentrations of Ara-C ranging from 100 nM to 10,000 nM. Cell viability was determined after 3 days with the Trypan Blue dye exclusion method.
Ijms 21 05084 g0a1
Figure A2. No consistently significant changes in GLI1 and GLI2 mRNA expression in Ara-C-resistant cell lines. (a) WT and Ara-C RCL Kasumi-1, OCI-AML3, and OCI-AML5 were analyzed for GLI1 and GLI2 mRNA levels by RT-qPCR. Relative GLI2 expression could not be analyzed for OCI-AML3, as the GLI2 expression levels were below the detection level. Error bars represent the mean values ± standard deviation; * p < 0.05, ** p < 0.01 in the Welch’s t-test; ns, not significant.
Ijms 21 05084 g0a2
Figure A3. Expression levels of GLI3 in different AML cell lines. GLI3 expression in AML cell lines Kasumi-1, THP-1, OCI-AML3, OCI-AML5, MOLM-13, and HL-60 was quantified by RT-qPCR. ΔCT values were calculated with the following formula: ΔCT = CT(GLI3) −CT(GAPDH). Small ΔCT values indicate high GLI3 expression. If no expression was found, the CT values were equated with the total cycle number (50 cycles). No GLI3 expression was found in HL-60 cells. Error bars represent the mean values ± standard deviation.
Ijms 21 05084 g0a3
Figure A4. Representative flow cytometry plots for the treatment of THP-1 cells transduced with GLI3-targeted shRNA or scrambled shRNA control with 5 µM Ara-C. Induction of apoptosis was measured after 48 h by flow cytometry using Annexin V-APC and propidium iodide.
Ijms 21 05084 g0a4

References

  1. Löwenberg, B.; Downing, J.R.; Burnett, A. Acute Myeloid Leukemia. N. Engl. J. Med. 1999, 341, 1051–1062. [Google Scholar] [CrossRef] [PubMed]
  2. Shipley, J.L.; Butera, J.N. Acute myelogenous leukemia. Exp. Hematol. 2009, 37, 649–658. [Google Scholar] [CrossRef] [PubMed]
  3. Gentles, A.J.; Plevritis, S.K.; Majeti, R.; Alizadeh, A.A. Association of a leukemic stem cell gene expression signature with clinical outcomes in acute myeloid leukemia. JAMA J. Am. Med. Assoc. 2010, 304, 2706–2715. [Google Scholar] [CrossRef] [PubMed] [Green Version]
  4. Lapidot, T.; Sirard, C.; Vormoor, J.; Murdoch, B.; Hoang, T.; Caceres-Cortes, J.; Minden, M.; Paterson, B.; Caligiuri, M.A.; Dick, J.E. A cell initiating human acute myeloid leukaemia after transplantation into SCID mice. Nature 1994, 367, 645–648. [Google Scholar] [CrossRef] [PubMed]
  5. Dick, J.E. Stem cell concepts renew cancer research. Blood 2008, 112, 4793–4807. [Google Scholar] [CrossRef] [Green Version]
  6. Lane, S.W.; Scadden, D.T.; Gilliland, D.G. The leukemic stem cell niche: Current concepts and therapeutic opportunities. Blood 2009, 114, 1150–1157. [Google Scholar] [CrossRef] [Green Version]
  7. Irvine, D.A.; Copland, M. Targeting hedgehog in hematologic malignancy. Blood 2012, 119, 2196–2204. [Google Scholar] [CrossRef] [Green Version]
  8. Hui, C.; Angers, S. Gli Proteins in Development and Disease. Annu. Rev. Cell Dev. Biol. 2011, 27, 513–537. [Google Scholar] [CrossRef] [Green Version]
  9. Teglund, S.; Toftgård, R. Hedgehog beyond medulloblastoma and basal cell carcinoma. Biochim. Biophys. Acta Rev. Cancer 2010, 1805, 181–208. [Google Scholar] [CrossRef]
  10. Wellbrock, J.; Latuske, E.; Kohler, J.; Wagner, K.; Stamm, H.; Vettorazzi, E.; Vohwinkel, G.; Klokow, M.; Uibeleisen, R.; Ehm, P.; et al. Expression of hedgehog pathway mediator GLI represents a negative prognostic marker in human acute myeloid leukemia and its inhibition exerts Antileukemic effects. Clin. Cancer Res. 2015, 21, 2388–2398. [Google Scholar] [CrossRef] [Green Version]
  11. Pan, Y.; Wang, B. A novel protein-processing domain in Gli2 and Gli3 differentially blocks complete protein degradation by the proteasome. J. Biol. Chem. 2007, 282, 10846–10852. [Google Scholar] [CrossRef] [Green Version]
  12. Kinzler, K.W.; Vogelstein, B. The GLI gene encodes a nuclear protein which binds specific sequences in the human genome. Mol. Cell. Biol. 1990, 10, 634–642. [Google Scholar] [CrossRef] [Green Version]
  13. Niewiadomski, P.; Niedziółka, S.M.; Markiewicz, Ł.; Uśpieński, T.; Baran, B.; Chojnowska, K. Gli Proteins: Regulation in Development and Cancer. Cells 2019, 8, 147. [Google Scholar] [CrossRef] [PubMed] [Green Version]
  14. Lipinski, R.J.; Gipp, J.J.; Zhang, J.; Doles, J.D.; Bushman, W. Unique and complimentary activities of the Gli transcription factors in Hedgehog signaling. Exp. Cell Res. 2006, 312, 1925–1938. [Google Scholar] [CrossRef]
  15. Petrova, R.; Garcia, D.R.; Joyner, A.L. Titration of GLI3 repressor activity by sonic hedgehog signaling is critical for maintaining multiple adult neural stem cell and astrocyte functions. J. Neurosci. 2013, 33, 17490–17505. [Google Scholar] [CrossRef] [PubMed] [Green Version]
  16. Gu, D.; Xie, J. Non-canonical Hh signaling in cancer—Current understanding and future directions. Cancers 2015, 7, 1684–1698. [Google Scholar] [CrossRef] [PubMed] [Green Version]
  17. Latuske, E.M.; Stamm, H.; Klokow, M.; Vohwinkel, G.; Muschhammer, J.; Bokemeyer, C.; Jücker, M.; Kebenko, M.; Fiedler, W.; Wellbrock, J. Combined inhibition of GLI and FLT3 signaling leads to effective anti-leukemic effects in human acute myeloid leukemia. Oncotarget 2017, 8, 29187–29201. [Google Scholar] [CrossRef] [PubMed] [Green Version]
  18. Chaudhry, P.; Singh, M.; Triche, T.J.; Guzman, M.; Merchant, A.A. GLI3 repressor determines Hedgehog pathway activation and is required for response to SMO antagonist glasdegib in AML. Blood 2017, 129, 3465–3475. [Google Scholar] [CrossRef]
  19. Zhang, W.; Yu, F.; Wang, Y.; Zhang, Y.; Meng, L.; Chi, Y. Rab23 promotes the cisplatin resistance of ovarian cancer via the Shh-Gli-ABCG2 signaling pathway. Oncol. Lett. 2018, 15, 5155–5160. [Google Scholar] [CrossRef] [Green Version]
  20. Yoon, C.; Park, D.J.; Schmidt, B.; Thomas, N.J.; Lee, H.J.; Kim, T.S.; Janjigian, Y.Y.; Cohen, D.J.; Yoon, S.S. CD44 expression denotes a subpopulation of gastric cancer cells in which Hedgehog signaling promotes chemotherapy resistance. Clin. Cancer Res. 2014, 20, 3974–3988. [Google Scholar] [CrossRef] [Green Version]
  21. Kobune, M.; Takimoto, R.; Murase, K.; Iyama, S.; Sato, T.; Kikuchi, S.; Kawano, Y.; Miyanishi, K.; Sato, Y.; Niitsu, Y.; et al. Drug resistance is dramatically restored by hedgehog inhibitors in CD34+ leukemic cells. Cancer Sci. 2009, 100, 948–955. [Google Scholar] [CrossRef] [PubMed]
  22. Zahreddine, H.A.; Culjkovic-Kraljacic, B.; Assouline, S.; Gendron, P.; Romeo, A.A.; Morris, S.J.; Cormack, G.; Jaquith, J.B.; Cerchietti, L.; Cocolakis, E.; et al. The sonic hedgehog factor GLI1 imparts drug resistance through inducible glucuronidation. Nature 2014, 511, 90–93. [Google Scholar] [CrossRef] [PubMed] [Green Version]
  23. Yu, B.; Gu, D.; Zhang, X.; Liu, B.; Xie, J. The role of GLI2-ABCG2 signaling axis for 5Fu resistance in gastric cancer. J. Genet. Genom. 2017, 44, 375–383. [Google Scholar] [CrossRef] [PubMed]
  24. Terwijn, M.; Zeijlemaker, W.; Kelder, A.; Rutten, A.P.; Snel, A.N.; Scholten, W.J.; Pabst, T.; Verhoef, G.; Löwenberg, B.; Zweegman, S.; et al. Leukemic stem cell frequency: A strong biomarker for clinical outcome in acute myeloid leukemia. PLoS ONE 2014, 9, e107587. [Google Scholar] [CrossRef] [Green Version]
  25. Jordan, C.T. The leukemic stem cell. Best Pr. Res. Clin. Haematol. 2007, 20, 13–18. [Google Scholar] [CrossRef]
  26. Carpenter, R.L.; Lo, H.W. Identification, Functional Characterization, and Pathobiological Significance of GLI1 Isoforms in Human Cancers; Elsevier: Amsterdam, The Netherlands, 2012; Volume 88, ISBN 9780123946225. [Google Scholar]
  27. Sasaki, H.; Nishizaki, Y.; Hui, C.C.; Nakafuku, M.; Kondoh, H. Regulation of Gli2 and Gli3 activities by an amino-terminal repression domain: Implication of Gli2 and Gli3 as primary mediators of Shh signaling. Development 1999, 126, 3915–3924. [Google Scholar]
  28. Niewiadomski, P.; Kong, J.H.; Ahrends, R.; Ma, Y.; Humke, E.W.; Khan, S.; Teruel, M.N.; Novitch, B.G.; Rohatgi, R. Gli protein activity is controlled by multisite phosphorylation in vertebrate hedgehog signaling. Cell Rep. 2014, 6, 168–181. [Google Scholar] [CrossRef] [Green Version]
  29. Han, Y.G.; Kim, H.J.; Dlugosz, A.A.; Ellison, D.W.; Gilbertson, R.J.; Alvarez-Buylla, A. Dual and opposing roles of primary cilia in medulloblastoma development. Nat. Med. 2009, 15, 1062–1065. [Google Scholar] [CrossRef] [Green Version]
  30. Laclef, C.; Anselme, I.; Besse, L.; Catala, M.; Palmyre, A.; Baas, D.; Paschaki, M.; Pedraza, M.; Métin, C.; Durand, B.; et al. The role of primary cilia in corpus callosum formation is mediated by production of the Gli3 repressor. Hum. Mol. Genet. 2015, 24, 4997–5014. [Google Scholar] [CrossRef] [Green Version]
  31. Singh, M.; Chaudhry, P.; Merchant, A.A. Primary cilia are present on human blood and bone marrow cells and mediate Hedgehog signaling. Exp. Hematol. 2016, 44, 1181–1187. [Google Scholar] [CrossRef] [Green Version]
  32. Queiroz, K.C.S.; Ruela-De-Sousa, R.R.; Fuhler, G.M.; Aberson, H.L.; Ferreira, C.V.; Peppelenbosch, M.P.; Spek, C.A. Hedgehog signaling maintains chemoresistance in myeloid leukemic cells. Oncogene 2010, 29, 6314–6322. [Google Scholar] [CrossRef] [PubMed] [Green Version]
  33. Liang, H.; Zheng, Q.L.; Fang, P.; Zhang, J.; Zhang, T.; Liu, W.; Guo, M.; Robinson, C.L.; Chen, S.B.; Chen, X.P.; et al. Targeting the PI3K/AKT pathway via GLI1 inhibition enhanced the drug sensitivity of acute myeloid leukemia cells. Sci. Rep. 2017, 7. [Google Scholar] [CrossRef] [PubMed]
  34. Long, B.; Wang, L.X.; Zheng, F.M.; Lai, S.P.; Xu, D.R.; Hu, Y.; Lin, D.J.; Zhang, X.Z.; Dong, L.; Long, Z.J.; et al. Targeting GLI1 suppresses cell growth and enhances chemosensitivity in CD34 + enriched acute myeloid leukemia progenitor cells. Cell. Physiol. Biochem. 2016, 38, 1288–1302. [Google Scholar] [CrossRef] [PubMed]
  35. Huang, K.; Sun, Z.; Ding, B.; Jiang, X.; Wang, Z.; Zhu, Y.; Meng, F. Suppressing hedgehog signaling reverses drug resistance of refractory acute myeloid leukemia. Onco Targets. Ther. 2019, 12, 7477–7488. [Google Scholar] [CrossRef] [PubMed] [Green Version]
  36. Zhou, X.T.; Ding, J.; Li, H.Y.; Zuo, J.L.; Ge, S.Y.; Jia, H.L.; Wu, J. Hedgehog signalling mediates drug resistance through targeting TAP1 in hepatocellular carcinoma. J. Cell. Mol. Med. 2020, 24, 4298–4311. [Google Scholar] [CrossRef] [Green Version]
  37. Meng, E.; Hanna, A.; Samant, R.S.; Shevde, L.A. The impact of hedgehog signaling pathway on DNA repair mechanisms in human cancer. Cancers 2015, 7, 1333–1348. [Google Scholar] [CrossRef]
  38. Chen, Y.; Bieber, M.M.; Teng, N.N.H. Hedgehog signaling regulates drug sensitivity by targeting ABC transporters ABCB1 and ABCG2 in epithelial ovarian cancer. Mol. Carcinog. 2014, 53, 625–634. [Google Scholar] [CrossRef]
  39. Guo, Y.; Kotova, E.; Chen, Z.S.; Lee, K.; Hopper-Borge, E.; Belinsky, M.G.; Kruh, G.D. MRP8, ATP-binding cassette C11 (ABCC11), is a cyclic nucleotide efflux pump and a resistance factor for fluoropyrimidines 2′,3′-dideoxycytidine and 9′-(2′-phosphonylmethoxyethyl)adenine. J. Biol. Chem. 2003, 278, 29509–29514. [Google Scholar] [CrossRef] [Green Version]
  40. Guo, Y.; Kock, K.; Ritter, C.A.; Chen, Z.S.; Grube, M.; Jedlitschky, G.; Illmer, T.; Ayres, M.; Beck, J.F.; Siegmund, W.; et al. Expression of ABCC-type nucleotide exporters in blasts of adult acute myeloid leukemia: Relation to long-term survival. Clin. Cancer Res. 2009, 15, 1762–1769. [Google Scholar] [CrossRef] [Green Version]
  41. Lamba, J.K. Genetic factors influencing cytarabine therapy. Pharmacogenomics 2009, 10, 1657–1674. [Google Scholar] [CrossRef] [Green Version]
  42. Franzolin, E.; Pontarin, G.; Rampazzo, C.; Miazzi, C.; Ferraro, P.; Palumbo, E.; Reichard, P.; Bianchi, V. The deoxynucleotide triphosphohydrolase SAMHD1 is a major regulator of DNA precursor pools in mammalian cells. Proc. Natl. Acad. Sci. USA 2013, 110, 14272–14277. [Google Scholar] [CrossRef] [PubMed] [Green Version]
  43. Hollenbaugh, J.A.; Shelton, J.; Tao, S.; Amiralaei, S.; Liu, P.; Lu, X.; Goetze, R.W.; Zhou, L.; Nettles, J.H.; Schinazi, R.F.; et al. Substrates and inhibitors of SAMHD1. PLoS ONE 2017, 12, e0169052. [Google Scholar] [CrossRef] [PubMed]
  44. Schneider, C.; Oellerich, T.; Baldauf, H.M.; Schwarz, S.M.; Thomas, D.; Flick, R.; Bohnenberger, H.; Kaderali, L.; Stegmann, L.; Cremer, A.; et al. SAMHD1 is a biomarker for cytarabine response and a therapeutic target in acute myeloid leukemia. Nat. Med. 2017, 23, 250–255. [Google Scholar] [CrossRef] [PubMed]
  45. Cohen, S. The mechanisms of lethal action of arabinosyl cytosine (araC) and arabinosyl adenine (araA). Cancer 1977, 40, 509–518. [Google Scholar] [CrossRef]
  46. Ohta, T.; Hori, H.; Ogawa, M.; Miyahara, M.; Kawasaki, H.; Taniguchi, N.; Komada, Y. Impact of cytidine deaminase activity on intrinsic resistance to cytarabine in carcinoma cells. Oncol. Rep. 2004, 12, 1115–1120. [Google Scholar] [CrossRef]
  47. Abraham, A.; Varatharajan, S.; Karathedath, S.; Philip, C.; Lakshmi, K.M.; Jayavelu, A.K.; Mohanan, E.; Janet, N.B.; Srivastava, V.M.; Shaji, R.V.; et al. RNA expression of genes involved in cytarabine metabolism and transport. Pharmacogenomics 2015, 16, 877–890. [Google Scholar] [CrossRef] [Green Version]
  48. Jahns-streubel, G.; Reuter, C.; Auf der Landwehr, U.; Unterhalt, M.; Schleyer, E.; Wörmann, B.; Büchner, T.; Hiddemann, W. Activity of Thymidine Kinase and of Polymerase a as Well as Activity and Gene Expression of Deoxycytidine Deaminase in Leukemic Blasts Are Correlated With Clinical Response in the Setting of Granulocyte- Macrophage Colony-Stimulating Factor—Based Priming. Blood 1997, 90, 1968–1976. [Google Scholar] [CrossRef] [Green Version]
  49. Schröder, J.K.; Kirch, C.; Seeber, S.; Schütte, J. Structural and functional analysis of the cytidine deaminase gene in patients with acute myeloid leukaemia. Br. J. Haematol. 1998, 103, 1096–1103. [Google Scholar] [CrossRef]
  50. Weber, K.; Mock, U.; Petrowitz, B.; Bartsch, U.; Fehse, B. Lentiviral gene ontology (LeGO) vectors equipped with novel drug-selectable fluorescent proteins: New building blocks for cell marking and multi-gene analysis. Gene Ther. 2010, 17, 511–520. [Google Scholar] [CrossRef] [Green Version]
  51. David, F.P.A.; Rougemont, J.; Deplancke, B. GETPrime 2.0: Gene- and transcript-specific qPCR primers for 13 species including polymorphisms. Nucleic Acids Res. 2017, 45, D56–D60. [Google Scholar] [CrossRef] [Green Version]
  52. Pfaffl, M.W. A new mathematical model for relative quantification in real-time RT–PCR. Nucleic Acids Res. 2001, 29, 2002–2007. [Google Scholar] [CrossRef] [PubMed]
Figure 1. Number of viable cells in resistant vs. parental cell lines following treatment with increasing cytarabine (Ara-C) concentrations. Resistant cell lines (RCL) and wildtype (WT) variants of acute myeloid leukemia (AML) cell lines Kasumi-1 (a), OCI-AML3 (b), OCI-AML5 (c) were plated with different concentrations of Ara-C ranging from 100 nM to 10,000 nM. Cell counts were normalized to the those in untreated controls. The average number of viable cells (Ø) in the untreated control samples was 1.00 × 10⁶ (Kasumi-1), 1.54 × 10⁶ (OCI-AML3), and 1.43 × 10⁶ (OCI-AML3) for WT cells and 1.96 × 10⁶ (Kasumi-1), 1.92 × 10⁶ (OCI-AML3), and 1.75 × 10⁶ (OCI-AML3) for RCL; * p < 0.05 and ** p < 0.01 in Welch’s t-test.
Ijms 21 05084 g001
Figure 2. Downregulation of GLI3 in Ara-C resistant cell lines. (a) WT and Ara-C-RCL Kasumi-1, OCI-AML3, and OCI-AML5 were analyzed for GLI3 mRNA levels by RT-qPCR analysis; * p < 0.05 and ** p < 0.01 in Welch’s t-test. (b) Western blot of full length GLI3 (GLI3FL) and its repressor form (GLI3R) in WT and RCL variants of OCI-AML3 and OCI-AML5.
Ijms 21 05084 g002
Figure 3. Efficiency of GLI3 knockdown in AML cell lines THP-1 and OCI-AML3. GLI3 mRNA levels were measured by RT-qPCR following lentiviral transduction with two distinct shRNA targeting GLI3. The expression of GLI3 was normalized to that in control cells transduced with a scrambled control shRNA; * p < 0.05 and ** p < 0.01 in Welch’s t-test.
Ijms 21 05084 g003
Figure 4. GLI3 knockdown partially protects AML cells against the cytotoxic effect of Ara-C. AML cell lines THP-1 (a) and OCI-AML3 (b) after GLI3 knockdown and treatment with scrambled shRNA control were subjected to different Ara-C concentrations for 7 days. Colony numbers were counted and normalized to those of the untreated controls. The average number of colonies (Ø) in the untreated control samples was 84 (scrambled shRNA) and 62 (GLI3 shRNA) for THP-1 and 72 (scrambled shRNA) and 83 (GLI3 shRNA) for OCI-AML3; * p < 0.05 and ** p < 0.01 in Welch’s t-test; ns, statistically not significant.
Ijms 21 05084 g004
Figure 5. GLI3 knockdown suppresses apoptosis induction upon treatment with Ara-C. THP-1 cells transduced with GLI3-targeted shRNA or scrambled shRNA control were treated with the indicated concentrations of Ara-C, and induction of apoptosis was measured after 48 h by flow cytometry using Annexin V and propidium iodide. In the untreated (control) samples, the majority of cells transduced with scrambled shRNA (Ø 5.9% Annexin V-positive) or GLI3 shRNA (Ø 6.9% Annexin V-positive) were viable. Representative flow cytometry plots are shown in Figure A4 (Appendix A). Error bars represent the mean values ± standard deviation; * p < 0.05, ** p < 0.01 in the Welch’s t-test; ns, statistically not significant.
Ijms 21 05084 g005
Figure 6. Knockdown of GLI3 results in the upregulation of genes involved in Ara-C metabolism and transport. Expression levels of SAMHD1 (a), CDA (b), and ABCC11 (c) in GLI3-knockdown cell lines THP-1 and OCI-AML3 were quantified by RT-qPCR and compared to their expression levels in control cells transduced with a scrambled shRNA. Error bars represent the mean values ± standard deviation; * p < 0.05, ** p < 0.01 in the Welch’s t-test; ns, not significant.
Ijms 21 05084 g006
Figure 7. Role of SAMHD1, CDA, and ABCC11 in Ara-C metabolism. ATP-binding cassette C11 (ABCC11) functions as a nucleotide efflux pump and reduces the intracellular levels of Ara-C; cytidine deaminase (CDA) irreversibly deaminates Ara-C to its inactive uracil derivative uracil arabinoside (Ara-U); the phosphohydrolase SAMHD1 reduces active Ara-CTP levels through hydrolyzing Ara-CTP into inactive Ara-C.
Ijms 21 05084 g007

