Article

Na+, K+-ATPase α Isoforms and Endogenous Cardiac Steroids in Prefrontal Cortex of Bipolar Patients and Controls

1
The Institute for Medical Research, Israel-Canada, Department of Medical Neurobiology, Faculty of Medicine, The Hebrew University-Hadassah Medical School, Jerusalem 9112102, Israel
2
Laboratory of Cardiovascular Science, National Institute on Aging, NIH, Baltimore, MD 21224, USA
3
The Institute for Medical Research, Israel-Canada, Department of Microbiology and Molecular Genetics, Faculty of Medicine, The Hebrew University-Hadassah Medical School, Jerusalem 9112102, Israel
*
Author to whom correspondence should be addressed.
Int. J. Mol. Sci. 2020, 21(16), 5912; https://0-doi-org.brum.beds.ac.uk/10.3390/ijms21165912
Submission received: 24 June 2020 / Revised: 5 August 2020 / Accepted: 13 August 2020 / Published: 17 August 2020
(This article belongs to the Special Issue Cardiotonic Steroids: From Toxins to Hormones)

Abstract

:
Bipolar disorder is a chronic multifactorial psychiatric illness that affects the mood, cognition, and functioning of about 1–2% of the world’s population. Its biological basis is unknown, and its treatment is unsatisfactory. The α1, α2, and α3 isoforms of the Na+, K+-ATPase, an essential membrane transporter, are vital for neuronal and glial function. The enzyme and its regulators, endogenous cardiac steroids like ouabain and marinobufagenin, are implicated in neuropsychiatric disorders, bipolar disorder in particular. Here, we address the hypothesis that the α isoforms of the Na+, K+-ATPase and its regulators are altered in the prefrontal cortex of bipolar disease patients. The α isoforms were determined by Western blot and ouabain and marinobufagenin by specific and sensitive immunoassays. We found that the α2 and α3 isoforms were significantly higher and marinobufagenin levels were significantly lower in the prefrontal cortex of the bipolar disease patients compared with those in the control. A positive correlation was found between the levels of the three α isoforms in all samples and between the α1 isoform and ouabain levels in the controls. These results are in accordance with the notion that the Na+, K+-ATPase-endogenous cardiac steroids system is involved in bipolar disease and suggest that it may be used as a target for drug development.

1. Introduction

Bipolar disorder (BD) is a chronic multifactorial psychiatric illness that affects the mood, cognition, and functioning of about 1–2% of the global population [1]. The illness is characterized by episodes of extreme mood states, mania, and depression, interspaced with periods of euthymia. Symptoms of mania include elevated mood, hyperactivity, racing thoughts, insomnia, irritability, and risky behavior. Depression is associated with symptoms, such as sad mood, poor self-esteem, lethargy, and anhedonia. Despite the availability of a broad range of drugs, the treatment of BD remains inadequate: Some patients do not respond to the treatment and many suffer from frequent relapses [2]. A better understanding of the mechanisms involved in BD could contribute to the development of targeted therapies and is of the utmost importance.
Cardiac steroids (CSs), such as the cardenolides ouabain (OUA) and digoxin, and bufadienolides, such as marinobufagenin (MBG), were originally discovered in plants and amphibian skin and are known for their positive inotropic effect [3]. Endogenous cardiac steroids (ECSs), compounds identical or similar to CSs, are present in human tissues and circulation [4,5]. Although the biosynthetic pathway was not fully elucidated, ECSs seem to be synthetized in the adrenal gland and brain [6,7] and are considered hormones involved in numerous physiological and pathological processes, among them cell growth, salt homeostasis, regulation of blood pressure, and behavior [6,7,8,9]. These steroids affect various neuronal functions, suggesting their role as neurosteroids [10,11].
Na+, K+-ATPase is a ubiquitous plasma membrane transporter that utilizes the energy generated from ATP hydrolysis to catalyze the exchange of intracellular Na+ for extracellular K+. This enzymatic activity is essential for the regulation of intracellular osmolarity, pH, and calcium concentration; maintenance of the plasma membrane electric potential; and co-transport of substances across the plasma membrane [12]. Na+, K+-ATPase is a hetero-oligomer composed of two major polypeptides: The α and β-subunits. The α subunit is responsible for the catalytic activity of the enzyme. Three α-subunit isoforms were described in the brain [13]: The ubiquitous α1 isoform; the α2 isoform, which is expressed predominantly in glial cells [14]; and the α3 isoform, which is localized mainly in neurons and dendritic spines [15,16]. The isoforms have different kinetic properties and affinities and they exhibit species-, tissue-, and cell-specific patterns of expression, thus allowing the fine-tuning of Na+, K+-ATPase activity [13]. Mutations in the α2 and α3 isoforms were implicated in neurological disease activity [13,17].
The α subunit of Na+, K+ -ATPase is the only established receptor for CS and ECS. Interaction of the steroids with the Na+, K+-ATPase results in inhibition of the ion-pumping function and causes the activation of several signal transduction cascades, including mitogen-activated protein kinase; extracellular signal-regulated kinase; proto-oncogene tyrosine-protein kinase (Src); the PI3K/Akt, Ca++ signaling, and reactive oxygen species generation pathways [18,19]; and TGF-β signaling [20].
Genetic, biochemical, and behavioral studies implicated the Na+, K+-ATPase and ECS in BD and other mood disorders: A genetic association was described between BD and single nucleotide polymorphisms in the Na+, K+-ATPase α subunit gene [21]. Mutations in the Na+, K+-ATPase α3 isoform elicit an array of neurological phenotypes, including manic-like behavior in mice [22,23]. Abnormalities in Na+, K+-ATPase activity [24] and alterations in ECS levels [25,26,27] were reported in bipolar individuals. A reduction in brain ECS had a protective effect in depressive-like behavior in rats [26], with concomitant alterations in catecholamine levels in specific brain regions [28]. Furthermore, a reduction in brain ECS also protected against manic-like behavior induced by amphetamine (AMPH) in mice [27], an effect that is associated with protection of the brain from oxidative stress [29].
The prefrontal cortex (PFC), a center for executive and cognitive functions [30], is connected to many other brain regions, especially to the limbic brain areas [31]. Numerous studies implicated neuronal activity in the PFC in both the manic and depressive phases of BD [32]: Reduced glial cell number [33] and decreased cortical thickness [34] were found in the PFC of BD; increased gyrification, a marker of early developmental pathology, was found to be increased in BD patients [35]; and discrete miRNA alterations [36] and a reduced density of GABA-synthesizing enzyme, glutamic acid decarboxylase [37], were observed in the PFC of BD patients.
In view of these observations, we hypothesized that the levels of the α isoforms of the Na+, K+-ATPase and of ECS in the brain may be altered in BD. To test this hypothesis, we compared the levels of the three α isoforms of the Na+, K+-ATPase and of endogenous OUA and MBG in the PFC of bipolar patients with their levels in age- and sex-matched controls and evaluated the potential correlations among the different isoforms and the two steroids.

2. Results

The study was performed on two cohorts of postmortem brain samples of BD and controls obtained from the Human Brain Collection Core (HBCC) of the National Institute of Mental Health (NIMH) Division of Intramural Programs. In both groups, there was no statistical difference in terms of age, gender, postmortem interval, brain weight, and pH between the BD and control samples (see the materials and methods).

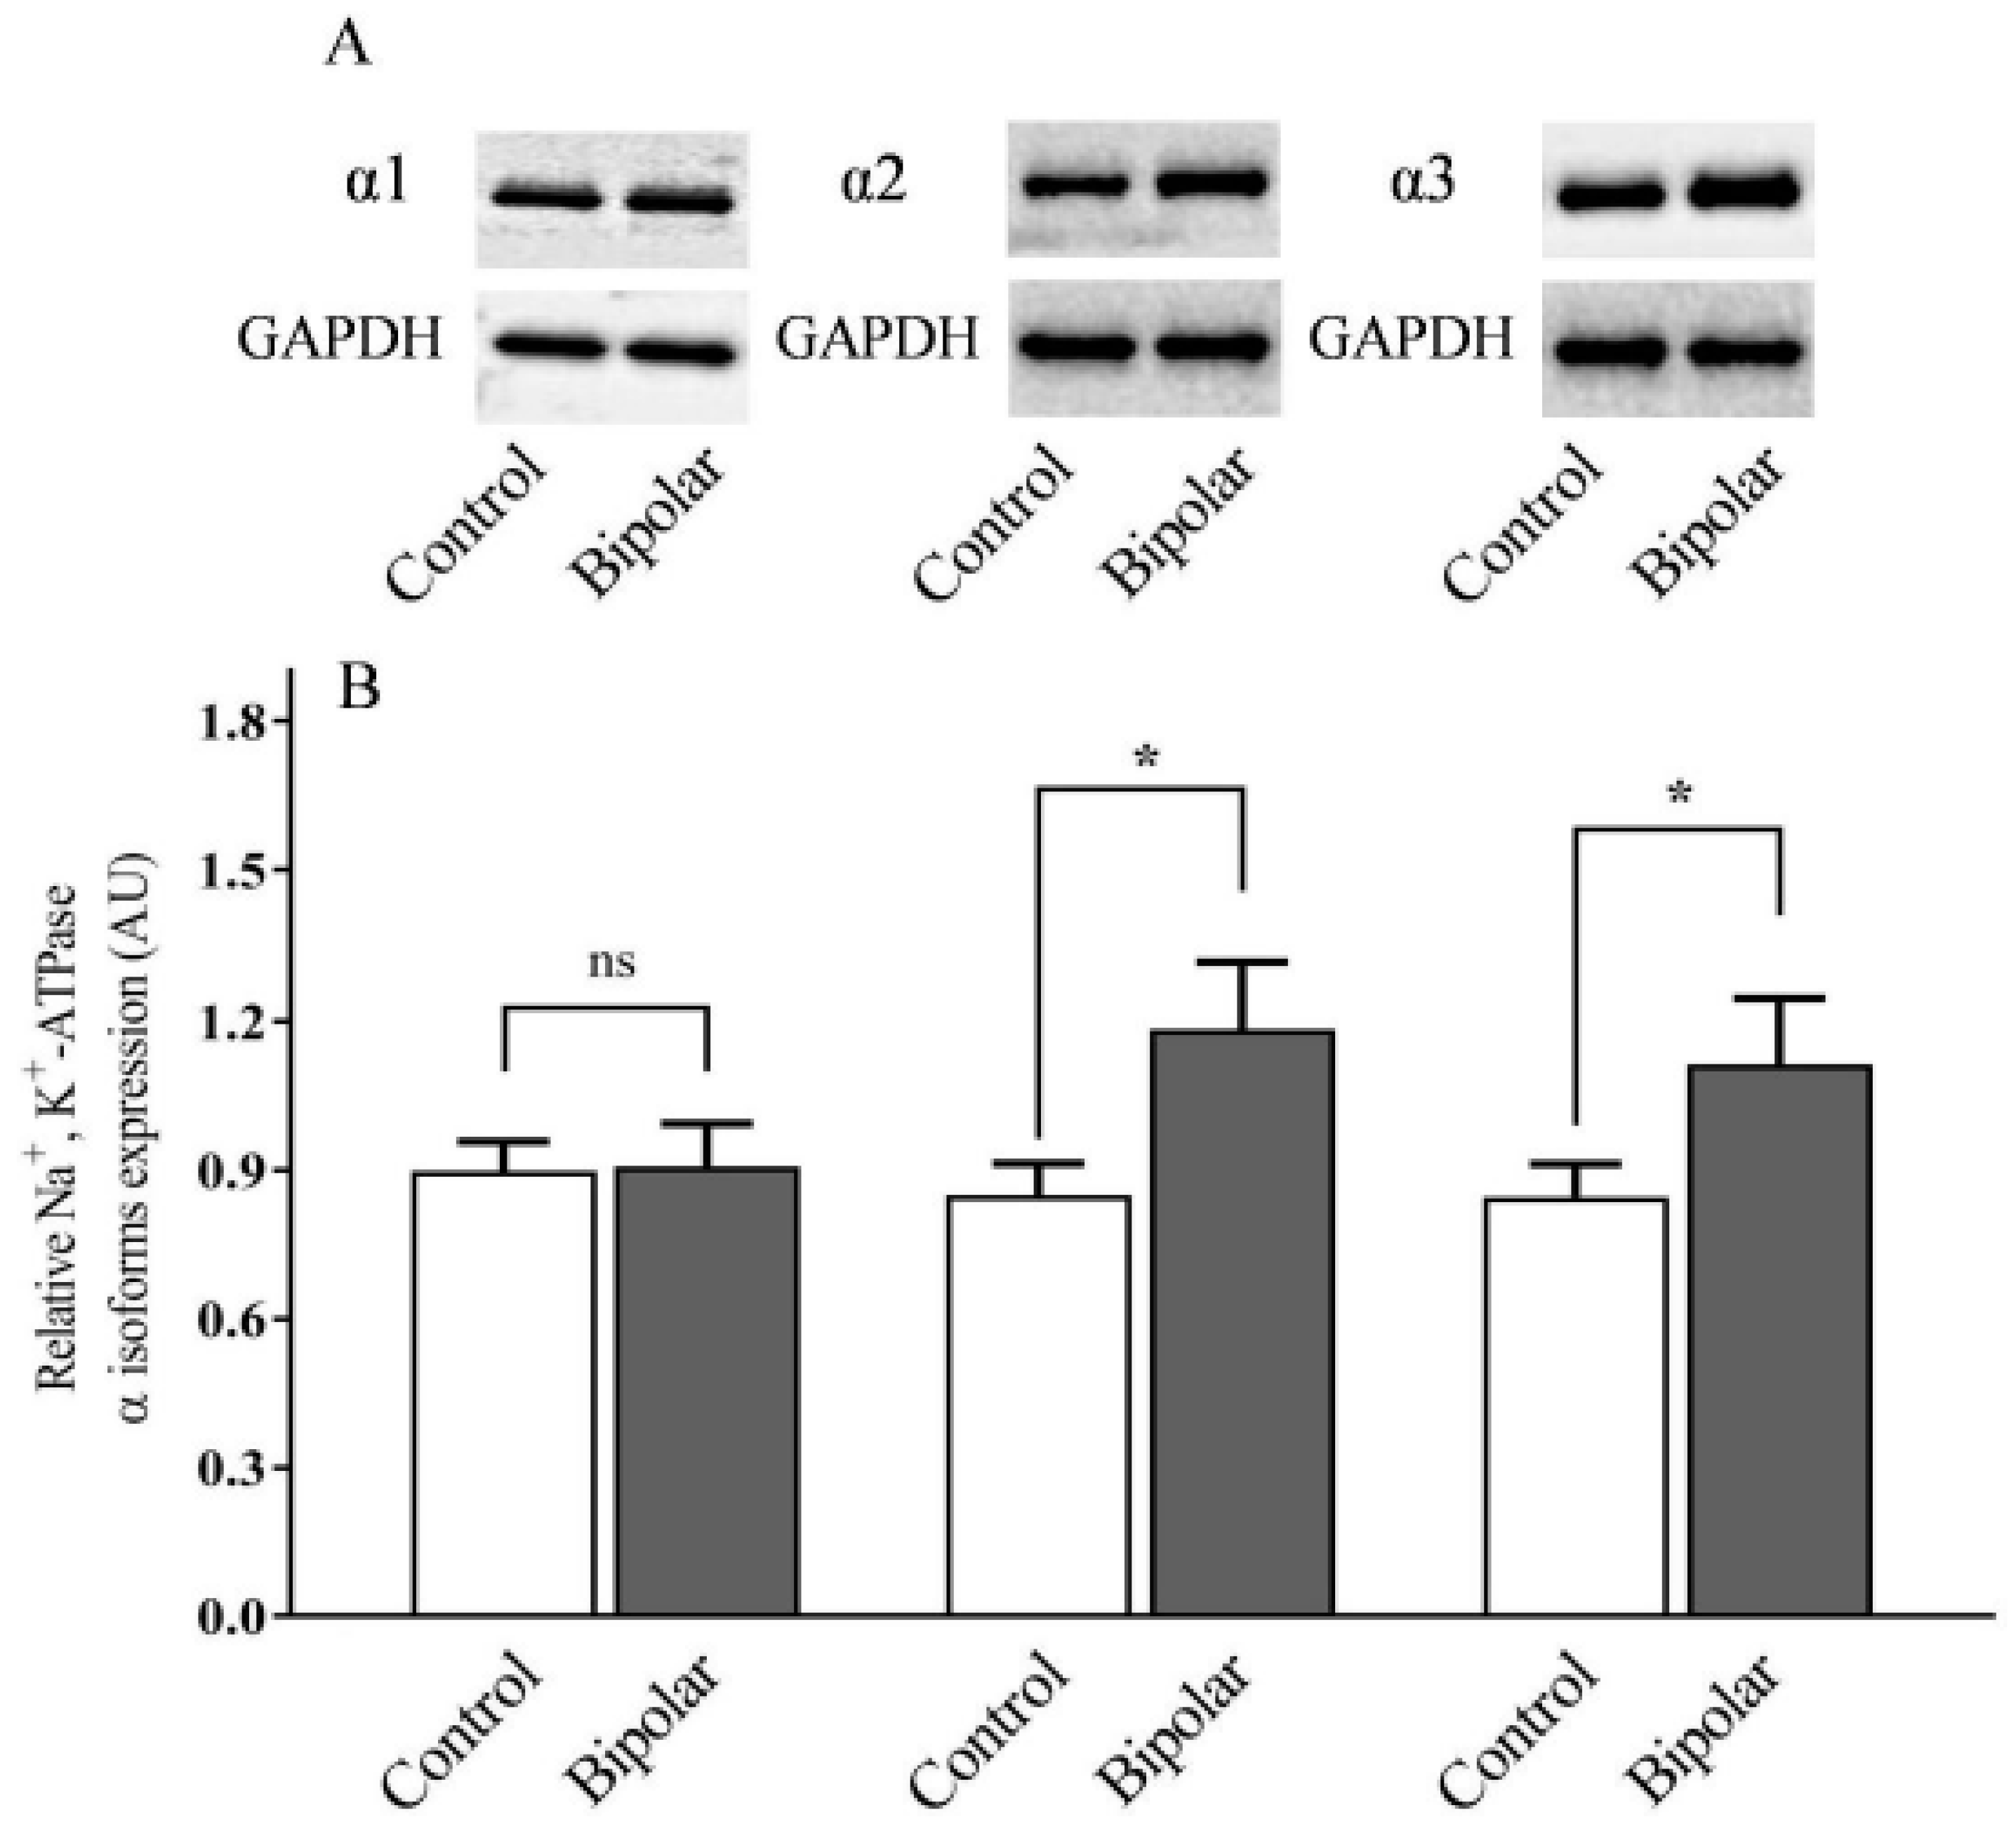
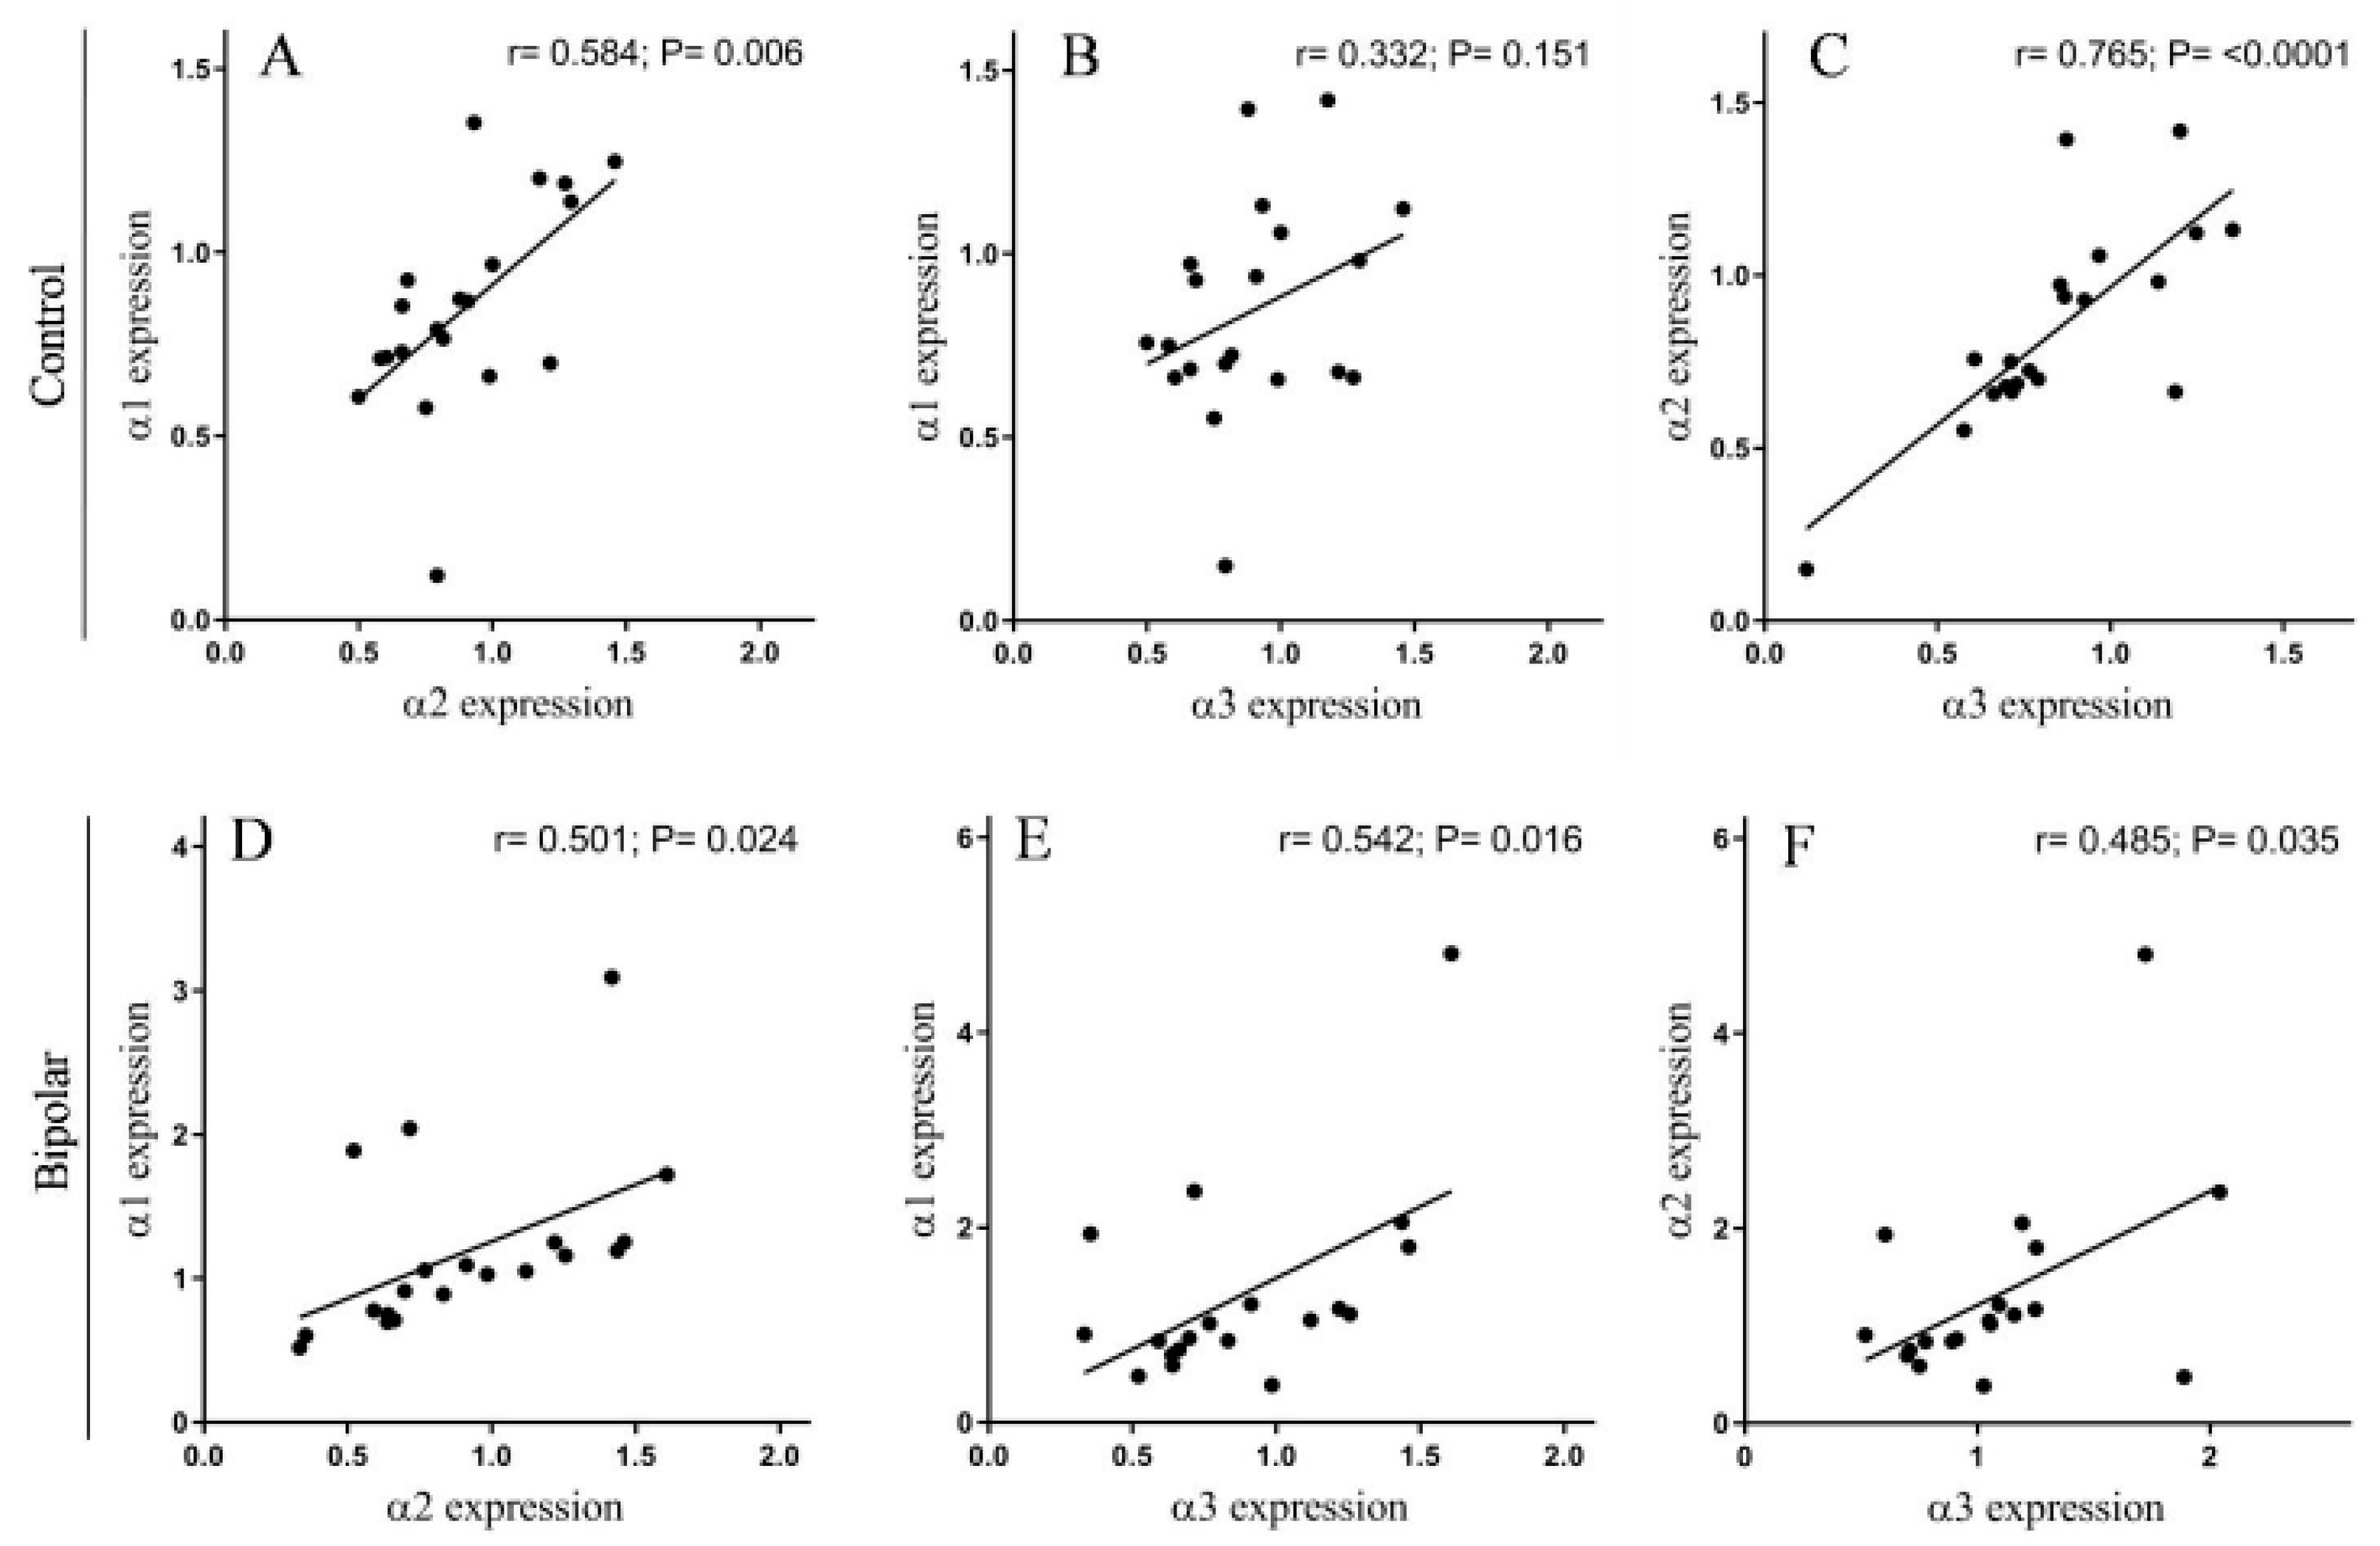
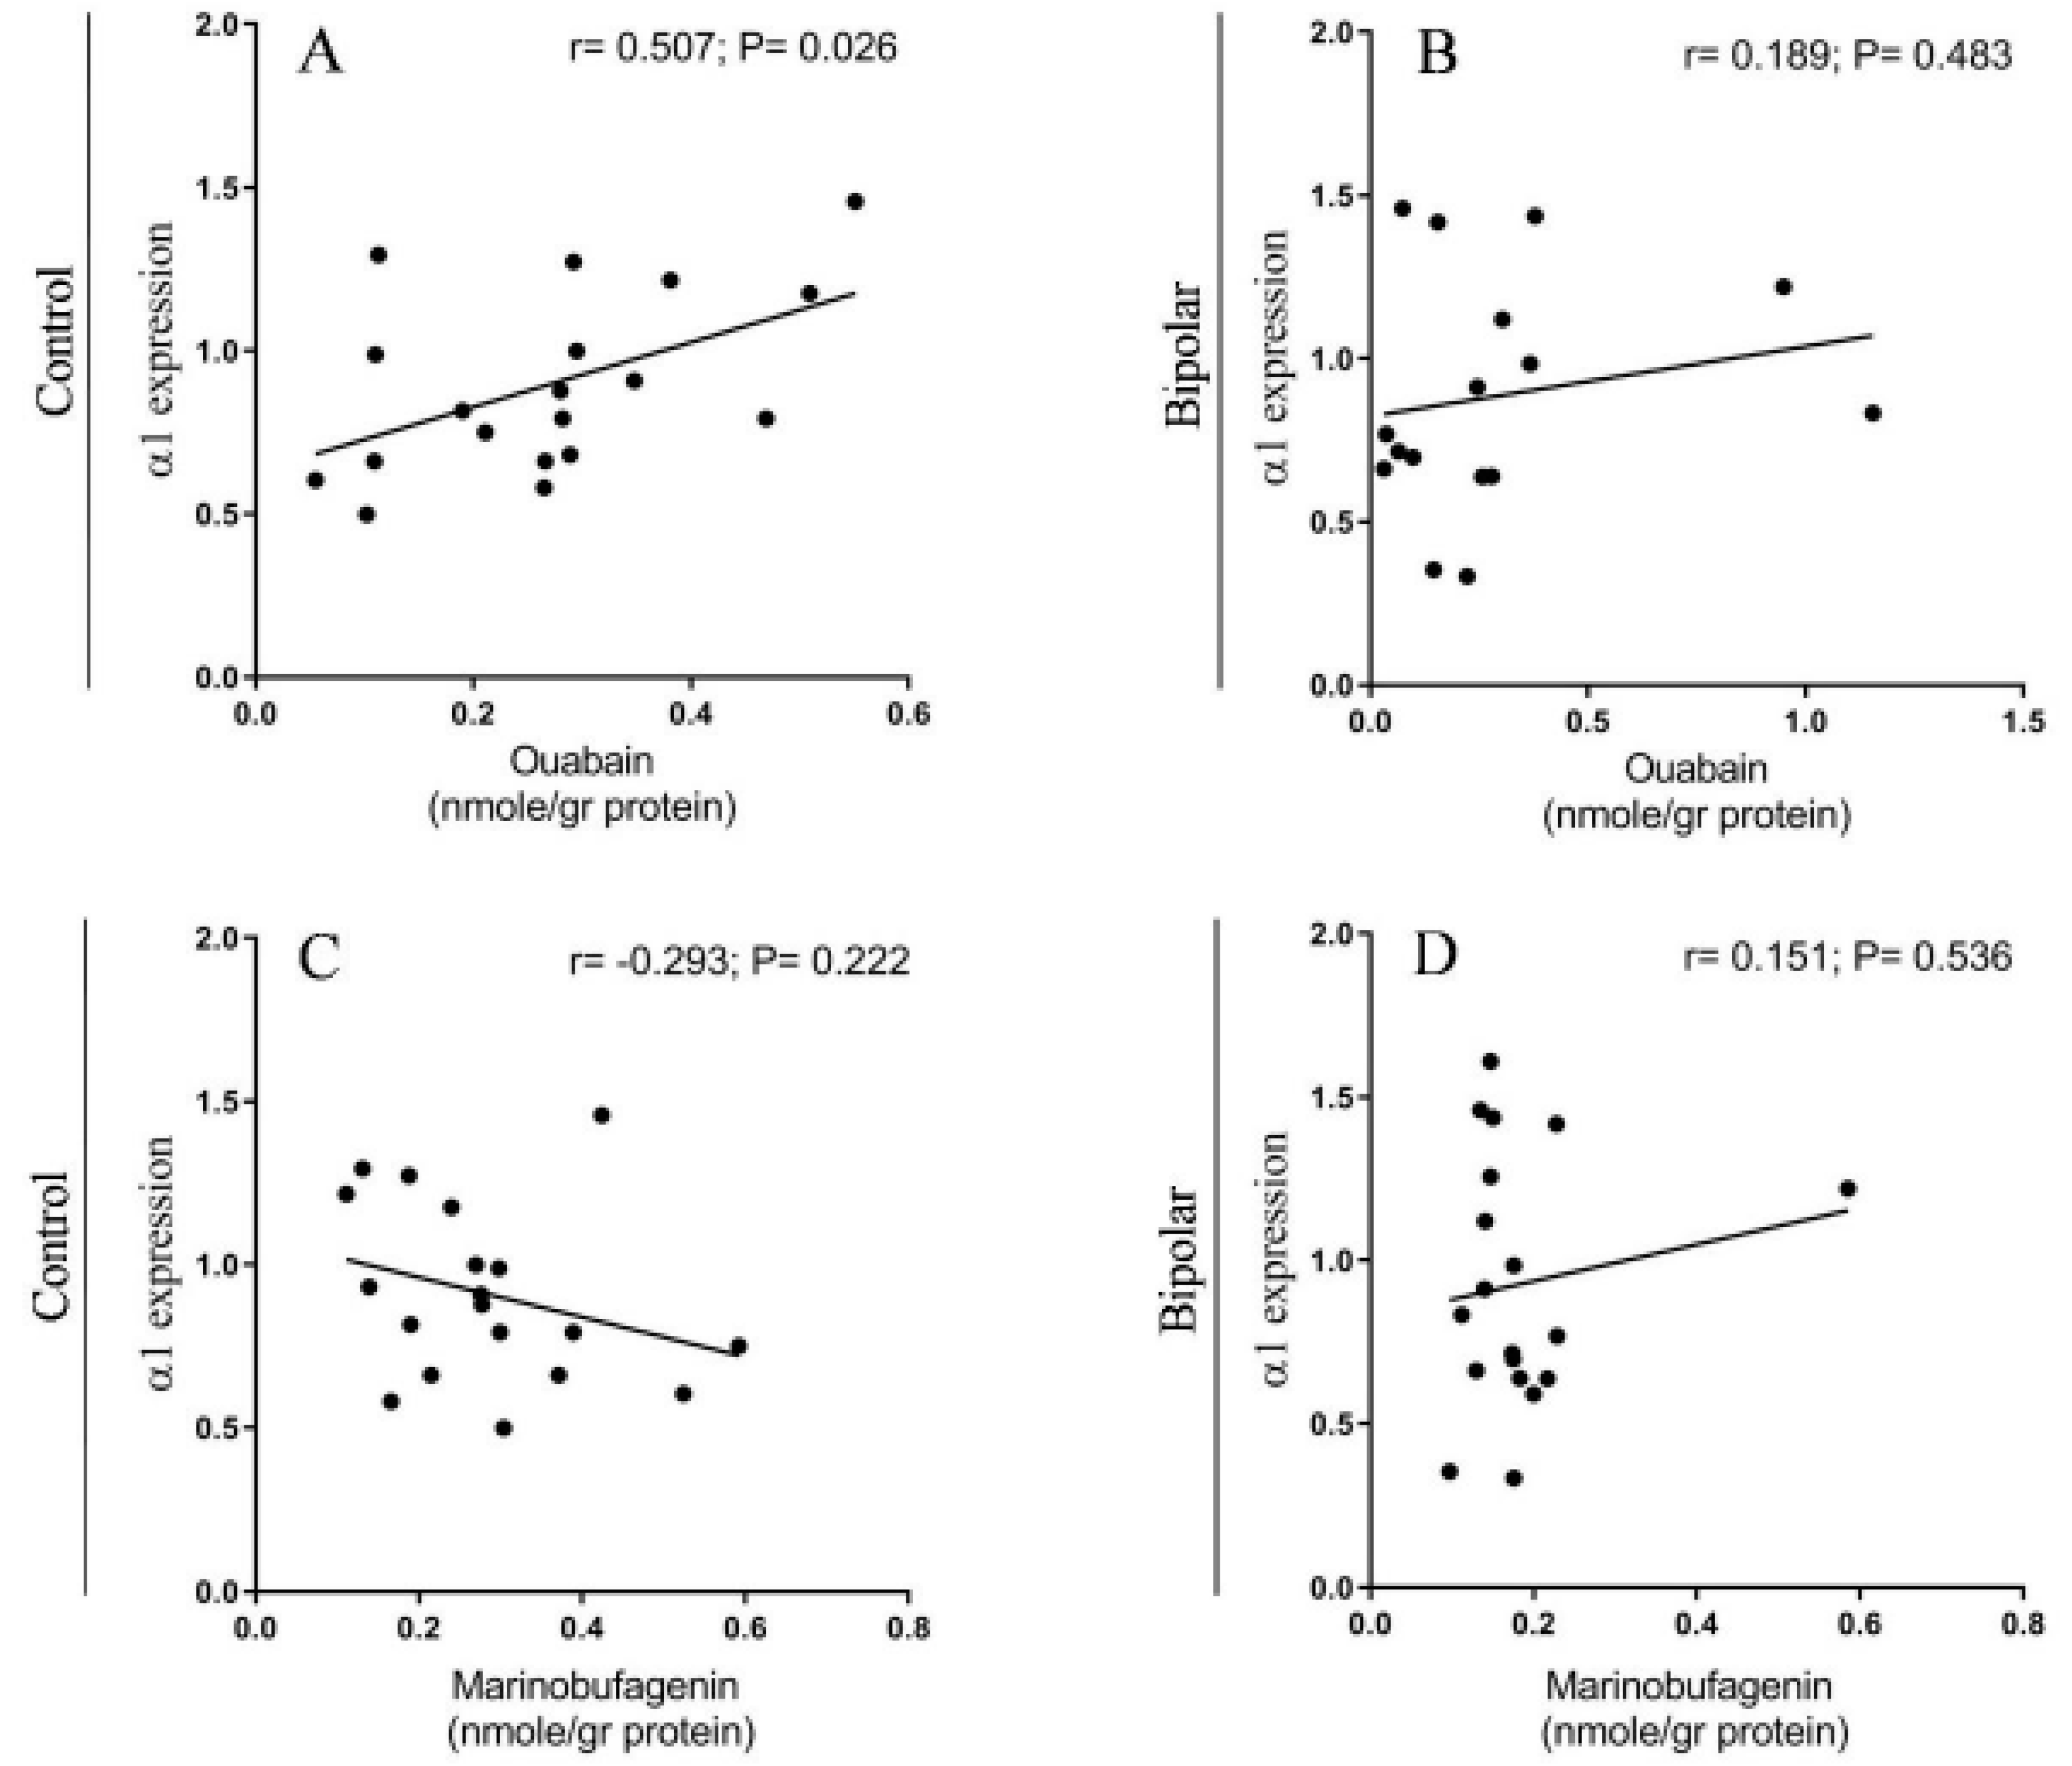
2.1. Na+, K+-ATPase α Isoforms in PFC of BD Patients and Controls

The levels of the α isoforms of the Na+, K+-ATPase in the brains of normal and BD patients have been barely investigated. As in a preliminary study on a small cohort of BD patients and controls (six in each group), the levels of the α isoforms were extremely variable (data not shown), we initiated a larger study comparing the α isoform expression levels of 20 BD patients and 20 controls. An example of the Western blots and a quantitative analysis of all the data is shown in Figure 1A,B, respectively.
The Na+, K+-ATPase α2 and α3 isoforms were significantly higher by 28.2% and 23.7%, respectively, in the PFC of BD patients compared with those in the controls. No difference in α1 isoform abundance between the two groups was detected (Figure 1). The cross-correlations between the levels of expression of the three α isoforms of the Na+, K+-ATPase were significant in both the controls (Figure 2A–C) and in the BD patients (Figure 2D–F). Namely, α1 was positively correlated with a2 and α3 in the controls (Figure 2A–B) and in the BD patients (Figure 2D–E); the α2 and α3 isoforms were highly correlated in both the controls (Figure 2C) and in the BD patients (Figure 2F).
No positive correlation was found between the levels of any of the three α isoforms and the age of onset of the disease, age of death, or gender of the subjects (data not shown).

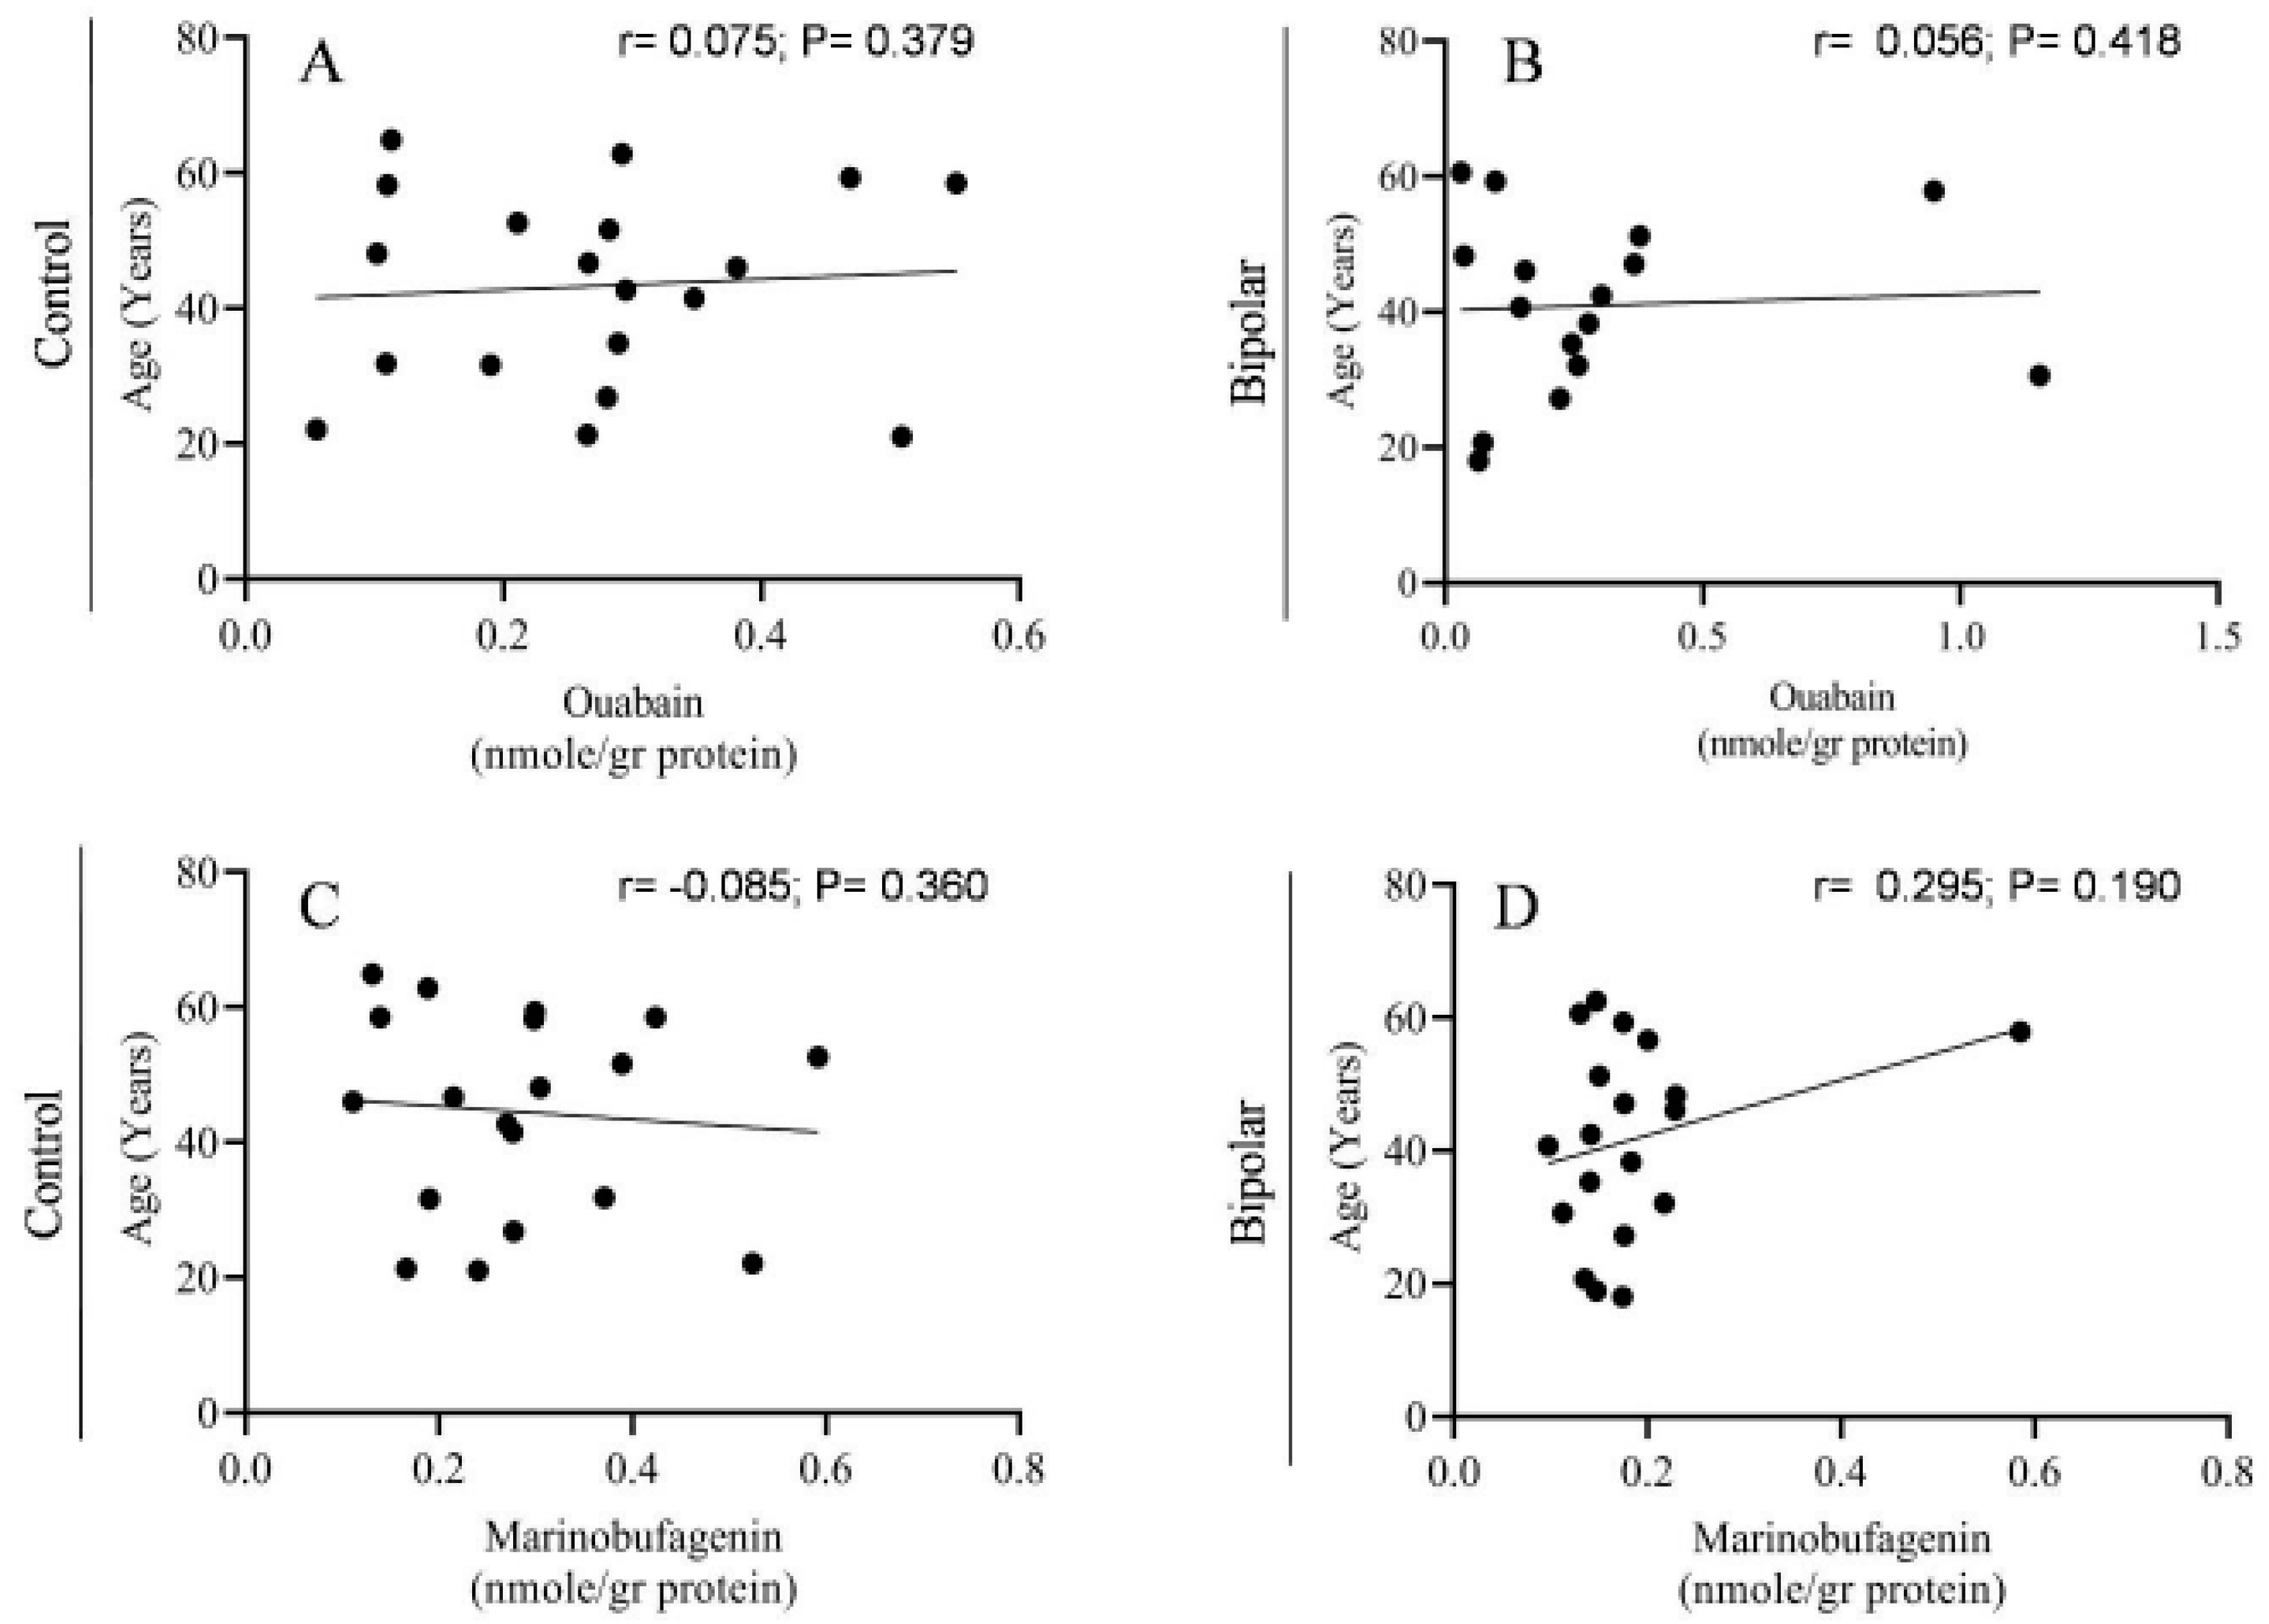
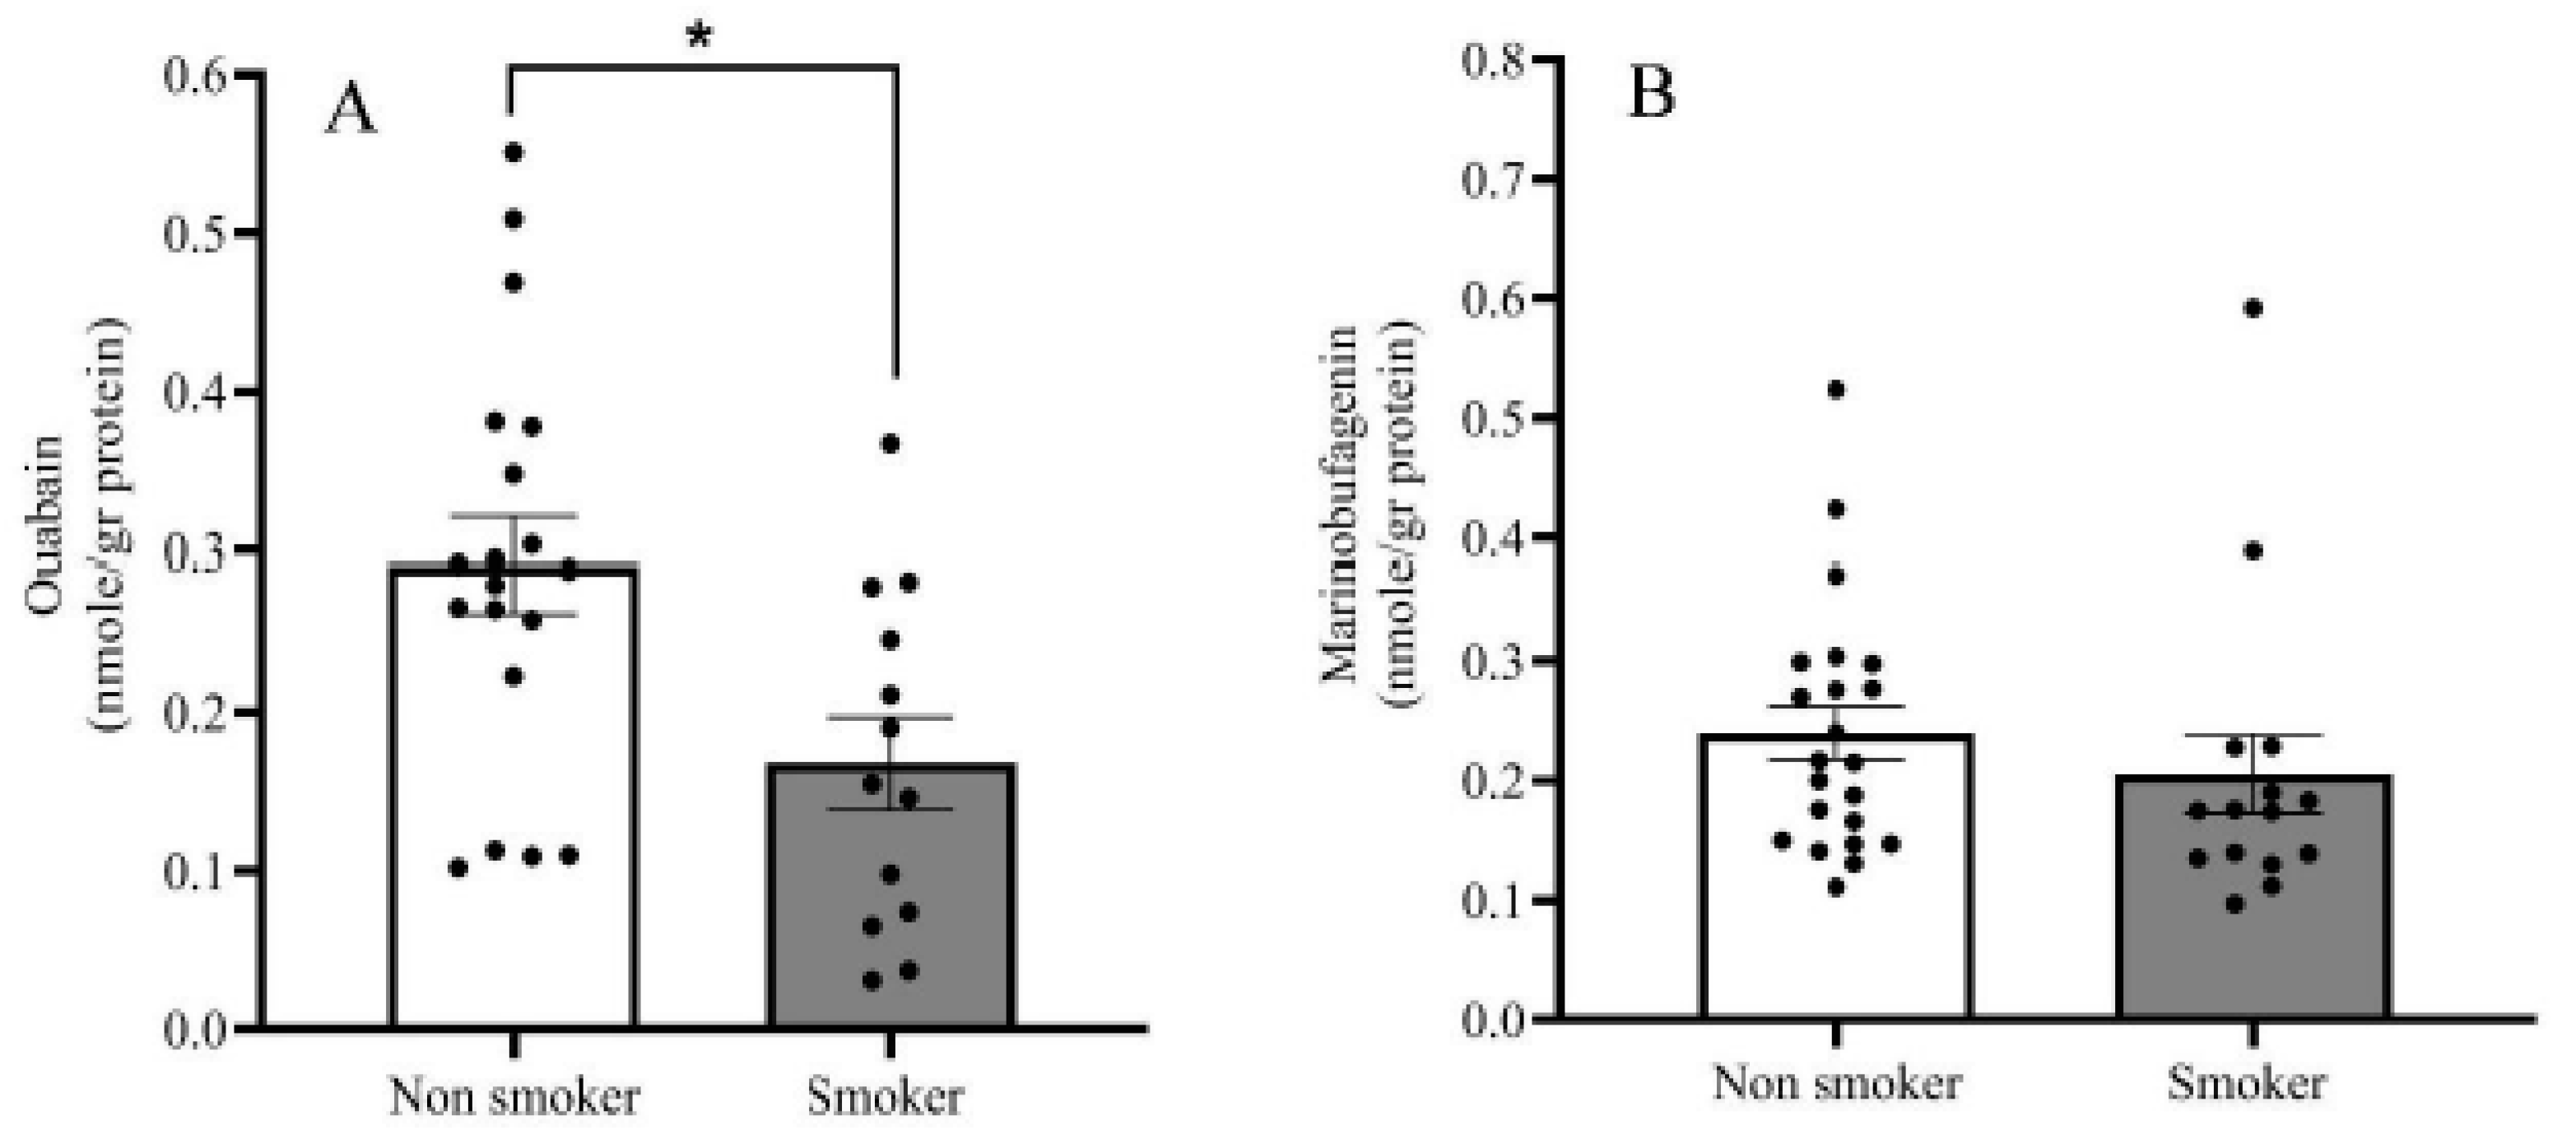
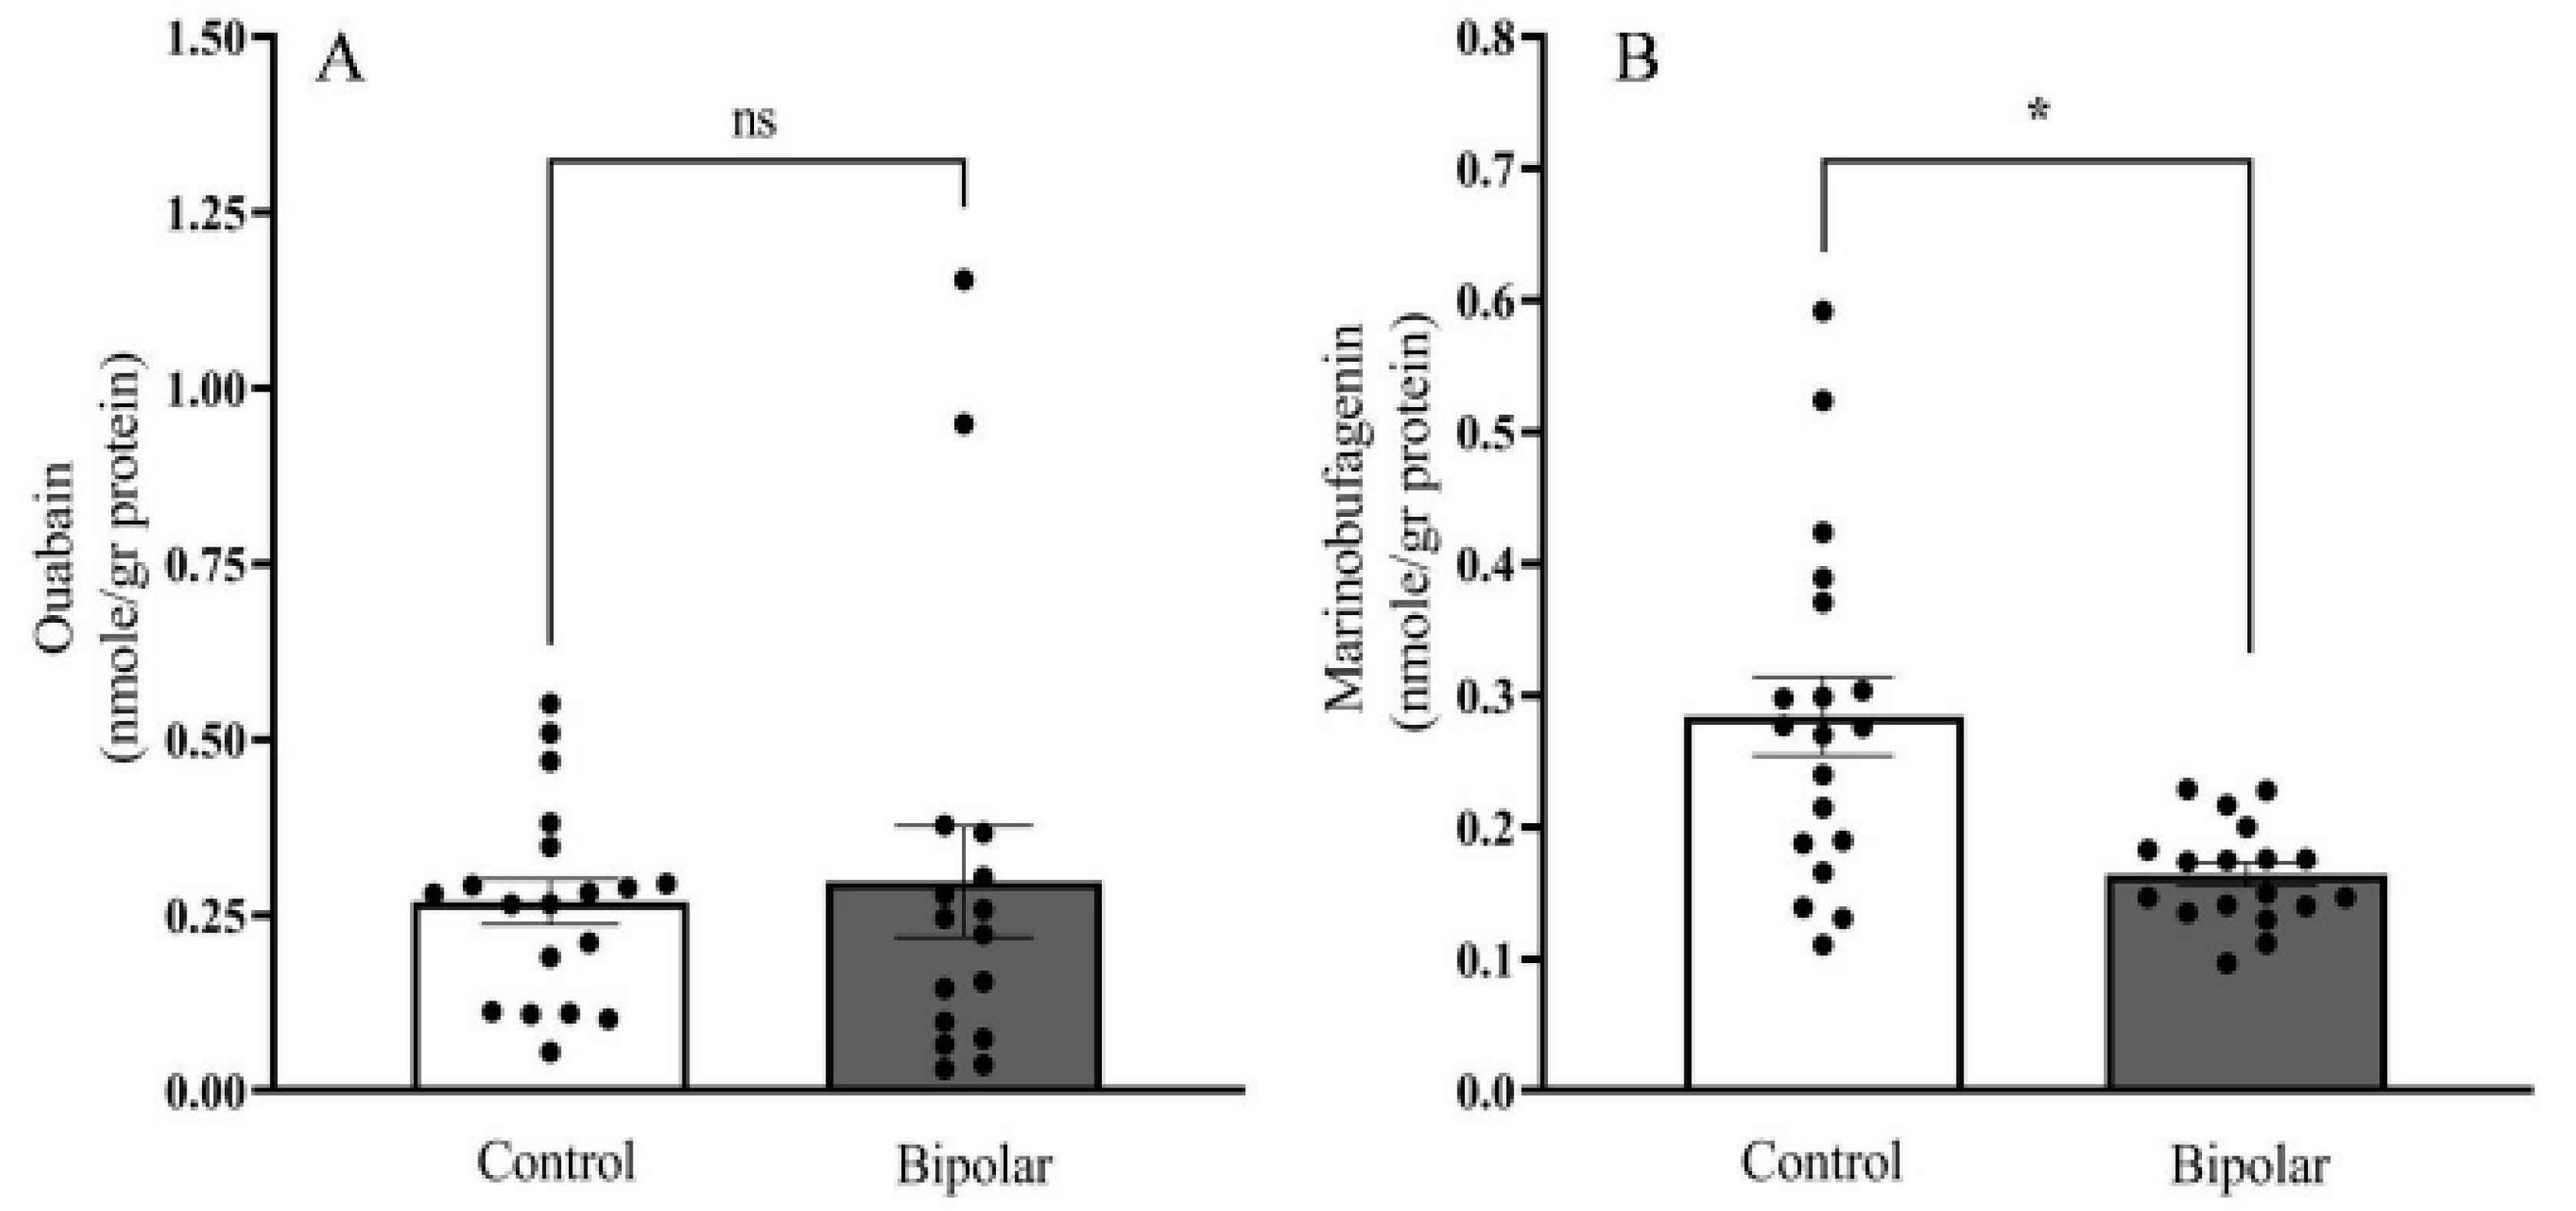
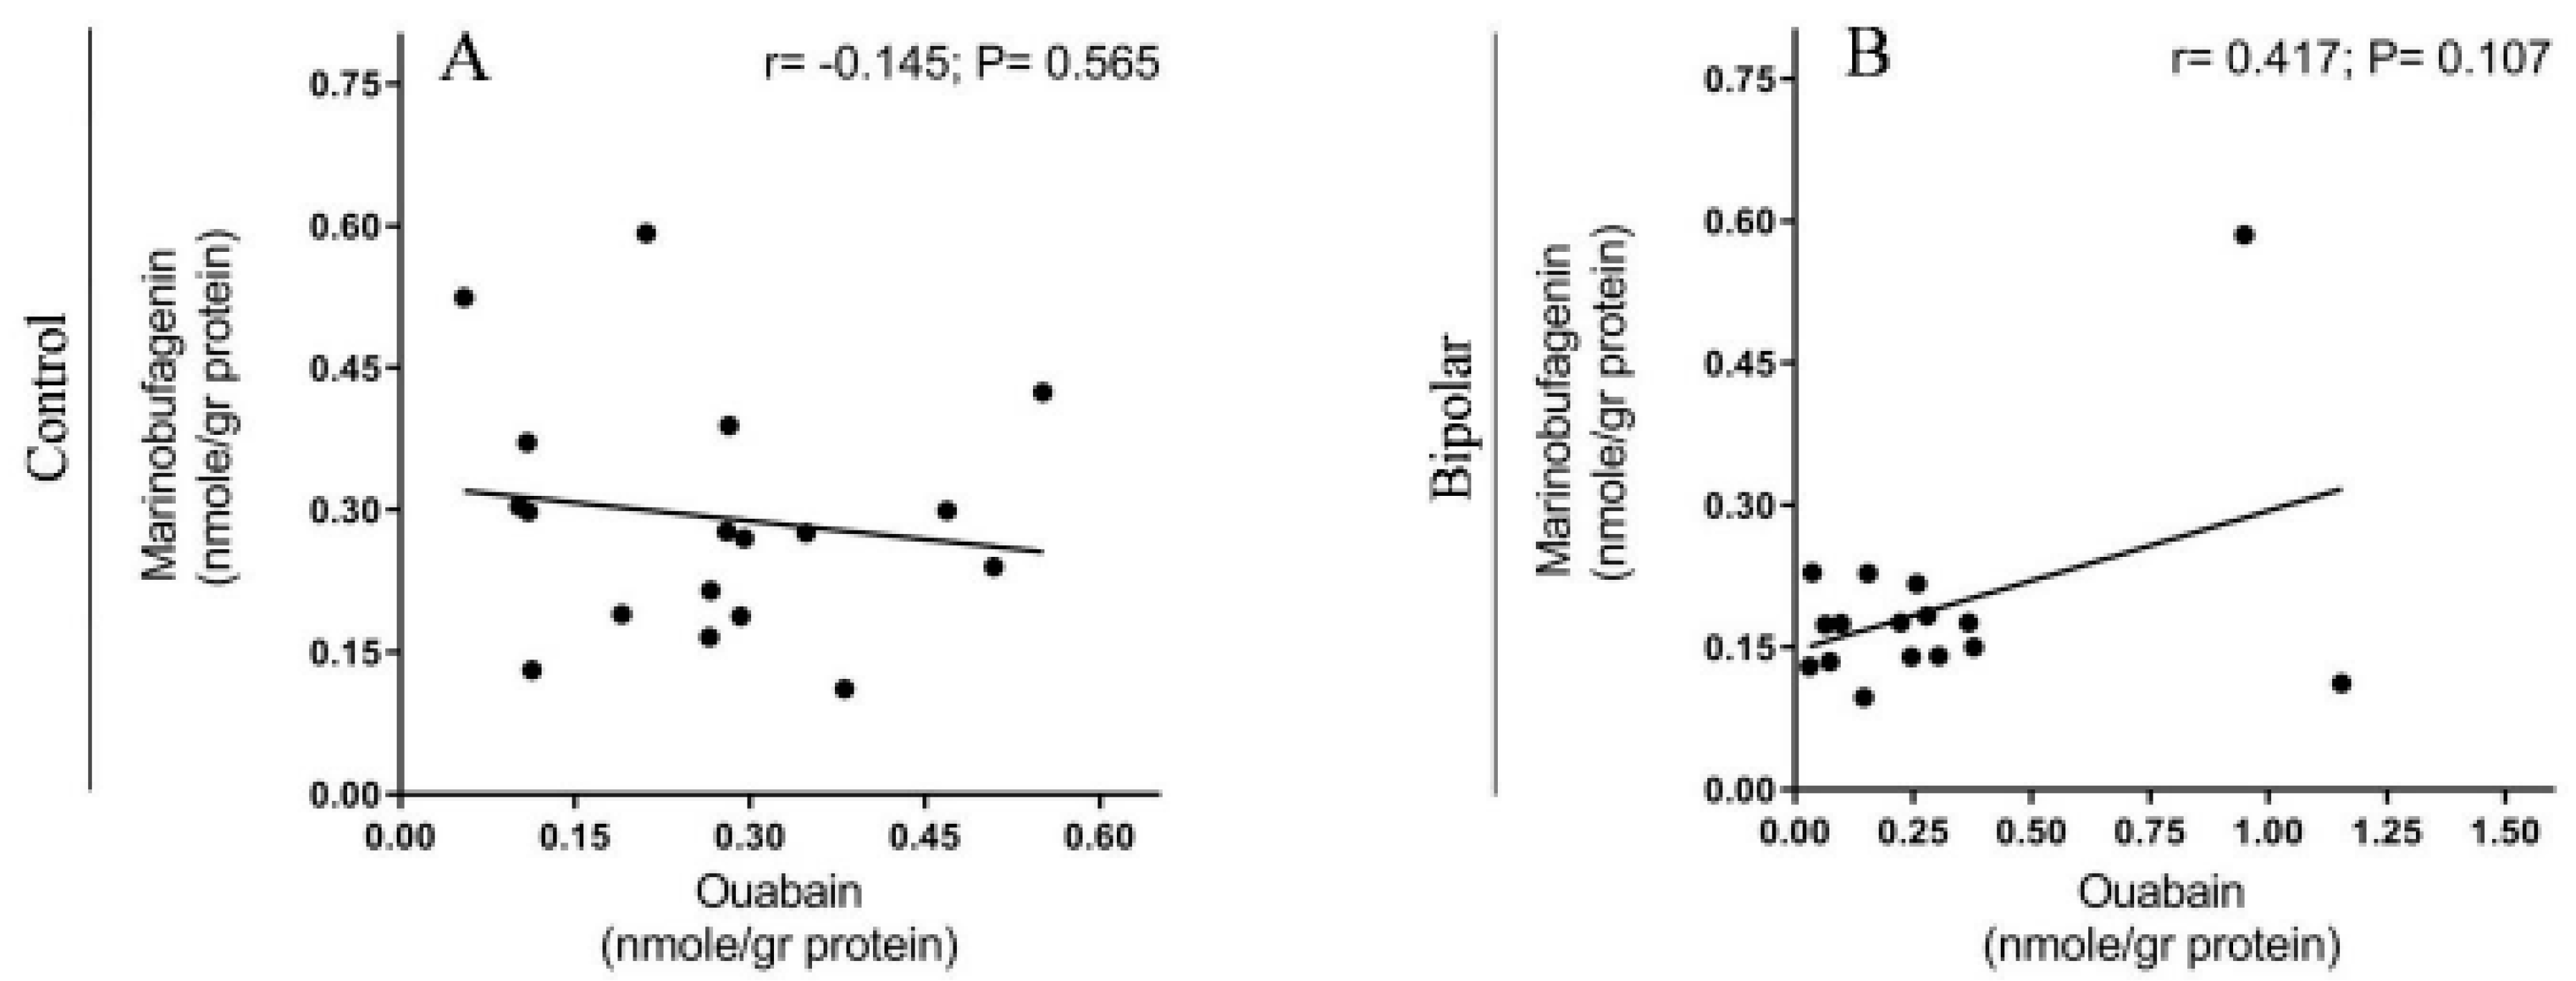
2.2. Endogenous OUA and MBG in the PFC of the BD Patients and the Controls
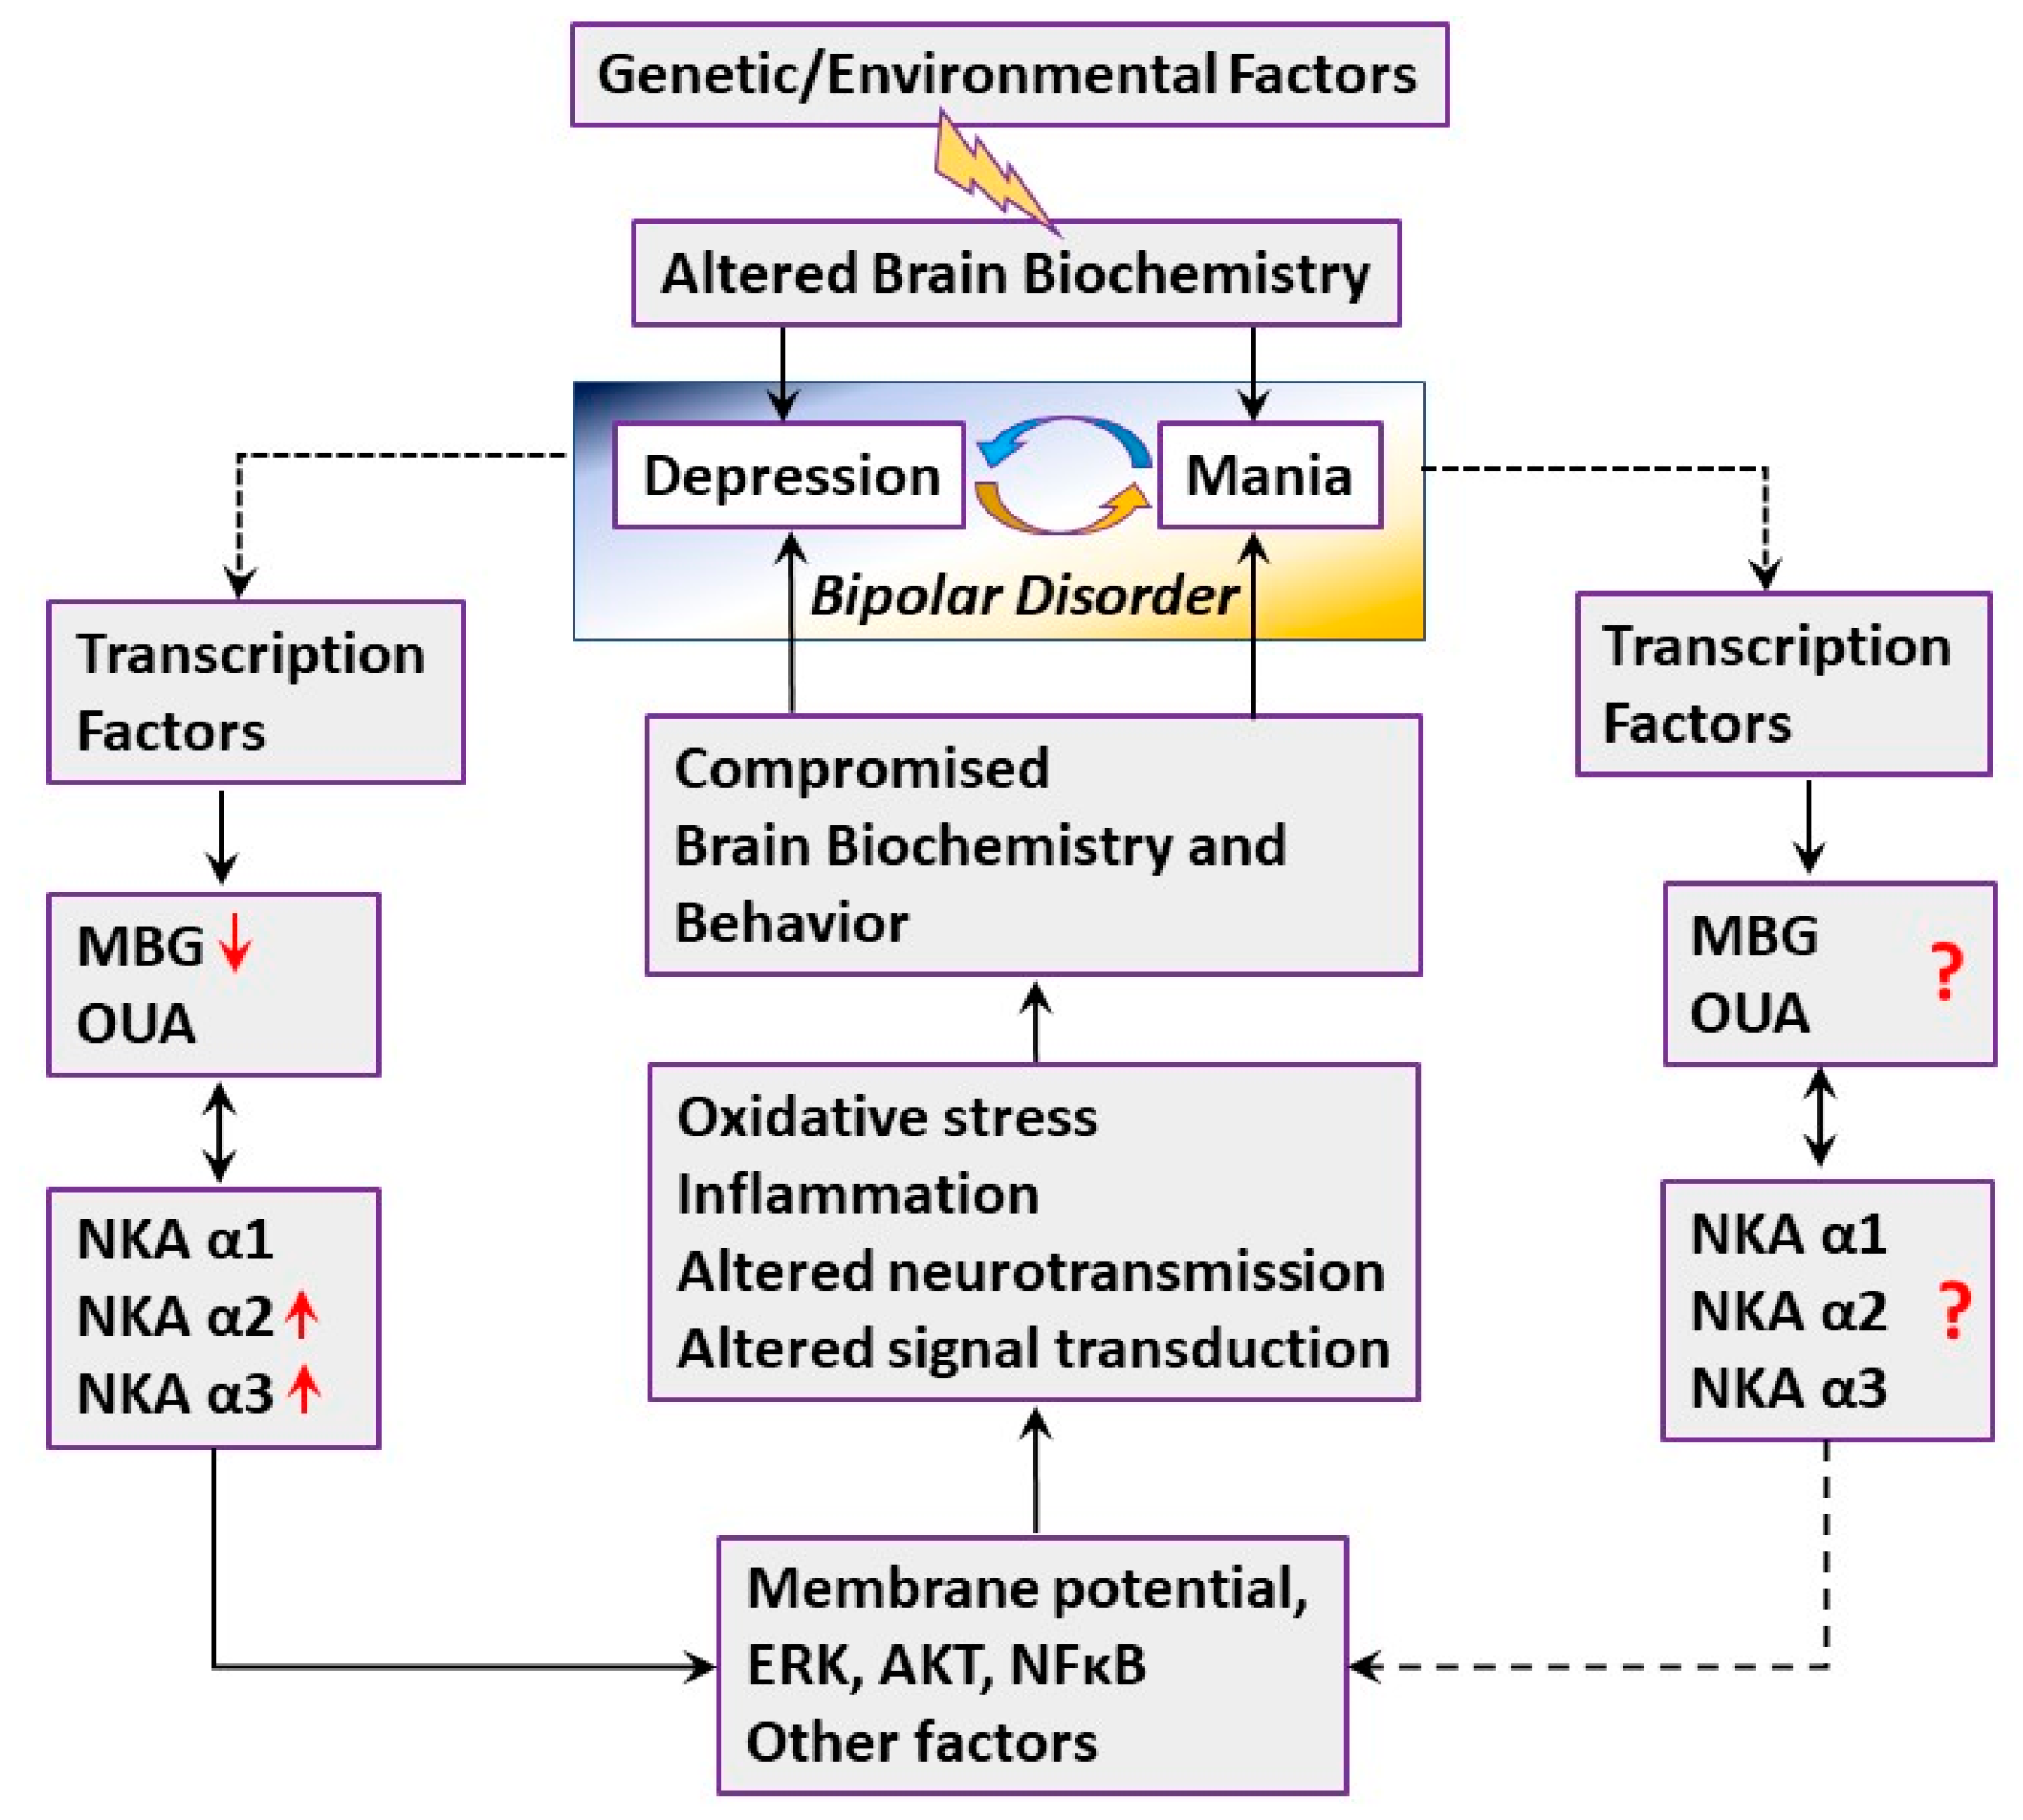
Endogenous OUA and MBG are ligands of Na+, K+-ATPase, which triggers the inhibition of ion transport and intercellular signaling cascades in different tissues, including the brain (see the introduction). We tested, therefore, the levels of these steroids in PFC brain samples from the BD patients and the controls. Importantly, the tissue samples used for the determination of endogenous OUA and MBG were adjacent to the samples used for the protein extraction and the α isoform determinations described above. As the determinations of OUA and MBG in this study were based on the interaction with antibodies, actually, cross-immunoreactive material was being measured. However, because the anti-OUA antibodies and anti-MBG antibodies used were previously shown to be highly specific, recognizing predominantly OUA and MBG, respectively (see the materials and methods), the terms endogenous OUA and endogenous MBG are used.
Both OUA and MBG are present in the human PFC, ranging between 0.1 and 0.5 nmoles/g protein (or 0.3–1.5 pmoles/g tissue). Analysis of all the samples showed no difference in steroid levels between men and women (Figure 3), nor any correlation with age (Figure 4). Significantly lower levels of OUA (0.177 ± 0.028), but not of MBG, were detected in smokers compared with those in non-smokers (0.291 ± 0.0316) (Figure 5).
Significantly lower levels of MBG (34.5%) were detected in BD patients (0.164 ± 0.009 nmoles/g protein) as compared with those in the controls (0.298 ± 0.075 nmoles/g protein) (Figure 6). The OUA levels did not differ between the groups (controls, 0.269 ± 0.032; BD patients, 0.284 ± 0.029 nmoles/g protein). Cross-correlation analysis between the OUA and MBG levels in the controls (Figure 7A) and in the BD patients (Figure 7B) showed a lack of association between the two steroids, suggesting that they differ both metabolically and functionally (see below).
Cross-correlations between the levels of different α isoforms and the steroids revealed interesting observations. The correlation between the α1 isoform and the OUA levels in the BD patients and the controls is shown in Figure 8A,B. Whereas a significant correlation between the two parameters was seen in the controls (Figure 8A), no correlation was observed in the BD samples (Figure 8B). There was no significant correlation between the α1 isoform and MBG levels in the samples of both the controls and the BD patients (Figure 8C,D). The correlations between the α2 and α3 isoforms and the two steroids in the controls and the BD patients were not significant (see Supplementary Materials file 1, Figure 1 and Figure 2).

3. Discussion

In the present study, we found that the levels of the α2 and α3 isoforms of the Na+, K+-ATPase are significantly higher in the PFC of BD patients in comparison with those of age- and gender-matched controls. This is in agreement with our previous study demonstrating an increase in the α2 and α3 isoforms in the parietal cortex of BD patients [38]. A study on the temporal cortex, however, showed that the levels of the three α isoforms were not significantly different between BD patients and controls [26]. Furthermore, lower α2, but not α1 or α3, isoform levels were found in the temporal cortex of BD patients [39]. Cumulatively, these findings show that the levels of the αisoforms of the Na+, K+-ATPase in the brain differ between BD patients and controls and that the changes vary between different brain regions. It is well established that alterations in both neuronal [40,41] and glial cells [42,43] occur in the brain of BD patients. It is therefore not surprising that we detected alterations in both the α2 and α3 isoforms, which are largely expressed in glial [14] and neuronal cells [15,16], respectively. The increase in α2 and α3 isoforms in the PFC of BD patients may be part of the etiology of the disease or a consequence of its development. In either case, it is reasonable to suggest that the increase in the isoform levels results from the increased activity of the particular cells. This is similar to the upregulation of muscle a2 isoform levels following exercise [44] and the increase in the α3 isoform following excessive neuronal stimulation [17]. Importantly, since all BD patients received psychoactive drugs (Table 1), we cannot discriminate between the effect of the disease and a possible effect of the medications.
We observed a significant positive correlation between the level of expression of the three α isoforms of the Na+, K+-ATPase in the PFC of the controls (Figure 2A–C) and BD patients (Figure 2D–F). Namely, individuals with a high α1 isoform level also had a relatively high level of the α2 and α3 isoforms. This link in the expression of the isoforms suggests the existence of a regulatory relationship between the three isoforms. Indeed, it was previously demonstrated that knockdown of one isoform affects the expression of the others. For example, knockdown of the α2 isoform in skeletal muscle cells upregulated the α1 isoform 2.5-fold [45]. In addition, an increase in α1-mRNA decreased α3-mRNA levels in the aging rat cerebral cortex [46], but α1 and α3 changed in an opposite way in heart failure, as did α1 and α2 in heart hypertrophy [47]. In view of the positive relationships between the isoforms in the brain tissue of the controls and the BD patients, it is reasonable to assume that when brain Na+, K+-ATPase levels increase or decrease, in different people, due to general metabolic changes, they will be reflected by similar changes in the three α isoforms. Such fluctuations may result, for example, from cerebral ischemia or lipid metabolism, which are known to alter Na+, K+-ATPase expression [48,49,50].
ECSs are normal constituents of the bovine hypothalamus, rat brain, and human CSF [11]. Immunohistochemical studies of mammalian brains revealed high concentrations of these steroids in the paraventricular nucleus and the supraoptic nucleus [51]. Cultured rat hypothalamic neurons were shown to secrete CS in vitro [51,52], supporting the premise that the hypothalamus is the source of endogenous brain CS. The physiological role of ECS in the brain and periphery was recently reviewed [8,11]
We did not observe any difference in OUA and MBG levels in the PFC between men and women nor any correlation with age (Figure 3 and Figure 4). However, there were lower levels of OUA in the PFC of smokers compared with those in non-smokers (Figure 5). A previous study showed increased levels of plasma OUA in men versus women, and in smokers versus non-smokers [53,54]. These differences between changes in the brain and peripheral OUA levels further emphasize the metabolic separation of different ECS in the two compartments, as described previously [8].
The determination of ECS in the brain tissue of BD patients may shed light on the possible involvement of these steroids in this pathological state. In a previous study on the parietal cortex, we found that OUA, but not MBG, levels were significantly higher in BD patients than in normal individuals [26]. In the temporal cortex, opposite results were obtained: Endogenous OUA levels were lower in BD patients relative to that of the controls. However, these difference were not of statistical significance, probably due to the small group studied and the large variations in endogenous OUA levels in the population [38]. To resolve this contradiction, and to focus on a brain area more relevant to BD, the present study determined OUA and MBG levels in larger groups (20 samples per group) of postmortem samples from the PFC of BD and normal subjects. Our results show that the levels of MBG in the PFC of BD patients are lower than those in normal subjects (Figure 6). OUA levels, on the other hand, were the same in the two groups. Clearly, these findings indicate that MBG may be involved in the etiology of BD. In addition, the reported effects of smoking on Na+, K+-ATPase activity [55] and the recently described finding of a causal risk factor of smoking for developing bipolar disorder [56] should prompt a study on the determination of brain OUA and MBG levels in a large group of BD and controls.
The lack of a correlation between OUA and MBG in both the controls and the BD patients (Figure 7) suggests that the two compounds, although structurally similar, are metabolically separated. Indeed, previous studies showed that although cholesterol is a common precursor for both steroids, side-chain cleavage is essential for EO biosynthesis [8,57], whereas MBG synthesis is thought to occur via further metabolism of cholanic acid [58]. The differences in the levels of the steroids in BD are in accord with recent observations of altered steroid biosynthesis in the PFC of BD patients [59].
A significant positive correlation was found between the OUA and α1 isoform levels in the PFC of the control (Figure 8A). The most plausible explanation for this correlation is that OUA has a regulatory role in controlling the expression of this isoform. The many observations on the effect of OUA on the translation and transcription of numerous proteins [60,61] are in accord with this notion. It should be noted that this correlation is absent in samples from BD patients (Figure 8B), suggesting that fundamental metabolic processes related to the ECS-Na+, K+-ATPase system are impaired in the disease state.
The hypothesis that monoamine depletion contributes to mood disorder pathology, a notion referred to as the ‘monoamine hypothesis’, received great attention in neurobiological studies of mood disorders [62]. Accordingly, monoamine neuronal reuptake and degradation inhibitors were developed for the treatment of mood disorders. However, the slow pace of action of these drugs, their side-effects, and poor response in a significant proportion of patients suggests that additional mechanisms participate in the pathophysiology of mood disorders and of BD in particular. To this end, studies in recent years have focused on the involvement of additional neurotransmitter/neuromodulators systems [63,64,65], mitochondrial function [66], and inflammation [67] in the etiology of BD. It is well established that Na+, K+-ATPase and ECS affect all these systems: They are involved in neurotransmitter release and reuptake [10,68], mitochondrial function [69], and inflammation [70]. Hence, the increase in the α2 and α3 isoforms of the Na+, K+-ATPase and the decrease in MBG in the PFC of BD patients, as found in this study, may be an intimate part of the molecular mechanisms of BD. Whether these changes are a cause or consequence of BD merits further investigation.
The present study describes for the first time alterations in Na+, K+-ATPase α isoforms and endogenous OUA and MBG in the PFC of BD patients., Our results, together with previously published observations, are in accord with the hypothesis that the Na+, K+-ATPase-ECS system is involved in mood disorders.
The proposed mechanisms for the participation of Na+, K+-ATPase and ECS in BD are depicted in Figure 9. We suggest that the bipolar brain, being predisposed to the disease via an altered genome and biochemistry, exhibits the manic or depression reaction as a result of external stimuli, which include genetic and environmental factors. The death of most of the BD patients in the present study was attributed to suicide (Table 1), which suggests that they were likely in the depression state. It is possible that neurons and other brain cells stimulate multiple factors, including transcription factors, which affect brain ECS production in the depression state. These transcription factors should be determined (dotted line). We observed a decrease in the brain MBG level (Figure 6), which is likely due to the compromised biosynthesis chain of this steroid. It is conceivable that decreased MBG levels affected Na+, K+-ATPase activity, causing an increase in the levels of α2 and α3 Na+, K+-ATPase isoforms (Figure 1). The double arrow between the CSs and Na+, K+-ATPase boxes indicates the feedback in the regulation of the ECS level and Na+, K+-ATPase isoforms’ expression. The Na+, K+-ATPase–ECS interaction leads to changes in the membrane electrical potential, and the activation of mitogen-activated protein kinase (ERK, or MAPK), protein kinase B (AKT), and nuclear factor kappa-light-chain-enhancer (NFκB) [19,71], which modifies neuronal activity and neurotransmission that, in turn, participate in the regulation of behavior and BD. The oxidative stress and inflammation, which are also involved in the Na+, K+-ATPase–ECS interaction [6,29], may add to the compromised brain biochemistry and support the vicious circle of depression in BD. We also suggest that the levels of ECS are changed in the mania stage, which may cause the compromised interaction of ECS and Na+, K+-ATPase. The mania circle requires further investigation. The determination of ECS levels in the plasma or cerebrospinal fluid of BD patients may provide an additional mechanistic basis for the proposed mechanisms involved in the two stages of BD.

4. Materials and Methods

4.1. Brain Samples

All postmortem human brain tissue samples used in this study were obtained from the Human Brain Collection Core (HBCC), Intramural Research Program, of the NIMH, NIH, Bethesda, MD, USA [72]. Two groups of samples were received: 12 prefrontal brain samples (6 BD and 6 controls), which were used in a preliminary study, and a large cohort of prefrontal brain samples (20 BD and 20 controls). The demographic and clinical characteristics of the large cohort are shown in Table 1. The two groups were matched for several clinical variables. According to analysis of variance (ANOVA), the groups did not differ in age or postmortem interval, brain weight, and pH. Chi square analysis indicated that the groups did not differ in terms of gender. The NIMH received ethics approval for the brain collection.
Pulverized frozen tissues of the PFC of the two groups were used for the determination of the different α isoforms with Western blot analysis and for the determination of the endogenous OUA and MBG.

4.2. Quantification of Na+, K+-ATPase α Isoforms with Western Blot

Pulverized frozen tissues of the prefrontal cortex were kept at −80°C until analyzed. Samples were homogenized in radio-immuno-precipitation assay (RIPA) buffer supplemented with 1mM NaVO4 and Protease Inhibitor Cocktail (Sigma-Aldrich, St. Louis, MO, USA) and centrifuged (14,000× g). The protein content of the supernatants was determined with the Bio-Rad Protein Assay (Bio-Rad Laboratories, Hercules, CA, USA) according to the manufacturer’s instructions.
The samples were subjected to Western blot analysis, as previously described [26]. The following primary antibodies were used: mouse monoclonal anti-Na+, K+-ATPase-α1 subunit antibody (1:10000) (Merck, Kenilworth, NJ, USA); rabbit polyclonal anti-Na+, K+-ATPase-α2 subunit antibody (1:5000) was kindly provided by Thomas Pressley (Texas Tech University, Lubbock, TX, USA); mouse monoclonal anti-Na+, K+-ATPase-α3 subunit antibody (1:5000) and mouse monoclonal anti-GAPDH antibody were purchased from Sigma-Aldrich. Western blot analysis was performed by an individual blinded to the subjects’ identity.

4.3. Determination of Endogenous OUA and MBG in Brain Samples

Human PFC samples were thawed and homogenized in PBS (50 mg/mL), sonicated for 5 s, and centrifuged (5 min, 1000 × g) to remove tissue debris. The supernatants were used for the protein measurements (Bio-Rad Protein Assay) and for steroid extraction with C18 Sep-Pak cartridges (Waters Inc., Cambridge, MA, USA). The cartridges were activated with 10 mL of 100% acetonitrile and washed with 10 mL of water. Then, 0.5 mL of brain extract sample were applied to the cartridges and eluted with 7 mL of 20% acetonitrile, followed by 7 mL of 80% acetonitrile in the same vial. This enabled the elution of material with lower and higher polarity, respectively, and allowed measurement of the OUA and MBG in the samples [73]. The samples were then vacuum dried and kept at −80°C. Before the immunoassays, the samples were reconstituted in the initial volume of assay buffer. MBG and OUA were measured with a fluoroimmunoassay (Dissociation-Enhanced Lanthanide Fluorescent Immunoassay (DELFIA)). The MBG assay is based on a murine monoclonal anti-MBG 4G4 mAb (1:1000), as described in detail [74]. This assay is based on the competition between immobilized antigen (MBG-bovine serum albumin (MBG-BSA) glycoside-thyroglobulin) and MBG, other cross-reactants, or endogenous CTS within the sample for a limited number of binding sites on an anti-MBG mAbs. Secondary (goat anti-mouse) antibody labeled with fluorescent europium was obtained from Perkin-Elmer, Inc. (Waltham, MA, USA). More details about these immunoassays, including cross-immunoreactivity of the antibodies and the examples of the calibration curves, are provided in the (Supplementary Material file 2). The endogenous OUA assays were based on a similar principle, here using an ouabain–thyroglobulin conjugate and ouabain antiserum (anti-OU-M, 1:20000) obtained from rabbits immunized with a mixture of ouabain–BSA and ouabain–RNAase conjugates [74]. Secondary (mouse anti-rabbit) antibody labeled with fluorescent europium was obtained from Perkin-Elmer, Inc. The final concentration of the endogenous steroids in the PFC was expressed as nmoles/g protein and in pmoles/g protein. The calculation was based on the concentration of steroids and concentration of protein in the supernatant and/or the amount of tissue in grams used for the extraction. Determination of the steroids was performed by an individual blinded to the subjects’ identity.

4.4. Statistical Analysis

The data are presented as the means ± standard error. The band density values obtained from the immunostained α isoforms and ECS were analyzed statistically with the two-tailed paired t-test. Parameter levels ±3S.D. from the mean were considered outliers (maximum 3 samples out of the 20) and deleted from statistical analysis. Statistical analysis and calculations of Pearson’s correlation coefficient were performed with GraphPad Prism v 8.3.1 (GraphPad Software, Inc., CA, USA) and Gaussian Population (Pearson) with two-tailed parametric analyses p < 0.05 was considered significant.

Supplementary Materials

The following are available online at https://0-www-mdpi-com.brum.beds.ac.uk/1422-0067/21/16/5912/s1. Supplementary file 1 contains Supplementary Figures. Supplementary file 2 contains additional information on material and methods.

Author Contributions

Conceptualization, D.L., O.V.F. and S.V.S.; Methodology, S.V.S., O.V.F., W.W., N.H. and H.R.; Funding Acquisition, D.L.; Writing—Review and Editing, D.L., S.V.S., A.I. and O.V.F. All authors have read and agreed to the published version of the manuscript.

Funding

This work was supported in part by Israel Science Foundation Grant No. 039-4964 to DL and by an Intramural Research Program, National Institute on Aging, National Institutes of Health, USA.

Acknowledgments

The tissue used in this research was obtained from the Human Brain Collection Core, Intramural Research Program, NIMH, NIH [72]. We also thank Thomas Pressley (Texas Tech University, Lubbock, Texas) for the gift of α2-subunit of Na+, K+-ATPase antibodies, and Norman Grover for assistance in the statistical analyses.

Conflicts of Interest

The authors declare that there is no conflict of interest.

Abbreviations

BD:Bipolar Disorder
PFC:Prefrontal Cortex
CS:Cardiac Steroids
ECS:Endogenous Cardiac Steroids
OUA:Ouabain
MBG:Marinobufagenin
Na+, K+-ATPase:Sodium-Potassium-Activated Adenosine Triphosphatase
HBCCHuman Brain Collection Core

References

  1. Grande, I.; Berk, M.; Birmaher, B.; Vieta, E. Bipolar disorder. Lancet 2016, 387, 1561–1572. [Google Scholar] [CrossRef]
  2. Nierenberg, A.A.; Sylvia, L.G.; Leon, A.C.; A Reilly-Harrington, N.; Shesler, L.W.; McElroy, S.L.; Friedman, E.S.; Thase, M.E.; Shelton, R.C.; Bowden, C.L.; et al. Clinical and Health Outcomes Initiative in Comparative Effectiveness for Bipolar Disorder (Bipolar CHOICE): A pragmatic trial of complex treatment for a complex disorder. Clin. Trials 2014, 11, 114–127. [Google Scholar] [CrossRef] [PubMed] [Green Version]
  3. Whayne, T.F., Jr. Clinical Use of Digitalis: A State of the Art Review. Am. J. Cardiovasc. Drugs 2018, 18, 427–440. [Google Scholar] [CrossRef]
  4. Buckalew, V.M. Endogenous digitalis-like factors: An overview of the history. Front. Endocrinol. (Lausanne) 2015, 6, 49. [Google Scholar] [CrossRef] [PubMed] [Green Version]
  5. Leenen, F.H.H.; Blaustein, M.P.; Hamlyn, J.M. Update on angiotensin II: New endocrine connections between the brain, adrenal glands and the cardiovascular system. Endocr. Connect. 2017, 6, R131–R145. [Google Scholar] [CrossRef] [PubMed]
  6. Bagrov, A.Y.; Shapiro, J.I.; Fedorova, O.V. Endogenous cardiotonic steroids: Physiology, pharmacology, and novel therapeutic targets. Pharmacol. Rev. 2009, 61, 9–38. [Google Scholar] [CrossRef] [PubMed]
  7. Dvela, M.; Rosen, H.; Ben-Ami, H.C.; Lichtstein, D. Endogenous ouabain regulates cell viability. Am. J. Physiol. Cell Physiol. 2012, 302, C442–C452. [Google Scholar] [CrossRef] [Green Version]
  8. Leenen, F.H.H.; Wang, H.W.; Hamlyn, J.M. Sodium pumps, ouabain and aldosterone in the brain: A neuromodulatory pathway underlying salt-sensitive hypertension and heart failure. Cell Calcium 2020, 86, 102151. [Google Scholar] [CrossRef]
  9. Fedorova, O.V.; Agalakova, N.I.; Talan, M.I.; Lakatta, E.G.; Bagrov, A.Y. Brain ouabain stimulates peripheral marinobufagenin via angiotensin II signalling in NaCl-loaded Dahl-S rats. J. Hypertens. 2005, 23, 1515–1523. [Google Scholar] [CrossRef]
  10. Lichtstein, D.; Rosen, H. Endogenous digitalis-like Na+, K+-ATPase inhibitors, and brain function. Neurochem. Res. 2001, 26, 971–978. [Google Scholar] [CrossRef]
  11. Hodes, A.; Lichtstein, D. Natriuretic hormones in brain function. Front. Endocrinol. (Lausanne) 2014, 5, 201. [Google Scholar] [CrossRef] [PubMed] [Green Version]
  12. Rossier, B.C.; Baker, M.E.; Studer, R.A. Epithelial sodium transport and its control by aldosterone: The story of our internal environment revisited. Physiol. Rev. 2015, 95, 297–340. [Google Scholar] [CrossRef] [PubMed] [Green Version]
  13. Clausen, M.V.; Hilbers, F.; Poulsen, H. The Structure and Function of the Na,K-ATPase Isoforms in Health and Disease. Front. Physiol. 2017, 8, 371. [Google Scholar] [CrossRef] [PubMed]
  14. McGrail, K.M.; Phillips, J.M.; Sweadner, K.J. Immunofluorescent localization of three Na,K-ATPase isozymes in the rat central nervous system: Both neurons and glia can express more than one Na,K-ATPase. J. Neurosci. 1991, 11, 381–391. [Google Scholar] [CrossRef] [PubMed]
  15. Bottger, P.; Tracz, Z.; Heuck, A.; Nissen, P.; Romero-Ramos, M.; Lykke-Hartmann, K. Distribution of Na/K-ATPase alpha 3 isoform, a sodium-potassium P-type pump associated with rapid-onset of dystonia parkinsonism (RDP) in the adult mouse brain. J. Comp. Neurol. 2011, 519, 376–404. [Google Scholar] [CrossRef]
  16. Blom, H.; Ronnlund, D.; Scott, L.; Spicarova, Z.; Widengren, J.; Bondar, A.; Aperia, A.; Brismar, H. Spatial distribution of Na+-K+-ATPase in dendritic spines dissected by nanoscale superresolution STED microscopy. BMC Neurosci. 2011, 12, 16. [Google Scholar] [CrossRef] [Green Version]
  17. Shrivastava, A.N.; Triller, A.; Melki, R. Cell biology and dynamics of Neuronal Na(+)/K(+)-ATPase in health and diseases. Neuropharmacology 2020, 169, 107461. [Google Scholar] [CrossRef] [PubMed]
  18. Madan, N.; Xu, Y.; Duan, Q.; Banerjee, M.; Larre, I.; Pierre, S.V.; Xie, Z. Src-independent ERK signaling through the rat alpha3 isoform of Na/K-ATPase. Am. J. Physiol. Cell Physiol. 2017, 312, C222–C232. [Google Scholar] [CrossRef] [PubMed]
  19. Cui, X.; Xie, Z. Protein Interaction and Na/K-ATPase-Mediated Signal Transduction. Molecules 2017, 22, 990. [Google Scholar]
  20. Zhang, Y.; Wei, W.; Shilova, V.; Petrashevskaya, N.N.; Zernetkina, V.I.; Grigorova, Y.N.; Marshall, C.A.; Fenner, R.C.; Lehrmann, E.; Woodlll, W.H.; et al. Monoclonal Antibody to Marinobufagenin Downregulates TGFbeta Profibrotic Signaling in Left Ventricle and Kidney and Reduces Tissue Remodeling in Salt-Sensitive Hypertension. J. Am. Heart Assoc. 2019, 8, e012138. [Google Scholar] [CrossRef]
  21. Goldstein, I.; Lerer, E.; Laiba, E.; Mallet, J.; Mujaheed, M.; Laurent, C.; Rosen, H.; Ebstein, R.P.; Lichtstein, D. Association between sodium- and potassium-activated adenosine triphosphatase alpha isoforms and bipolar disorders. Biol. Psychiatry 2009, 65, 985–991. [Google Scholar] [CrossRef] [PubMed]
  22. Kirshenbaum, G.S.; Clapcote, S.J.; Duffy, S.; Burgess, C.R.; Petersen, J.; Jarowek, K.J.; Yücel, Y.H.; Cortez, M.A.; Snead, O.C.; Vilsen, B.; et al. Mania-like behavior induced by genetic dysfunction of the neuron-specific Na+,K+-ATPase {alpha}3 sodium pump. Proc. Natl. Acad. Sci. USA 2011, 108, 18144–18149. [Google Scholar] [CrossRef] [PubMed] [Green Version]
  23. Holm, T.H.; Lykke-Hartmann, K. Insights into the Pathology of the alpha3 Na(+)/K(+)-ATPase Ion Pump in Neurological Disorders; Lessons from Animal Models. Front. Physiol. 2016, 7, 209. [Google Scholar] [CrossRef] [PubMed] [Green Version]
  24. Looney, S.W.; El-Mallakh, R.S. Meta-analysis of erythrocyte Na,K-ATPase activity in bipolar illness. Depress. Anxiety 1997, 5, 53–65. [Google Scholar] [CrossRef]
  25. El-Mallakh, R.S.; Stoddard, M.; Jortani, S.A.; El-Masri, M.A.; Sephton, S.; Valdes, R., Jr. Aberrant regulation of endogenous ouabain-like factor in bipolar subjects. Psychiatry Res. 2010, 178, 116–120. [Google Scholar] [CrossRef]
  26. Goldstein, I.; Levy, T.; Galili, D.; Ovadia, H.; Yirmiya, R.; Rosen, H.; Lichtstein, D. Involvement of Na(+), K(+)-ATPase and endogenous digitalis-like compounds in depressive disorders. Biol. Psychiatry 2006, 60, 491–499. [Google Scholar] [CrossRef]
  27. Hodes, A.; Rosen, H.; Deutsch, J.; Lifschytz, T.; Einat, H.; Lichtstein, D. Endogenous cardiac steroids in animal models of mania. Bipolar Disord. 2016, 18, 451–459. [Google Scholar] [CrossRef]
  28. Goldstein, I.; Lax, E.; Gispan-Herman, I.; Ovadia, H.; Rosen, H.; Yadid, G.; Lichtstein, D. Neutralization of endogenous digitalis-like compounds alters catecholamines metabolism in the brain and elicits anti-depressive behavior. Eur. Neuropsychopharmacol. 2012, 22, 72–79. [Google Scholar] [CrossRef]
  29. Hodes, A.; Lifschytz, T.; Rosen, H.; Cohen Ben-Ami, H.; Lichtstein, D. Reduction in endogenous cardiac steroids protects the brain from oxidative stress in a mouse model of mania induced by amphetamine. Brain Res. Bull. 2018, 137, 356–362. [Google Scholar] [CrossRef]
  30. Miller, E.K.; Cohen, J.D. An integrative theory of prefrontal cortex function. Annu. Rev. Neurosci. 2001, 24, 167–202. [Google Scholar] [CrossRef] [Green Version]
  31. Fuster, J.M. The prefrontal cortex--an update: Time is of the essence. Neuron 2001, 30, 319–333. [Google Scholar] [CrossRef] [Green Version]
  32. Wei, S.; Geng, H.; Jiang, X.; Zhou, Q.; Chang, M.; Zhou, Y.; Xu, K.; Tang, Y.; Wang, F. Amygdala-prefrontal cortex resting-state functional connectivity varies with first depressive or manic episode in bipolar disorder. Neurosci. Lett. 2017, 641, 51–55. [Google Scholar] [CrossRef] [PubMed]
  33. Andreazza, A.C.; Young, L.T. The neurobiology of bipolar disorder: Identifying targets for specific agents and synergies for combination treatment. Int. J. Neuropsychopharmacol. 2014, 17, 1039–1052. [Google Scholar] [CrossRef] [PubMed] [Green Version]
  34. Hanford, L.C.; Nazarov, A.; Hall, G.B.; Sassi, R.B. Cortical thickness in bipolar disorder: A systematic review. Bipolar Disord. 2016, 18, 4–18. [Google Scholar] [CrossRef]
  35. Nenadic, I.; Maitra, R.; Dietzek, M.; Langbein, K.; Smesny, S.; Sauer, H.; Gaser, C. Prefrontal gyrification in psychotic bipolar I disorder vs. schizophrenia. J. Affect. Disord. 2015, 185, 104–107. [Google Scholar] [CrossRef]
  36. Smalheiser, N.R.; Lugli, G.; Zhang, H.; Rizavi, H.; Cook, E.H.; Dwivedi, Y. Expression of microRNAs and other small RNAs in prefrontal cortex in schizophrenia, bipolar disorder and depressed subjects. PLoS ONE 2014, 9, e86469. [Google Scholar] [CrossRef]
  37. Woo, T.U.; Kim, A.M.; Viscidi, E. Disease-specific alterations in glutamatergic neurotransmission on inhibitory interneurons in the prefrontal cortex in schizophrenia. Brain Res. 2008, 1218, 267–277. [Google Scholar] [CrossRef] [Green Version]
  38. Hodes, A.; Rosen, H.; Ami, H.C.-B.; Lichtstein, D. Na(+), K(+)-ATPase alpha3 isoform in frontal cortex GABAergic neurons in psychiatric diseases. J. Psychiatr. Res. 2019, 115, 21–28. [Google Scholar]
  39. Rose, A.M.; Mellett, B.J.; Valdes, R., Jr.; Kleinman, J.E.; Herman, M.M.; Li, R.; El-Mallakh, R.S. Alpha 2 isoform of the Na,K-adenosine triphosphatase is reduced in temporal cortex of bipolar individuals. Biol. Psychiatry 1998, 44, 892–897. [Google Scholar] [CrossRef]
  40. Gigase, F.A.J.; Snijders, G.; Boks, M.P.; de Witte, L.D. Neurons and glial cells in bipolar disorder: A systematic review of postmortem brain studies of cell number and size. Neurosci. Biobehav. Rev. 2019, 103, 150–162. [Google Scholar] [CrossRef]
  41. Duman, R.S.; Sanacora, G.; Krystal, J.H. Altered Connectivity in Depression: GABA and Glutamate Neurotransmitter Deficits and Reversal by Novel Treatments. Neuron 2019, 102, 75–90. [Google Scholar] [CrossRef] [PubMed]
  42. Dong, X.H.; Zhen, X.C. Glial pathology in bipolar disorder: Potential therapeutic implications. CNS Neurosci. Ther. 2015, 21, 393–397. [Google Scholar] [CrossRef] [PubMed]
  43. Keshavarz, M. Glial cells as key elements in the pathophysiology and treatment of bipolar disorder. Acta Neuropsychiatr. 2017, 29, 140–152. [Google Scholar] [CrossRef] [PubMed]
  44. Nielsen, O.B.; Clausen, T. The Na+/K(+)-pump protects muscle excitability and contractility during exercise. Exerc. Sport Sci. Rev. 2000, 28, 159–164. [Google Scholar] [PubMed]
  45. Radzyukevich, T.L.; Neumann, J.C.; Rindler, T.N.; Oshiro, N.; Goldhamer, D.J.; Lingrel, J.B.; Heiny, J.A. Tissue-specific role of the Na,K-ATPase alpha2 isozyme in skeletal muscle. J. Biol. Chem. 2013, 288, 1226–1237. [Google Scholar] [CrossRef] [PubMed] [Green Version]
  46. Chauhan, N.; Siegel, G. Na,K-ATPase: Increases in alpha1-messenger RNA and decreases in alpha3-messenger RNA levels in aging rat cerebral cortex. Neuroscience 1997, 78, 7–11. [Google Scholar]
  47. Fedorova, O.V.; Talan, M.I.; Agalakova, N.I.; Lakatta, E.G.; Bagrov, A.Y. Coordinated shifts in Na/K-ATPase isoforms and their endogenous ligands during cardiac hypertrophy and failure in NaCl-sensitive hypertension. J. Hypertens. 2004, 22, 389–397. [Google Scholar] [CrossRef]
  48. Pimentel, V.C.; Zanini, D.; Cardoso, A.M.; Schmatz, R.; Bagatini, M.D.; Gutierres, J.M.; Carvalho, F.B.; Gomes, J.L.; Rubin, M.A.; Morsch, V.M.; et al. Hypoxia-ischemia alters nucleotide and nucleoside catabolism and Na+,K+-ATPase activity in the cerebral cortex of newborn rats. Neurochem. Res. 2013, 38, 886–894. [Google Scholar] [CrossRef]
  49. Bystriansky, J.S.; Ballantyne, J.S. Gill Na+-K+-ATPase activity correlates with basolateral membrane lipid composition in seawater- but not freshwater-acclimated Arctic char (Salvelinus alpinus). Am. J. Physiol. Regul. Integr. Comp. Physiol. 2007, 292, R1043–R1051. [Google Scholar] [CrossRef]
  50. Nagafuji, T.; Koide, T.; Takato, M. Neurochemical correlates of selective neuronal loss following cerebral ischemia: Role of decreased Na+,K(+)-ATPase activity. Brain Res. 1992, 571, 265–271. [Google Scholar] [CrossRef]
  51. Yamada, H.; Ihara, N.; Takahashi, H.; Yoshimura, M.; Sano, Y. Distribution of the endogenous digitalis-like substance (EDLS)-containing neurons labeled by digoxin antibody in hypothalamus and three circumventricular organs of dog and macaque. Brain Res. 1992, 584, 237–243. [Google Scholar] [CrossRef]
  52. Morgan, K.; Lewis, M.D.; Spurlock, G.; Collins, P.A.; Foord, S.M.; Southgate, K.; Scanlon, M.F.; Mir, M.A. Characterization and partial purification of the sodium-potassium-ATPase inhibitor released from cultured rat hypothalamic cells. J. Biol. Chem. 1985, 260, 13595–13600. [Google Scholar] [PubMed]
  53. Wang, J.G.; Staessen, J.A.; Messaggio, E.; Nawrot, T.; Fagard, R.; Hamlyn, J.M.; Bianchi, G.; Manunta, P. Salt, endogenous ouabain and blood pressure interactions in the general population. J. Hypertens. 2003, 21, 1475–1481. [Google Scholar] [CrossRef] [PubMed]
  54. Tripodi, G.; Citterio, L.; Kouznetsova, T.; Lanzani, C.; Florio, M.; Modica, R.; Messaggio, E.; Hamlyn, J.M.; Zagato, L.; Bianchi, G.; et al. Steroid biosynthesis and renal excretion in human essential hypertension: Association with blood pressure and endogenous ouabain. Am. J. Hypertens. 2009, 22, 357–363. [Google Scholar] [CrossRef] [PubMed] [Green Version]
  55. Miura, H.; Toyama, K.; Pratt, P.F.; Gutterman, D.D. Cigarette smoking impairs Na+-K+-ATPase activity in the human coronary microcirculation. Am. J. Physiol. Heart Circ. Physiol. 2011, 300, H109–H117. [Google Scholar] [CrossRef] [Green Version]
  56. Vermeulen, J.M.; Wootton, R.E.; Treur, J.L.; Sallis, H.; Jones, H.J.; Zammit, S.; Brink, W.V.D.; Goodwin, G.M.; De Haan, L.; Munafò, M.R. Smoking and the risk for bipolar disorder: Evidence from a bidirectional Mendelian randomisation study. Br. J. Psychiatry 2019, 1–7. [Google Scholar] [CrossRef]
  57. Lichtstein, D.; Steinitz, M.; Gati, I.; Samuelov, S.; Deutsch, J.; Orly, J. Biosynthesis of digitalis-like compounds in rat adrenal cells: Hydroxycholesterol as possible precursor. Life Sci. 1998, 62, 2109–2126. [Google Scholar] [CrossRef]
  58. Fedorova, O.V.; Zernetkina, V.I.; Shilova, V.Y.; Grigorova, Y.N.; Juhasz, O.; Wei, W.; Marshall, C.A.; Lakatta, E.G.; Bagrov, A.Y. Synthesis of an Endogenous Steroidal Na Pump Inhibitor Marinobufagenin, Implicated in Human Cardiovascular Diseases, Is Initiated by CYP27A1 via Bile Acid Pathway. Circ. Cardiovasc. Genet. 2015, 8, 736–745. [Google Scholar] [CrossRef]
  59. Qi, X.R.; Luchetti, S.; Verwer, R.W.H.; Sluiter, A.A.; Mason, M.R.J.; Zhou, J.-N.; Swaab, D.F. Alterations in the steroid biosynthetic pathways in the human prefrontal cortex in mood disorders: A post-mortem study. Brain Pathol. 2018, 28, 536–547. [Google Scholar] [CrossRef]
  60. Smolyaninova, L.V.; Shiyan, A.A.; Kapilevich, L.V.; Lopachev, A.V.; Fedorova, T.N.; Klementieva, T.S.; Moskovtsev, A.A.; Kubatiev, A.A.; Orlov, S.N. Transcriptomic changes triggered by ouabain in rat cerebellum granule cells: Role of alpha3- and alpha1-Na+,K+-ATPase-mediated signaling. PLoS ONE 2019, 14, e0222767. [Google Scholar] [CrossRef] [Green Version]
  61. Amarelle, L.; Katzen, J.; Shigemura, M.; Welch, L.C.; Cajigas, H.; Peteranderl, C.; Celli, D.; Herold, S.; Lecuona, E.; Sznajder, J.I. Cardiac glycosides decrease influenza virus replication by inhibiting cell protein translational machinery. Am. J. Physiol. Lung Cell. Mol. Physiol. 2019, 316, L1094–L1106. [Google Scholar] [CrossRef] [PubMed]
  62. Hirschfeld, R.M. History and evolution of the monoamine hypothesis of depression. J. Clin. Psychiatry 2000, 61 (Suppl. 6), 4–6. [Google Scholar] [PubMed]
  63. Blacker, C.J.; Lewis, C.P.; Frye, M.A.; Veldic, M. Metabotropic glutamate receptors as emerging research targets in bipolar disorder. Psychiatry Res. 2017, 257, 327–337. [Google Scholar] [CrossRef] [PubMed]
  64. Jeon, W.J.; Dean, B.; Scarr, E.; Gibbons, A. The Role of Muscarinic Receptors in the Pathophysiology of Mood Disorders: A Potential Novel Treatment? Curr. Neuropharmacol. 2015, 13, 739–749. [Google Scholar] [CrossRef] [PubMed] [Green Version]
  65. Lener, M.S.; Niciu, M.J.; Ballard, E.D.; Park, M.; Park, L.T.; Nugent, A.C.; Zarate, C.A. Glutamate and Gamma-Aminobutyric Acid Systems in the Pathophysiology of Major Depression and Antidepressant Response to Ketamine. Biol. Psychiatry 2017, 81, 886–897. [Google Scholar] [CrossRef] [Green Version]
  66. Morris, G.; Walder, K.; McGee, S.L.; Dean, O.M.; Tye, S.J.; Maes, M.; Berk, M. A model of the mitochondrial basis of bipolar disorder. Neurosci. Biobehav. Rev. 2017, 74, 1–20. [Google Scholar] [CrossRef]
  67. Hamdani, N.; Doukhan, R.; Kurtlucan, O.; Tamouza, R.; Leboyer, M. Immunity, inflammation, and bipolar disorder: Diagnostic and therapeutic implications. Curr. Psychiatry Rep. 2013, 15, 387. [Google Scholar] [CrossRef]
  68. Vizi, E.S.; Oberfrank, F. Na+/K(+)-ATPase, its endogenous ligands and neurotransmitter release. Neurochem. Int. 1992, 20, 11–17. [Google Scholar] [CrossRef]
  69. Li, Q.; Pogwizd, S.M.; Prabhu, S.D.; Zhou, L. Inhibiting Na+/K+ ATPase can impair mitochondrial energetics and induce abnormal Ca2+ cycling and automaticity in guinea pig cardiomyocytes. PLoS ONE 2014, 9, e93928. [Google Scholar] [CrossRef] [Green Version]
  70. Cavalcante-Silva, L.H.A.; Lima, E.A.; Carvalho, D.C.M.; De Sales-Neto, J.M.; Alves, A.K.D.A.; Galvão, J.G.F.M.; Silva, J.S.D.F.D.; Rodrigues-Mascarenhas, S. Much More than a Cardiotonic Steroid: Modulation of Inflammation by Ouabain. Front. Physiol. 2017, 8, 895. [Google Scholar] [CrossRef] [Green Version]
  71. Lichtstein, D.; Ilani, A.; Rosen, H.; Horesh, N.; Singh, S.V.; Buzaglo, N.; Hodes, A. Na(+), K(+)-ATPase Signaling and Bipolar Disorder. Int. J. Mol. Sci. 2018, 19, 2314. [Google Scholar] [CrossRef] [PubMed] [Green Version]
  72. The National Institute of Mental Health. Human Brain Collection Core (HBCC). Available online: https://www.nimh.nih.gov/research/research-conducted-at-nimh/research-areas/research-support-services/hbcc/index.shtml (accessed on 16 August 2020).
  73. Lopatin, D.A.; Ailamazian, E.K.; Dmitrieva, R.I.; Shpen, V.M.; Fedorova, O.V.; Doris, P.A.; Bagrov, A.Y. Circulating bufodienolide and cardenolide sodium pump inhibitors in preeclampsia. J. Hypertens. 1999, 17, 1179–1187. [Google Scholar] [CrossRef] [PubMed]
  74. Fedorova, O.V.; Simbirtsev, A.S.; Kolodkin, N.I.; Kotov, A.Y.; Agalakova, N.I.; Kashkin, V.; Tapilskaya, N.I.; Bzhelyansky, A.; Reznik, V.A.; Frolova, E.V.; et al. Monoclonal antibody to an endogenous bufadienolide, marinobufagenin, reverses preeclampsia-induced Na/K-ATPase inhibition and lowers blood pressure in NaCl-sensitive hypertension. J. Hypertens. 2008, 26, 2414–2425. [Google Scholar] [CrossRef] [PubMed] [Green Version]
Figure 1. Na+, K+ ATPase α isoform expression in PFC of BD patients and controls. Na+, K+-ATPase α subunit isoform expression in postmortem prefrontal cortex samples of controls and BD patients (n = 20 per group) was determined by Western blot analysis, as described in the materials and methods. (A): Representative Western blots. (B): Quantitative isoform expression. The values were normalized to glyceraldehyde 3-phosphate dehydrogenase (GAPDH). The bars represent the means; the error bars represent the standard error of the means; * differ from the control group p < 0.05; ns: non-significant.
Ijms 21 05912 g001
Figure 2. The correlation between the expression of the Na+, K+-ATPase α isoforms in the PFC of controls and BD patients. The different isoform expression levels (Figure 1) in the controls (AC) and BD patients (DF) were correlated. The Pearson correlation coefficient (r) and the p value (two tailed) were calculated by using correlation analysis (GraphPad Prism v 8.3.1).
Ijms 21 05912 g002
Figure 3. Endogenous OUA- and MBG levels in PFC in men and women. OUA (A) and MBG (B) immuno-reactivity levels in the postmortem PFC of all samples assayed were determined with DELFIA, as described in the materials and methods. Bars represent the means; error bars represent the standard error of the means.
Ijms 21 05912 g003
Figure 4. The correlation between endogenous OUA and MBG levels in the PFC with age. The OUA and MBG immuno-reactivity levels of PFC samples of controls (A,C) and BD patients (B,D) were correlated with age. Pearson (r) and p values (two tailed), depicted in the graphs, were calculated by using correlation analysis (GraphPad Prism v 8.3.1).
Ijms 21 05912 g004
Figure 5. Endogenous OUA and MBG levels in smokers and non-smokers. OUA (A) and MBG (B) immuno-reactivity levels in the postmortem PFC of all samples assayed were determined by DELFIA, as described in the materials and methods. The bars represent the means; the error bars represent the standard error of the means. * differ from the control group p < 0.05.
Ijms 21 05912 g005
Figure 6. Endogenous OUA- and MBG levels in the PFC of BD patients and controls. OUA and MBG immuno-reactivity levels in postmortem PFC samples of controls (A) and BD (B) patients (n = 16–19) were determined with DELFIA, as described in the materials and methods. The bars represent the means; the error bars represent the standard error of the means; * differ from the control group p < 0.05; ns: non-significant.
Ijms 21 05912 g006
Figure 7. The correlation between endogenous OUA and MBG levels in the PFC of BD patients and controls. The levels of OUA and MBG immuno-reactivity (Figure 3) in BD patients (B) and controls (A) were correlated. The Pearson correlation coefficient (r) and p values (two tailed) were calculated by using correlation analysis (GraphPad Prism v 8.3.1).
Ijms 21 05912 g007
Figure 8. The correlation between the α1 isoform levels and endogenous OUA and MBG immuno-reactivity in the PFC of BD patients and controls. The levels of the α1 isoform of the Na+, K+-ATPase (Figure 1) and OUA and MBG immuno-reactivity (Figure 3) in BD patients (C,D) and controls (A,B) were correlated. The Pearson correlation coefficient (r) and the p value (two tailed) were calculated by using correlation analysis (GraphPad Prism v 8.3.1).
Ijms 21 05912 g008
Figure 9. Proposed model for the participation of Na+, K+-ATPase and endogenous cardiac steroids in bipolar disorders. See text for detail. NKA-Na+, K+-ATPase; OUA—Ouabain; MBG—Marinobufagenin; ERK—mitogen-activated protein kinase; AKT—protein kinase B; NFkB—nuclear factor kappa-light-chain-enhancer.
Ijms 21 05912 g009
Table 1. Characteristics of BD patients and unaffected controls.
Control (n = 20)Bipolar Patients (n = 20)
Age at death (years)43.12 ± 3.21 42.25 ± 3.23
Cause of death (Suicide/other)0/2015/5
Brain weight (g)1382.75 ± 23.081511.75 ± 37.58
Postmortem interval (h)30.70 ± 3.0328.97 ± 3.94
Brain tissue pH6.44 ± 0.056.34 ± 0.05
Sex (Men/Women)14/614/6
Alcohol history (none/positive)4/165/15
Use of Psychoactive drugs (none/positive)14/60/20

