Solution Structures and Dynamic Assembly of the 24-Meric Plasmodial Pdx1–Pdx2 Complex

 ,
,  , ,
, ,
Abstract
: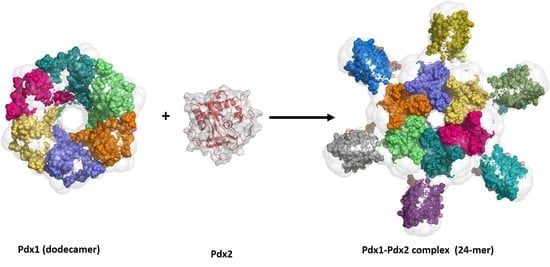
1. Introduction
2. Results
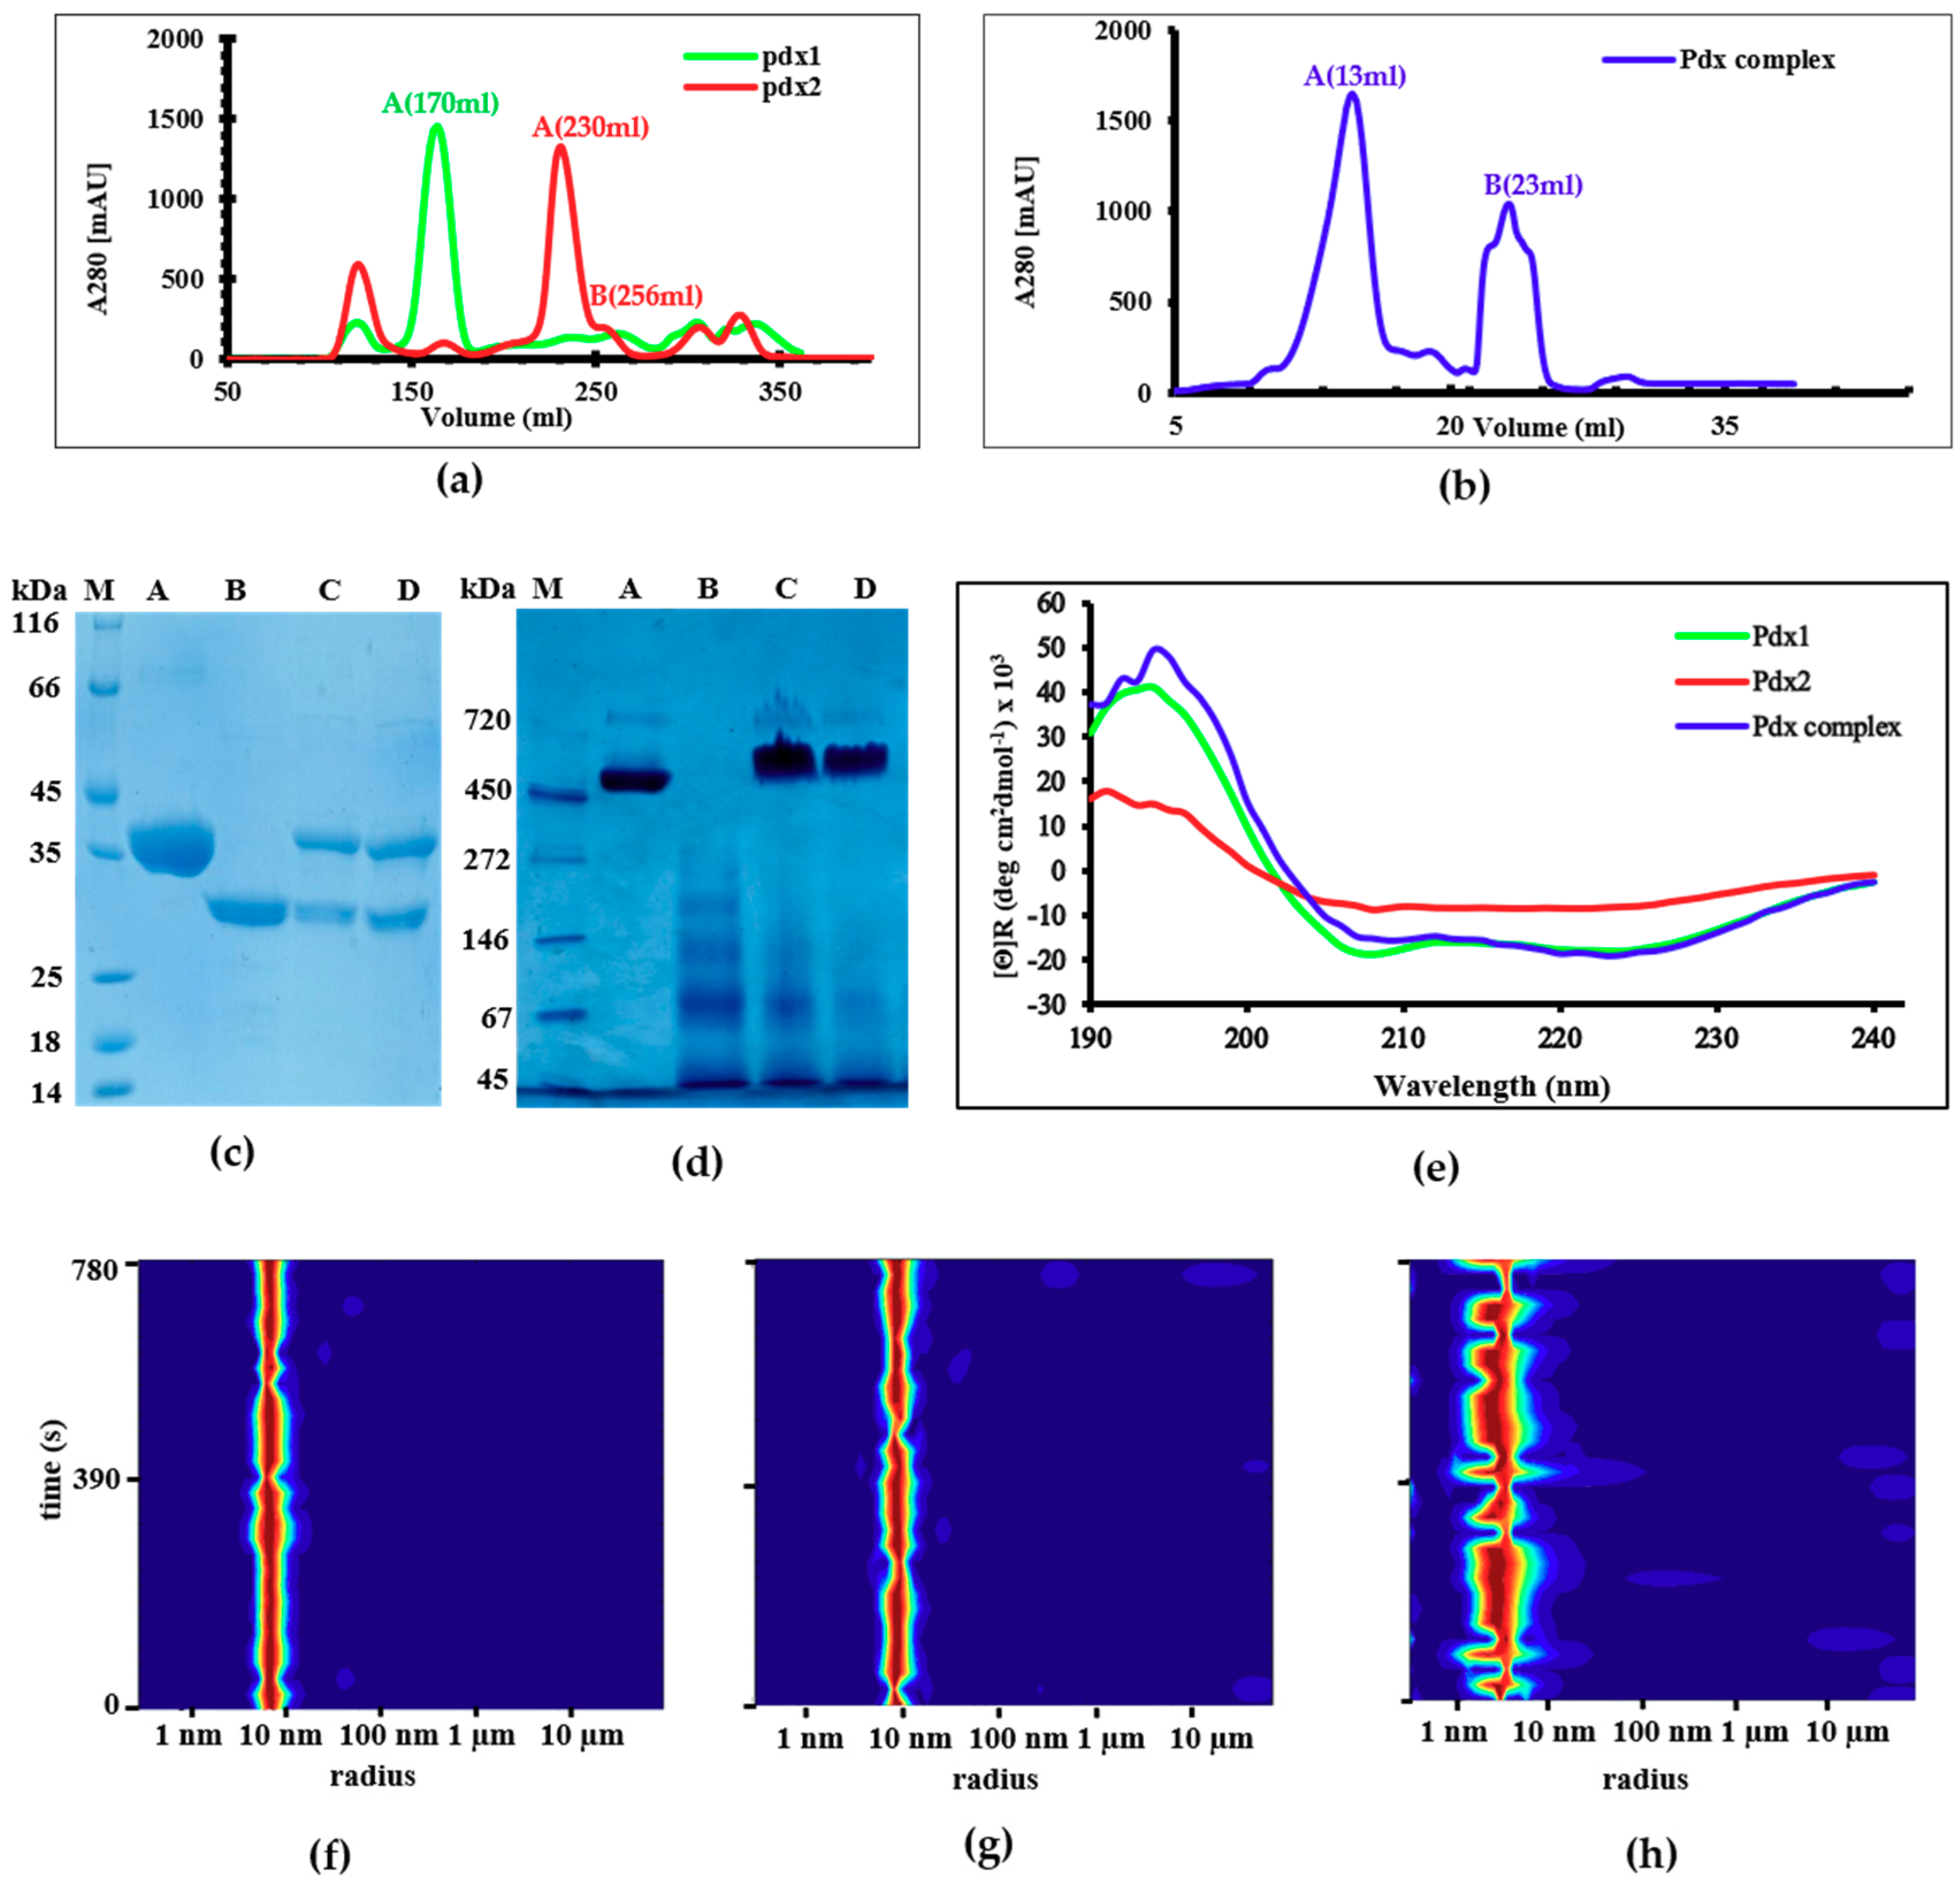
2.1. Expression and Purification
2.2. Circular Dichroism (CD) Spectroscopy and DLS Investigations
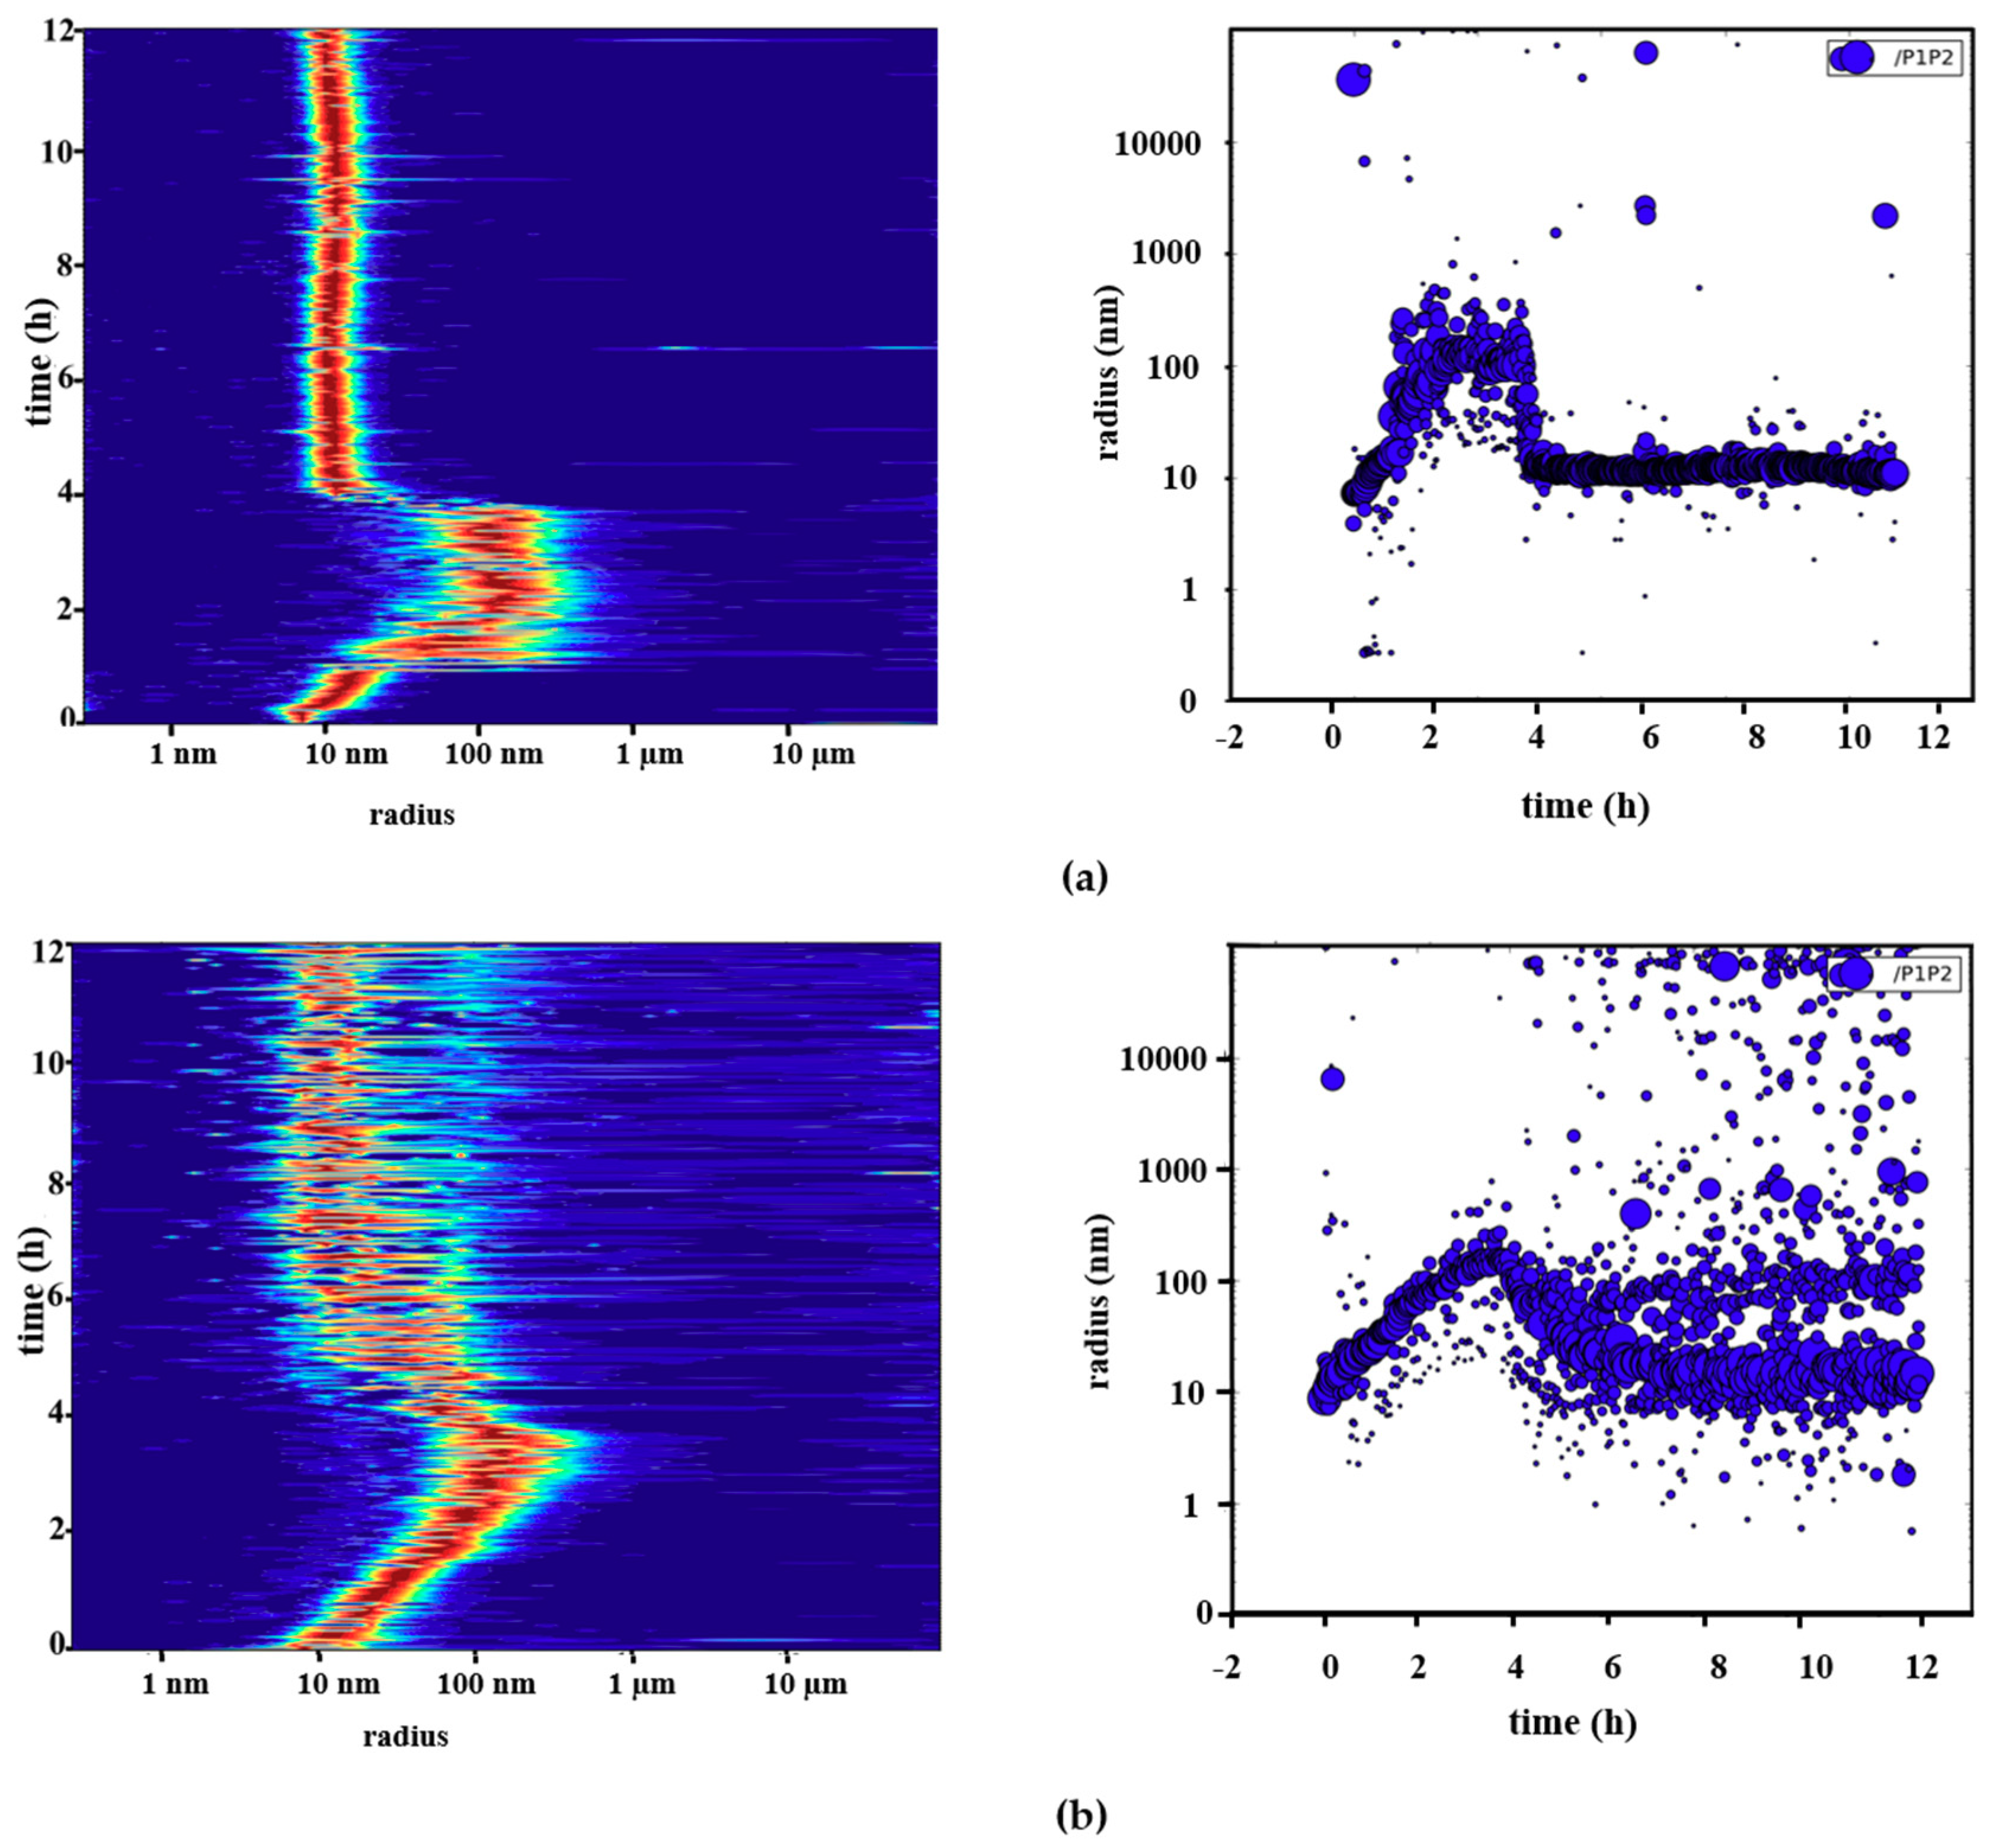
2.3. Reversible Oligomerization of Pdx2 by DLS Investigation
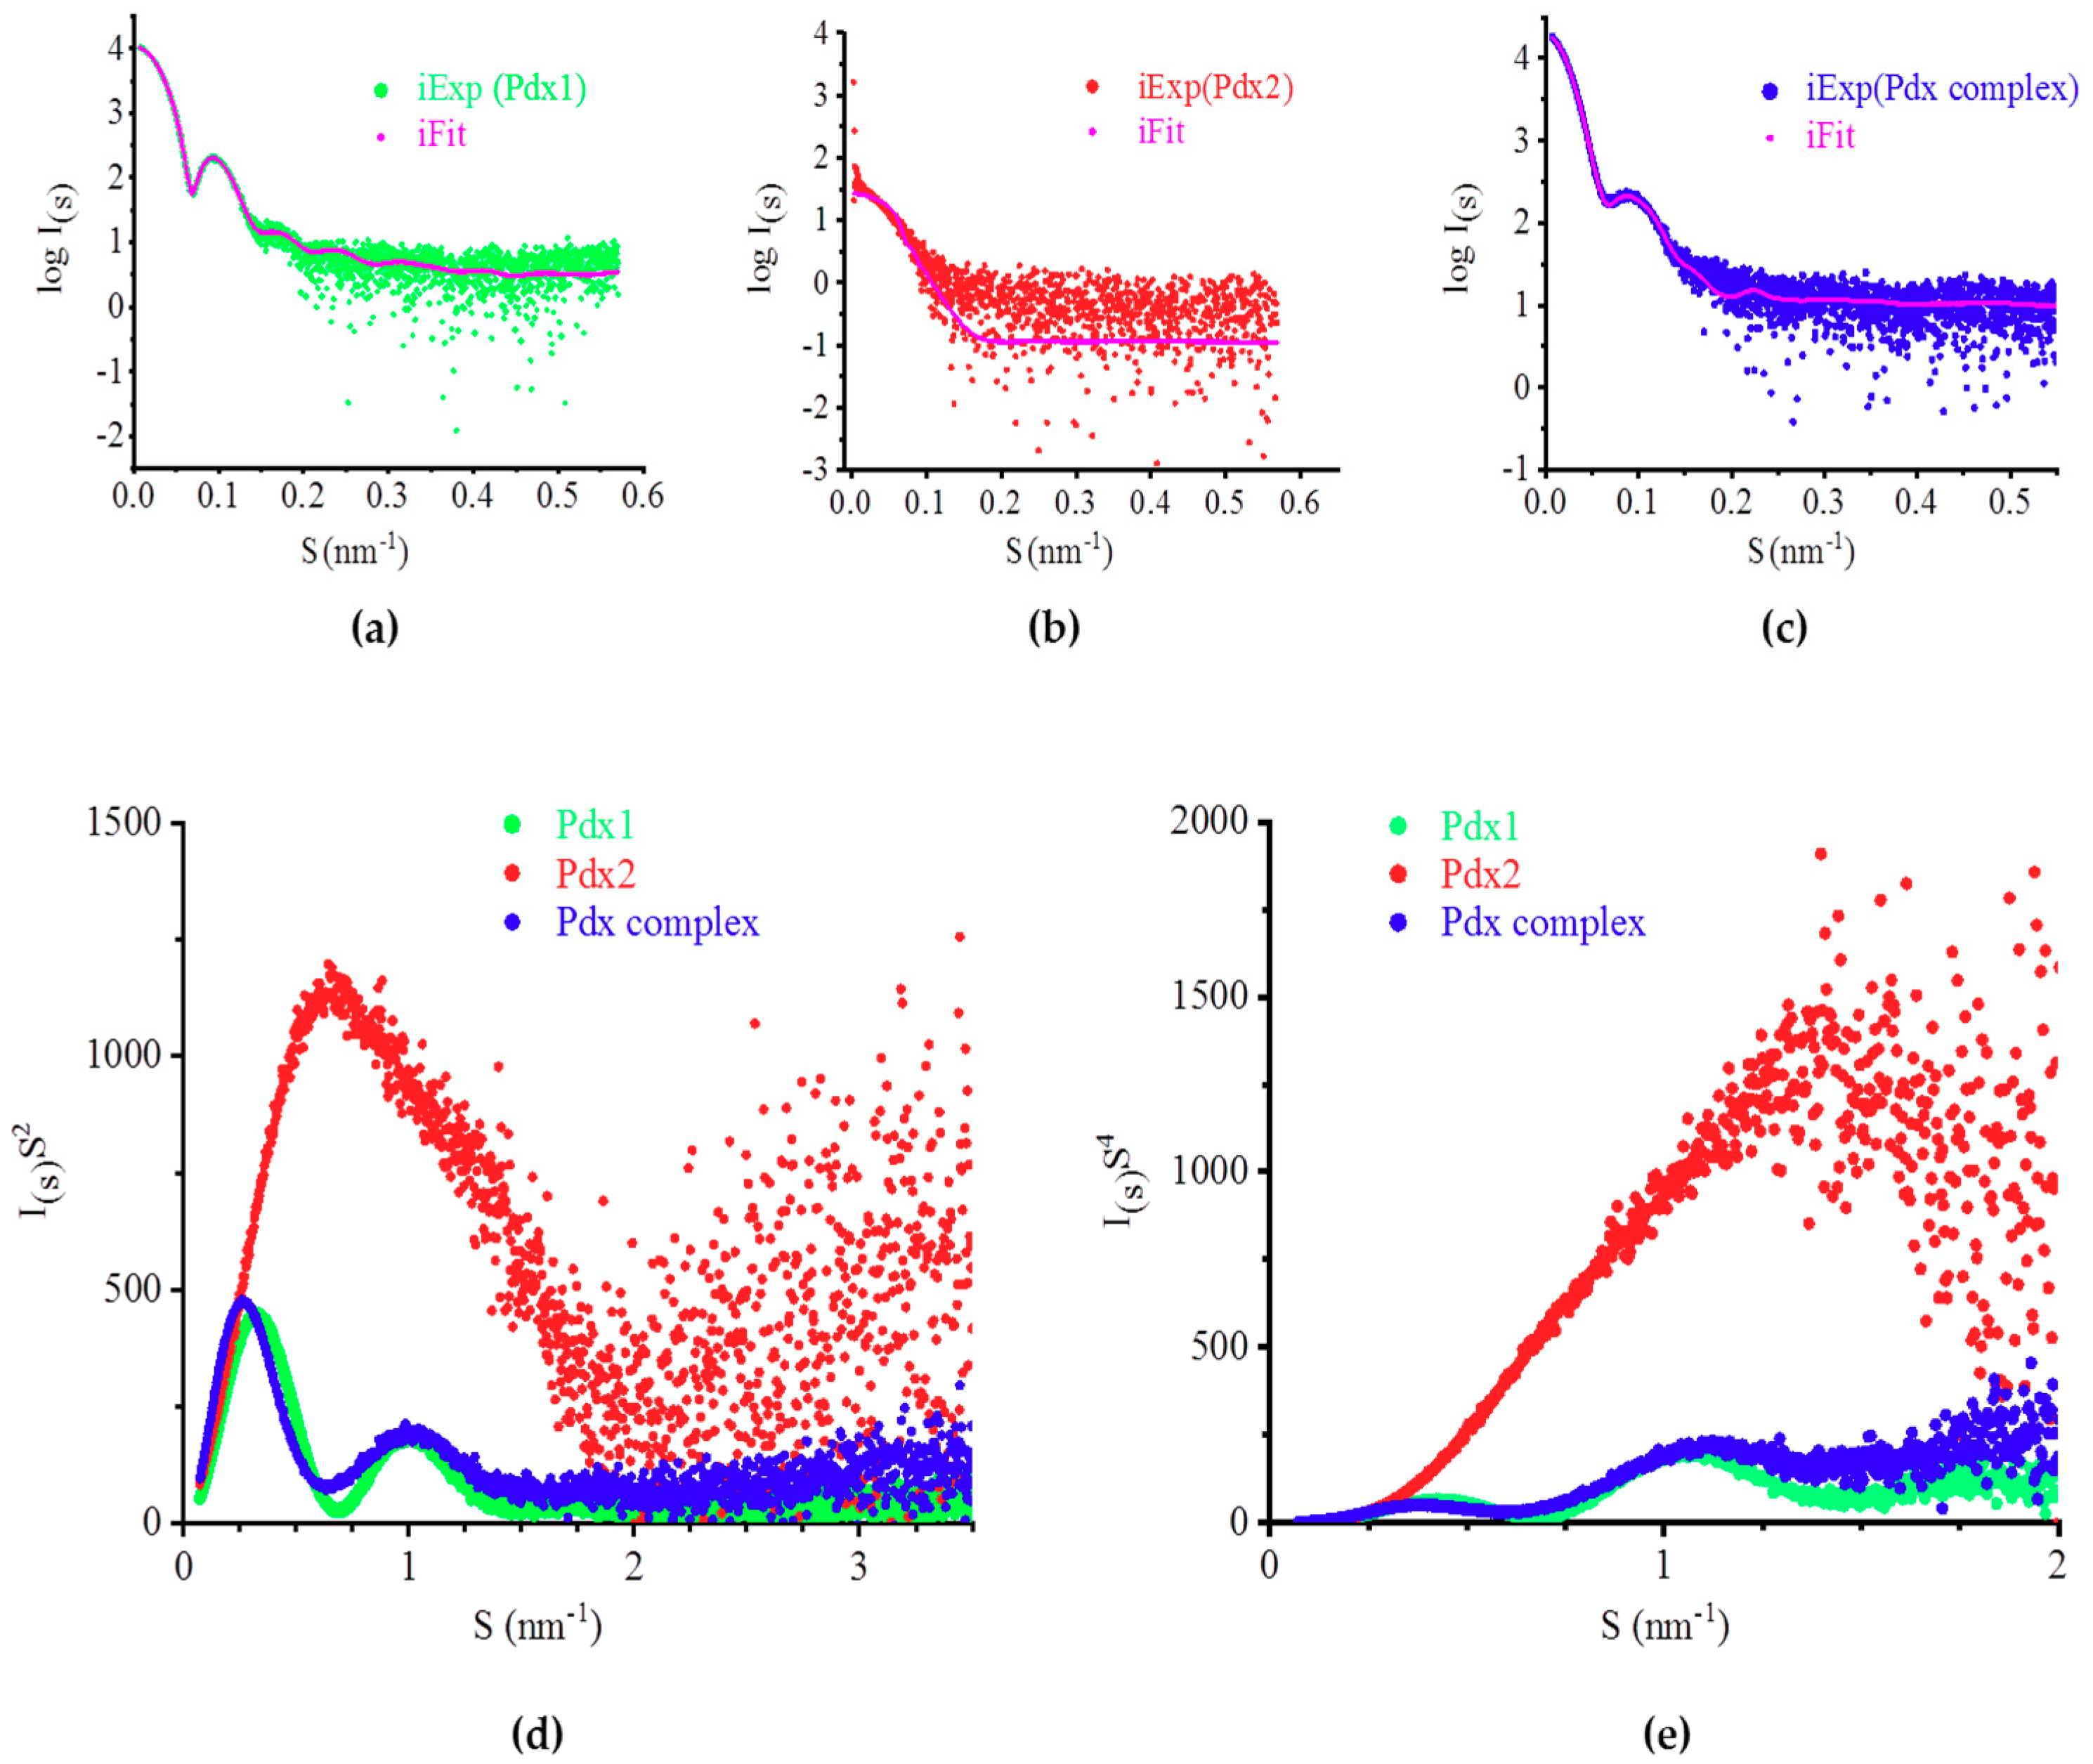
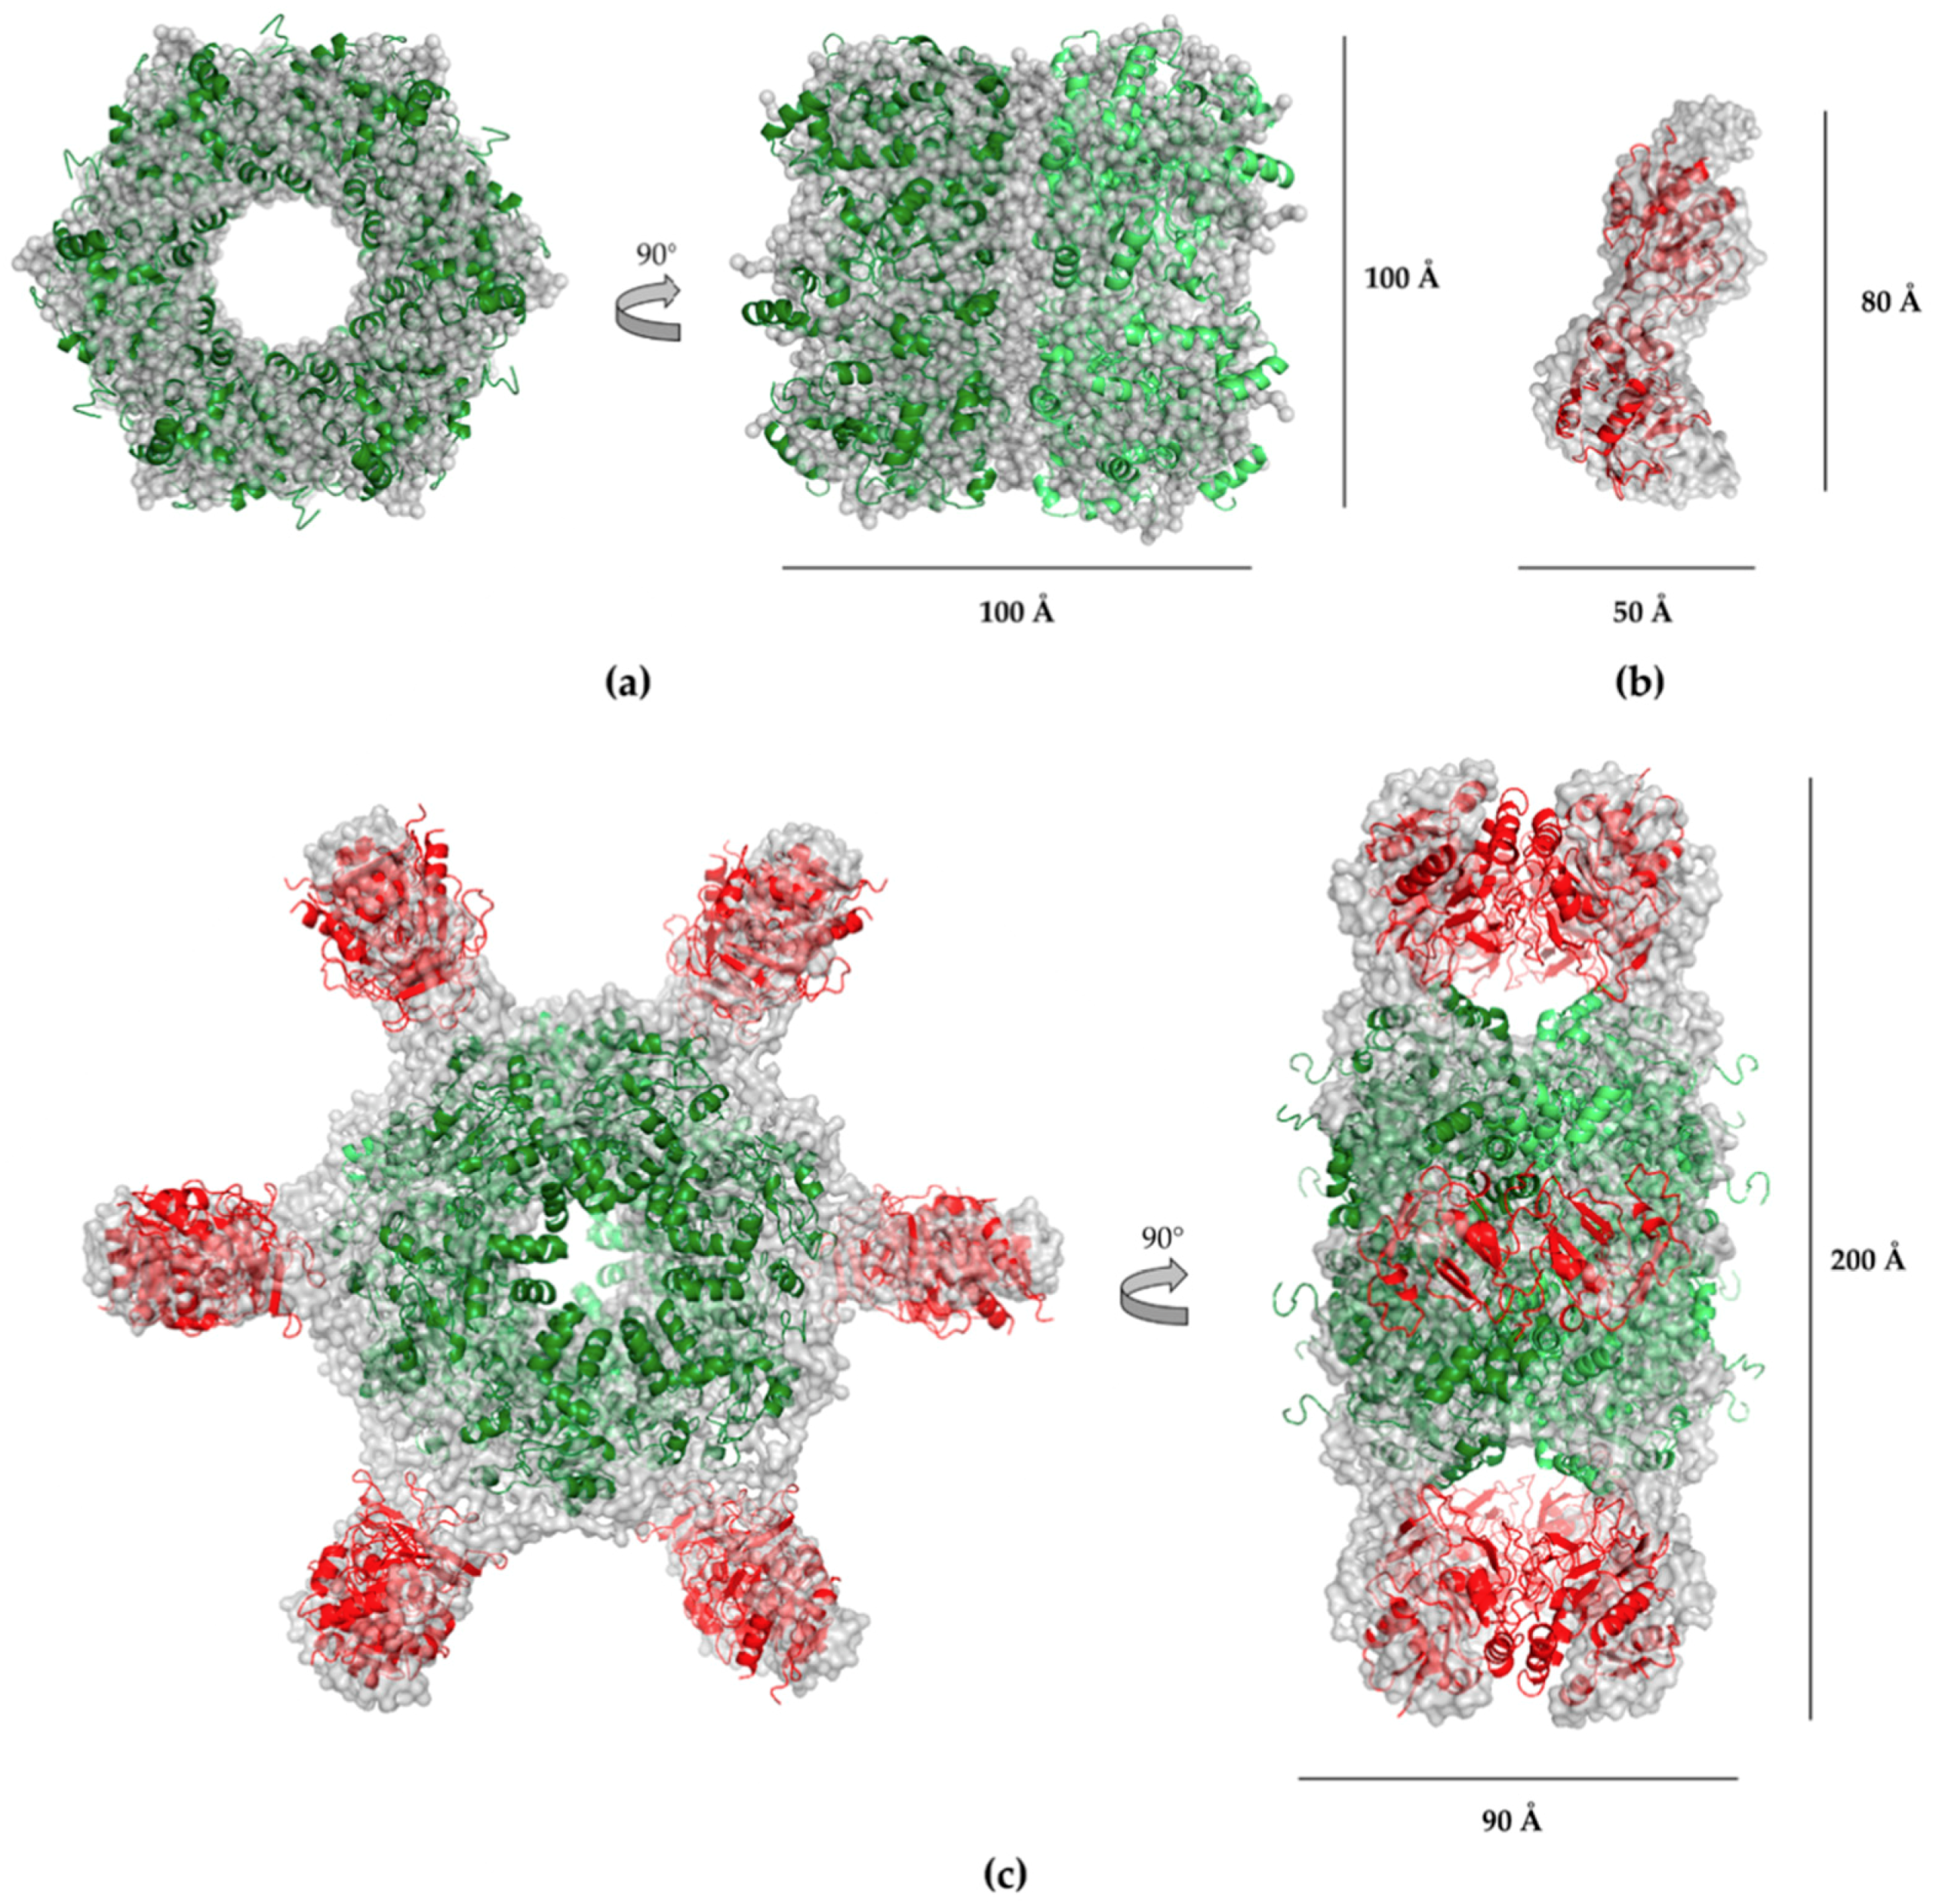
2.4. SAXS Analysis
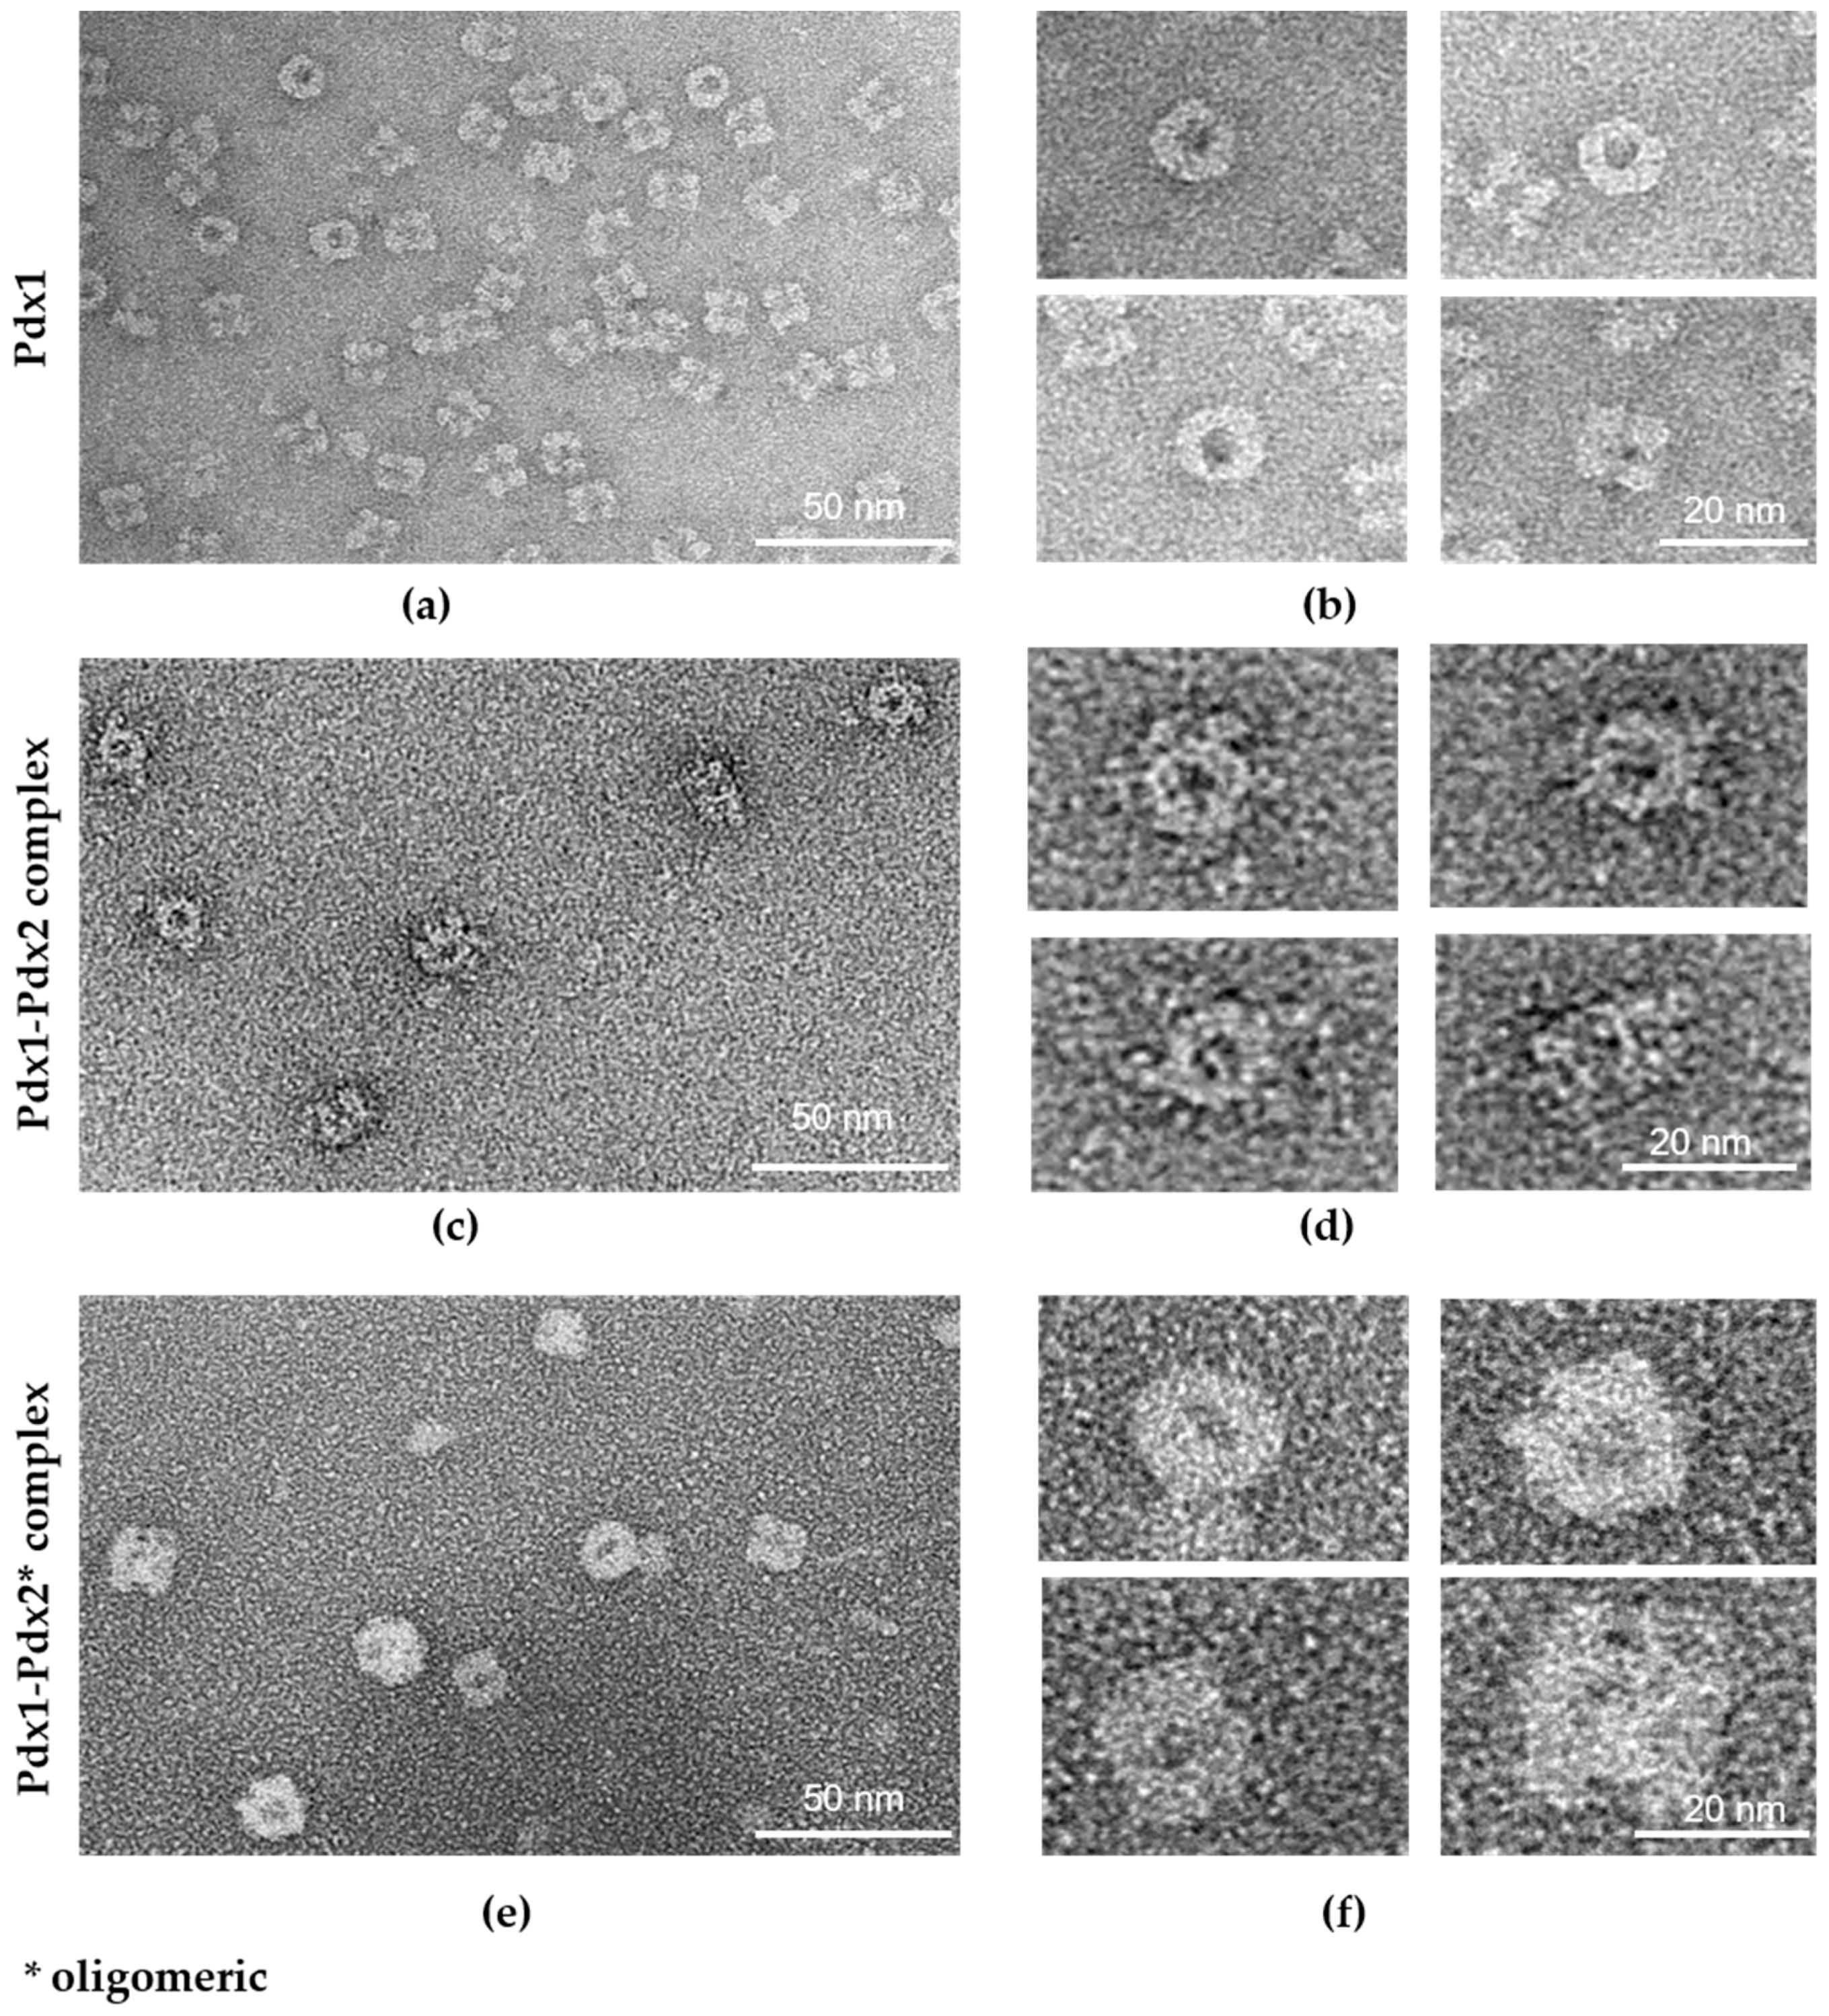
2.5. Electron Microscopy (EM) Analysis
3. Discussion
4. Materials and Methods
4.1. Expression and Purification of P. vivax Pdx1, Pdx2, and Complex Formation
4.2. Dynamic Light Scattering (DLS) and Circular Dichroism (CD) Investigations
4.3. Solution Small Angle X-Ray Scattering (SAXS)
4.4. Electron Microscopy (EM) Analysis
5. Conclusions
Supplementary Materials
Author Contributions
Funding
Acknowledgments
Conflicts of Interest
Abbreviations
| AUC | Analytical ultra-centrifugation |
| BZU | Bahauddin zakariya university |
| CD | Circular dichroism |
| CSSB | left for structural systems biology |
| DESY | Deutsches electronen-synchrotron |
| DLS | Dynamic light scattering |
| Dmax | Maximum diameter |
| EM | Electron microscopy |
| EMBL | European molecular biology laboratory |
| HEC | Higher education commission |
| I(s) | Scattering intensity |
| MM | Molecular masses |
| MTG | Monothioglycerol |
| Ni-NTA | Nickel nitrilotriacetic acid |
| NTA | Nanoparticle tracking analysis |
| PAGE | Polyacrylamide gel electrophoresis |
| PDB | Protein data bank |
| Pdx | Pyridoxal |
| Pr | Distance distribution function |
| PLP | Pyridoxal phosphate |
| Pv | Plasmodium vivax |
| Pf | Plasmodium falciparum |
| RG | Radius of gyration |
| RH | Hydrodynamic radius |
| RMS | Root mean square deviation |
| SAXS | Small angle x-ray scattering |
| SDS | Sodium dodecyl sulphate |
| SEC | Size-exclusion chromatography |
| ρ | Shape factor |
References
- World Health Organization. World Malaria Report 2019; World Health Organization: Geneva, Switzerland, 2019. [Google Scholar]
- Amadi, A.; Ezeonu, I.; Akoma, O. Antimalarial Drug Resistance: An Existential Burden for the Developing World. Microbiol. Res. J. Int. 2019, 1–16. [Google Scholar] [CrossRef] [Green Version]
- World Health Organization. Global Technical Strategy for Malaria 2016–2030; World Health Organization: Geneva, Switzerland, 2015. [Google Scholar]
- Patel, T.S.; Bhatt, J.D.; Dixit, R.B.; Chudasama, C.J.; Patel, B.D.; Dixit, B.C. Design and synthesis of leucine-linked quinazoline-4 (3H)-one-sulphonamide molecules distorting malarial reductase activity in the folate pathway. Arch. Pharm. 2019, 352, 1900099. [Google Scholar] [CrossRef] [PubMed]
- Baird, J.K.; Price, R.N.; Zimmerman, P.A.; Gething, P.W.; Battle, K.E. Growing evidence of Plasmodium vivax across malaria-endemic Africa. PLOS Negl. Trop. Dis. 2019. [Google Scholar] [CrossRef] [Green Version]
- World Health Organization. Control and Elimination of Plasmodium Vivax Malaria: A Technical Brief; World Health Organization: Geneva, Switzerland, 2015. [Google Scholar]
- Müller, I.B.; Knöckel, J.; Groves, M.R.; Jordanova, R.; Ealick, S.E.; Walter, R.D.; Wrenger, C. The assembly of the plasmodial PLP synthase complex follows a defined course. PLoS ONE 2008, 3, e1815. [Google Scholar] [CrossRef]
- Liang, J.; Han, Q.; Tan, Y.; Ding, H.; Li, J. Current advances on structure-function relationships of pyridoxal 5′-phosphate-dependent enzymes. Front. Mol. Biosci. 2019, 6. [Google Scholar] [CrossRef] [Green Version]
- Wrenger, C.; Eschbach, M.-L.; Müller, I.B.; Warnecke, D.; Walter, R.D. Analysis of the vitamin B6 biosynthesis pathway in the human malaria parasite Plasmodium falciparum. J. Biol. Chem. 2005, 280, 5242–5248. [Google Scholar] [CrossRef] [Green Version]
- Knöckel, J.; Jordanova, R.; Müller, I.B.; Wrenger, C.; Groves, M.R. Mobility of the conserved glycine 155 is required for formation of the active plasmodial Pdx1 dodecamer. Biochim. Biophys. Acta Gen. Subj. 2009, 1790, 347–350. [Google Scholar] [CrossRef]
- Rodrigues, M.J.; Windeisen, V.; Zhang, Y.; Guédez, G.; Weber, S.; Strohmeier, M.; Hanes, J.W.; Royant, A.; Evans, G.; Sinning, I. Lysine relay mechanism coordinates intermediate transfer in vitamin B6 biosynthesis. Nat. Chem. Biol. 2017, 13, 290–294. [Google Scholar] [CrossRef] [Green Version]
- Flicker, K.; Neuwirth, M.; Strohmeier, M.; Kappes, B.; Tews, I.; Macheroux, P. Structural and thermodynamic insights into the assembly of the heteromeric pyridoxal phosphate synthase from Plasmodium falciparum. J. Mol. Biol. 2007, 374, 732–748. [Google Scholar] [CrossRef]
- Neuwirth, M.; Flicker, K.; Strohmeier, M.; Tews, I.; Macheroux, P. Thermodynamic Characterization of the Protein− Protein Interaction in the Heteromeric Bacillus subtilis Pyridoxalphosphate Synthase. Biochemistry 2007, 46, 5131–5139. [Google Scholar] [CrossRef]
- Zhu, J.; Burgner, J.W.; Harms, E.; Belitsky, B.R.; Smith, J.L. A new arrangement of (β/α) 8 barrels in the synthase subunit of PLP synthase. J. Biol. Chem. 2005, 280, 27914–27923. [Google Scholar] [CrossRef] [PubMed] [Green Version]
- Strohmeier, M.; Raschle, T.; Mazurkiewicz, J.; Rippe, K.; Sinning, I.; Fitzpatrick, T.B.; Tews, I. Structure of a bacterial pyridoxal 5′-phosphate synthase complex. Proc. Natl. Acad. Sci. USA 2006, 103, 19284–19289. [Google Scholar] [CrossRef] [PubMed] [Green Version]
- Kim, S.; Kim, K.-J. Crystal structure of Mycobacterium tuberculosis Rv2606c: A pyridoxal biosynthesis lyase. Biochem. Biophys. Res. Commun. 2013, 435, 255–259. [Google Scholar] [CrossRef] [PubMed]
- Neuwirth, M.; Strohmeier, M.; Windeisen, V.; Wallner, S.; Deller, S.; Rippe, K.; Sinning, I.; Macheroux, P.; Tews, I. X-ray crystal structure of Saccharomyces cerevisiae Pdx1 provides insights into the oligomeric nature of PLP synthases. FEBS Lett. 2009, 583, 2179–2186. [Google Scholar] [CrossRef] [Green Version]
- Bauer, J.A.; Bennett, E.M.; Begley, T.P.; Ealick, S.E. Three-dimensional structure of YaaE from Bacillus subtilis, a glutaminase implicated in pyridoxal-5′-phosphate biosynthesis. J. Biol. Chem. 2004, 279, 2704–2711. [Google Scholar] [CrossRef] [Green Version]
- Gengenbacher, M.; Fitzpatrick, T.B.; Raschle, T.; Flicker, K.; Sinning, I.; Müller, S.; Macheroux, P.; Tews, I.; Kappes, B. Vitamin B6 Biosynthesis by the Malaria Parasite Plasmodium falciparum BIOCHEMICAL AND STRUCTURAL INSIGHTS. J. Biol. Chem. 2006, 281, 3633–3641. [Google Scholar] [CrossRef] [Green Version]
- Zein, F.; Zhang, Y.; Kang, Y.-N.; Burns, K.; Begley, T.P.; Ealick, S.E. Structural insights into the mechanism of the PLP synthase holoenzyme from Thermotoga maritima. Biochemistry 2006, 45, 14609–14620. [Google Scholar] [CrossRef] [Green Version]
- Smith, A.M.; Brown, W.C.; Harms, E.; Smith, J.L. Crystal structures capture three states in the catalytic cycle of a pyridoxal phosphate (PLP) synthase. J. Biol. Chem. 2015, 290, 5226–5239. [Google Scholar] [CrossRef] [Green Version]
- Guédez, G.; Hipp, K.; Windeisen, V.; Derrer, B.; Gengenbacher, M.; Böttcher, B.; Sinning, I.; Kappes, B.; Tews, I. Assembly of the eukaryotic PLP-synthase complex from Plasmodium and activation of the Pdx1 enzyme. Structure 2012, 20, 172–184. [Google Scholar] [CrossRef] [Green Version]
- Yang, J.T.; Wu, C.-S.C.; Martinez, H.M. Calculation of protein conformation from circular dichroism. In Methods in Enzymology; Elsevier: Amsterdam, The Netherlands, 1986; Volume 130, pp. 208–269. [Google Scholar]
- Dierks, K.; Meyer, A.; Einspahr, H.; Betzel, C. Dynamic light scattering in protein crystallization droplets: Adaptations for analysis and optimization of crystallization processes. Cryst. Growth Des. 2008, 8, 1628–1634. [Google Scholar] [CrossRef]
- Falke, S.; Betzel, C. Dynamic Light Scattering (DLS). In Radiation in Bioanalysis; Springer: Berlin/Heidelberg, Germany, 2019; pp. 173–193. [Google Scholar]
- Putnam, C.D.; Hammel, M.; Hura, G.L.; Tainer, J.A. X-ray solution scattering (SAXS) combined with crystallography and computation: Defining accurate macromolecular structures, conformations and assemblies in solution. Q. Rev. Biophys. 2007, 40, 191–285. [Google Scholar] [CrossRef] [PubMed]
- Burchard, W.; Schmidt, M.; Stockmayer, W. Information on polydispersity and branching from combined quasi-elastic and intergrated scattering. Macromolecules 1980, 13, 1265–1272. [Google Scholar] [CrossRef]
- Mukherjee, A.; Hackley, V.A. Separation and characterization of cellulose nanocrystals by multi-detector asymmetrical-flow field-flow fractionation. Analyst 2018, 143, 731–740. [Google Scholar] [CrossRef] [PubMed]
- Konarev, P.V.; Volkov, V.V.; Sokolova, A.V.; Koch, M.H.; Svergun, D.I. PRIMUS: A Windows PC-based system for small-angle scattering data analysis. J. Appl. Crystallogr. 2003, 36, 1277–1282. [Google Scholar] [CrossRef]
- Svergun, D.; Barberato, C.; Koch, M.H. CRYSOL—A program to evaluate X-ray solution scattering of biological macromolecules from atomic coordinates. J. Appl. Crystallogr. 1995, 28, 768–773. [Google Scholar] [CrossRef]
- Waterhouse, A.; Bertoni, M.; Bienert, S.; Studer, G.; Tauriello, G.; Gumienny, R.; Heer, F.T.; de Beer, T.A.P.; Rempfer, C.; Bordoli, L. SWISS-MODEL: Homology modelling of protein structures and complexes. Nucleic. Acids. Res. 2018, 46, W296–W303. [Google Scholar] [CrossRef] [Green Version]
- Roy, A.; Kucukural, A.; Zhang, Y. I-TASSER: A unified platform for automated protein structure and function prediction. Nat. Protoc. 2010, 5, 725–738. [Google Scholar] [CrossRef] [Green Version]
- Altschul, S.F.; Gish, W.; Miller, W.; Myers, E.W.; Lipman, D.J. Basic local alignment search tool. J. Mol. Biol. 1990, 215, 403–410. [Google Scholar] [CrossRef]
- DeLano, W.L. The PyMOL Molecular Graphics System. Available online: http://www.pymol.org (accessed on 1 July 2020).
- Fischer, H.; Oliveira Neto, M.d.; Napolitano, H.; Polikarpov, I.; Craievich, A.F. Determination of the molecular weight of proteins in solution from a single small-angle X-ray scattering measurement on a relative scale. J. Appl. Crystallogr. 2010, 43, 101–109. [Google Scholar] [CrossRef]
- World Health Organization. Guidelines for the Treatment of Malaria; World Health Organization: Geneva, Switzerland, 2015. [Google Scholar]
- Divo, A.A.; Geary, T.G.; Davis, N.L.; Jensen, J.B. Nutritional requirements of Plasmodium falciparum in culture. I. Exogenously supplied dialyzable components necessary for continuous growth. J. Protozool. 1985, 32, 59–64. [Google Scholar] [CrossRef]
- Derrer, B.; Windeisen, V.; Rodríguez, G.G.; Seidler, J.; Gengenbacher, M.; Lehmann, W.D.; Rippe, K.; Sinning, I.; Tews, I.; Kappes, B. Defining the structural requirements for ribose 5-phosphate-binding and intersubunit cross-talk of the malarial pyridoxal 5-phosphate synthase. FEBS Lett. 2010, 584, 4169–4174. [Google Scholar] [CrossRef] [PubMed] [Green Version]
- Ventura, S. Sequence determinants of protein aggregation: Tools to increase protein solubility. Microb. Cell Factories 2005, 4, 11. [Google Scholar] [CrossRef] [PubMed] [Green Version]
- Fernandez-Escamilla, A.-M.; Rousseau, F.; Schymkowitz, J.; Serrano, L. Prediction of sequence-dependent and mutational effects on the aggregation of peptides and proteins. Nat. Biotechnol. 2004, 22, 1302–1306. [Google Scholar] [CrossRef] [PubMed]
- Raschle, T.; Amrhein, N.; Fitzpatrick, T.B. On the two components of pyridoxal 5′-phosphate synthase from Bacillus subtilis. J. Biol. Chem. 2005, 280, 32291–32300. [Google Scholar] [CrossRef] [Green Version]
- Robert, X.; Gouet, P. Deciphering key features in protein structures with the new ENDscript server. Nucleic Acids Res. 2014, 42, W320–W324. [Google Scholar] [CrossRef] [Green Version]
- Franke, D.; Petoukhov, M.; Konarev, P.; Panjkovich, A.; Tuukkanen, A.; Mertens, H.; Kikhney, A.; Hajizadeh, N.; Franklin, J.; Jeffries, C. ATSAS 2.8: A comprehensive data analysis suite for small-angle scattering from macromolecular solutions. J. Appl. Cryst. 2017, 50, 1212–1225. [Google Scholar] [CrossRef] [Green Version]
- Svergun, D. Determination of the regularization parameter in indirect-transform methods using perceptual criteria. J. Appl. Cryst. 1992, 25, 495–503. [Google Scholar] [CrossRef]
- Rambo, R.P.; Tainer, J.A. Characterizing flexible and intrinsically unstructured biological macromolecules by SAS using the Porod-Debye law. Biopolymers 2011, 95, 559–571. [Google Scholar] [CrossRef] [Green Version]
- Svergun, D.I. Restoring low resolution structure of biological macromolecules from solution scattering using simulated annealing. Biophys. J. 1999, 76, 2879–2886. [Google Scholar] [CrossRef] [Green Version]
- Svergun, D.I.; Petoukhov, M.V.; Koch, M.H. Determination of domain structure of proteins from X-ray solution scattering. Biophys. J. 2001, 80, 2946–2953. [Google Scholar] [CrossRef] [Green Version]
- Petoukhov, M.V.; Svergun, D.I. Global rigid body modeling of macromolecular complexes against small-angle scattering data. Biophys. J. 2005, 89, 1237–1250. [Google Scholar] [CrossRef] [PubMed] [Green Version]
- Ohi, M.; Li, Y.; Cheng, Y.; Walz, T. Negative staining and image classification—Powerful tools in modern electron microscopy. Biol. Proced. Online 2004, 6, 23–34. [Google Scholar] [CrossRef] [PubMed]


| Pdx1 | Pdx2 | Pdx Complex | |
|---|---|---|---|
| Data collection parameters | |||
| X-ray source | PETRA III; EMBL beamline P12 | ||
| Wavelength (nm) | 0.124 | ||
| Detector distance (m) | 3.1 | ||
| Temperature (K) | 293 | 283 | 293 |
| Structural parameters | |||
| I(0) (P(r) function) | 10,720 ± 5.93 | 9161 ± 41.47 | 19380 ± 23.04 |
| I(0) (Guinier/AutoRG) | 10,727.20 ± 11.61 | 9307.96 ± 101.56 | 19,658.30 ± 28.99 |
| I(0) (SAXSMoW) | 10,751.50 | 33.64 | 19,592.77 |
| RG (nm) (P(r) function) | 5.00 ± 0.01 | 3.26 ± 0.02 | 6.83 ± 0.01 |
| RG (nm) (Guinier/AutoRG) | 5.05 ± 0.06 | 3.24 ± 1.36 | 6.95 ± 0.11 |
| RG (nm) (based on SAXSMoW) | 5.07 | 3.52 | 6.89 |
| qRG limit (from Guinier/AutoRG) | 1.12 | 1.29 | 1.15 |
| qRG limit (from SAXSMoW) | 1.29 | 1.30 | 1.29 |
| Dmax (nm) (from P(r) function) | 15.0 | 11.3 | 22.2 |
| Porod volume estimate (nm) | 609.54 | 75.88 | 1733.18 |
| P = RG/RH | 0.69 | 0.93–1.18 | 0.71 |
| Molecular mass determination (kDa) | |||
| Molecular mass (SAXSMoW) | 418.2 | 67.0 | 735.8 |
| Molecular mass (amino acids sequence) | 417.3 | 26.1 | 730.3 |
| Oligomeric state | Dodecamer | Oligomer | 24-mer |
© 2020 by the authors. Licensee MDPI, Basel, Switzerland. This article is an open access article distributed under the terms and conditions of the Creative Commons Attribution (CC BY) license (http://creativecommons.org/licenses/by/4.0/).
Share and Cite
Ullah, N.; Andaleeb, H.; Mudogo, C.N.; Falke, S.; Betzel, C.; Wrenger, C. Solution Structures and Dynamic Assembly of the 24-Meric Plasmodial Pdx1–Pdx2 Complex. Int. J. Mol. Sci. 2020, 21, 5971. https://0-doi-org.brum.beds.ac.uk/10.3390/ijms21175971
Ullah N, Andaleeb H, Mudogo CN, Falke S, Betzel C, Wrenger C. Solution Structures and Dynamic Assembly of the 24-Meric Plasmodial Pdx1–Pdx2 Complex. International Journal of Molecular Sciences. 2020; 21(17):5971. https://0-doi-org.brum.beds.ac.uk/10.3390/ijms21175971
Chicago/Turabian StyleUllah, Najeeb, Hina Andaleeb, Celestin Nzanzu Mudogo, Sven Falke, Christian Betzel, and Carsten Wrenger. 2020. "Solution Structures and Dynamic Assembly of the 24-Meric Plasmodial Pdx1–Pdx2 Complex" International Journal of Molecular Sciences 21, no. 17: 5971. https://0-doi-org.brum.beds.ac.uk/10.3390/ijms21175971