Remodeling of Kv7.1 and Kv7.5 Expression in Vascular Tumors

 , , and
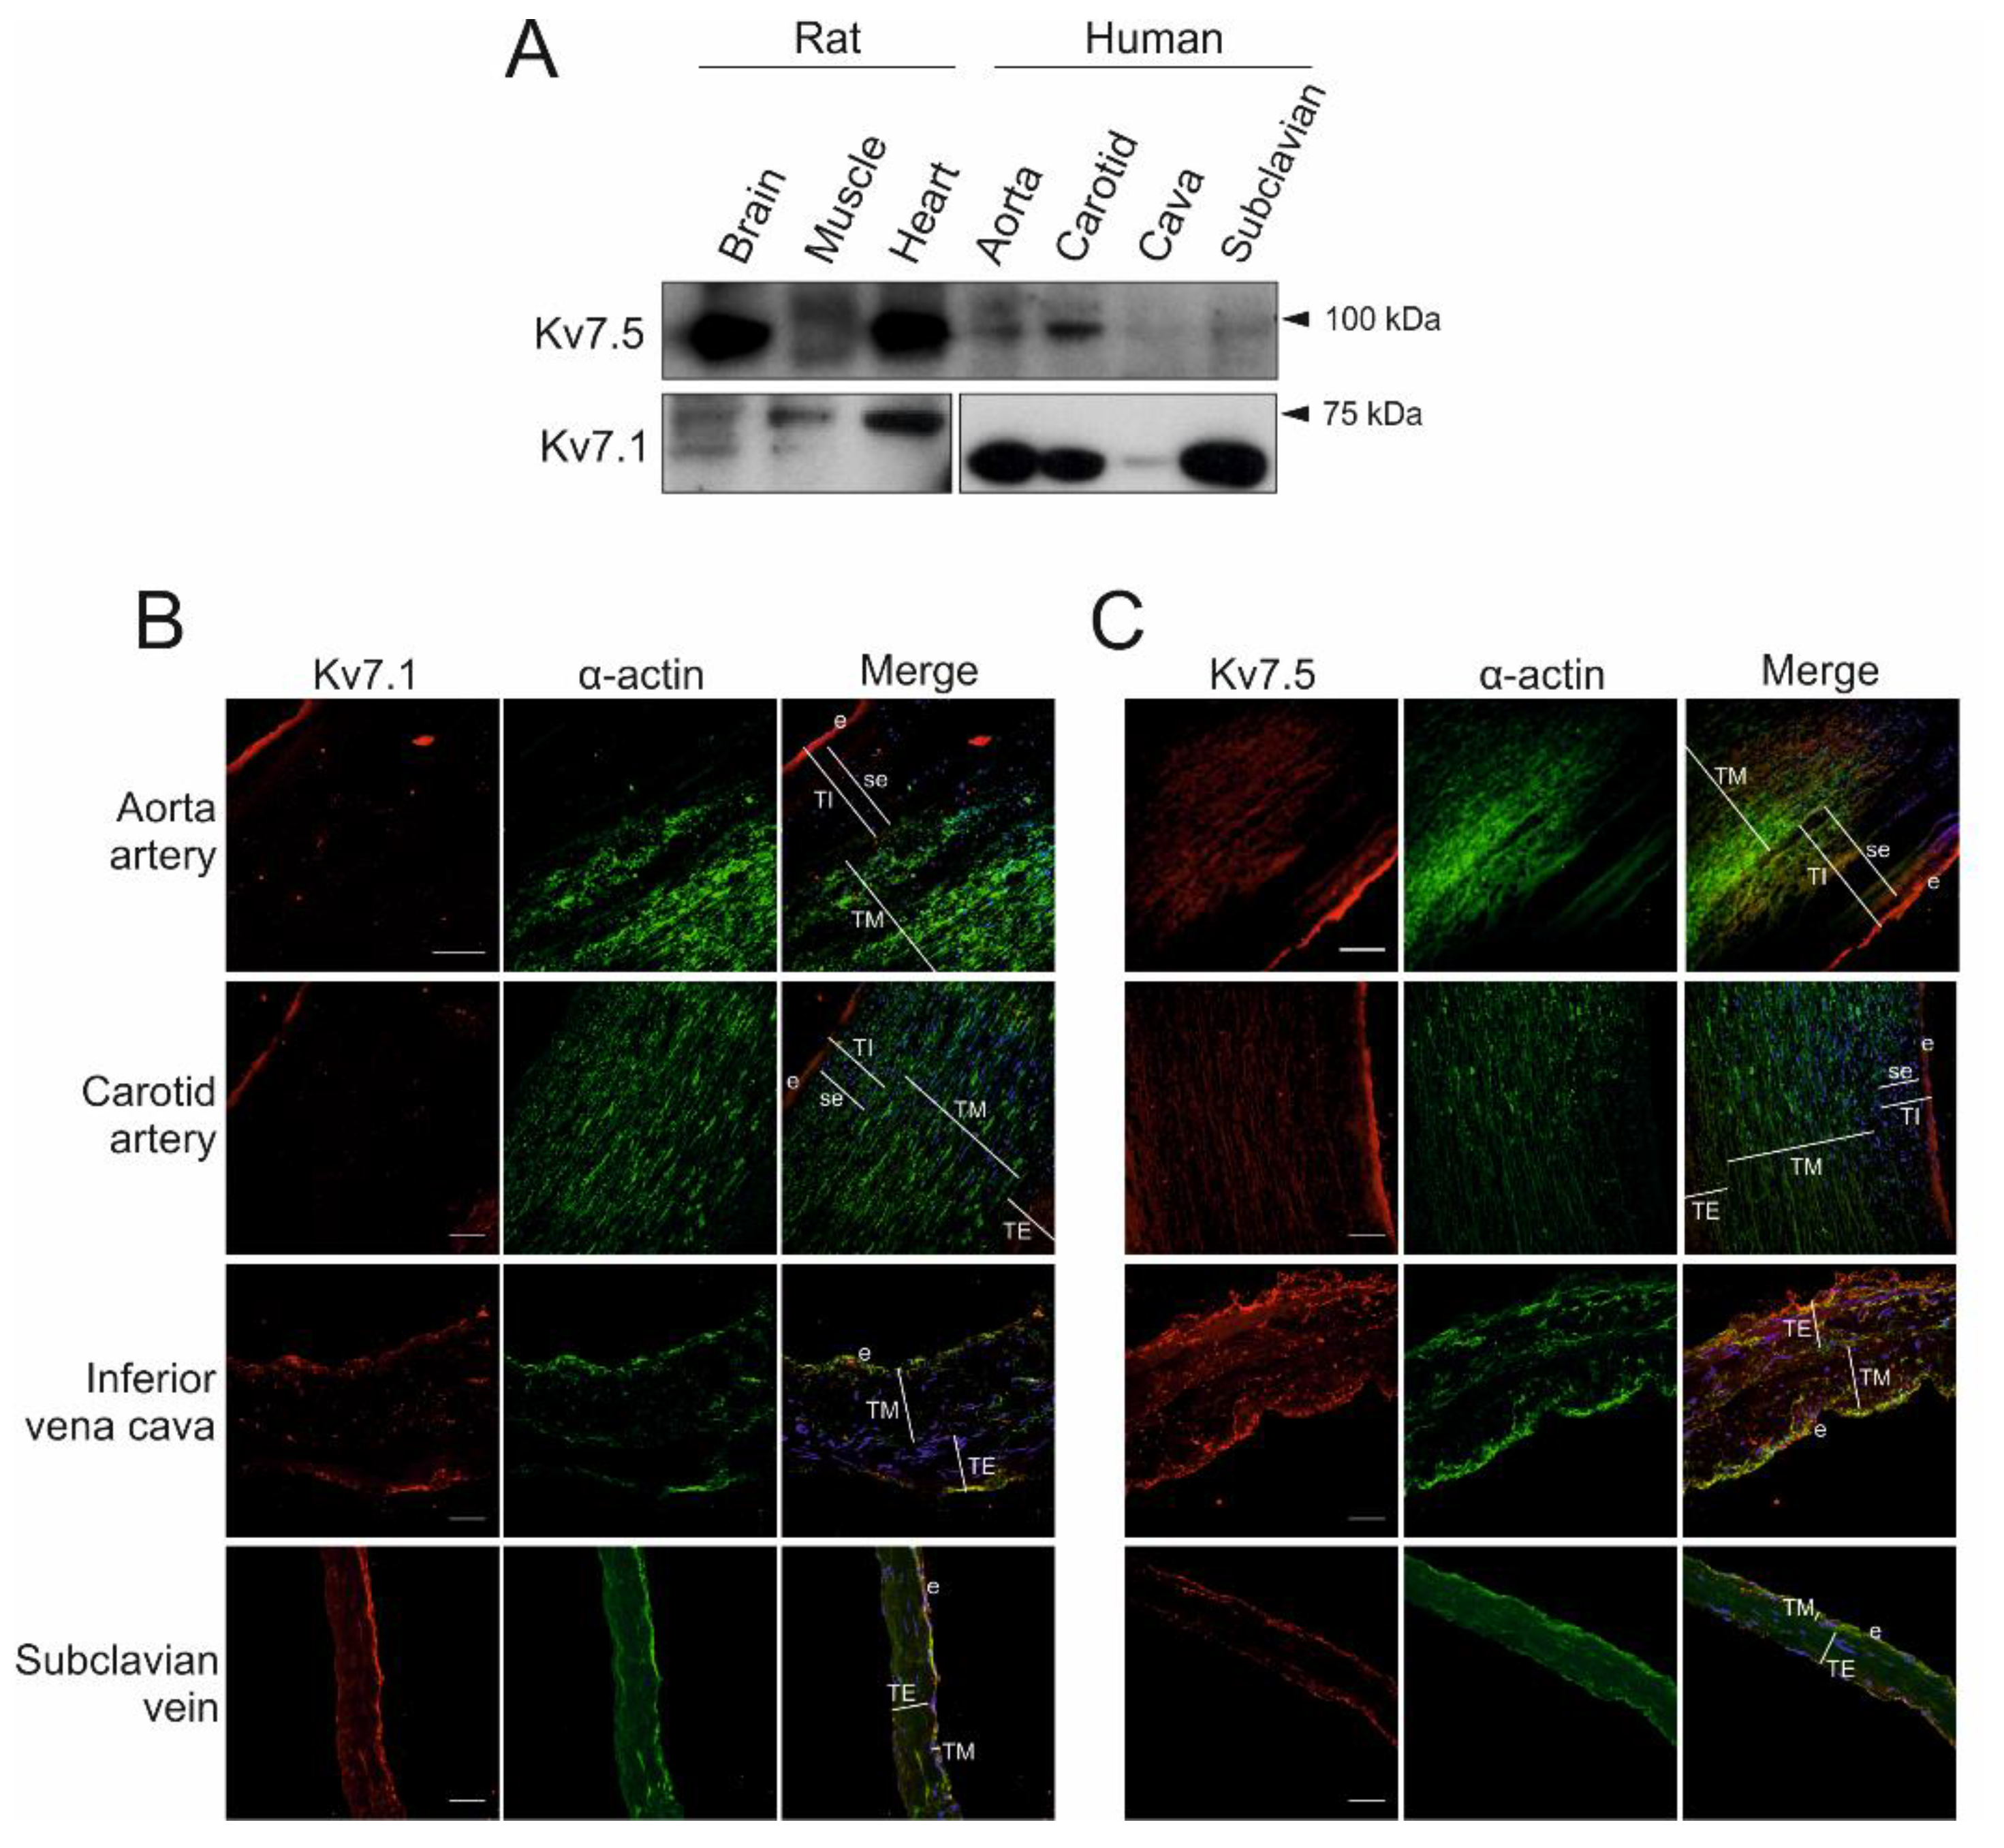
Abstract
:1. Introduction
2. Results
2.1. Expression of Kv7.1 and Kv7.5 in Human Blood Vessels
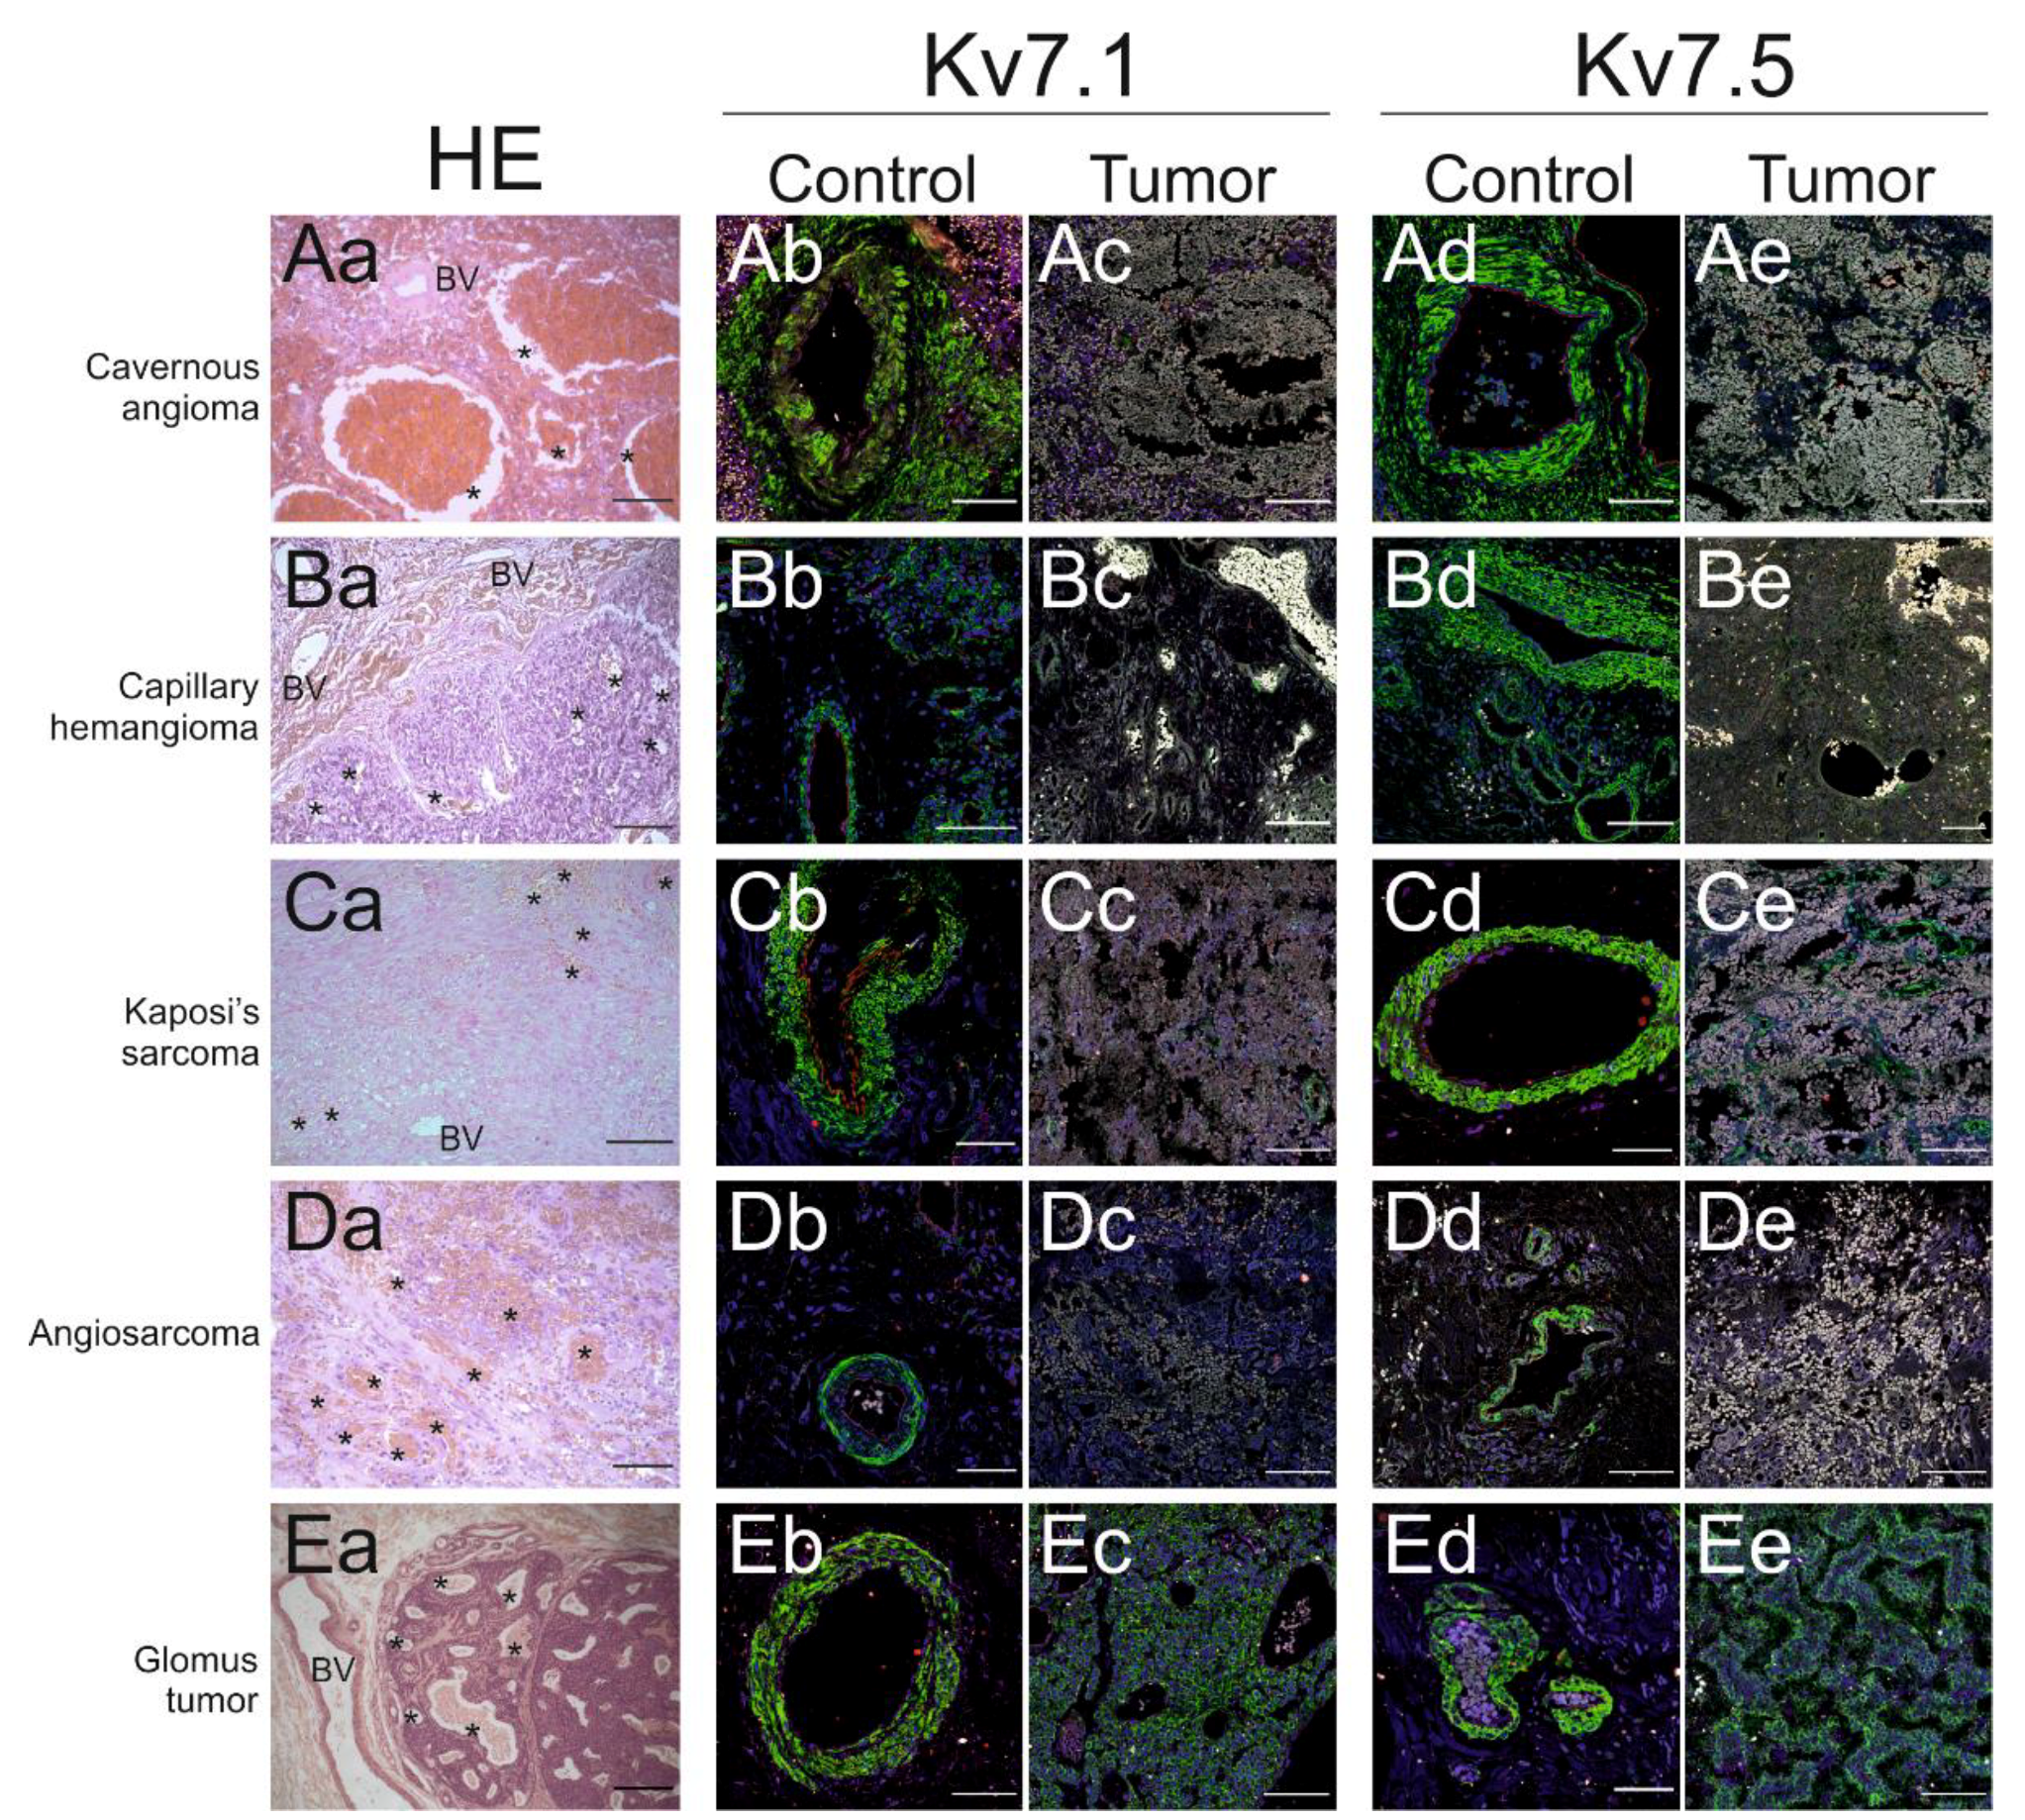
2.2. Kv Channel Expression in Vascular Tumors
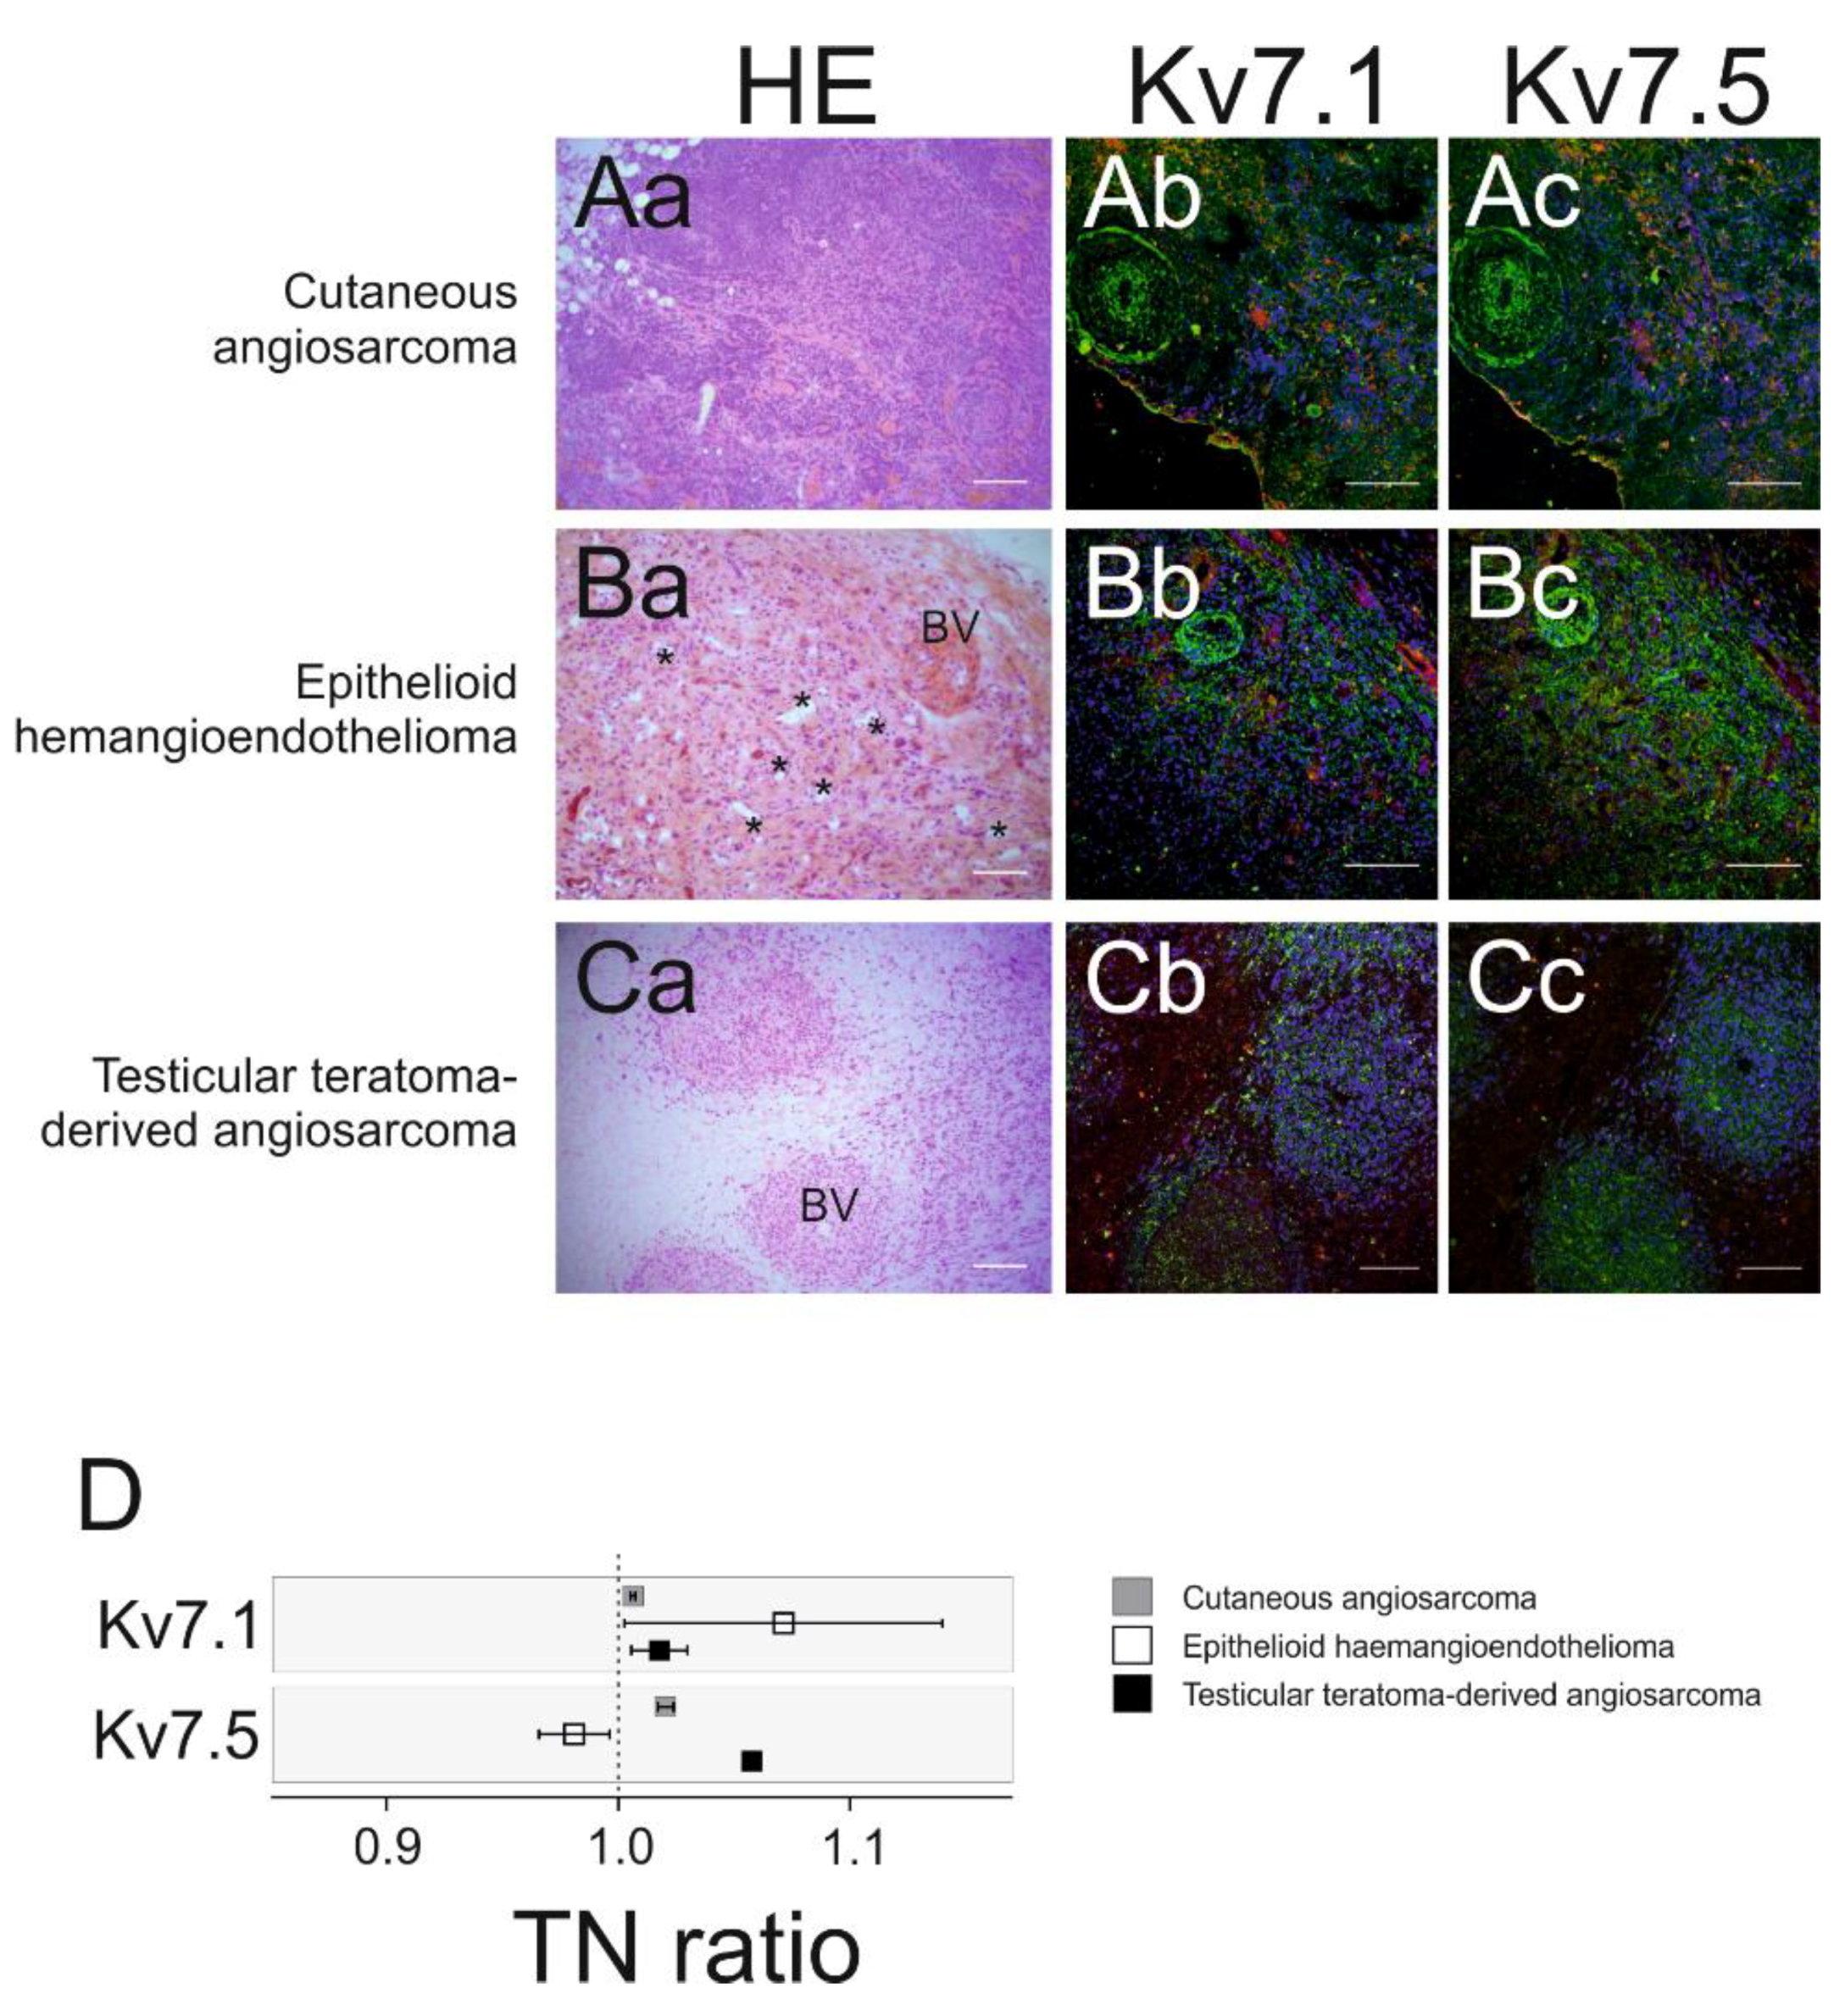
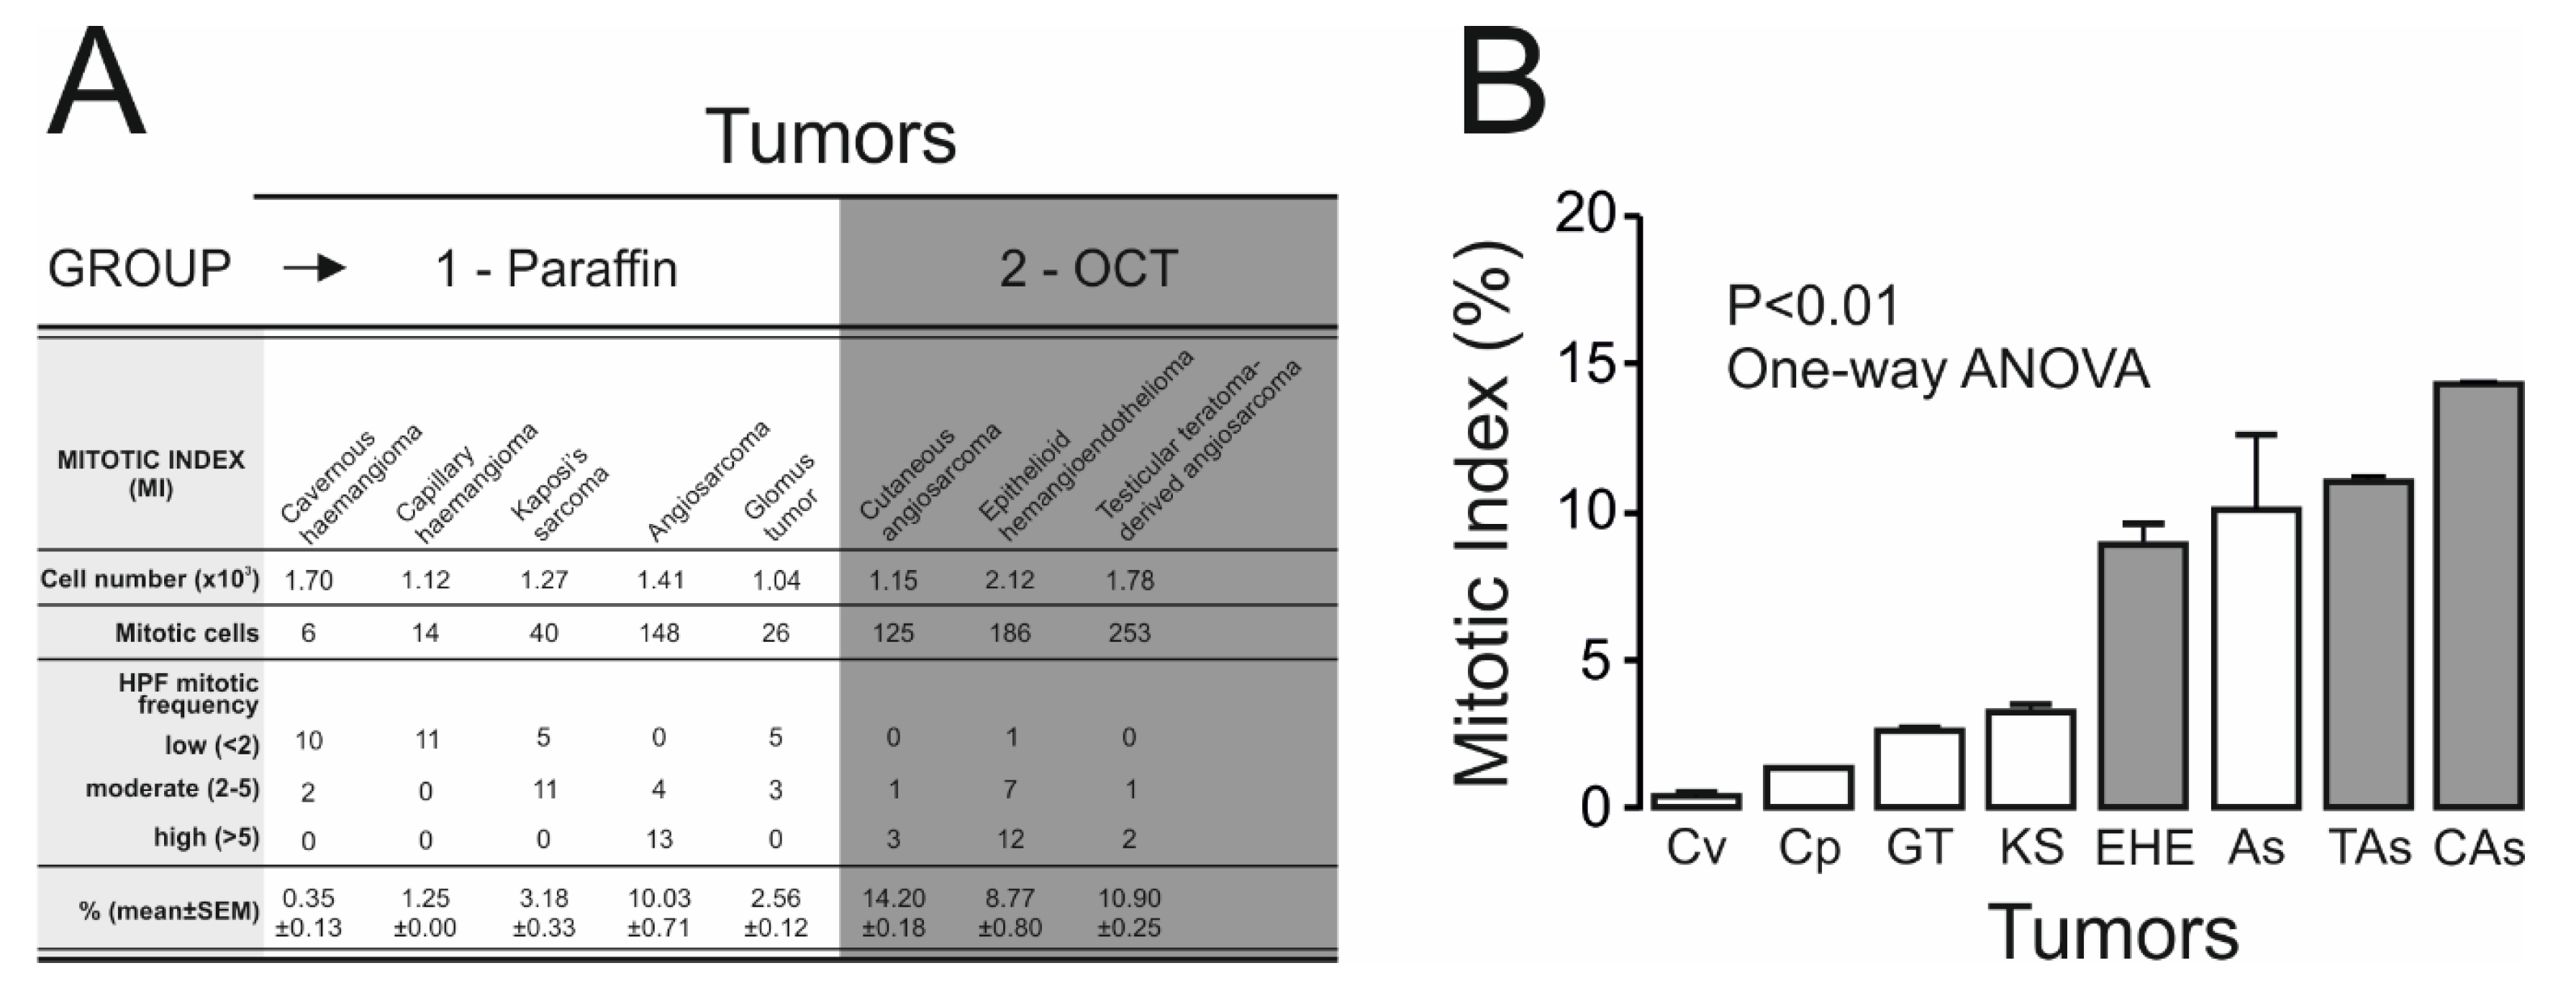
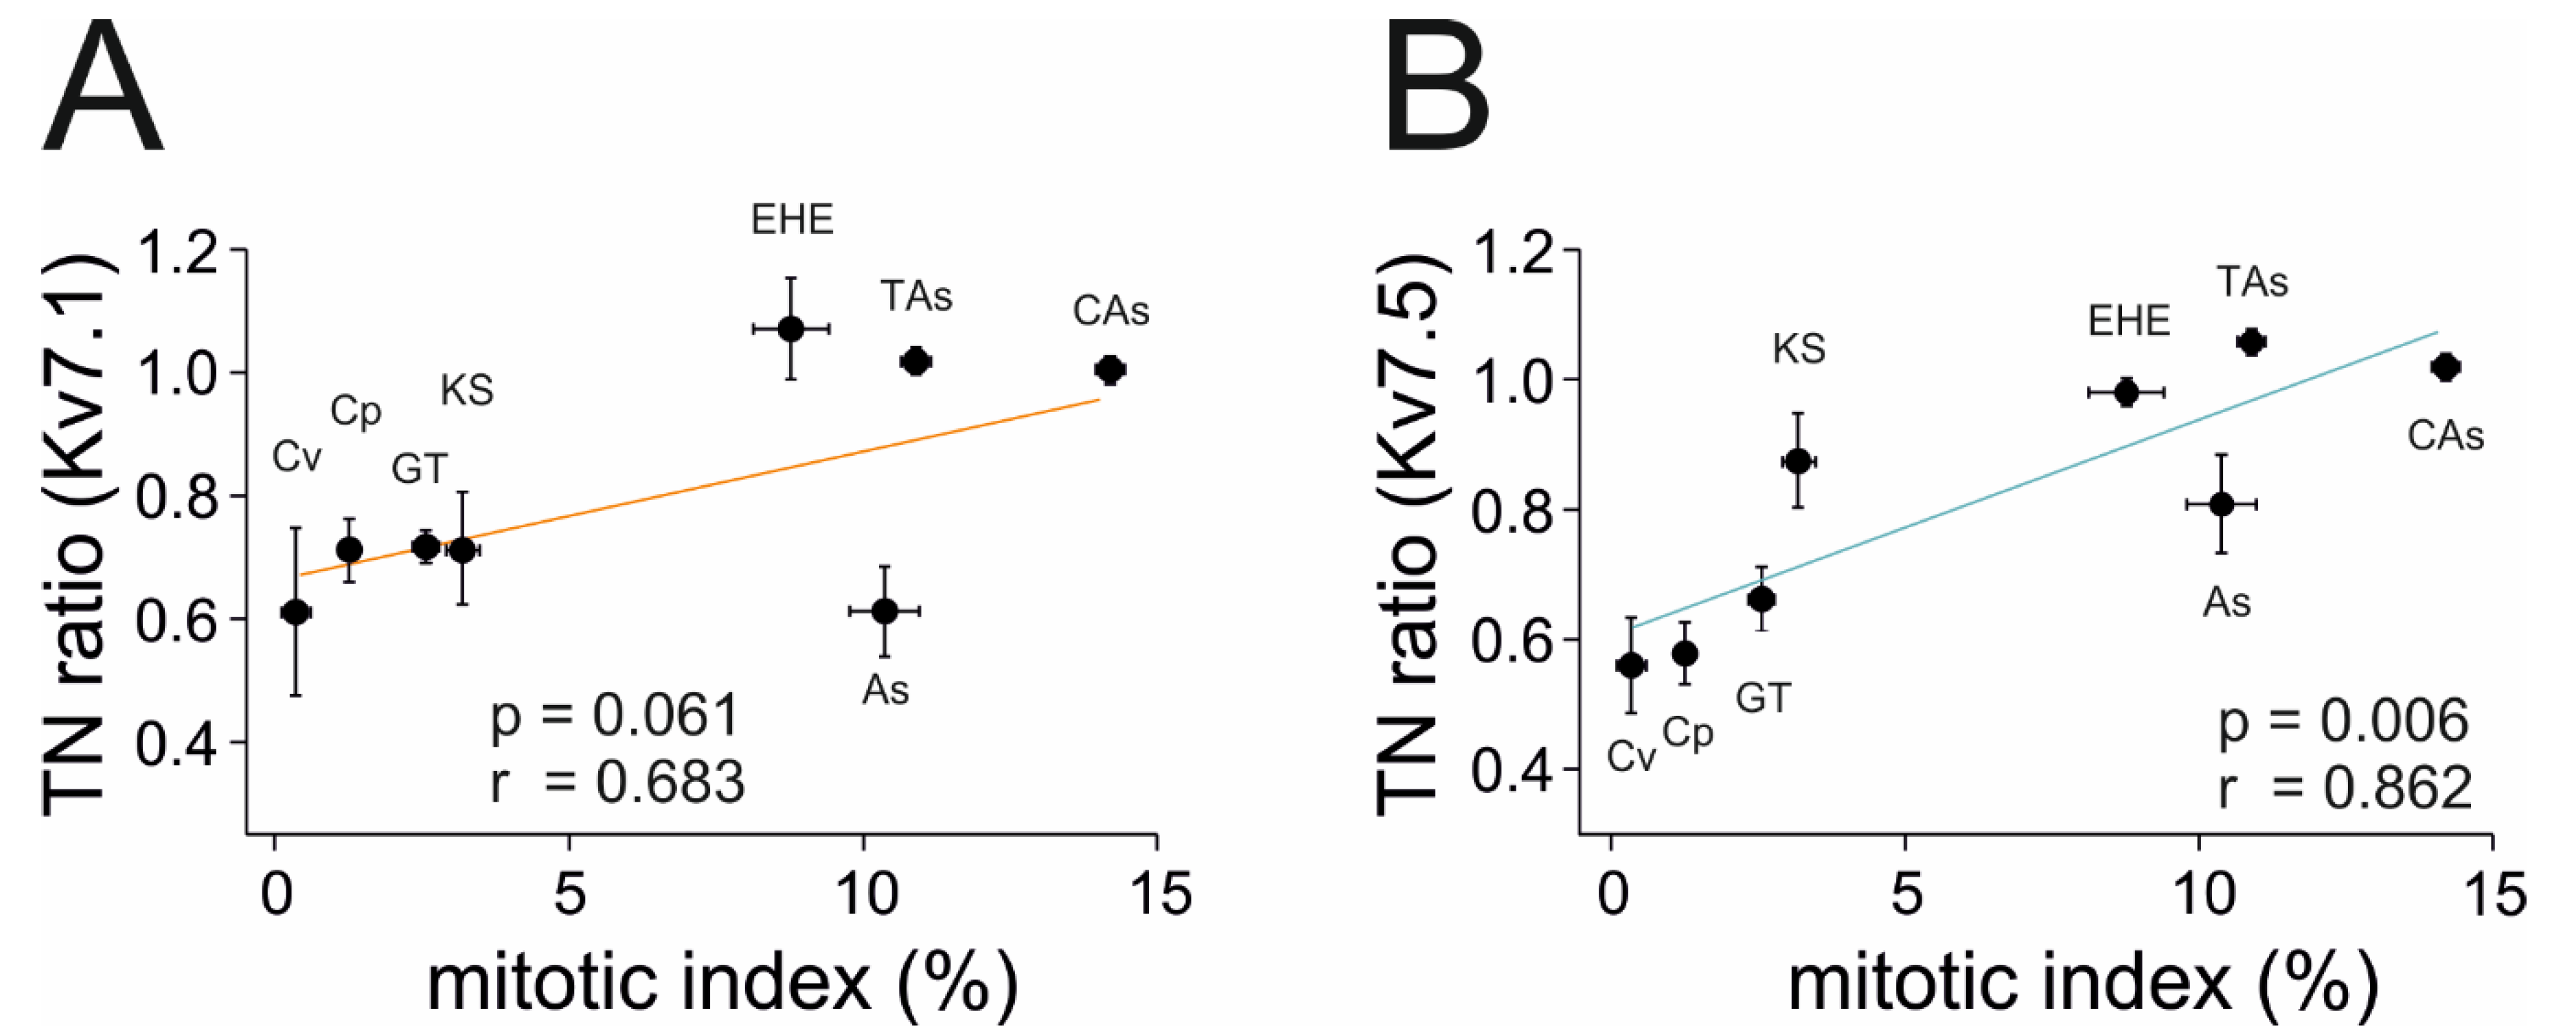
2.3. Kv7.1 and Kv7.5 Expression Correlates with Tumor Malignancy
3. Discussion
4. Materials and Methods
4.1. Tissue Samples, Protein Extraction and Western Blot
4.2. Fluorescence Immunohistochemistry in Human Samples
4.3. Confocal Scanning Laser Microscopy
4.4. Histologic Analysis
Supplementary Materials
Author Contributions
Funding
Conflicts of Interest
References
- Serrano-Novillo, C.; Capera, J.; Colomer-Molera, M.; Condom, E.; Ferreres, J.C.; Felipe, A. Implication of Voltage-Gated Potassium Channels in Neoplastic Cell Proliferation. Cancers (Basel) 2019, 11, 287. [Google Scholar] [CrossRef] [PubMed] [Green Version]
- Kunzelmann, K. Ion channels and cancer. J. Membr. Biol. 2005, 205, 159–173. [Google Scholar] [CrossRef] [PubMed]
- Pardo, L.A.; Stuhmer, W. The roles of K(+) channels in cancer. Nat. Rev. Cancer 2014, 14, 39–48. [Google Scholar] [CrossRef] [PubMed]
- Felipe, A.; Vicente, R.; Villalonga, N.; Roura-Ferrer, M.; Martinez-Marmol, R.; Sole, L.; Ferreres, J.C.; Condom, E. Potassium channels: New targets in cancer therapy. Cancer Detect. Prev. 2006, 30, 375–385. [Google Scholar] [CrossRef]
- Bell, C.D. Endothelial cell tumors. Microsc. Res. Tech. 2003, 60, 165–170. [Google Scholar] [CrossRef]
- Sepulveda, A.; Buchanan, E.P. Vascular tumors. Semin. Plast. Surg. 2014, 28, 49–57. [Google Scholar] [CrossRef] [Green Version]
- Fosmo, A.L.; Skraastad, O.B. The Kv7 Channel and Cardiovascular Risk Factors. Front. Cardiovasc. Med. 2017, 4, 75. [Google Scholar] [CrossRef] [Green Version]
- Brueggemann, L.I.; Moran, C.J.; Barakat, J.A.; Yeh, J.Z.; Cribbs, L.L.; Byron, K.L. Vasopressin stimulates action potential firing by protein kinase C-dependent inhibition of KCNQ5 in A7r5 rat aortic smooth muscle cells. Am. J. Physiol. Heart Circ. Physiol. 2007, 292, H1352–H1363. [Google Scholar] [CrossRef] [Green Version]
- Chadha, P.S.; Jepps, T.A.; Carr, G.; Stott, J.B.; Zhu, H.L.; Cole, W.C.; Greenwood, I.A. Contribution of kv7.4/kv7.5 heteromers to intrinsic and calcitonin gene-related peptide-induced cerebral reactivity. Arterioscler. Thromb. Vasc. Biol. 2014, 34, 887–893. [Google Scholar] [CrossRef] [Green Version]
- Byron, K.L.; Brueggemann, L.I. Kv7 potassium channels as signal transduction intermediates in the control of microvascular tone. Microcirculation 2018, 25. [Google Scholar] [CrossRef]
- Yeung, S.Y.; Greenwood, I.A. Electrophysiological and functional effects of the KCNQ channel blocker XE991 on murine portal vein smooth muscle cells. Br. J. Pharmacol. 2005, 146, 585–595. [Google Scholar] [CrossRef] [PubMed] [Green Version]
- Ng, F.L.; Davis, A.J.; Jepps, T.A.; Harhun, M.I.; Yeung, S.Y.; Wan, A.; Reddy, M.; Melville, D.; Nardi, A.; Khong, T.K.; et al. Expression and function of the K+ channel KCNQ genes in human arteries. Br. J. Pharmacol. 2011, 162, 42–53. [Google Scholar] [CrossRef] [PubMed] [Green Version]
- Haick, J.M.; Byron, K.L. Novel treatment strategies for smooth muscle disorders: Targeting Kv7 potassium channels. Pharmacol. Ther. 2016, 165, 14–25. [Google Scholar] [CrossRef] [PubMed]
- Oliveras, A.; Roura-Ferrer, M.; Sole, L.; de la Cruz, A.; Prieto, A.; Etxebarria, A.; Manils, J.; Morales-Cano, D.; Condom, E.; Soler, C.; et al. Functional assembly of Kv7.1/Kv7.5 channels with emerging properties on vascular muscle physiology. Arterioscler. Thromb. Vasc. Biol. 2014, 34, 1522–1530. [Google Scholar] [CrossRef] [PubMed] [Green Version]
- Shimizu, T.; Fujii, T.; Takahashi, Y.; Suzuki, T.; Ukai, M.; Tauchi, K.; Horikawa, N.; Tsukada, K.; Sakai, H. Up-regulation of Kv7.1 channels in thromboxane A2-induced colonic cancer cell proliferation. Pflugers Arch. 2014, 466, 541–548. [Google Scholar] [CrossRef]
- Tsevi, I.; Vicente, R.; Grande, M.; Lopez-Iglesias, C.; Figueras, A.; Capella, G.; Condom, E.; Felipe, A. KCNQ1/KCNE1 channels during germ-cell differentiation in the rat: Expression associated with testis pathologies. J. Cell. Physiol. 2005, 202, 400–410. [Google Scholar] [CrossRef] [PubMed]
- Ren, K.; Xu, R.; Huang, J.; Zhao, J.; Shi, W. Knockdown of long non-coding RNA KCNQ1OT1 depressed chemoresistance to paclitaxel in lung adenocarcinoma. Cancer Chemother. Pharm. 2017, 80, 243–250. [Google Scholar] [CrossRef]
- Roura-Ferrer, M.; Sole, L.; Martinez-Marmol, R.; Villalonga, N.; Felipe, A. Skeletal muscle Kv7 (KCNQ) channels in myoblast differentiation and proliferation. Biochem. Biophys. Res. Commun. 2008, 369, 1094–1097. [Google Scholar] [CrossRef]
- Lee, B.H.; Ryu, P.D.; Lee, S.Y. Serum starvation-induced voltage-gated potassium channel Kv7.5 expression and its regulation by Sp1 in canine osteosarcoma cells. Int. J. Mol. Sci. 2014, 15, 977–993. [Google Scholar] [CrossRef] [Green Version]
- WHO Classification of tumours. In Soft Tissue and Bone Tumours, 5th ed.; International Agency for Research on Cancer (IARC): Lyon, France, 2019; Volume 3.
- Abbott, G.W. KCNQs: Ligand- and Voltage-Gated Potassium Channels. Front. Physiol. 2020, 11, 583. [Google Scholar] [CrossRef]
- Greenwood, I.A.; Ohya, S. New tricks for old dogs: KCNQ expression and role in smooth muscle. Br. J. Pharmacol. 2009, 156, 1196–1203. [Google Scholar] [CrossRef] [PubMed] [Green Version]
- Barrese, V.; Stott, J.B.; Greenwood, I.A. KCNQ-Encoded Potassium Channels as Therapeutic Targets. Annu. Rev. Pharmacol. Toxicol. 2018, 58, 625–648. [Google Scholar] [CrossRef] [PubMed]
- Krumerman, A.; Gao, X.; Bian, J.S.; Melman, Y.F.; Kagan, A.; McDonald, T.V. An LQT mutant minK alters KvLQT1 trafficking. Am. J. Physiol. Cell Physiol. 2004, 286, C1453–C1463. [Google Scholar] [CrossRef] [Green Version]
- Greene, D.L.; Hoshi, N. Modulation of Kv7 channels and excitability in the brain. Cell. Mol. Life Sci. 2017, 74, 495–508. [Google Scholar] [CrossRef] [PubMed] [Green Version]
- Lehman, A.; Thouta, S.; Mancini, G.M.S.; Naidu, S.; van Slegtenhorst, M.; McWalter, K.; Person, R.; Mwenifumbo, J.; Salvarinova, R.; Guella, I.; et al. Loss-of-Function and Gain-of-Function Mutations in KCNQ5 Cause Intellectual Disability or Epileptic Encephalopathy. Am. J. Hum. Genet. 2017, 101, 65–74. [Google Scholar] [CrossRef] [PubMed]
- Ferrer, T.; Arechiga-Figueroa, I.A.; Shapiro, M.S.; Tristani-Firouzi, M.; Sanchez-Chapula, J.A. Tamoxifen inhibition of kv7.2/kv7.3 channels. PLoS ONE 2013, 8, e76085. [Google Scholar] [CrossRef] [Green Version]


© 2020 by the authors. Licensee MDPI, Basel, Switzerland. This article is an open access article distributed under the terms and conditions of the Creative Commons Attribution (CC BY) license (http://creativecommons.org/licenses/by/4.0/).
Share and Cite
Serrano-Novillo, C.; Oliveras, A.; Ferreres, J.C.; Condom, E.; Felipe, A. Remodeling of Kv7.1 and Kv7.5 Expression in Vascular Tumors. Int. J. Mol. Sci. 2020, 21, 6019. https://0-doi-org.brum.beds.ac.uk/10.3390/ijms21176019
Serrano-Novillo C, Oliveras A, Ferreres JC, Condom E, Felipe A. Remodeling of Kv7.1 and Kv7.5 Expression in Vascular Tumors. International Journal of Molecular Sciences. 2020; 21(17):6019. https://0-doi-org.brum.beds.ac.uk/10.3390/ijms21176019
Chicago/Turabian StyleSerrano-Novillo, Clara, Anna Oliveras, Joan Carles Ferreres, Enric Condom, and Antonio Felipe. 2020. "Remodeling of Kv7.1 and Kv7.5 Expression in Vascular Tumors" International Journal of Molecular Sciences 21, no. 17: 6019. https://0-doi-org.brum.beds.ac.uk/10.3390/ijms21176019