Article

Air Pollution and Atopic Dermatitis (AD): The Impact of Particulate Matter (PM10) on an AD Mouse-Model

1
Department of Dermatology, Incheon St. Mary’s Hospital, The Catholic University of Korea, Seoul 06591, Korea
2
Department of Biomedicine & Health Sciences, The Catholic University of Korea, Seoul 06591, Korea
*
Author to whom correspondence should be addressed.
These authors contributed equally to this work.
Int. J. Mol. Sci. 2020, 21(17), 6079; https://0-doi-org.brum.beds.ac.uk/10.3390/ijms21176079
Submission received: 31 July 2020 / Revised: 17 August 2020 / Accepted: 20 August 2020 / Published: 24 August 2020
(This article belongs to the Special Issue Therapy and Prevention of Atopic Dermatitis and Psoriasis 2020)

Abstract

:
Air pollution reportedly contributes to the development and exacerbation of atopic dermatitis (AD). However, the exact mechanism underlying this remains unclear. To examine the relationship between air pollution and AD, a clinical, histological, and genetic analysis was performed on particulate matter (PM)-exposed mice. Five-week-old BALB/c mice were randomly divided into four groups (control group, ovalbumin (OVA) group, PM group, OVA + PM group; n = 6) and treated with OVA or PM10, alone or together. Cutaneous exposure to OVA and PM10 alone resulted in a significant increase in skin severity scores, trans-epidermal water loss (TEWL) and epidermal thickness compared to the control group at Week 6. The findings were further accentuated in the OVA + PM group showing statistical significance over the OVA group. A total of 635, 501, and 2149 genes were found to be differentially expressed following OVA, PM10, and OVA + PM10 exposure, respectively. Strongly upregulated genes included RNASE2A, S100A9, SPRR2D, THRSP, SPRR2A1 (OVA vs. control), SPRR2D, S100A9, STFA3, CHIL1, DBP, IL1B (PM vs. control) and S100A9, SPRR2D, SPRR2B, S100A8, SPRR2A3 (OVA + PM vs. control). In comparing the groups OVA + PM with OVA, 818 genes were differentially expressed with S100A9, SPRR2B, SAA3, S100A8, SPRR2D being the most highly upregulated in the OVA + PM group. Taken together, our study demonstrates that PM10 exposure induces/aggravates skin inflammation via the differential expression of genes controlling skin barrier integrity and immune response. We provide evidence on the importance of public awareness in PM-associated skin inflammation. Vigilant attention should be paid to all individuals, especially to those with AD.

Graphical Abstract

1. Introduction

Air pollution is an important environmental issue and a major threat to global health [1]. Particulate matter (PM), a key component of air pollution, is a designated carcinogen [2], and is well known to increase the risk of cardiovascular and respiratory diseases [3,4]. In recent years, the damaging effect of PM on the skin has raised great interest [5,6,7].
Atopic dermatitis (AD) is an inflammatory, chronically relapsing, and intensely pruritic skin condition. With a prevalence of 2 to 5% (approximately 15% in children and young adults), it is one of the most common skin diseases in industrialized countries. AD has a strong genetic predisposition, but its recent surge in incidence also stresses the role of the environment in the pathogenesis of AD. According to epidemiologic studies, air pollution/PM significantly influences the symptoms of AD [1,8,9,10,11,12,13,14]. However, there is little definitive mechanistic evidence supporting this [15].
PM is a heterogenous mixture of solid and liquid particles suspended in air. Based on particle size, PM is categorized into PM0.1 (ultrafine particles, ≤0.1 μm), PM2.5 (fine particles, ≤2.5 μm), and PM10 (inhalable particles, ≤10 μm). PM10 encompasses PM2.5 and varies in composition depending on the source [16]. For this study, we employed a standard reference material® 2787 (SRM 2787), issued by the National Institutes of Standards and Technology (NIST). The SRM 2787 is “natural” (field collected) PM composed of polycyclic aromatic hydrocarbons (PAHs), nitro-PAHs, polybrominated diphenyl ethers (PBDEs), dioxins, sugars, and trace elements (i.e., Hg, Al, Ca, Cu, Fe, Pb, Mn, Mg, Ni), with a mean particle diameter of ≤10 μm [17].
As an important interface with the outside environment, the skin, along with the oral and respiratory routes, is a common pathway, through which ambient pollutants enter the body [18,19]. With that said, the potential mechanisms by which PM10 exerts cutaneous detrimental effects include direct insult by localization (adherence or penetration of PM to the skin) and indirect injury by systemic inflammation and oxidative stress (i.e., systemic increase of reactive oxygen species (ROS) through the respiratory system) [7].
Taking into account that epithelial barrier dysfunction and cutaneous inflammation are crucial in the pathogenesis of AD [20], the aim of the present work was to evaluate the ability of topically delivered PM to clinically promote AD, and to assess the mechanisms involved in this process by gene analysis (i.e., focusing on genes associated with skin barrier function and the inflammatory pathway). To approximate the condition of AD, we used ovalbumin (OVA)-challenged mice as the animal model.

2. Results

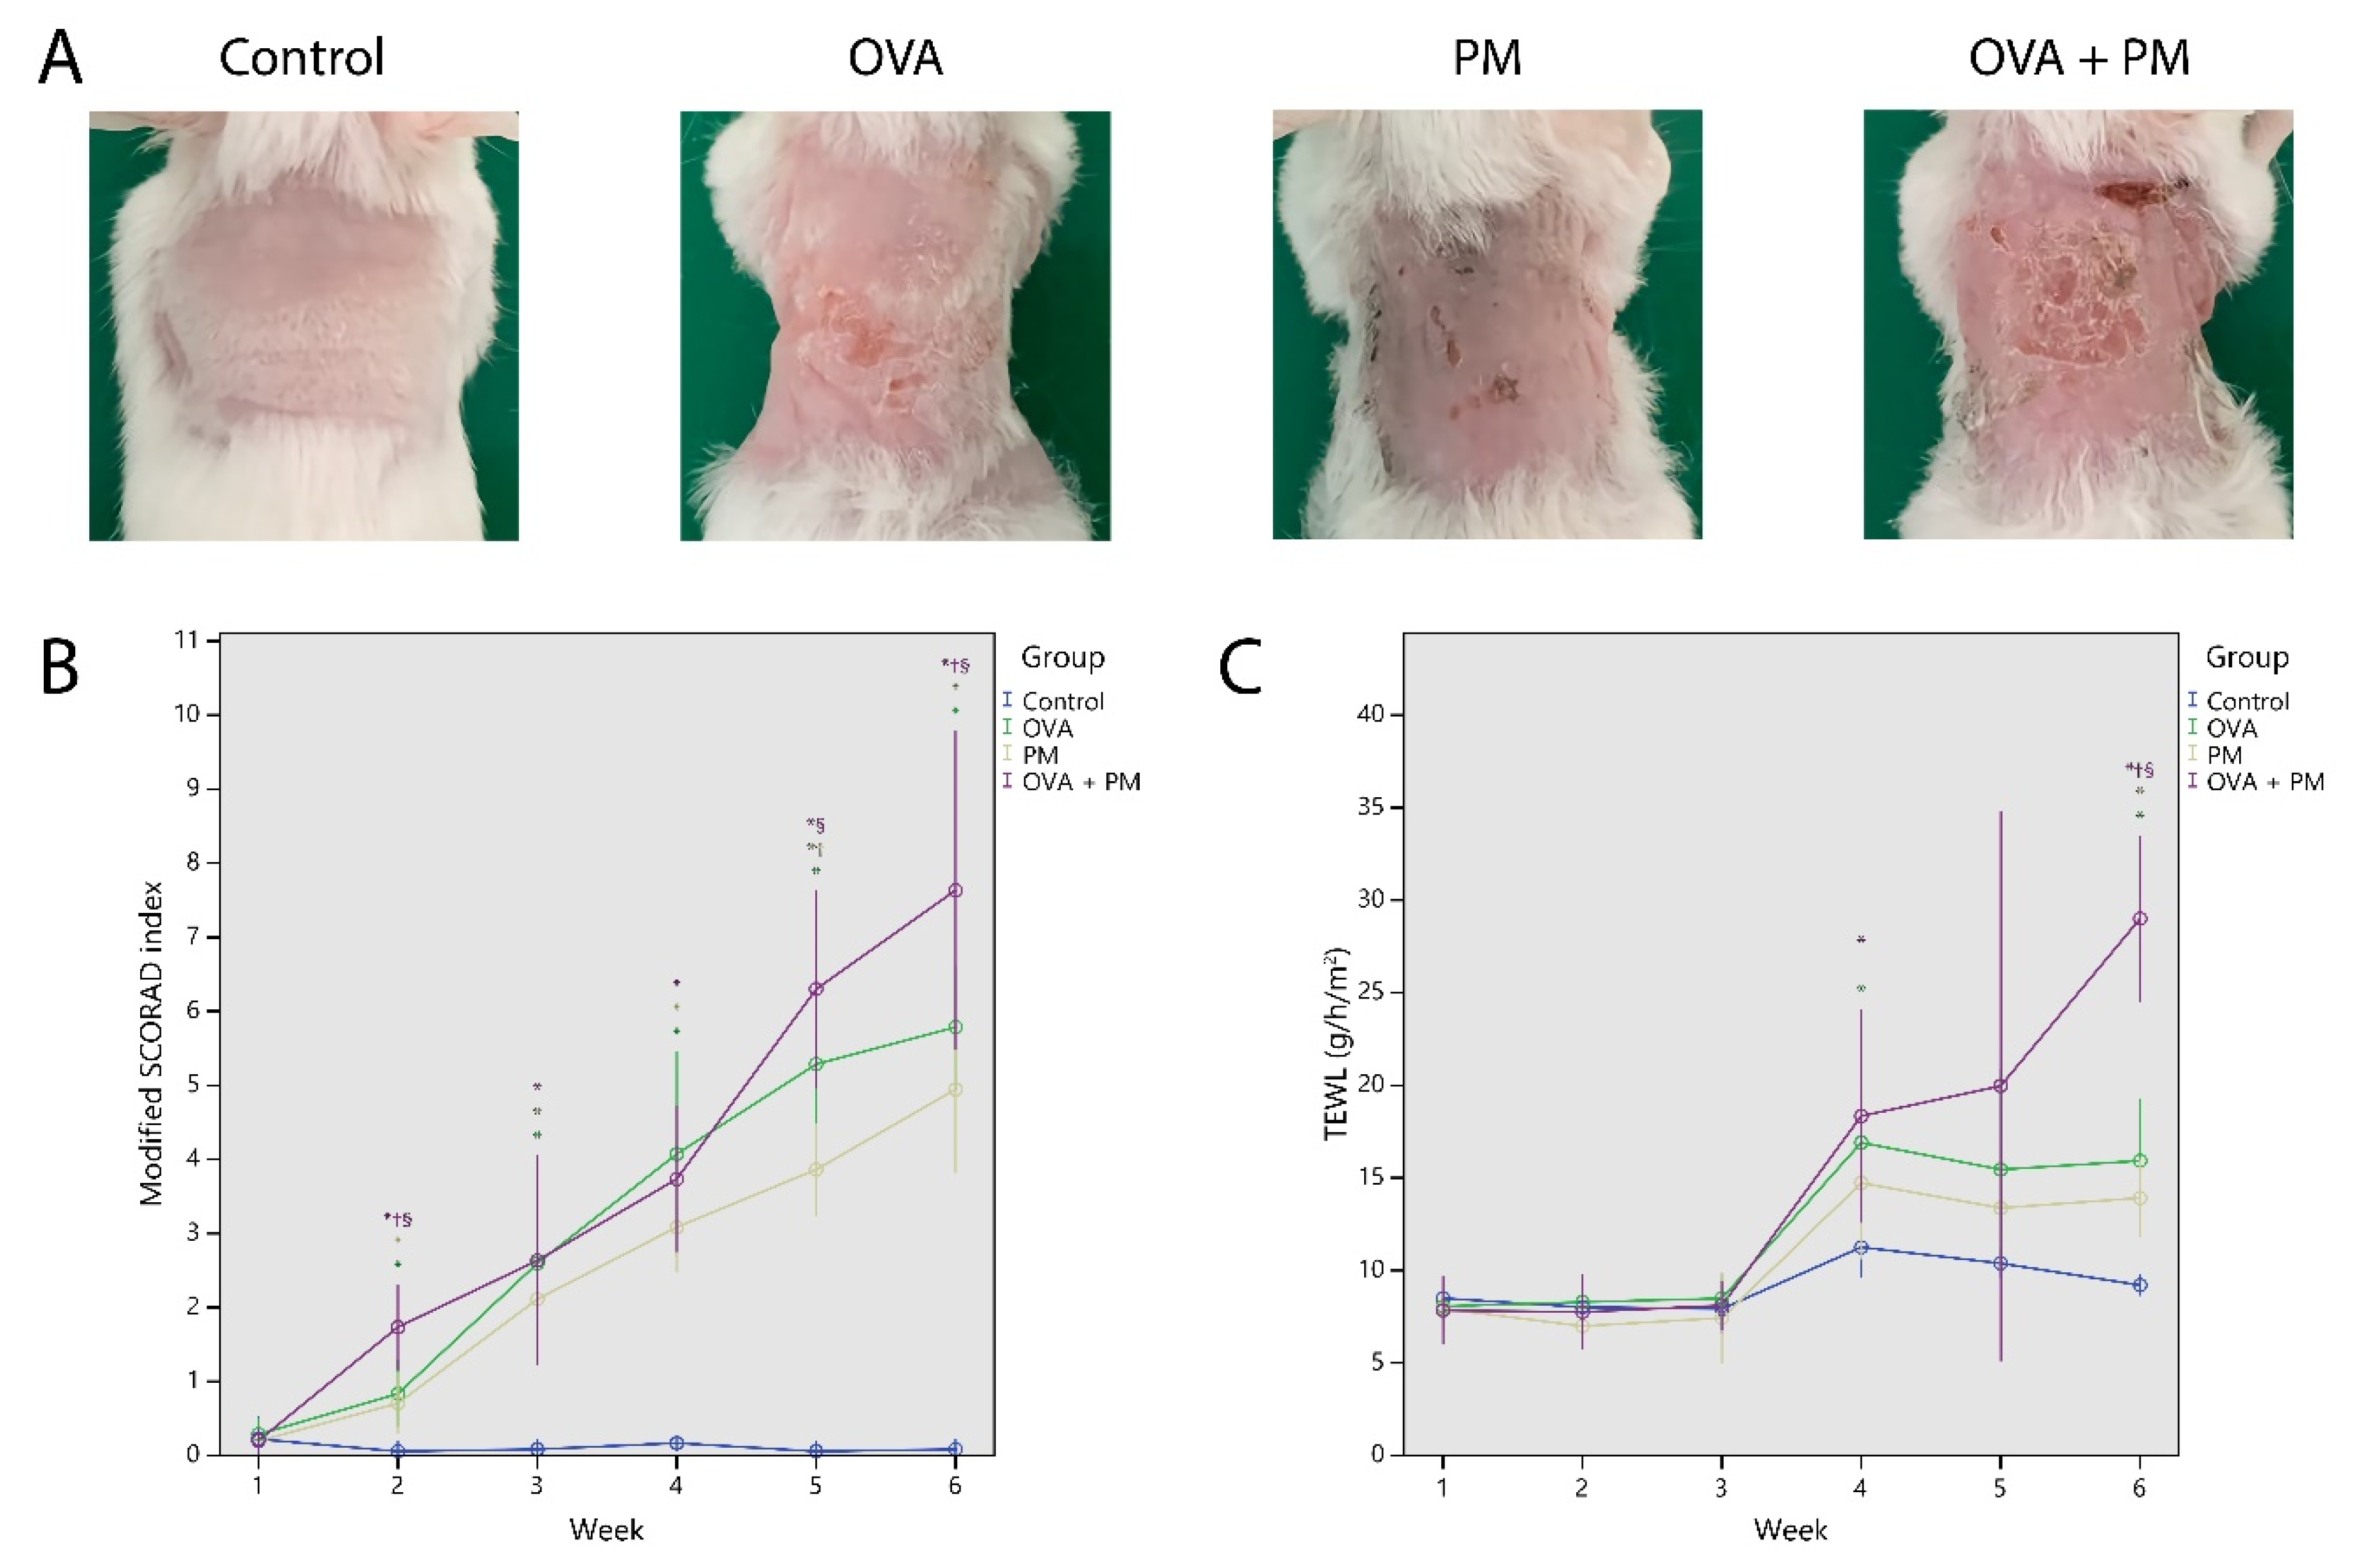
2.1. Gross Observation and Physiologic Parameters

Repeated topical application of OVA to the dorsal skin (2 × 2 cm) of BALB/c mice induced AD-like skin lesions with erythema, edema, excoriation, and scaling (Figure 1A). The skin severity score at Week 6 was higher in the OVA group (5.79 ± 0.91) and the PM group (4.94 ± 1.08) compared to control (0.08 ± 0.14) (p < 0.01). The skin severity score of the OVA + PM group (7.63 ± 1.73) was significantly higher than that of the OVA group and the PM group (p < 0.05). The skin severity score was similar between the OVA group and the PM group (p > 0.05) (Figure 1B).
OVA (OVA group) and PM10 (PM group) application caused an increase in trans-epidermal water loss (TEWL). TEWL at Week 6 was significantly higher in the OVA group (15.9 ± 3.66) and the PM group (13.9 ± 1.99), compared to control (9.20 ± 0.56) (p < 0.01). TEWL of the OVA + PM group (29.0 ± 3.61) was significantly higher than that of the OVA group and the PM group at Week 6 (p < 0.01). The TEWL was similar between the OVA and the PM group (p > 0.05) (Figure 1C).

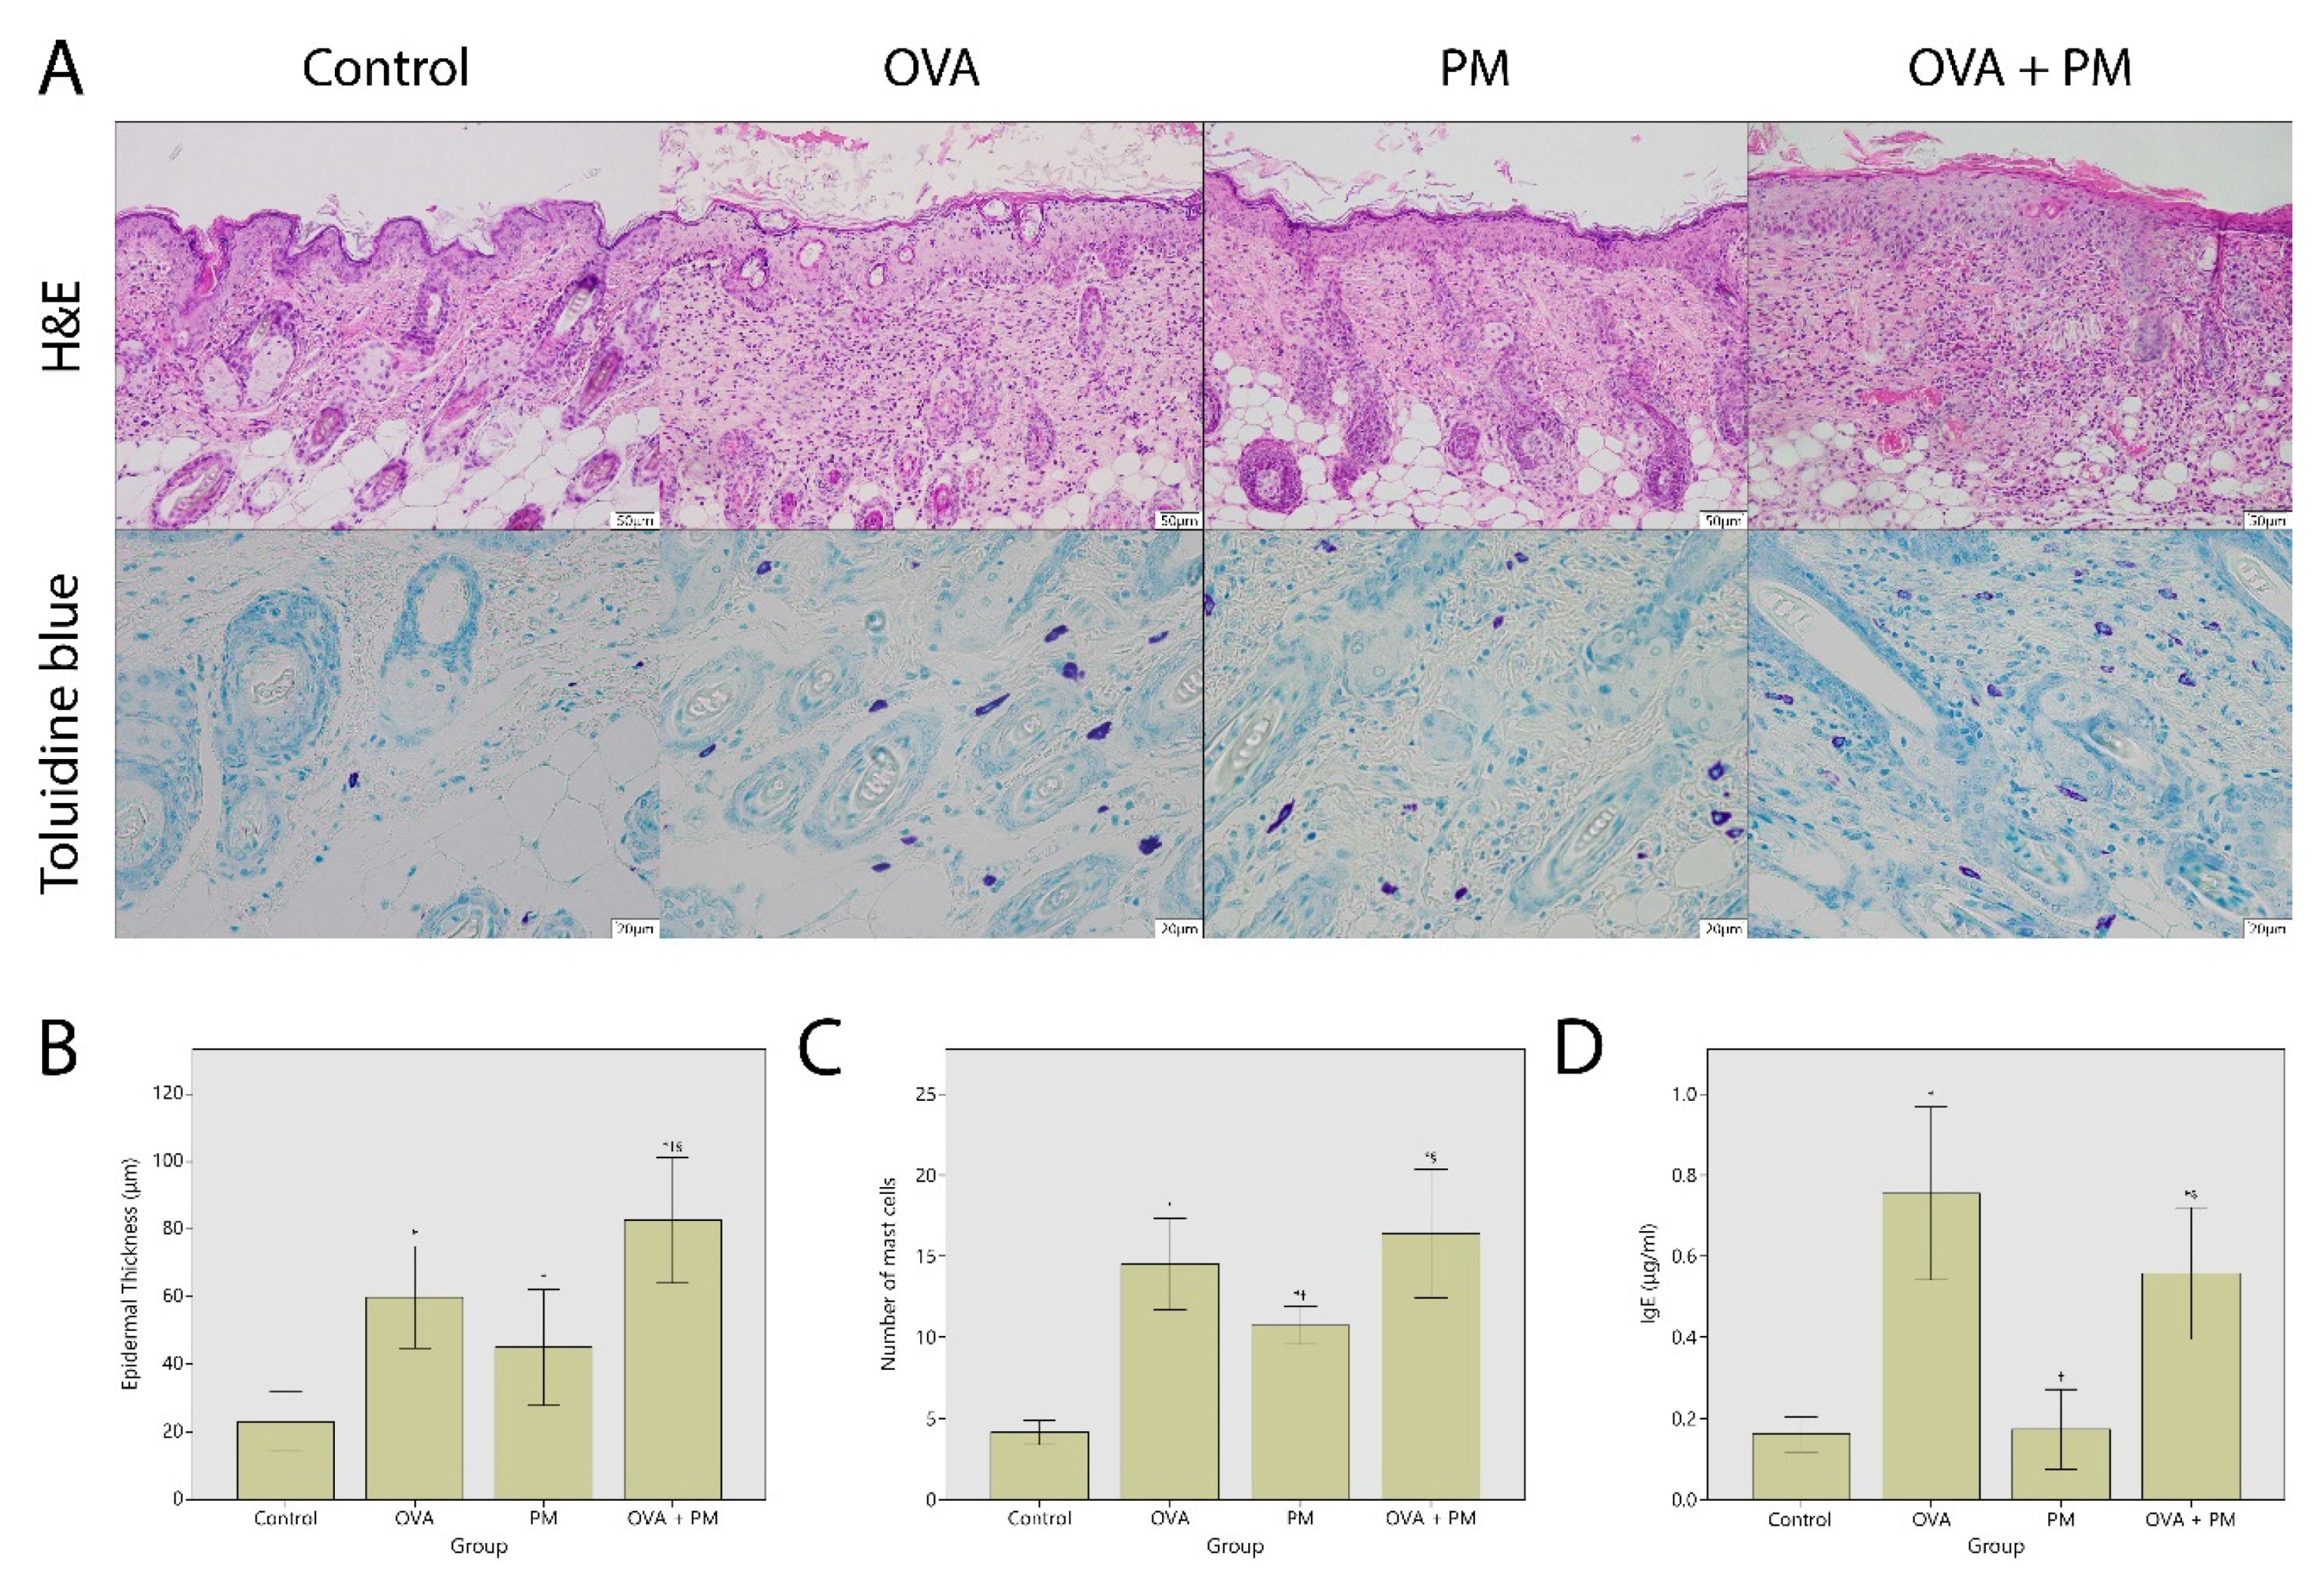
2.2. Hisopathologic Findings

Figure 2A demonstrates the hematoxylin and eosin (H&E) and toluidine blue staining of the dorsal skin. There was marked epidermal thickening after OVA (OVA group) and PM10 (PM group) application at Week 6 compared to control (59.8 ± 16.3 and 45.1 ± 16.3 μm vs. 23.2 ± 8.42 μm) (p < 0.05). The epidermis of the OVA + PM group (82.6 ± 15.0) was significantly thicker than that of the OVA group and the PM group at Week 6 (p < 0.05). The epidermal thickness was similar between the OVA and the PM group (p > 0.05) (Figure 2B).
As shown in Figure 2A, OVA and PM10 increased mast cell infiltration in the dermis. The mast cell number was significantly higher in the OVA group (14.5 ± 3.04/5 high power fields) and the PM group (10.7 ± 1.10), compared to control (4.17 ± 0.72) (p < 0.01). The number of mast cells in OVA treated groups (the OVA group, the OVA + PM group: 16.4 ± 3.19/5 high power fields) were significantly higher than that of the PM treated group (p < 0.05). The mast cell number was similar between the OVA + PM and the OVA group (p > 0.05) (Figure 2C).

2.3. Total Serum IgE

Total serum IgE at Week 6 was higher in OVA treated groups (the OVA group: 755 ± 231, the OVA + PM group: 558 ± 131 ng/mL), compared to control (162 ± 41.5 ng/mL) (p < 0.01) and the PM group (174 ± 94 ng/mL) (p < 0.01). Total serum IgE was similar between the OVA group and the OVA + PM group, and between the PM group and control (p > 0.05) (Figure 2D).

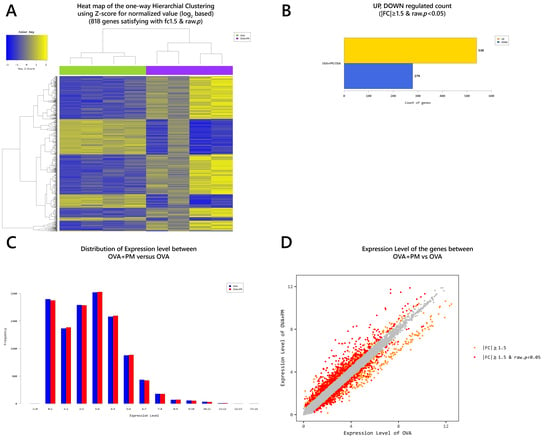
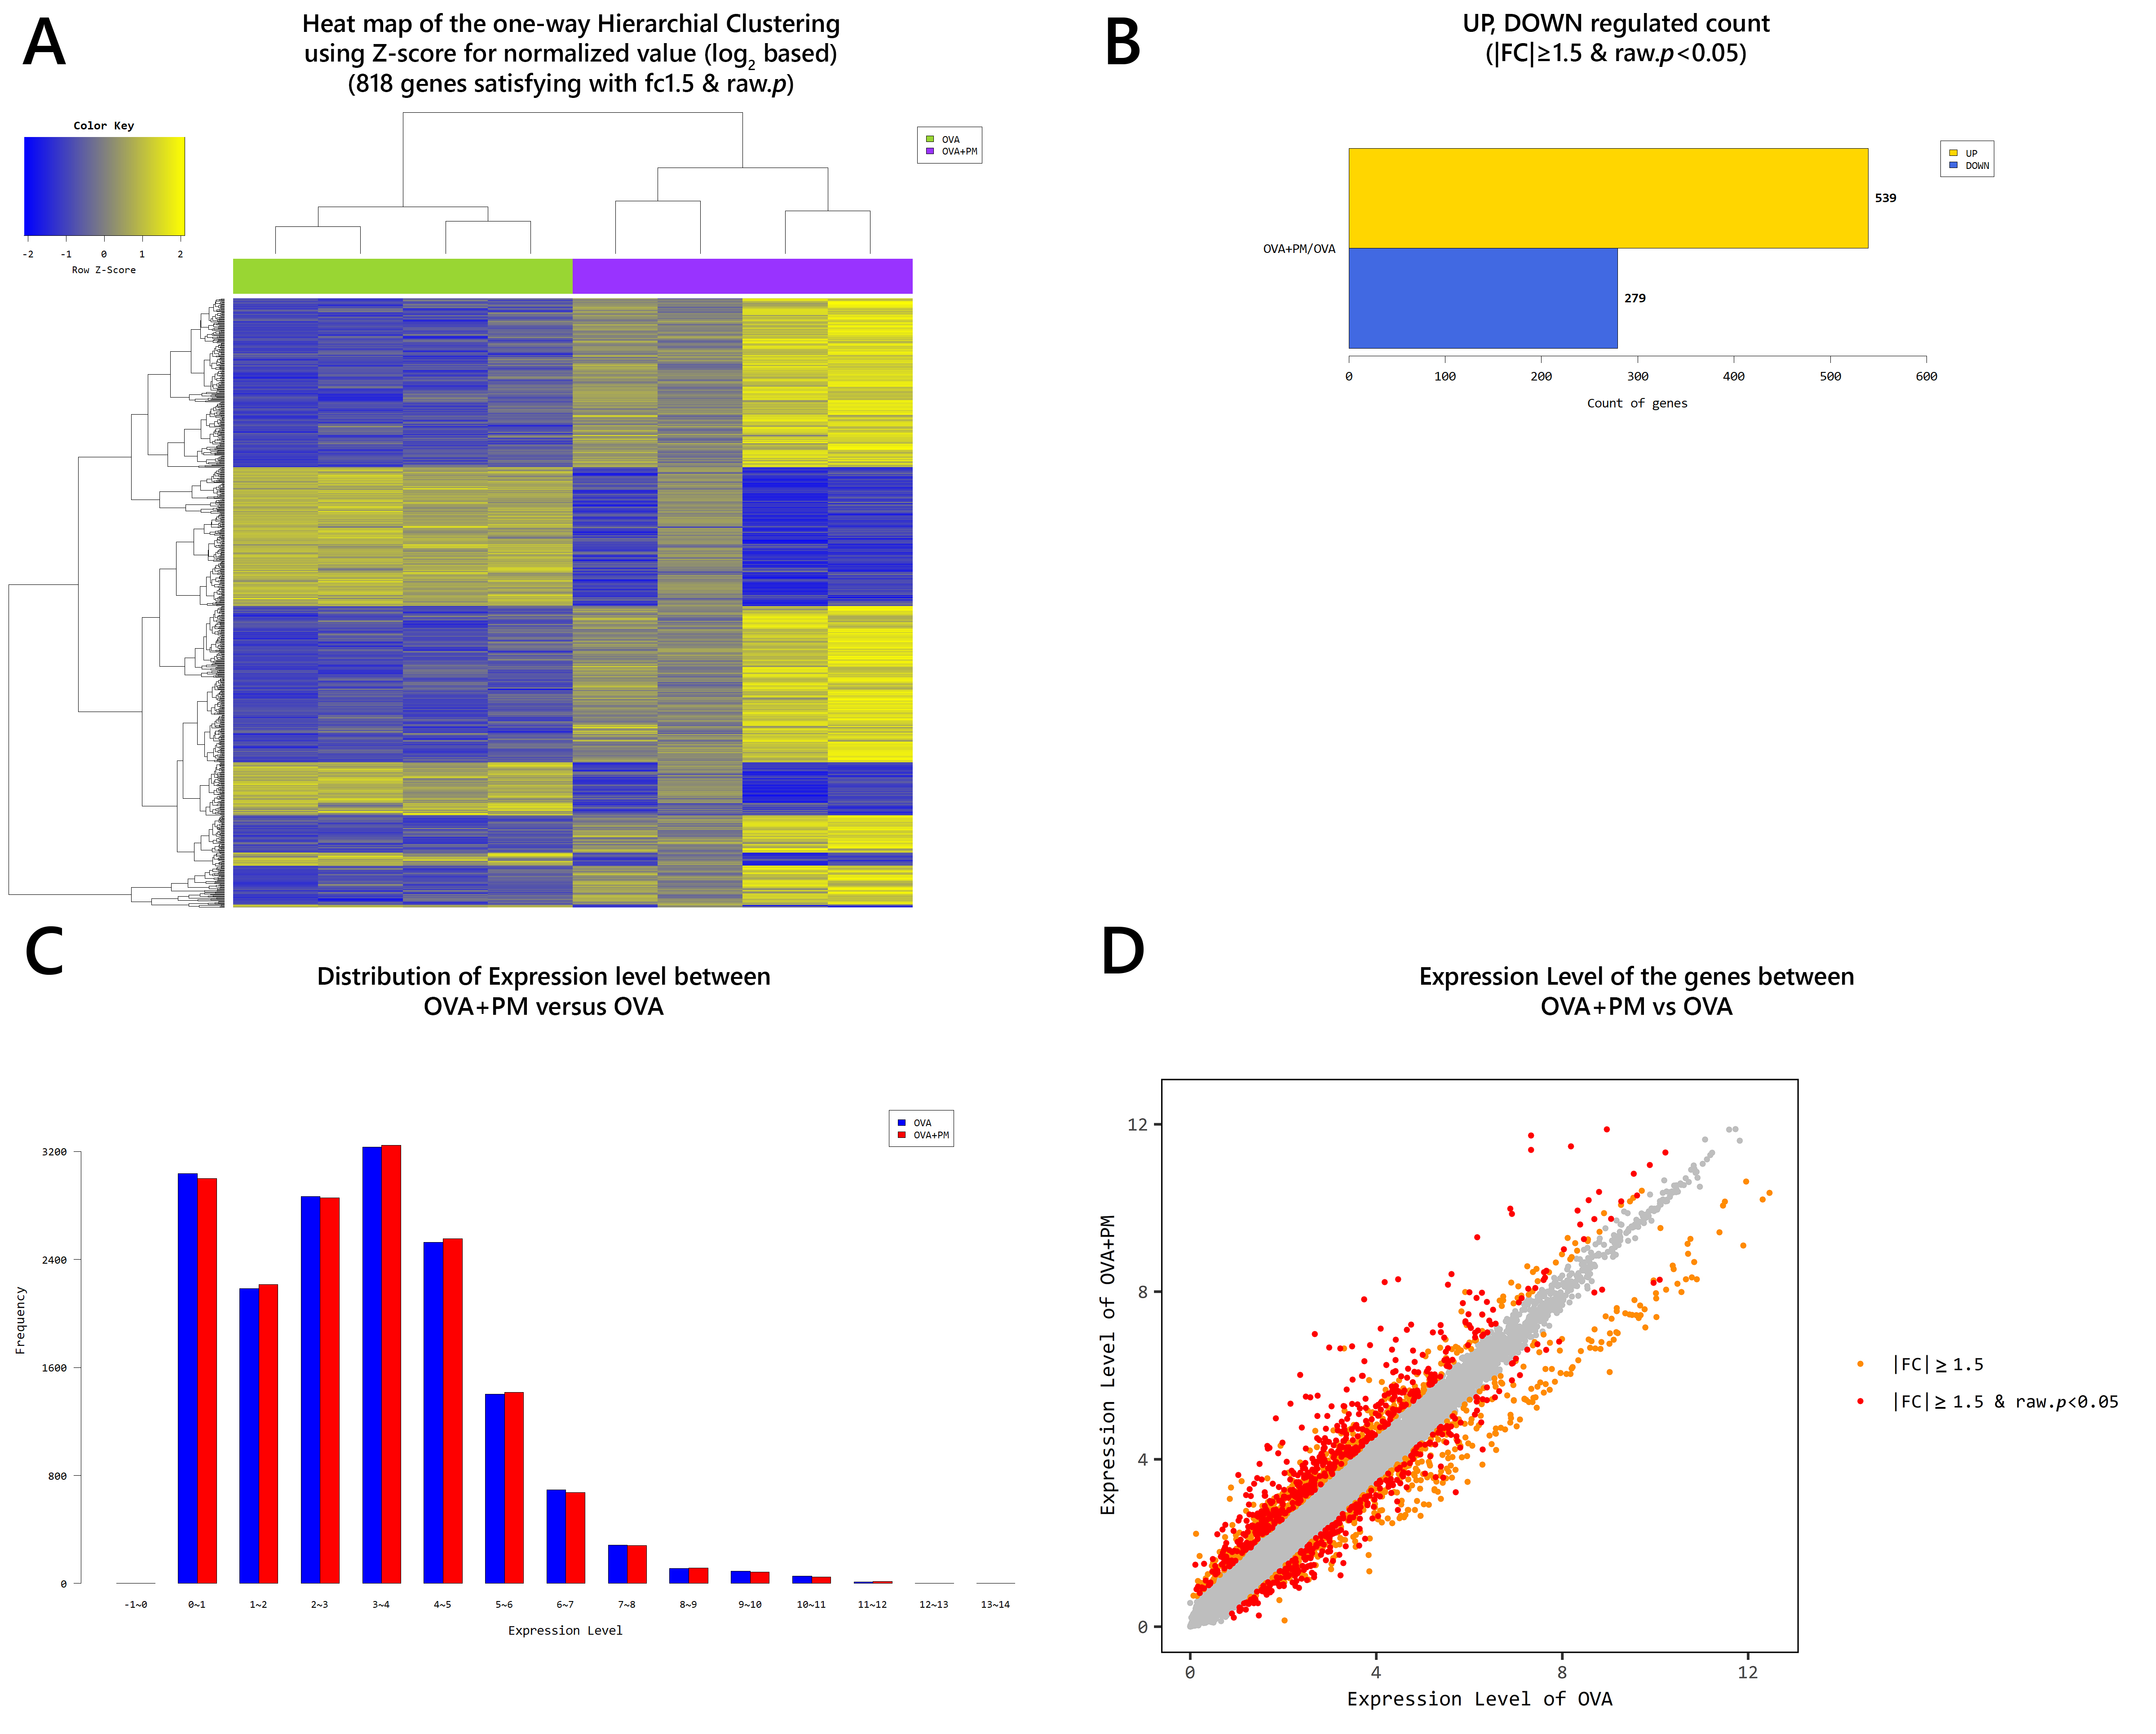
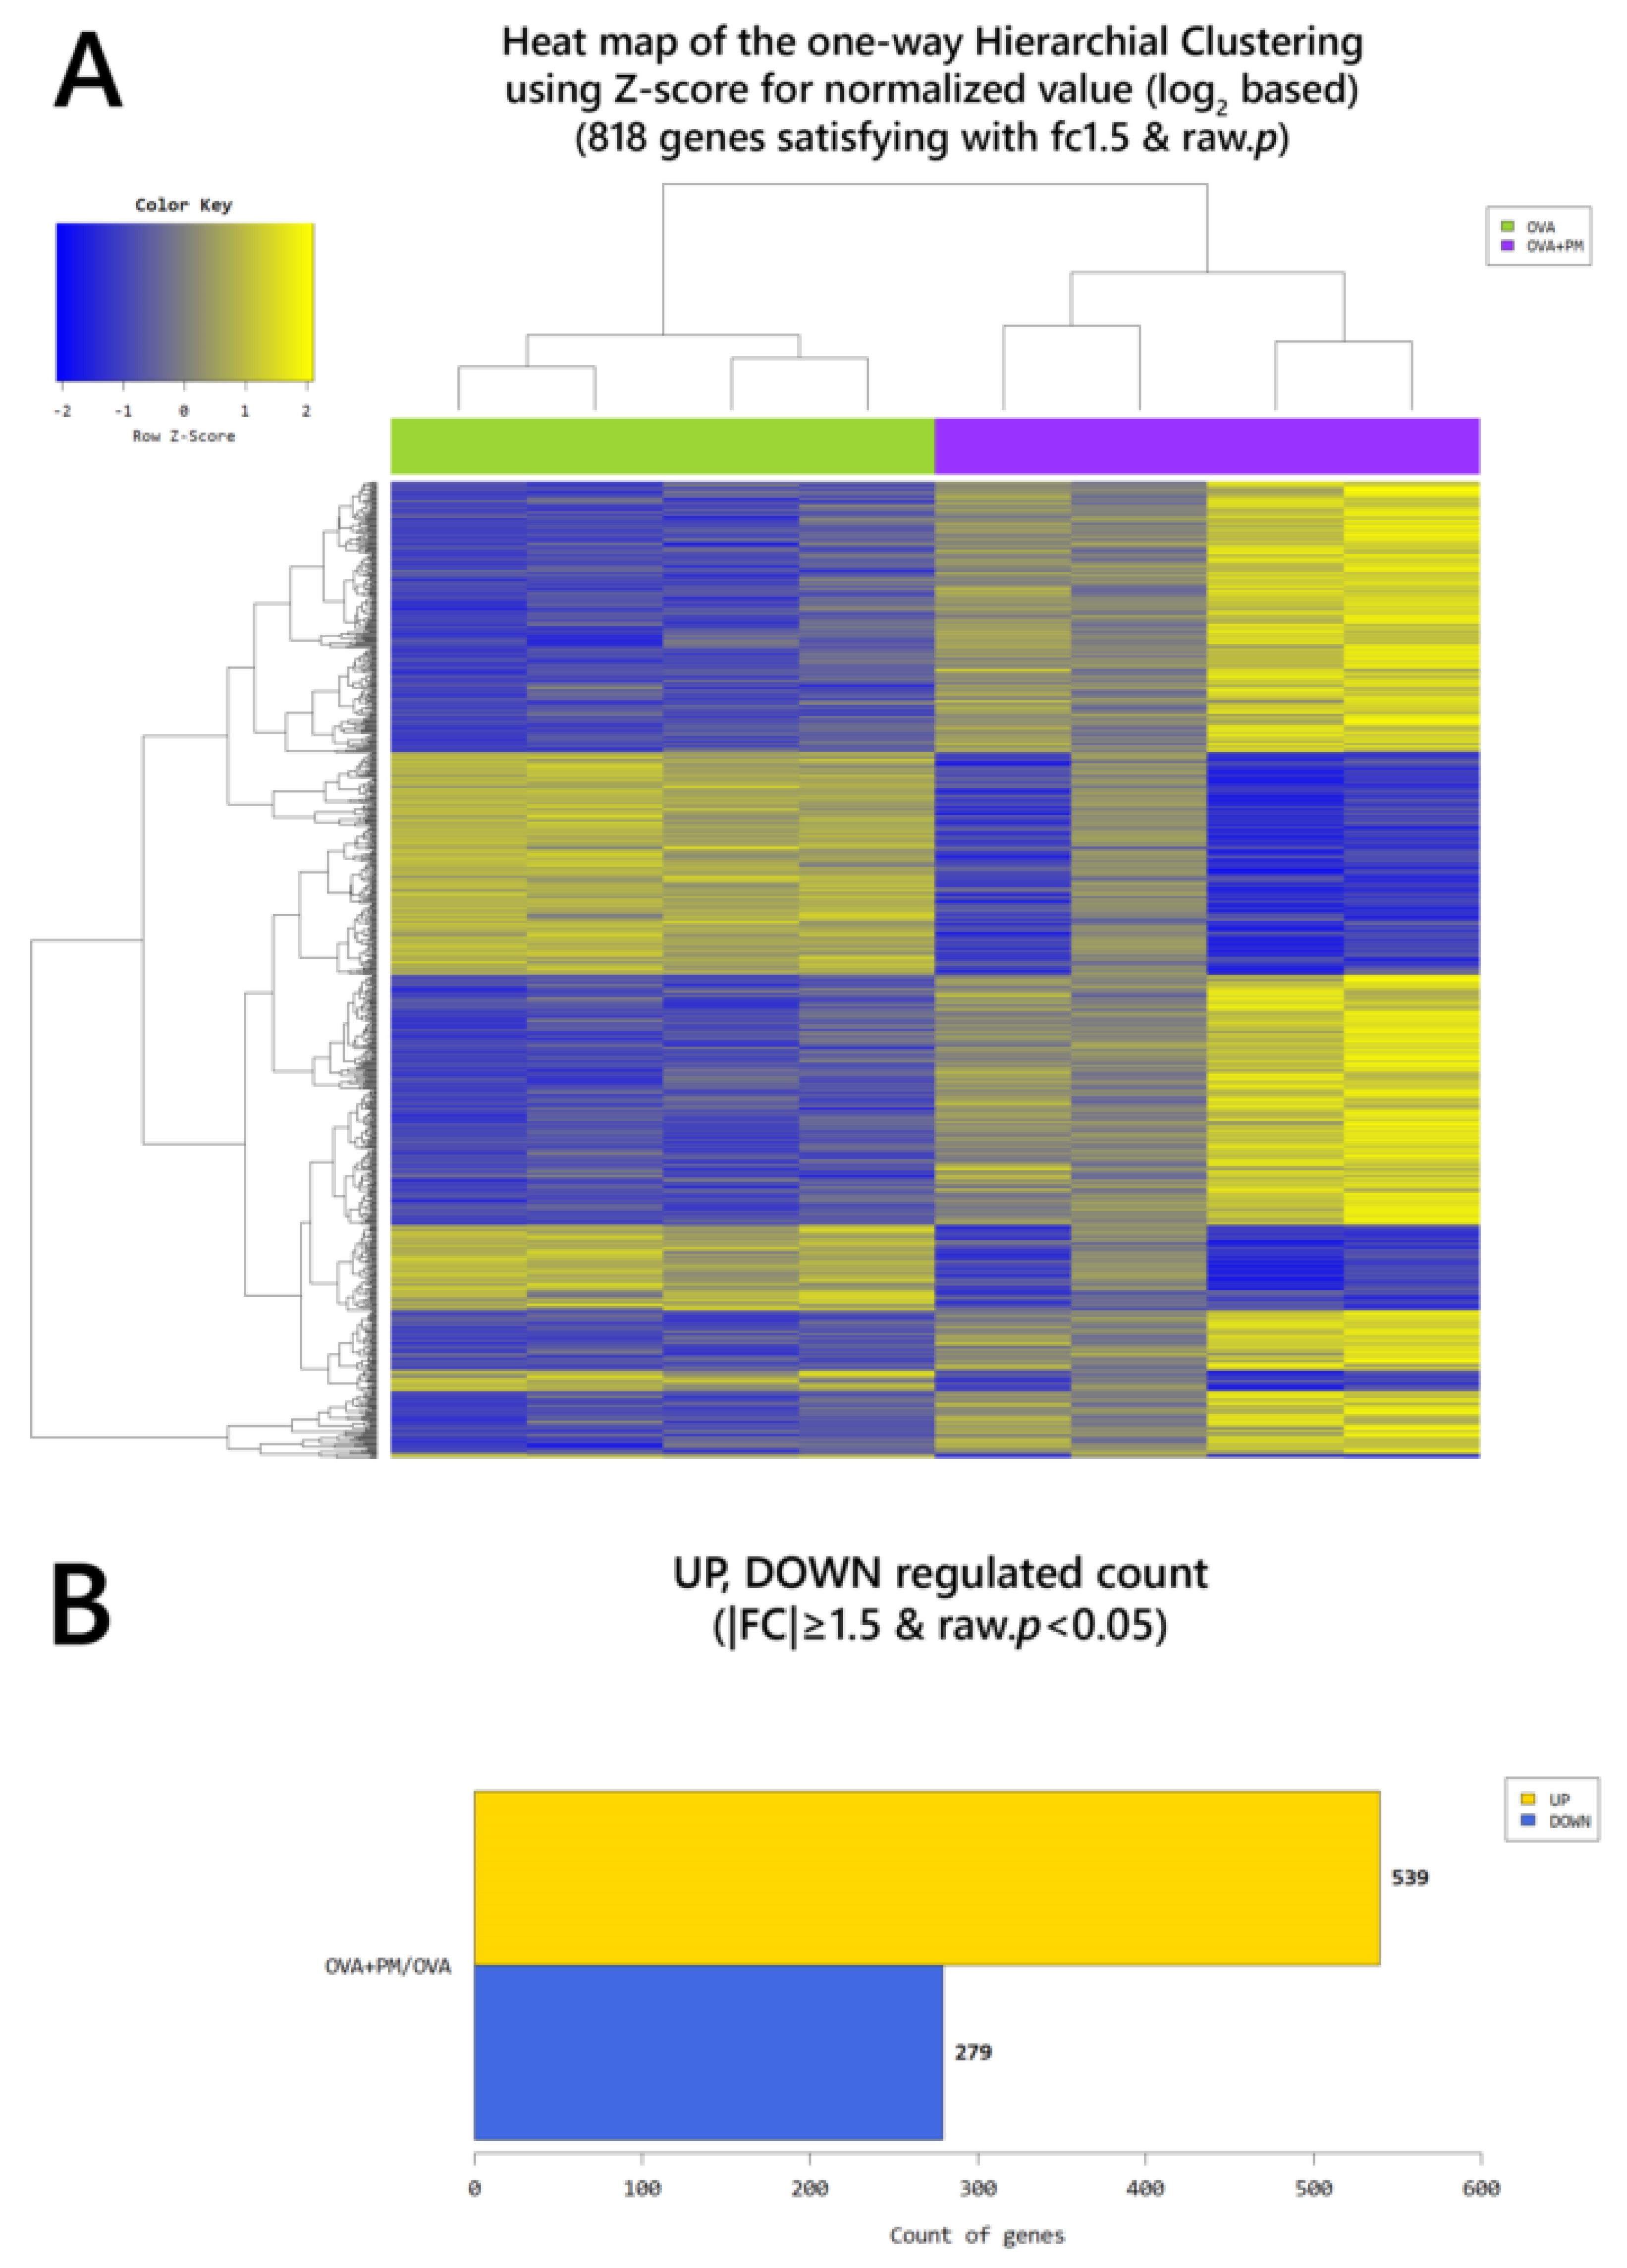
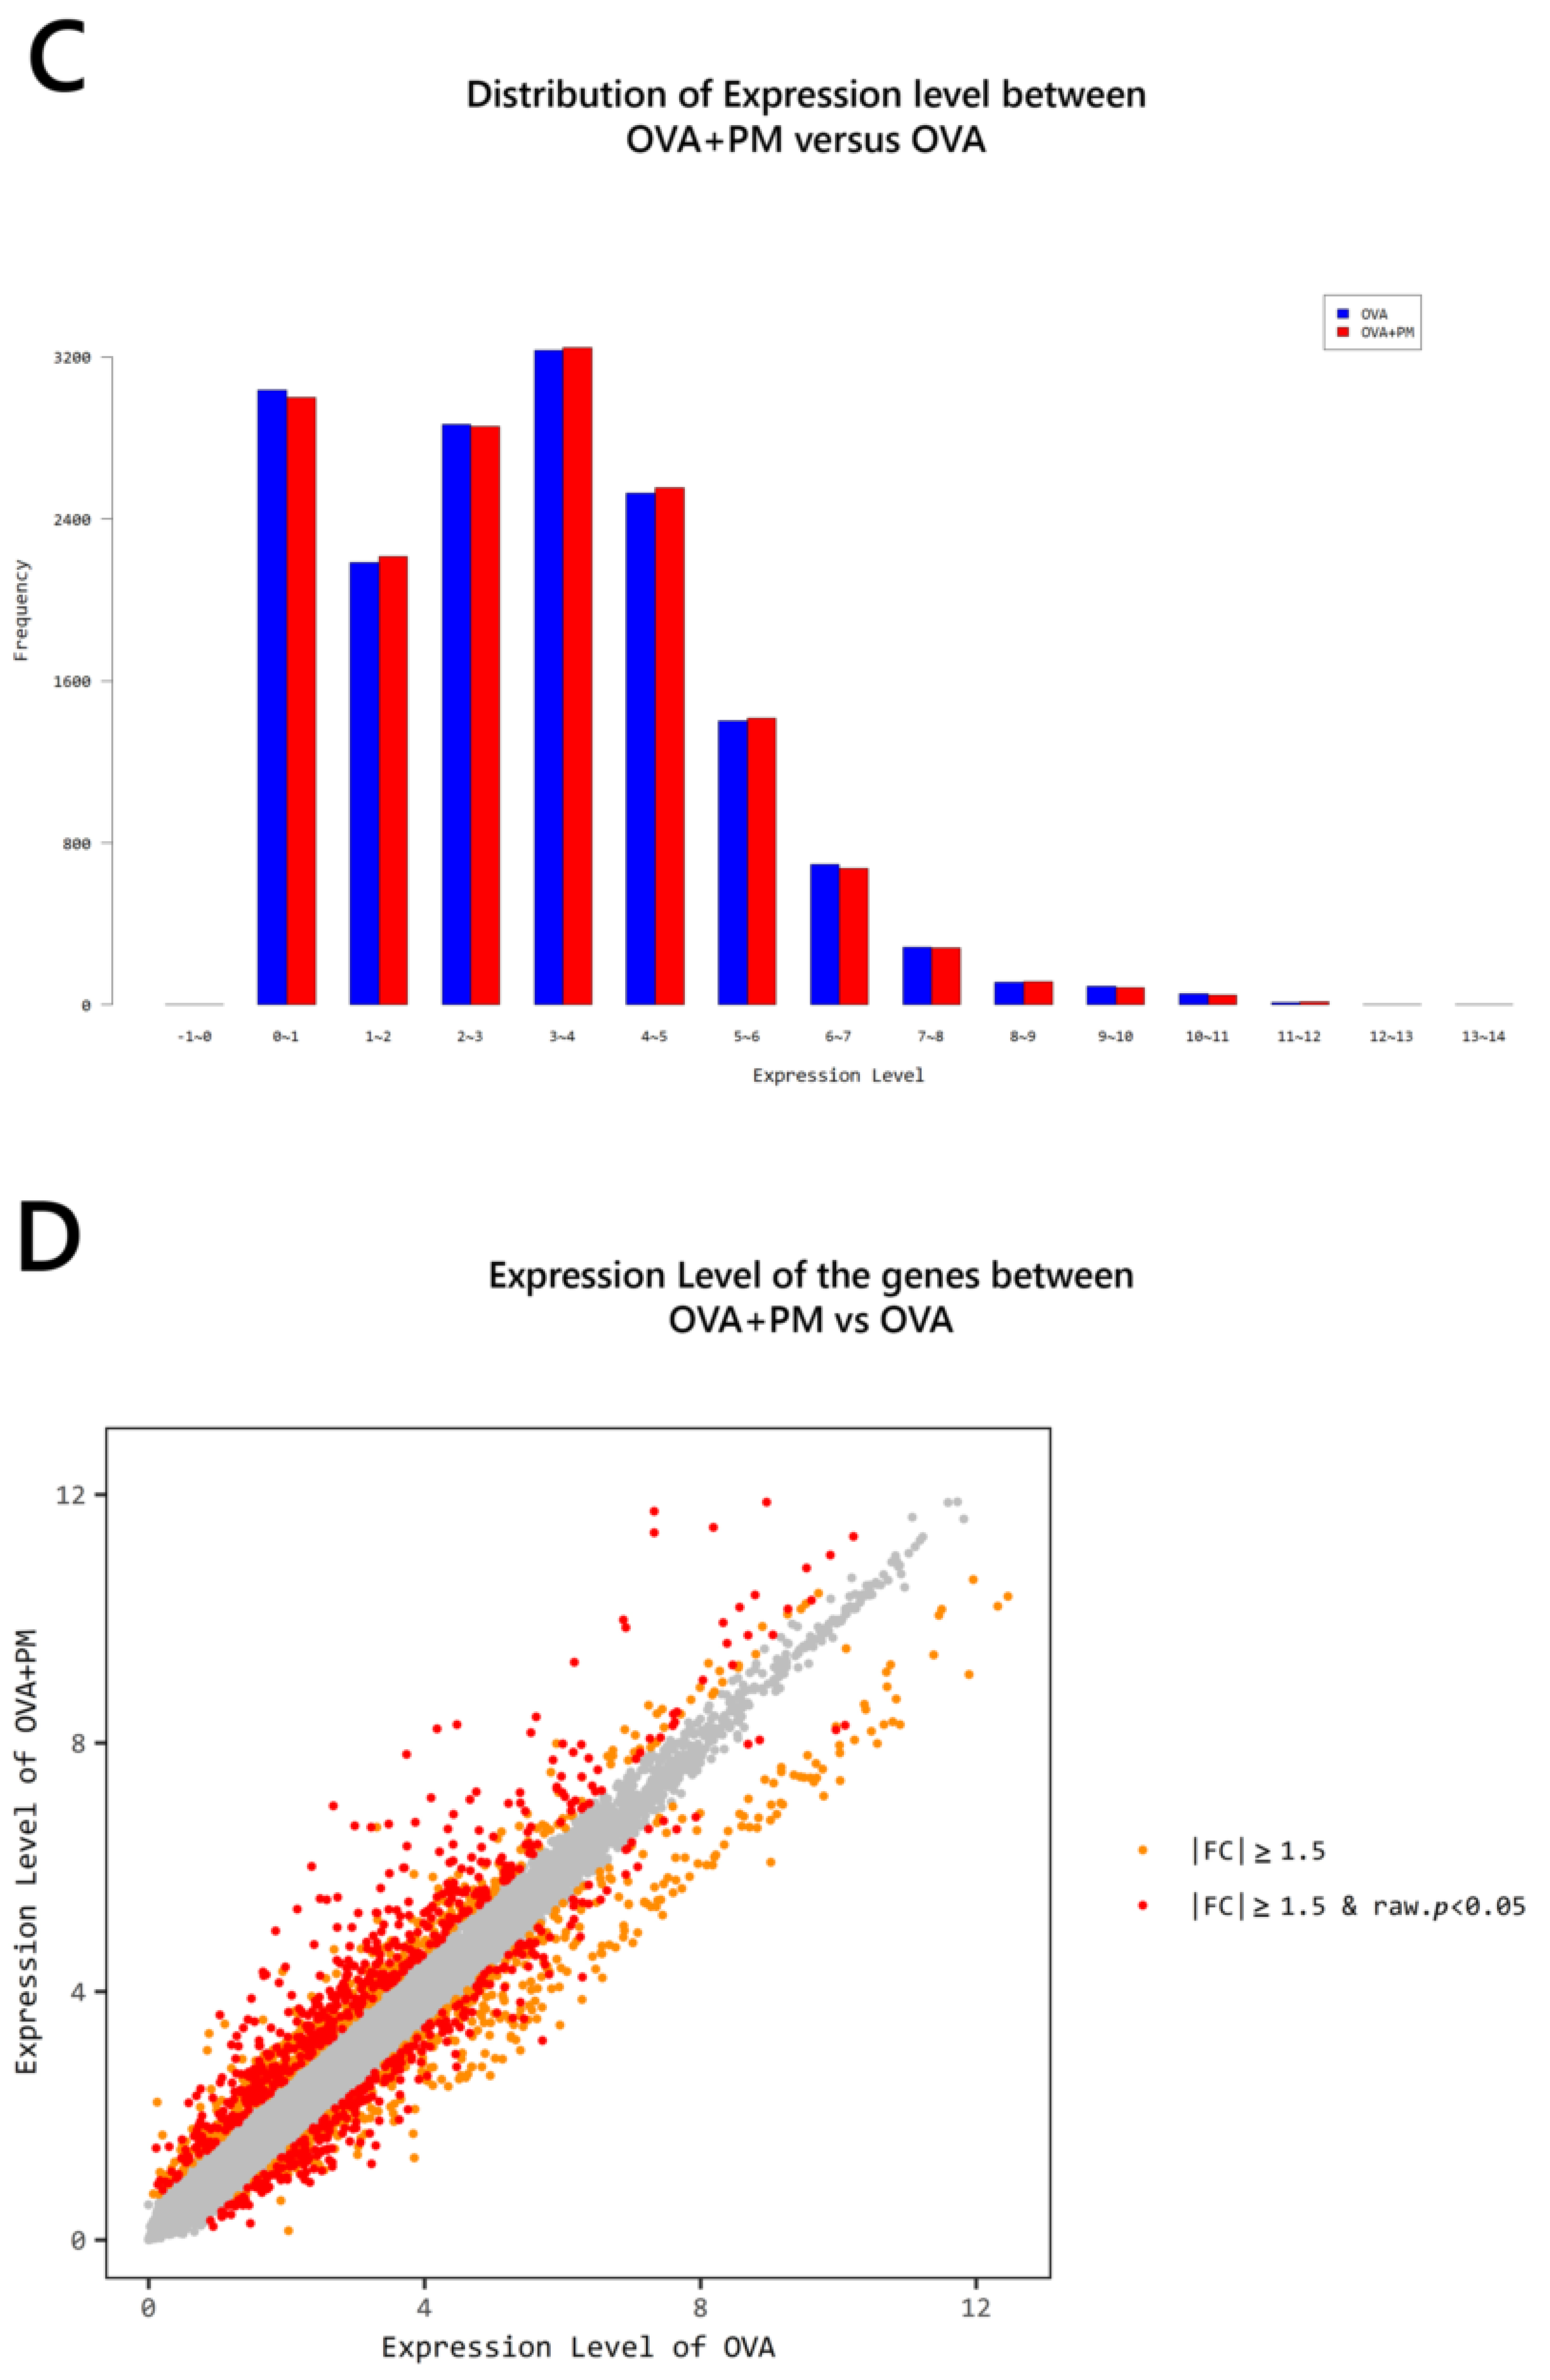
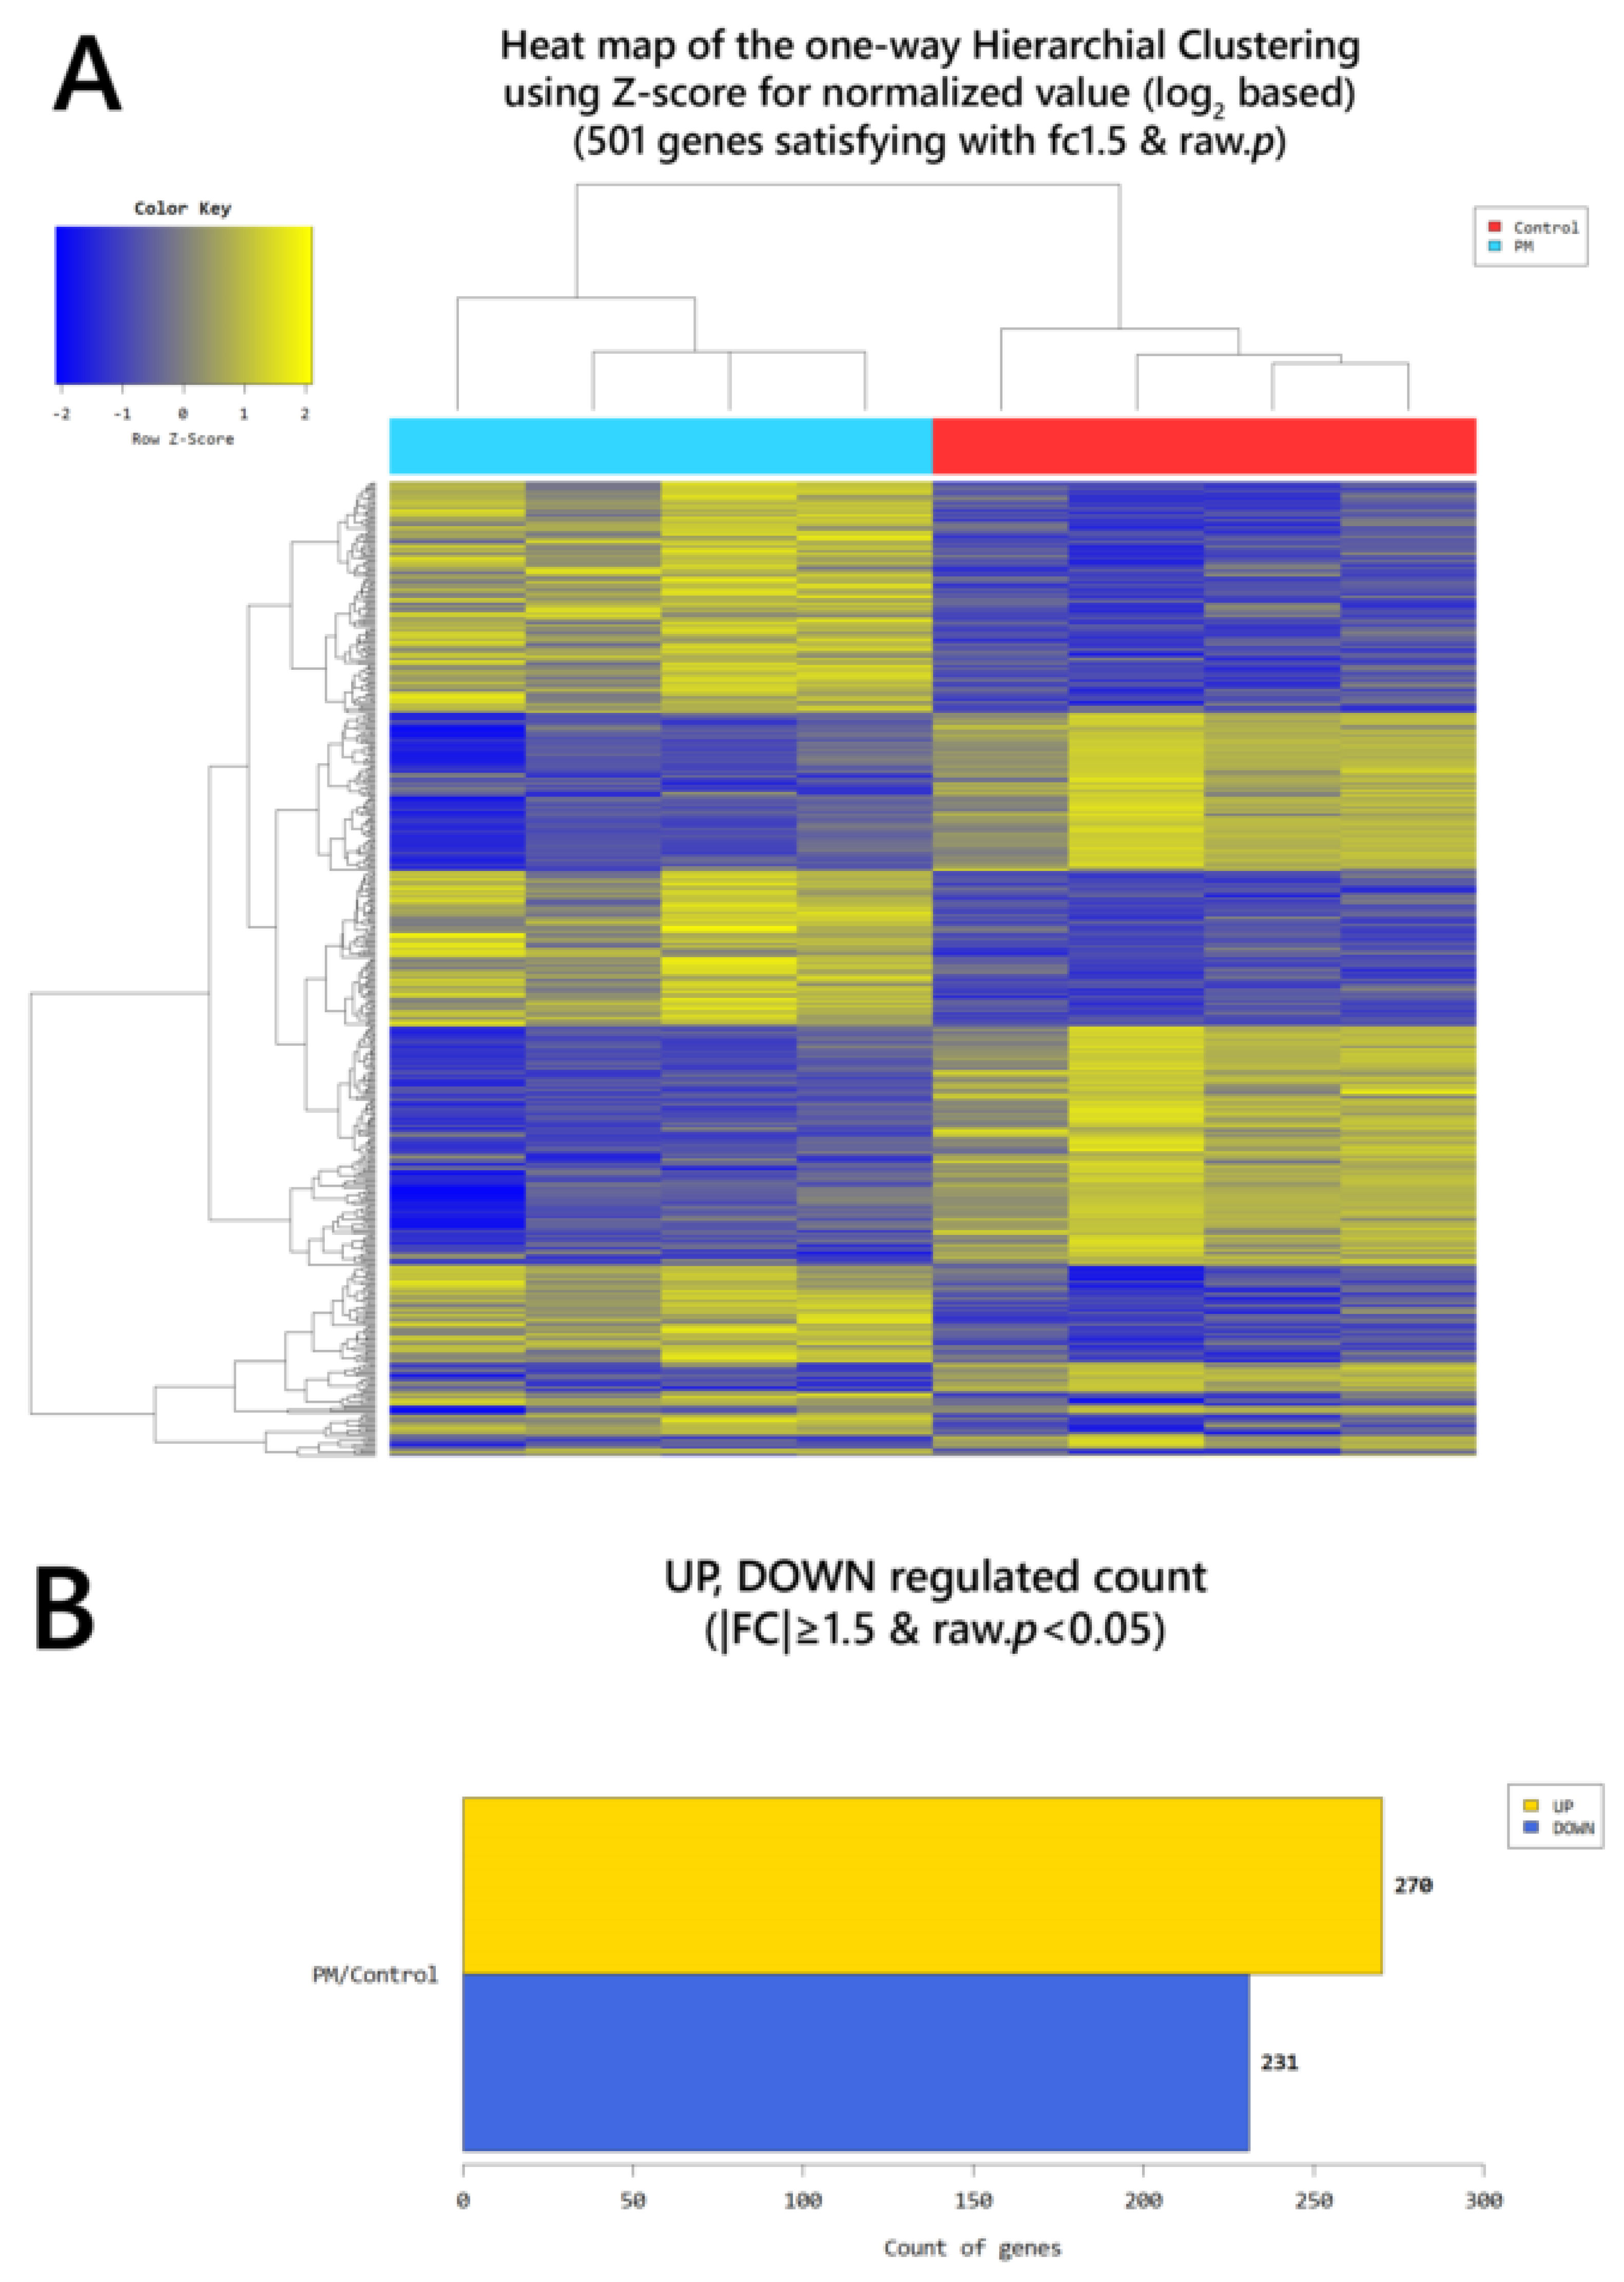
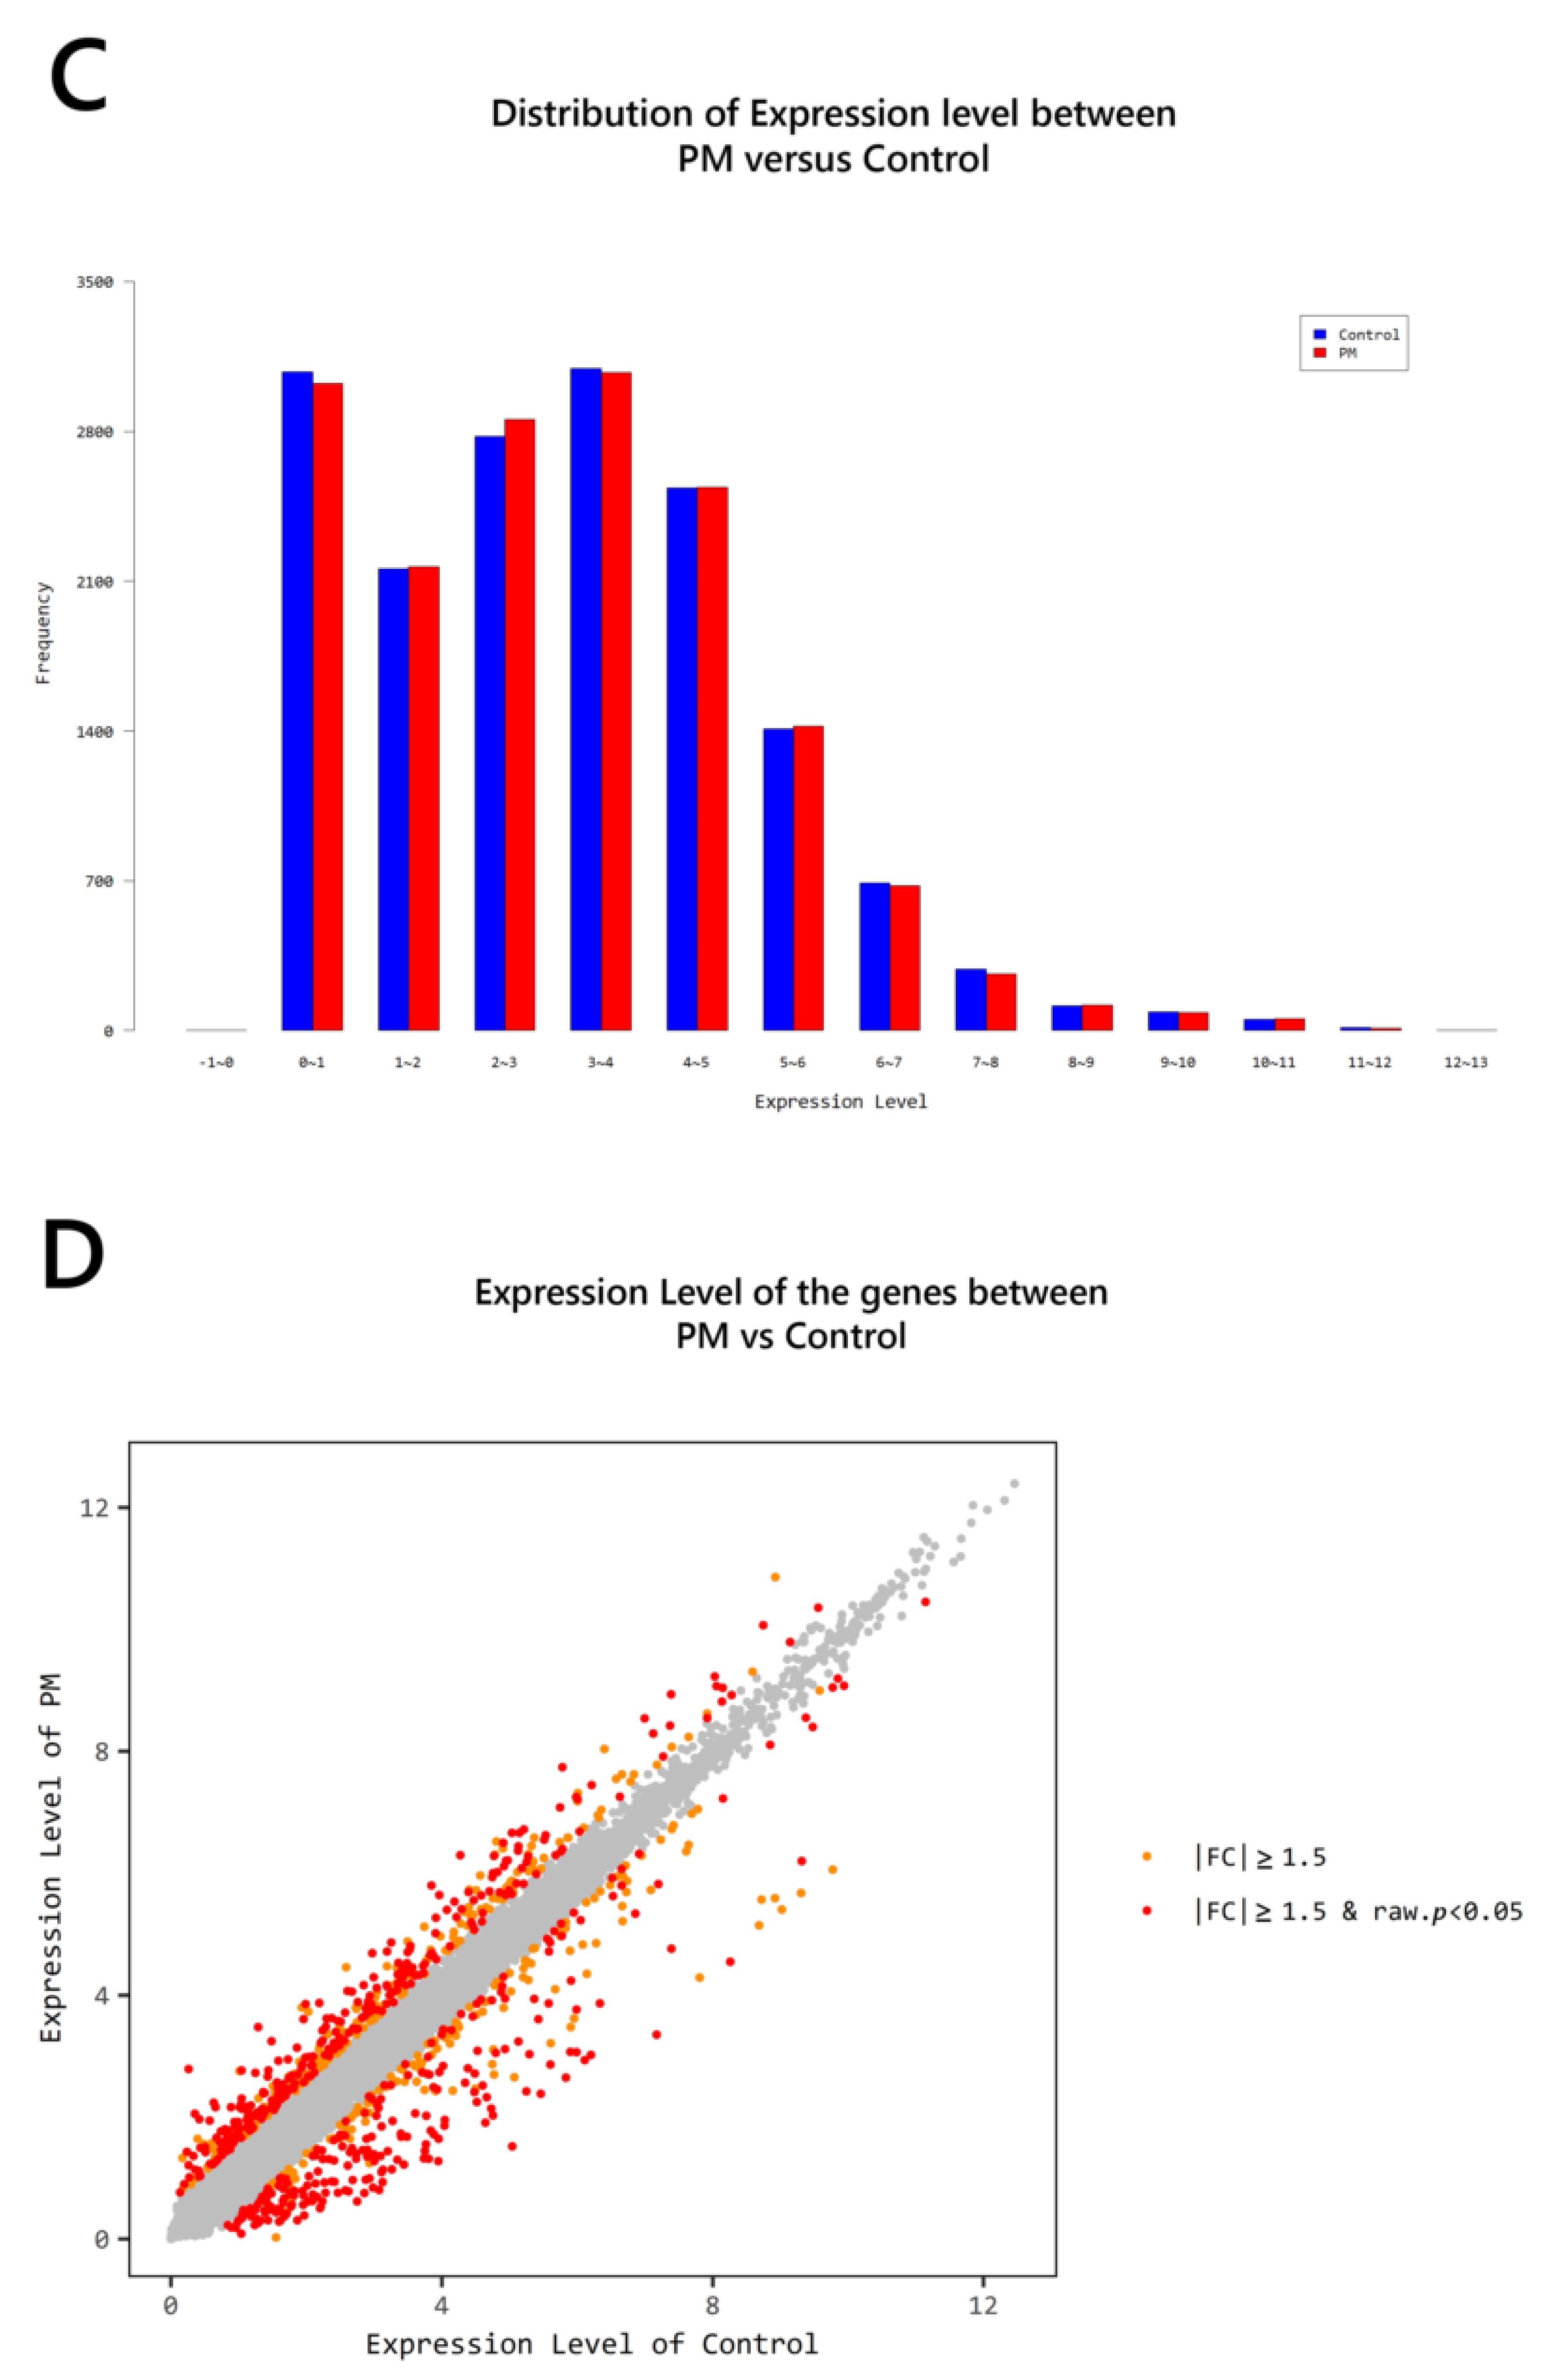
2.4. Gene Transcription Profile

According to RNA-Seq analysis, a total of 635 genes were found to be differentially expressed by OVA exposure (greater than 1.5-log2 folds up and down and a raw p-value < 0.05). Among the 635 genes, 451 genes were upregulated, and 184 downregulated. In the PM exposed group, a total of 501 genes were differentially expressed (270 upregulated and 231 downregulated). With OVA + PM10 application, the differentially expressed gene (DEG) count was 2149 (1387 upregulated and 762 downregulated). Between the OVA + PM and the OVA group, the number of DEGs was 818 (539 upregulated and 279 genes downregulated). In comparing OVA + PM10 application to PM10 alone, a total of 861 DEGs were found (591 upregulated and 270 downregulated). Between the PM and the OVA group, 71 genes were differentially expressed (54 genes upregulated and 17 downregulated) (Figure 3). The heat map and volcano plots comparing the OVA + PM group and the OVA group and the PM group vs. control are presented in Figure 4 and Figure 5, respectively.
The top 50 significantly up-regulated genes ranked according to the fold change are presented in Supplementary Table S1. Among them, SPRR2D, S100A9, STFA3, CHIL1, DBP, IL1b, SPRR2A1, LCE1H, SPRR2B, LCE1G (Group PM vs. control), RNASE2A, S100A9, SPRR2D, THRSP, SPRR2A1, S100A8, SERPINB3A, SPRR2B, C1QTNF3, CXCL1 (Group OVA vs. control), S100A9, SPRR2D, SPRR2B, S100A8, SPRR2A3, SERPINB3A, STFA3, SPRR2A1, SPRR2E, BC100530 (Group OVA + PM vs. control), S100A9, SPRR2B, SAA3, S100A8, SPRR2D, SPRR2A3, SERPINB3A, SPRR2E, GM5416, STFA3 (Group OVA + PM vs. Group OVA), S100A9, S100A8, SAA3, SPRR2B, SPRR2D, SPRR2A3, SERPINB3A, SPRR2E, GM5416, SPRR2A1 (Group OVA + PM vs. Group PM), NPY, FAM3B, GUCA2A, WFDC3, IL22RA2, UGT1A1, TESC, SERPINE2, CRABP1, PTGS1 (Group PM vs. Group OVA) were most significantly up-regulated (Table 1). The DEGs are also presented in Table 2 according to their function.
The major gene ontology (GO) terms and pathways of OVA + PM vs. OVA group are shown in Figure 6. As for the biological process, the top 10 terms of GO functional analysis were immune system process, immune response, regulation of immune system process, defense response, positive regulation of immune system process, response to external stimulus, response to other organism, response to external biotic stimulus, response to biotic stimulus, and inflammatory response (Figure 6A). The cellular component included cornified envelope and the NADPH (nicotinamide adenine dinucleotide phosphate oxidase) complex (Figure 6B), and the molecular function included cytokine binding, oxidoreductase activity acting on NADPH, pattern recognition receptor activity and peptidase regulator activity (Figure 6C). KEGG analysis showed that up-regulated DEGs for both OVA + PM vs. OVA group and PM vs. control group were enriched in metabolic pathways (mmu01100), Ras signaling pathway (mmu04014), Rap1 signaling pathway (mmu04015), MAPK signaling pathway (mmu04010), Jak-STAT signaling pathway (mmu04630), NF-kappa B signaling pathway (mmu04064), TNF signaling pathway (mmu04668), HIF-1 signaling pathway (mmu04066), calcium signaling pathway (mmu04020), cytokine-cytokine receptor interaction (mmu04060), toll-like receptor signaling pathway (mmu04620), nodulation (NOD)-like receptor signaling pathway (mmu04621), c-type lectin receptor signaling pathway (mmu04625), Th17 cell differentiation (mmu04659), IL-17 signaling pathway (mmu04657), inflammatory mediator regulation of TRP channels (mmu04750), and pathways in cancer (mmu05200).
The NOD-like receptor signaling pathway is shown in Figure 7. Among the relevant genes, cutaneous PM10 exposure induced up-regulation of NOD2 (log2 FC: 1.505669), NFKBIA (log2 FC: 1.856415), CARD9 (log2 FC: 1.655884), IL1B (log2 FC: 3.375845), IL18 (log2 FC: 1.545413), CXCL1 (log2 FC: 2.034245), CCL5 (log2 FC: 1.608780), DEFB14 (log2 FC: 2.276974), and BIRC3 (log2 FC: 1.60949) (p-value < 0.05).
The cytokine-cytokine receptor interaction pathway of OVA + PM group showed up-regulation of IL1B (log2 FC: 7.414423), CCL8 (log2 FC: 3.054375), CCL20 (log2 FC: 3.529423), CCR1 (log2 FC: 3.623166), CCR2 (log2 FC: 2.525612), CCR9 (log2 FC: 1.530475), CXCR2 (log2 FC: 3.934086), CSFLR (log2 FC: 2.709420), Il10RA (log2 FC: 2.133591), Il1F5 (log2 FC: 2.587269), Il1F6 (log2 FC: 3.870511), Il1F8 (log2 FC: 2.818568), Il1F9 (log2 FC: 4.090919), PF4 (log2 FC: 3.212812), Il33 (log2 FC: 3.116752), Il18RAP (log2 FC: 1.976295), Il12RB2 (log2 FC: 1.938648), Il13RA1 (log2 FC: 1.786709), LTB (log2 FC: 1.560564), TNFRSF1B (log2 FC: 1.784543), TNFRSF14 (log2 FC: 1.711990), IFNAR2 (log2 FC: 1.628548), CD4 (log2 FC: 1.621931), IL6RA (log2 FC: 1.616884) and the downregulation of BMP2 (log2 FC: −2.171518) and NGFR (log2 FC: −1.737021) compared to the OVA group (p-value < 0.05) (Figure 8).

3. Discussion

This study explored how exposure to PM10 modulates the development and exacerbation of AD using OVA-treated BALB/c mice. The endpoints of this study included: (1) the extent of clinical and histological skin inflammation including hallmarks of allergic inflammation; and (2) the expression of various genes involved in the skin barrier and immune response to gain insight into the PM modulation of AD.
Our OVA exposed mice successfully captured the characteristics of AD (i.e., increase in serum IgE, mast cell infiltration in the dermis, elevated gene expression of CHIL1 (related to Th2 response), FCER1A (Fc fragment of IgE receptor 1a), IL-33 (an epithelial cell-derived cytokine that promotes Th2 cytokine responses), and RNASE2A (important for eosinophil recruitment and function)). Key AD genes, including the Th2 and Th22 cytokines (IL-4, IL-13, IL-22) are usually present at less than detection level on microarrays, requiring real-time PCR (RT-PCR) [21,22,23]. This was also the case with our samples—although absent from microarray, we were able to detect IL-13 in the OVA treated groups through real-time PCR (RT-PCR) (data not shown).
No single murine model fully captures all aspects of the AD profile. Ewald et al. [24] have recently compared the transcriptomic profiles of common AD-like murine models and identified that the OVA-challenged model has significant overlap with genes upregulated in human AD, but does not capture the downregulated signature of human AD. Accordingly, we tried to focus on the upregulated genes in our study. The DEGs of our OVA exposed mice and those of Ewald et al.’s [24] OVA-challenged model were highly similar, which confirmed the reliability of our AD mouse model.
PM10 displayed adjuvant-like effects, enhancing skin inflammation/barrier damage upon OVA challenge (i.e., enhanced skin severity scores, TEWL, epidermal thickness, and increased expression of skin barrier genes (epidermal differentiation complex: KRT1, 6b, 16; LCE3A, 3B, 3E, 3F; S100A8, A9; SPRR2A1, 2A3, 2B, 2D, 2E, 2I; protease: MMP3; SERPINB3A, 3B; STFA1, 3; BC100530; KLK8, 9, 13; antimicrobial response: DEFB14), and pro-inflammatory genes (IL-1B, TNF1IP2). The expression of allergy genes (IL-13RA1, IL-33, FCERIG, CHIL1) was also enhanced in the OVA + PM group when compared to the OVA group indicating the possible exacerbation of AD.
We were also intrigued to see if PM10 affects intact skin. In a prior study, Jin et al. [25] have detected PM inside hair follicles in both intact and barrier-disrupted skin. Additionally, repeated PM application was shown to induce epidermal thickening and dermal inflammation with neutrophil infiltration. Although we failed to detect PM in the appendageal structures/dermis of our skin sections, our findings were similar with that of Jin et al. [25], where enhanced skin severity scores, TEWL, epidermal thickness, and increased expression of skin barrier genes (epidermal differentiation complex: KRT1; LCE1F, 1G, 1H; LCE3E, 3F; S100A8, A9; SPRR2A1, 2A3, 2B, 2D, 2E, 2I; protease: SERPINB3A, 3B; STFA1, 3; BC100530; KLK8, 9, 13; antimicrobial response: DEFB14; other: 2610528A11RIK) and pro-inflammatory genes (IL-1B, CXCL1) were noted. The increase in mast cell number, heightened expression of an allergy-related gene (CHIL1), and detection of IL-13 through RT-PCR (data not shown) suggest that AD can perhaps develop following PM10 exposure alone.
The main cause of PM-inflicted skin damage has been identified as polycyclic aromatic hydrocarbons (PAHs), the main organic constituent of PM [15,26,27]. PAHs exert their biological effect via binding to the ligand-activated transcription factor aryl hydrocarbon receptor (AHR), which is widely expressed on skin cells [28]. AHR is a major sensor of environmental signals, but at the same time, AHR ligands are abundant in the skin from exogenous or endogenous sources [28].
The quality and duration of AHR activation by various ligands directs the level and spectrum of the genes which are induced, and are thus pivotal in the outcome, including a “toxic” outcome [29,30]. Three important groups of genes are targeted by AHR [29]. First, a battery of genes encoding detoxifying enzymes (xenobiotic metabolizing enzymes, XMEs), such as the cytochrome P450 (CYP) gene CYP1A1 (Phase I XME) and Phase II enzymes (NADPH dehydrogenase quinone 1, NQO1; glutathione S-transferases, GSTA2; uridine 5-diphospho-glucuronosyltransferases; UGT1A1, UGT1A6, UGT1A7) [31,32,33]; second, genes related to epidermal differentiation and skin barrier integrity; and finally, genes related to immunity.
The AHR battery genes are noteworthy in that we have found evidence of aberrant AHR activation with our model (OVA group, PM group, OVA + PM group) based on elevated gene expression levels of XMEs. Xenobiotic small chemicals have strong affinity to AHR and cause persistent activation of the receptor [28]. The pathogenic implication of AHR and its gene polymorphism in AD remain elusive but it has been suggested that most AHRs lack physiological ligands in the Th2-prone milieu in AD [31,34].
Transgenic mice expressing constitutively active form of AHR (AHR-CA) [35] (surmised to be equivalent to PAH-liganded AHR) have shown a gene profile with an increase in structural protein genes (KRT1, 6B, 16), protease genes (i.e., MMP), interleukins/chemokine genes (i.e., IL-1B, CXCL1, CCL8), Fc receptor genes (FCERIG), and antimicrobial peptide genes (i.e., DEFB) reproduced in our mouse models (PM group, OVA + PM group), which indicates the role of the PAH-liganded AHR in PM induced skin barrier dysfunction/immune deviation.
The ligation of AHR by xenobiotic small chemicals (i.e., PAH, dioxin) was reported to preferentially affect the differentiation and propagation of Th 17 cells [31,36,37], as seen in our PM exposed mouse models (enrichment of upregulated DEGs in the Th17 cell differentiation (mmu04659), and IL-17 signaling pathway (mmu04657)), which too suggests that the PAH-AHR axis underlies the allergic response to PM.
PAH itself has also been suggested to provoke inflammation as a primary irritant or allergen [35,38,39,40]. Other lines of evidence suggest that reactive oxygen species (ROS) generated by oxygenated PAHs enhance the allergic response [41,42]. PAHs have also been shown to stimulate an increase in the DNA-binding activity of NF-kB [43], which, in turn, induces cytokine gene expression provoking the allergic response. To note, the NF-kappa B signaling pathway (mmu04064) was found to be enriched with upregulated DEGs in our OVA + PM and PM group.
In summary, we demonstrate that PM exacerbates AD when exposure occurs during simultaneous allergen sensitization/elicitation. The enhancement of the allergic immune response by PM is characterized by increased mast cells in the dermis, elevated serum IgE level, upregulated expression of the skin barrier genes (epidermal differentiation complex; protease; antimicrobial response), pro-inflammatory genes, and allergy genes (microarray: IL-13RA1, IL-33, FCERIG, CHIL1; RT-PCR: IL-13; KEGG analysis: Th17 cell differentiation, IL-17 signaling pathway). PM-mediated toxicity may be the result of PAHs modulating immunity and the epidermal barrier via the AHR.
Since PM is also able to initiate AD in intact skin, further work is needed to investigate if PM enhances the antigen-presenting capabilities of dendritic cells, and if this translates to enhanced B and T cell adaptive responses, as well as the critical role of the AHR in these processes. Our identification of the molecular mechanisms through which PM mediates its toxicological effects and enhances immune-mediated inflammation and barrier damage sheds light on the sharp rise of AD in the past decades.
In conclusion, we provide evidence on the importance of public awareness in PM-associated skin inflammation. Vigilant attention and preventive measures should be paid to all individuals, especially to those with AD.

4. Materials and Methods

4.1. Particulate Matter

PM10 was collected in 2005 from an air intake filtration system of a major exhibition center in Prague, Czech Republic (NIST, SRM 2787). PM suspension was freshly prepared by resuspending PM particles in phosphate-buffered saline (PBS) at a concentration of 2.5 mg/mL, and vortexing for 30 min at maximum speed.

4.2. Animals

Four-week-old female BALB/c mice were procured from Orient Bio Inc., Sungnam, Korea. Animals were housed in specific pathogen-free (SPF) environment, exposed to a 12-h light/dark cycle, and were provided with autoclaved water and food ad libitum. The mice were randomly divided into 4 groups (control group, OVA group, PM group, OVA + PM group; n = 6). After a week of acclimatization, the back of the mice was shaved with an electric clipper (day 0) and was kept hair-free with hair removal cream (Veet) and tape strips (Nad’s body wax strip) twice weekly for the entire study period. The study protocol was approved by the Institutional Animal Care and Use Committees (IACUCs) of the College of Medicine, The Catholic University of Korea (2019-0207-03, 1 August 2019).

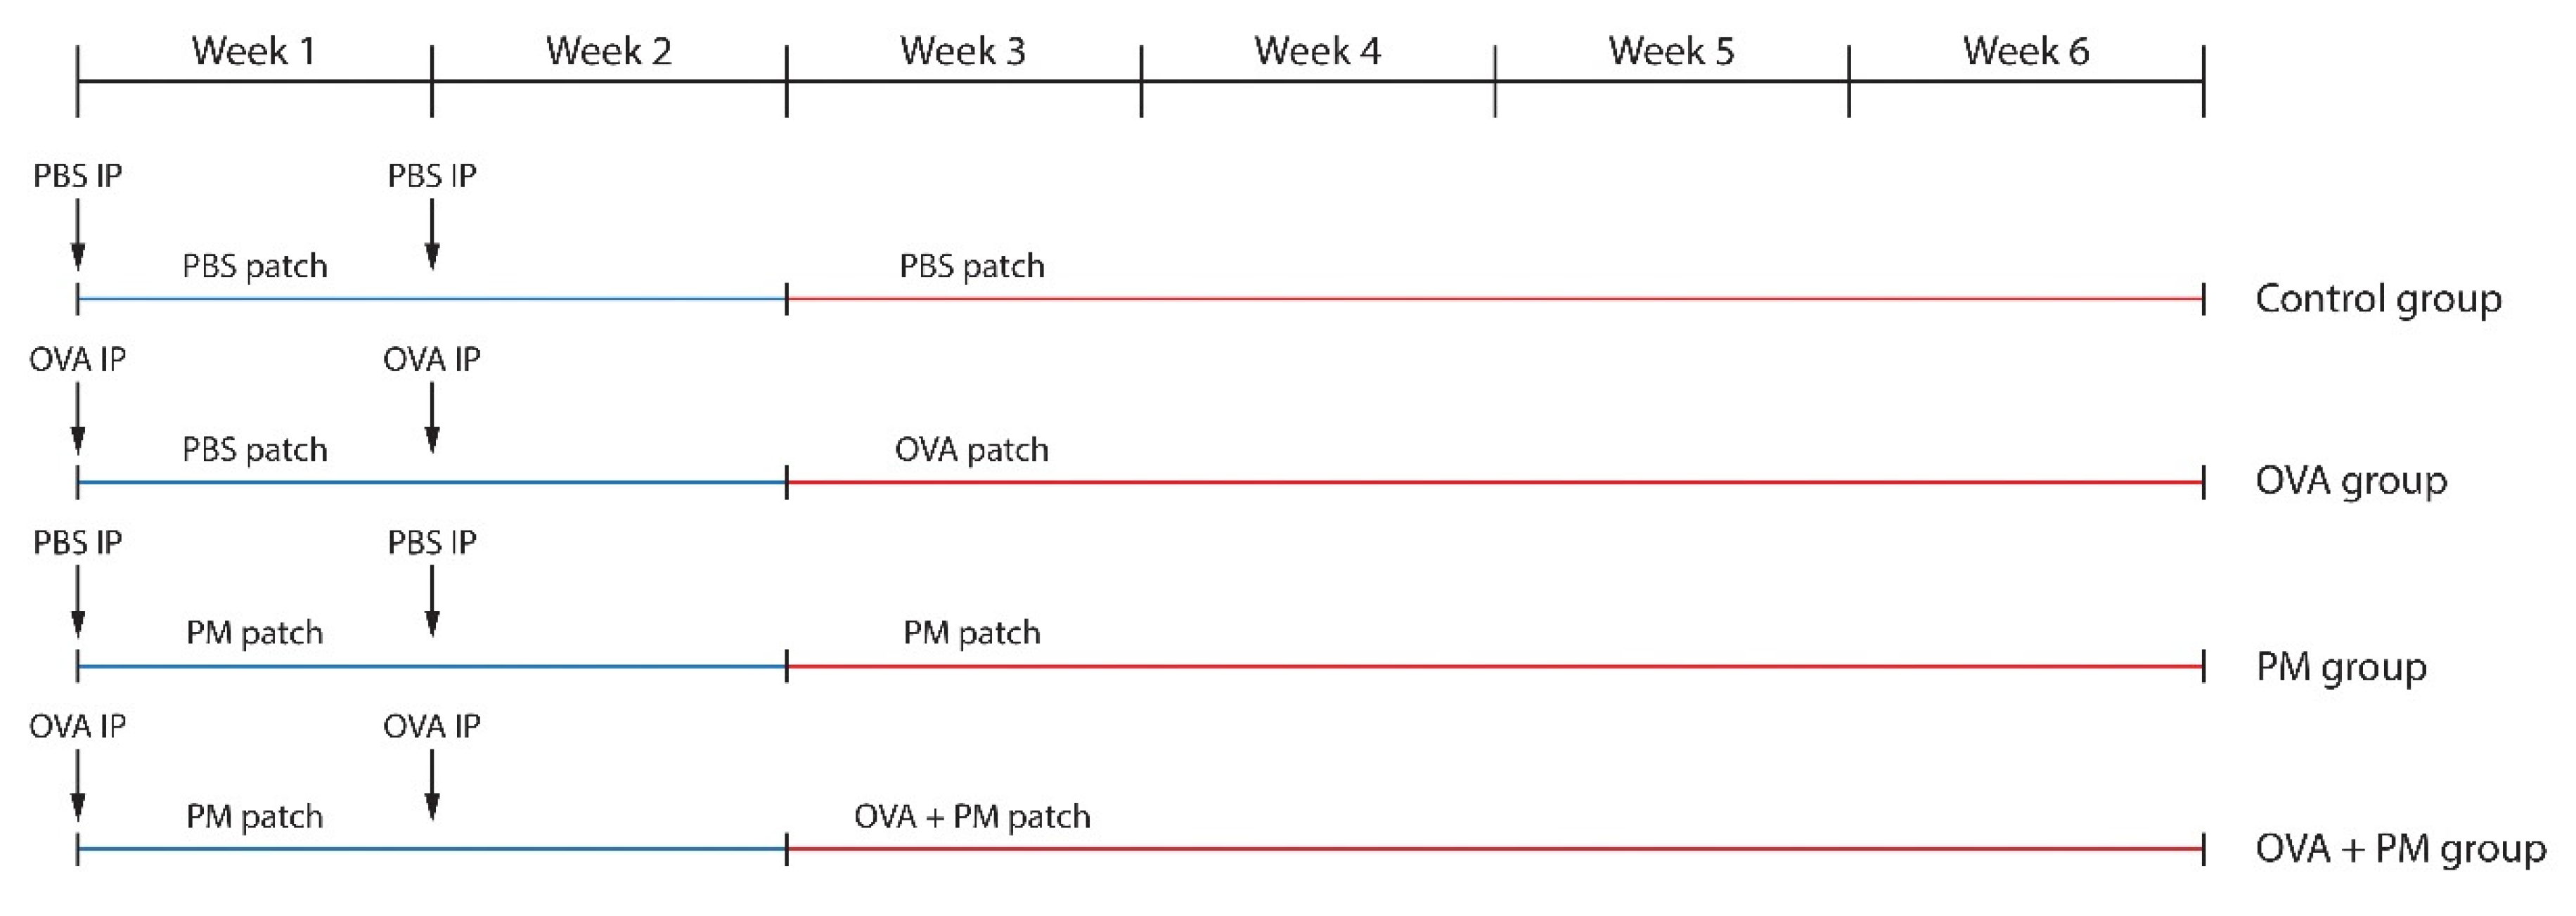
4.3. Sensitization and Challenge

The schematic experimental procedure is described in Figure 9. The mice in the OVA group and OVA + PM group were intraperitoneally (IP) injected with 20 μg chicken egg ovalbumin (OVA) (A5503-1G, Sigma-Aldrich, St. Louis, MO, USA) and 2 mg of aluminum hydroxide (769460-100G, Sigma-Aldrich, St. Louis, MO, USA) in 200 μL of PBS on days 0, and 7 using a modified protocol [44,45]. Those in the control group and the PM group were IP injected with an equal volume of PBS on the same date. From day 0, a PM patch (250 μg/cm2 of PM10 applied on a nonwoven 2 × 2 cm2 polyethylene sheet (Scotch BriteTM, 3M, St. Paul, MN, USA) and fixed with a transparent adhesive film dressing (TegadermTM, 3M, St. Paul, MN, USA) was applied daily to the backs of the PM group (until Week 6) and the OVA + PM group (until Week 2) mice. A PBS patch (400 μL of PBS applied on a 2 × 2 cm2 nonwoven polyethylene sheet and fixed with a transparent adhesive film dressing) was employed in the same manner in the control group (until Week 6) and the OVA group (until Week 2). Seven days after the final IP injection, mice in the OVA group and the OVA + PM group were challenged with OVA (400 μg of OVA dissolved in 400 μL of PBS applied on a 2 × 2 cm2 nonwoven polyethylene sheet and fixed with a transparent adhesive film dressing) and OVA + PM (400 μg of OVA + 250 μg/cm2 of PM10 in 400 μL of PBS applied on a nonwoven 2 × 2 cm2 polyethylene sheet and fixed with a transparent adhesive film dressing patches respectively, until the end of the study (Week 6).

4.4. Assessment of Clinical Parameters

Clinical assessments were made twice a week for the entire study period. The trans-epidermal water loss (TEWL) was assessed on the dorsal skin of the BALB/c mice using the VapoMeter (Delfin Technologies, Kuopio, Finland). A modified scoring atopic dermatitis (SCORAD) (defined as the sum of individual scores for each of the following 4 signs and symptoms: erythema, edema, excoriation, and dryness. Each item was scored as 0 (none), 1 (mild), 2 (moderate), and 3 (severe), as previously described) was used to measure the clinical severity. Scoring was performed by 2 assessors masked to the study purpose and hypothesis. They were not involved in treatment administration or assignment.

4.5. Histopathology

The mice were sacrificed in Week 6. The dorsal skin samples were fixed in 10% vol. phosphate-buffered formalin solution, embedded in paraffin, and sectioned at 4 μm. The tissue sections were stained with hematoxylin and eosin (H&E) for microscopic examination. For identification of mast cells, skin sections were stained with toluidine blue. The mast cells were counted in 5 randomly chosen visuals fields at ×0400 magnification. The evaluation was performed at a central laboratory, where slides were made available for a central reading by an assessor masked to the experiment.

4.6. Enzyme-Linked Immunosorbent Assay (ELISA)

Blood was collected from the retroorbital plexus using heparinized glass capillary tubes at the end of the experiment (Week 6). Serum samples obtained by centrifugation (3000× g for 4 min at 4 °C) were stored at −80 °C until use. Concentration of total IgE serum was determined using the mouse IgE ELISA kit (Shibayagi Co. Ltd., Gunma, Japan), according to the manufacturer’s instruction. Laboratory evaluations were performed at a central laboratory.

4.7. mRNA-Seq

Total RNA concentration was calculated by Quant-IT RiboGreen (R11490, Invitrogen, Carlsbad, CA, USA). To assess the integrity of the total RNA, samples were run on the TapeStation RNA screentape (#5067-5576, Agilent, Santa Clara, CA, USA). Only high-quality RNA preparations, with RIN greater than 7.0, were used for RNA library construction.
cDNA libraries were constructed with the TruSeq RNA library kit (RS-122-2101, Illumina Inc., San Diego, CA, USA) where 1 μg of RNA was used per sample. RNA was polyA-selected, fragmented, reverse transcribed and sequenced with Illumina HiSeq4000 (San Diego, CA, USA). Libraries were quantified with the qPCR-based KAPA Library Quantification Kit (KK4854) and qualified with an Agilent Technologies 2100 Bioanalyzer (Santa Clara, CA, USA).
The raw reads were preprocessed and then aligned to Mus musculus (mm10) with HISAT v2.2.0 (http://0-ccb-jhu-edu.brum.beds.ac.uk/software/hisat2/) [46]. HISAT employs two kinds of indexes and creates spliced alignments faster than BWA and Bowtie. Downloads of the reference genome sequence and annotation data are available from http://genome.uscs.edu. StringTie v1.3.4d (http://0-ccb-jhu-edu.brum.beds.ac.uk/software/stringtie/) [47,48] was used to build aligned reads into transcripts and calculate fragments per kilobase of exon per million fragments mapped (FPKM) values. Standardized FPKM values were utilized to compare gene’s expression levels. Sixteen samples (control, OVA, PM, OVA + PM groups; 4 samples per group) were examined in total.

4.8. Statistical Analysis

All data are expressed as the mean ± SD. One-way analysis variance (ANOVA,) followed by the Tukey multiple comparison test, was used to assess differences in the measurements between multiple groups. Statistical analyses were performed using Graph Pad Prism 4.0 (San Diego, CA, USA). A p-value of less than 0.05 was considered statistically significant.
Statistical analysis was carried out to find DEGs. Transcripts with zeroed FPKM values were eliminated. Filtered data were log2-transformed and quantile normalized. Statistical significance of the DEG data was verified with independent t-test and fold change with a null (no difference) hypothesis. The false discovery rate (FDR) was corrected with the Benjamini-Hochberg algorithm. Hierarchical clustering analysis was performed employing Euclidean distance and complete linkage. Gene-enrichment and functional annotation analysis and pathway analysis for significant gene list were carried out according to gProfiler (http://biit.cs.ut.ee/gprofiler/orth) and KEGG pathway (http://www.genome.jp/kegg/pathway.html).

Supplementary Materials

Author Contributions

Conceptualization, H.S.K., S.K., Y.R.W.; methodology, S.-Y.P., K.C.; investigation, S.-Y.P.; data curation, E.S.H., Y.R.W.; writing-original draft preparation, Y.R.W., S.-Y.P.; writing—review and editing, H.S.K.; Supervision, H.S.K., S.K., Y.R.W.; Project administration, S.-Y.P., E.S.H.; funding acquisition H.S.K. All authors have read and agreed to the published version of the manuscript.

Funding

Hei Sung Kim is supported by a National Research Foundation of Korea (NRF) grant funded by the South Korean Government (grant number: 2020R1F1A1048238).

Acknowledgments

We acknowledge Jung Woo Suh for technical support.

Conflicts of Interest

The authors declare no conflict of interest.

Abbreviations

ADAtopic dermatitis
PMParticulate matter
OVAOvalbumin
TEWLTrans-epidermal water loss
PAHsPolyaromatic hydrocarbons
ROSReactive oxygen species
SCORADScoring atopic dermatitis
H&EHematoxylin and eosin
DEGDifferentially expressed genes
SPRRSmall proline rich proteins
STFAStefin A
CHILChitinase-like
DBPD site-binding protein
LCELate cornified envelope
RNASERibonuclease
THRSPThyroid hormone responsive
SERPINSerine proteinase inhibitor
C1QTNFC1q and tumor necrosis factor
CXCLC-X-C motif chemokine ligand
SAASerum amyloid A
NPYNeuropeptide Y
FAM3BFamily with sequence similarity 3, member B
GUCAGuanylate cyclase activator
WFDCWAP four-disulfide core domain
UGTUDP glucuronosyltransferase
TESCTescalcin
CRABPCellular retinoic acid binding protein
GOGene ontology
NADPHNicotinamide adenine dinucleotide phosphate
KEGGKyoto encyclopedia of genes and genomes
RAPRas-related protein
MAPKMitogen-activated protein kinase
JAK-STATJanus kinases-signal transducer and activator of transcription
NF-kBNuclear factor-kappa B
TNFTumor necrosis factor
HIFHypoxia-inducible factor
NODNodulation
NFKBIANF-kappa-B inhibitor alpha
CARDCaspase activation and recruitment domains
CCLCC chemokine ligand
DEFBDefensin beta
BIRC3Baculovial IAP repeat containing 3
CCRC-C chemokine receptor
CXCRC-X-C chemokine receptor
CSF1RColony stimulation factor-1 receptor
PF4Platelet factor 4
LTBLymphotoxin-beta
TNFRSFTumor necrosis factor receptor superfamily
IFNAR2Interferon alpha and beta receptor subunit 2
BMPBone morphogenetic protein
NGFRNerve growth factor receptor
FCERFc fragment of IgE receptor
KRTKeratin
KLKKallikreins
AHRAryl hydrocarbon receptor
XMEXenobiotic metabolizing enzyme
CYPCytochrome P450
NQONADPH quinone oxidoreductase
GSTAGlutathione S-transferase
UGTUDP-glucuronosyltransferase
IPIntraperitoneal
PBSPhosphate-buffered saline

References

  1. Hendricks, A.J.; Eichenfield, L.F.; Shi, V.Y. The impact of airborne pollution on atopic dermatitis: A literature review. Br. J. Dermatol. 2020, 183, 16–23. [Google Scholar] [CrossRef] [PubMed]
  2. Greco, S.L.; MacIntyre, E.; Young, S.; Warden, H.; Drudge, C.; Kim, J.; Candido, E.; Demers, P.; Copes, R. An approach to estimating the environmental burden of cancer from known and probable carcinogens: Application to Ontario, Canada. BMC Public Health 2020, 20, 1–3. [Google Scholar] [CrossRef]
  3. Mueller, W.; Loh, M.; Vardoulakis, S.; Johnston, H.J.; Steinle, S.; Precha, N.; Kliengchuay, W.; Tantrakarnapa, K.; Cherrie, J.W. Ambient particulate matter and biomass burning: An ecological time series study of respiratory and cardiovascular hospital visits in northern Thailand. Environ. Health 2020, 19, 1–12. [Google Scholar] [CrossRef] [PubMed]
  4. Moelling, K.; Broecker, F. Air Microbiome and Pollution: Composition and Potential Effects on Human Health, Including SARS Coronavirus Infection. J. Environ. Public Health 2020, 2020, 1646943. [Google Scholar] [CrossRef] [PubMed]
  5. Kim, K.E.; Cho, D.; Park, H.J. Air pollution and skin diseases: Adverse effects of airborne particulate matter on various skin diseases. Life Sci. 2016, 152, 126–134. [Google Scholar] [CrossRef]
  6. Park, S.Y.; Byun, E.J.; Lee, J.D.; Kim, S.; Kim, H.S. Air Pollution, Autophagy, and Skin Aging: Impact of Particulate Matter (PM(10)) on Human Dermal Fibroblasts. Int. J. Mol. Sci. 2018, 19, 2727. [Google Scholar] [CrossRef] [Green Version]
  7. Araviiskaia, E.; Berardesca, E.; Bieber, T.; Gontijo, G.; Sanchez Viera, M.; Marrot, L.; Chuberre, B.; Dreno, B. The impact of airborne pollution on skin. J. Eur. Acad. Dermatol. Venereol. 2019, 33, 1496–1505. [Google Scholar] [CrossRef]
  8. Ahn, K. The role of air pollutants in atopic dermatitis. J. Allergy Clin. Immunol. 2014, 134, 993–999. [Google Scholar] [CrossRef]
  9. Pénard-Morand, C.; Raherison, C.; Charpin, D.; Kopferschmitt, C.; Lavaud, F.; Caillaud, D.; Annesi-Maesano, I. Long-term exposure to close-proximity air pollution and asthma and allergies in urban children. Eur. Respir. J. 2010, 36, 33–40. [Google Scholar] [CrossRef] [Green Version]
  10. Lee, Y.L.; Su, H.J.; Sheu, H.M.; Yu, H.S.; Guo, Y.L. Traffic-related air pollution, climate, and prevalence of eczema in Taiwanese school children. J. Investig. Dermatol. 2008, 128, 2412–2420. [Google Scholar] [CrossRef]
  11. Oh, I.; Lee, J.; Ahn, K.; Kim, J.; Kim, Y.M.; Sun Sim, C.; Kim, Y. Association between particulate matter concentration and symptoms of atopic dermatitis in children living in an industrial urban area of South Korea. Environ. Res. 2018, 160, 462–468. [Google Scholar] [CrossRef] [PubMed]
  12. Tang, K.T.; Ku, K.C.; Chen, D.Y.; Lin, C.H.; Tsuang, B.J.; Chen, Y.H. Adult atopic dermatitis and exposure to air pollutants-a nationwide population-based study. Ann. Allergy Asthma Immunol. 2017, 118, 351–355. [Google Scholar] [CrossRef] [PubMed]
  13. Kim, Y.M.; Kim, J.; Han, Y.; Jeon, B.H.; Cheong, H.K.; Ahn, K. Short-term effects of weather and air pollution on atopic dermatitis symptoms in children: A panel study in Korea. PLoS ONE 2017, 12, e0175229. [Google Scholar] [CrossRef] [PubMed] [Green Version]
  14. Hassoun, Y.; James, C.; Bernstein, D.I. The Effects of Air Pollution on the Development of Atopic Disease. Clin. Rev. Allergy Immunol. 2019, 57, 403–414. [Google Scholar] [CrossRef]
  15. Hidaka, T.; Ogawa, E.; Kobayashi, E.H.; Suzuki, T.; Funayama, R.; Nagashima, T.; Fujimura, T.; Aiba, S.; Nakayama, K.; Okuyama, R.; et al. The aryl hydrocarbon receptor AhR links atopic dermatitis and air pollution via induction of the neurotrophic factor artemin. Nat. Immunol. 2017, 18, 64–73. [Google Scholar] [CrossRef]
  16. Guarnieri, M.; Balmes, J.R. Outdoor air pollution and asthma. Lancet 2014, 383, 1581–1592. [Google Scholar] [CrossRef] [Green Version]
  17. Schantz, M.M.; Cleveland, D.; Heckert, N.A.; Kucklick, J.R.; Leigh, S.D.; Long, S.E.; Lynch, J.M.; Murphy, K.E.; Olfaz, R.; Pintar, A.L.; et al. Development of two fine particulate matter standard reference materials (<4 μm and <10 μm) for the determination of organic and inorganic constituents. Anal. Bioanal. Chem. 2016, 408, 4257–4266. [Google Scholar] [CrossRef]
  18. Valacchi, G.; Sticozzi, C.; Pecorelli, A.; Cervellati, F.; Cervellati, C.; Maioli, E. Cutaneous responses to environmental stressors. Ann. N. Y. Acad. Sci. 2012, 1271, 75–81. [Google Scholar] [CrossRef]
  19. Magnani, N.D.; Muresan, X.M.; Belmonte, G.; Cervellati, F.; Sticozzi, C.; Pecorelli, A.; Miracco, C.; Marchini, T.; Evelson, P.; Valacchi, G. Skin Damage Mechanisms Related to Airborne Particulate Matter Exposure. Toxicol. Sci. 2016, 149, 227–236. [Google Scholar] [CrossRef] [Green Version]
  20. Bieber, T. Atopic dermatitis. N. Engl. J. Med. 2008, 358, 1483–1494. [Google Scholar] [CrossRef]
  21. Suárez-Fariñas, M.; Tintle, S.J.; Shemer, A.; Chiricozzi, A.; Nograles, K.; Cardinale, I.; Duan, S.; Bowcock, A.M.; Krueger, J.G.; Guttman-Yassky, E. Nonlesional atopic dermatitis skin is characterized by broad terminal differentiation defects and variable immune abnormalities. J. Allergy Clin. Immunol. 2011, 127, 954–964. [Google Scholar] [CrossRef] [PubMed] [Green Version]
  22. Gittler, J.K.; Shemer, A.; Suárez-Fariñas, M.; Fuentes-Duculan, J.; Gulewicz, K.J.; Wang, C.Q.; Mitsui, H.; Cardinale, I.; de Guzman Strong, C.; Krueger, J.G.; et al. Progressive activation of T(H)2/T(H)22 cytokines and selective epidermal proteins characterizes acute and chronic atopic dermatitis. J. Allergy Clin. Immunol. 2012, 130, 1344–1354. [Google Scholar] [CrossRef] [PubMed] [Green Version]
  23. Suárez-Fariñas, M.; Ungar, B.; Correa da Rosa, J.; Ewald, D.A.; Rozenblit, M.; Gonzalez, J.; Xu, H.; Zheng, X.; Peng, X.; Estrada, Y.D.; et al. RNA sequencing atopic dermatitis transcriptome profiling provides insights into novel disease mechanisms with potential therapeutic implications. J. Allergy Clin. Immunol. 2015, 135, 1218–1227. [Google Scholar] [CrossRef] [PubMed]
  24. Ewald, D.A.; Noda, S.; Oliva, M.; Litman, T.; Nakajima, S.; Li, X.; Xu, H.; Workman, C.T.; Scheipers, P.; Svitacheva, N.; et al. Major differences between human atopic dermatitis and murine models, as determined by using global transcriptomic profiling. J. Allergy Clin. Immunol. 2017, 139, 562–571. [Google Scholar] [CrossRef] [PubMed] [Green Version]
  25. Jin, S.P.; Li, Z.; Choi, E.K.; Lee, S.; Kim, Y.K.; Seo, E.Y.; Chung, J.H.; Cho, S. Urban particulate matter in air pollution penetrates into the barrier-disrupted skin and produces ROS-dependent cutaneous inflammatory response in vivo. J. Dermatol. Sci. 2018, 91, 175–183. [Google Scholar] [CrossRef]
  26. Li, R.; Ning, Z.; Majumdar, R.; Cui, J.; Takabe, W.; Jen, N.; Sioutas, C.; Hsiai, T. Ultrafine particles from diesel vehicle emissions at different driving cycles induce differential vascular pro-inflammatory responses: Implication of chemical components and NF-kappaB signaling. Part. Fibre Toxicol. 2010, 7, 6. [Google Scholar] [CrossRef] [Green Version]
  27. Totlandsdal, A.I.; Herseth, J.I.; Bølling, A.K.; Kubátová, A.; Braun, A.; Cochran, R.E.; Refsnes, M.; Ovrevik, J.; Låg, M. Differential effects of the particle core and organic extract of diesel exhaust particles. Toxicol. Lett. 2012, 208, 262–268. [Google Scholar] [CrossRef]
  28. Esser, C.; Rannug, A. The aryl hydrocarbon receptor in barrier organ physiology, immunology, and toxicology. Pharmacol. Rev. 2015, 67, 259–279. [Google Scholar] [CrossRef] [Green Version]
  29. Esser, C.; Bargen, I.; Weighardt, H.; Haarmann-Stemmann, T.; Krutmann, J. Functions of the aryl hydrocarbon receptor in the skin. Semin. Immunopathol. 2013, 35, 677–691. [Google Scholar] [CrossRef]
  30. Mitchell, K.A.; Elferink, C.J. Timing is everything: Consequences of transient and sustained AhR activity. BioChem. Pharmacol. 2009, 77, 947–956. [Google Scholar] [CrossRef] [Green Version]
  31. Furue, M.; Hashimoto-Hachiya, A.; Tsuji, G. Aryl Hydrocarbon Receptor in Atopic Dermatitis and Psoriasis. Int. J. Mol. Sci. 2019, 20, 5424. [Google Scholar] [CrossRef] [PubMed] [Green Version]
  32. Köhle, C.; Bock, K.W. Coordinate regulation of Phase I and II xenobiotic metabolisms by the Ah receptor and Nrf2. BioChem. Pharmacol. 2007, 73, 1853–1862. [Google Scholar] [CrossRef] [PubMed]
  33. Nebert, D.W.; Roe, A.L.; Dieter, M.Z.; Solis, W.A.; Yang, Y.; Dalton, T.P. Role of the aromatic hydrocarbon receptor and [Ah] gene battery in the oxidative stress response, cell cycle control, and apoptosis. BioChem. Pharmacol. 2000, 59, 65–85. [Google Scholar] [CrossRef]
  34. Yu, J.; Luo, Y.; Zhu, Z.; Zhou, Y.; Sun, L.; Gao, J.; Sun, J.; Wang, G.; Yao, X.; Li, W. A tryptophan metabolite of the skin microbiota attenuates inflammation in patients with atopic dermatitis through the aryl hydrocarbon receptor. J. Allergy Clin. Immunol. 2019, 143, 2108–2119. [Google Scholar] [CrossRef] [Green Version]
  35. Tauchi, M.; Hida, A.; Negishi, T.; Katsuoka, F.; Noda, S.; Mimura, J.; Hosoya, T.; Yanaka, A.; Aburatani, H.; Fujii-Kuriyama, Y.; et al. Constitutive expression of aryl hydrocarbon receptor in keratinocytes causes inflammatory skin lesions. Mol. Cell. Biol. 2005, 25, 9360–9368. [Google Scholar] [CrossRef] [Green Version]
  36. Stockinger, B.; Di Meglio, P.; Gialitakis, M.; Duarte, J.H. The aryl hydrocarbon receptor: Multitasking in the immune system. Annu. Rev. Immunol. 2014, 32, 403–432. [Google Scholar] [CrossRef]
  37. Schiering, C.; Vonk, A.; Das, S.; Stockinger, B.; Wincent, E. Cytochrome P4501-inhibiting chemicals amplify aryl hydrocarbon receptor activation and IL-22 production in T helper 17 cells. BioChem. Pharmacol. 2018, 151, 47–58. [Google Scholar] [CrossRef]
  38. Anderson, C.; Hehr, A.; Robbins, R.; Hasan, R.; Athar, M.; Mukhtar, H.; Elmets, C.A. Metabolic requirements for induction of contact hypersensitivity to immunotoxic polyaromatic hydrocarbons. J. Immunol. 1995, 155, 3530–3537. [Google Scholar]
  39. Davila, D.R.; Davis, D.P.; Campbell, K.; Cambier, J.C.; Zigmond, L.A.; Burchiel, S.W. Role of alterations in Ca(2+)-associated signaling pathways in the immunotoxicity of polycyclic aromatic hydrocarbons. J. Toxicol. Environ. Health 1995, 45, 101–126. [Google Scholar] [CrossRef]
  40. Yamamoto, O.; Tokura, Y. Photocontact dermatitis and chloracne: Two major occupational and environmental skin diseases induced by different actions of halogenated chemicals. J. Dermatol. Sci. 2003, 32, 85–94. [Google Scholar] [CrossRef]
  41. Bonvallot, V.; Baeza-Squiban, A.; Baulig, A.; Brulant, S.; Boland, S.; Muzeau, F.; Barouki, R.; Marano, F. Organic compounds from diesel exhaust particles elicit a proinflammatory response in human airway epithelial cells and induce cytochrome p450 1A1 expression. Am. J. Respir Cell Mol. Biol. 2001, 25, 515–521. [Google Scholar] [CrossRef] [PubMed] [Green Version]
  42. Kepley, C.L.; Lauer, F.T.; Oliver, J.M.; Burchiel, S.W. Environmental polycyclic aromatic hydrocarbons, benzo(a) pyrene (BaP) and BaP-quinones, enhance IgE-mediated histamine release and IL-4 production in human basophils. Clin. Immunol. 2003, 107, 10–19. [Google Scholar] [CrossRef] [Green Version]
  43. Pei, X.H.; Nakanishi, Y.; Inoue, H.; Takayama, K.; Bai, F.; Hara, N. Polycyclic aromatic hydrocarbons induce IL-8 expression through nuclear factor kappaB activation in A549 cell line. Cytokine 2002, 19, 236–241. [Google Scholar] [CrossRef] [PubMed]
  44. Matsuo, K.; Hatanaka, S.; Kimura, Y.; Hara, Y.; Nishiwaki, K.; Quan, Y.S.; Kamiyama, F.; Oiso, N.; Kawada, A.; Kabashima, K.; et al. A CCR4 antagonist ameliorates atopic dermatitis-like skin lesions induced by dibutyl phthalate and a hydrogel patch containing ovalbumin. BioMed. Pharmacother. 2019, 109, 1437–1444. [Google Scholar] [CrossRef] [PubMed]
  45. Kim, S.R.; Choi, H.S.; Seo, H.S.; Choi, Y.K.; Shin, Y.C.; Ko, S.G. Topical application of herbal mixture extract inhibits ovalbumin- or 2,4-dinitrochlorobenzene-induced atopic dermatitis. Evid. Based Complement. Altern. Med. 2012, 2012, 545497. [Google Scholar] [CrossRef]
  46. Kim, D.; Langmead, B.; Salzberg, S.L. HISAT: A fast spliced aligner with low memory requirements. Nat. Methods 2015, 12, 357–360. [Google Scholar] [CrossRef] [Green Version]
  47. Pertea, M.; Pertea, G.M.; Antonescu, C.M.; Chang, T.C.; Mendell, J.T.; Salzberg, S.L. StringTie enables improved reconstruction of a transcriptome from RNA-seq reads. Nat. Biotechnol. 2015, 33, 290–295. [Google Scholar] [CrossRef] [Green Version]
  48. Pertea, M.; Kim, D.; Pertea, G.M.; Leek, J.T.; Salzberg, S.L. Transcript-level expression analysis of RNA-seq experiments with HISAT, StringTie and Ballgown. Nat. Protoc. 2016, 11, 1650–1667. [Google Scholar] [CrossRef]
Figure 1. (A) Macroscopic findings of the dorsal skin of mice. (B) The modified scoring atopic dermatitis (SCORAD) index. (C) The trans-epidermal water loss (TEWL). * p < 0.05 compared to control, † p < 0.05 compared to OVA, § p < 0.05 compared to PM10.
Ijms 21 06079 g001
Figure 2. (A) (upper) Histologic effects of ovalbumin (OVA) and particulate matter (PM)10 on the back skin of mice (hematoxylin and eosin (H&E); ×100), (lower) mast cell infiltration following OVA and PM10 exposure (toluidine blue; ×400). (B) Epidermal thickness. (C) The number of mast cells in five randomly chosen high power fields at ×400 magnification. (D) Serum IgE. * p < 0.05 compared to control, † p < 0.05 compared to OVA, § p < 0.05 compared to PM10.
Ijms 21 06079 g002
Figure 3. An overview of the differentially expressed genes (DEGs).
Ijms 21 06079 g003
Figure 4. (A) Heat map of the one-way hierarchical clustering (OVA + PM vs. OVA). (B) Distribution of gene expression level between the OVA + PM and the OVA group. (C) Scatter plot of gene expression level. (D) Significant gene count by fold change and p-value. n = 4 in each group (OVA + PM, OVA). Only those genes exhibiting log2 fold change (FC) ≥ 1.5 and p < 0.05 were considered differentially expressed genes. For the DEG (differentially expressed gene) set, hierarchical clustering analysis was done using complete linkage and Euclidean distance as a measure of similarity.
Ijms 21 06079 g004aIjms 21 06079 g004b
Figure 5. (A) Heat map of the one-way hierarchical clustering (PM vs. control). (B) Distribution of gene expression level between the PM and the control group. (C) Scatter plot of gene expression level. (D) Significant gene count by fold change and p-value. n = 4 in each group (PM, control). Only those genes exhibiting log2 fold change (FC) ≥ 1.5 and p < 0.05 were considered differentially expressed genes.
Ijms 21 06079 g005aIjms 21 06079 g005b
Figure 6. The major gene ontology (GO) terms and pathways of OVA + PM vs. OVA group. (A) Biologic process, (B) Cellular component, (C) molecular function.
Ijms 21 06079 g006aIjms 21 06079 g006bIjms 21 06079 g006c
Figure 7. Nodulation (NOD)-like receptor signaling pathway (PM vs. control). The orange star signifies genes with a p < 0.05. +p: phosphorylation; +u: ubiquitination; −u: de-ubiquitination; - - ->: activation.
Ijms 21 06079 g007
Figure 8. The cytokine-cytokine receptor interaction pathway (OVA + PM vs. OVA). The orange star signifies genes with a p < 0.05; ?: unknown.
Ijms 21 06079 g008
Figure 9. Experimental protocol for assessing the effects of OVA (IP + cutaneous) and PM10 (cutaneous) exposure in BALB/c mice.
Ijms 21 06079 g009
Table 1. Top 10 significantly upregulated genes.
PM vs. ControlOVA vs. ControlOVA + PM vs. ControlOVA + PM vs. OVAOVA + PM vs. PMPM vs. OVA
1SPRR2DRNASE2AS100A9S100A9S100A9NPY
Log2FC4.53778115.353418175.10260621.03220643.2325102.912855
2S100A9S100A9SPRR2DSPRR2BS100A8FAM3B
Log2FC4.0502538.325451122.34828319.76566336.2471612.237210
3STFA3SPRR2DSPRR2BSAA3SAA3GUCA2A
Log2FC3.8848887.41472999.19035016.87109333.2265512.082410
4CHIL1THRSPS100A8S100A8SPRR2BWFDC3
Log2FC3.8524306.07440886.46672416.61518230.4955452.057602
5DBPSPRR2A1SPRR2A3SPRR2DSPRR2DIL22RA2
Log2FC3.6371455.42984868.74702616.50070826.9621381.771707
6IL1BS100A8SEPINB3ASPRR2A3SPRR2A3UGT1A1
Log2FC3.3758455.20407965.38500114.13927821.5543611.765702
7SPRR2A1SERPINB3ASTFA3SERPINB3ASERPINB3ATESC
Log2FC3.2933175.12747551.60062312.75189121.5429931.728145
8LCE1HSPRR2BSPRR2A1SPRR2ESPRR2ESERPINE2
Log2FC3.2727275.01831650.18121312.50673316.8094731.705879
9SPRR2BC1QTNF3SPRR2EGM5416GM5416CRABP1
Log2FC3.2526184.53672343.31558110.65102616.5454591.702428
102610528A11RIKCXCL1BC100530STFA3SPRR2A1PTGS1
Log2FC3.2021173.86505529.4948059.71793415.2372851.689424
Table 2. DEGs according to their function.
GenesPM vs. ControlOVA vs. ControlOVA + PM vs. ControlOVA + PM vs. OVAOVA + PM vs. PMPM vs. OVA
Xenobiotic Metabolizing Enzyme
CYP1A12.364800
UGT1A11.968411 1.765702
UGT1A7C 1.5631354.0202992.5719452.447144
Immune Response
IL1B3.3758452.14427915.8985897.4144234.709514
IL1F62.4590842.67732610.3626203.8705114.214016
IL1F81.6822341.9301275.4401922.8185683.220411
IL1F92.3091761.6471476.7383454.090919
IL-13ra1 2.3398571.7867091.753326
IL-13ra2 2.445235 1.997591
IL-33 1.6528105.1514003.1167523.571956
CXCL12.0342453.86505515.266021 7.504513
CCL2 2.4140833.966503
CCL7 3.1766866.8292952.1498173.330636
CCL8 3.2624959.9648813.0543757.572985
CCR1 1.9778927.1662303.6231665.588996
CXCR2 5.4091113.9340864.409069
TNFAIP2 2.9811762.2110342.536282
TNFAIP6 3.6659333.788700
FCER1A 3.0668045.700756 3.742706
FCER1G 1.8668974.5254662.4240573.528595
CHIL13.8524303.41308023.7994356.9730086.177772
RNASE2A 15.35341817.480094 5.250776−4.611952
Skin Barrier
Epidermal Differentiation Complex
KRT12.012479 5.0132963.0078992.4911105
KRT6b 9.7463597.67190010.906282
KRT16 14.0270598.5505969.550772
LCE1F2.8486011.8568822.793710
LCE1G3.2021172.6255083.709355
LCE1H3.2727272.6496903.867855
LCE3A 1.98587211.7516505.9176277.581050
LCE3B 12.0082176.3126069.559686
LCE3E1.877260 9.4651515.3141345.042002
LCE3F1.999833 11.0529844.9051795.526953
S100A82.3854765.20407986.46672416.61518236.247161
S100A94.0502538.325451175.10260621.03220643.232510
SPRR2A13.2933175.42984850.1812139.24173415.237285
SPRR2A33.189472 68.74702614.13927821.554361
SPRR2B3.2526185.01831699.19035019.76566330.495545
SPRR2D4.5377817.414729122.34828316.50070826.962138
SPRR2E2.5768553.46338143.31558112.50673316.809473
SPRR2I1.9244382.98178126.1659168.77526613.596652
FLG −1.749558 −2.481263
Protease
MMP3 2.03133010.9064415.3691146.745412
SERPINB3A3.0350945.12747565.38500112.75189121.542993
SERPINB3B2.4970892.76827817.0269906.1507516.818736
STFA12.008981 17.5134926.8559818.717599
STFA33.884888 51.6006239.71793413.282395
BC1005302.912126 29.4948057.55528310.128274
KLK6 3.837728
KLK82.4563661.9967906.2330083.121514
KLK92.7475181.8466169.7842435.298470
KLK132.2016002.25151813.5711496.0275556.164222
Antimicrobial Response
DEFB61.8525421.6834573.312694
DEFB142.278557 5.1541242.628721
Other
2610528A11RIK3.1282103.74896927.1199707.2339818.669484

