Structural and Functional Maturation of Rat Primary Motor Cortex Layer V Neurons

 , and
, and 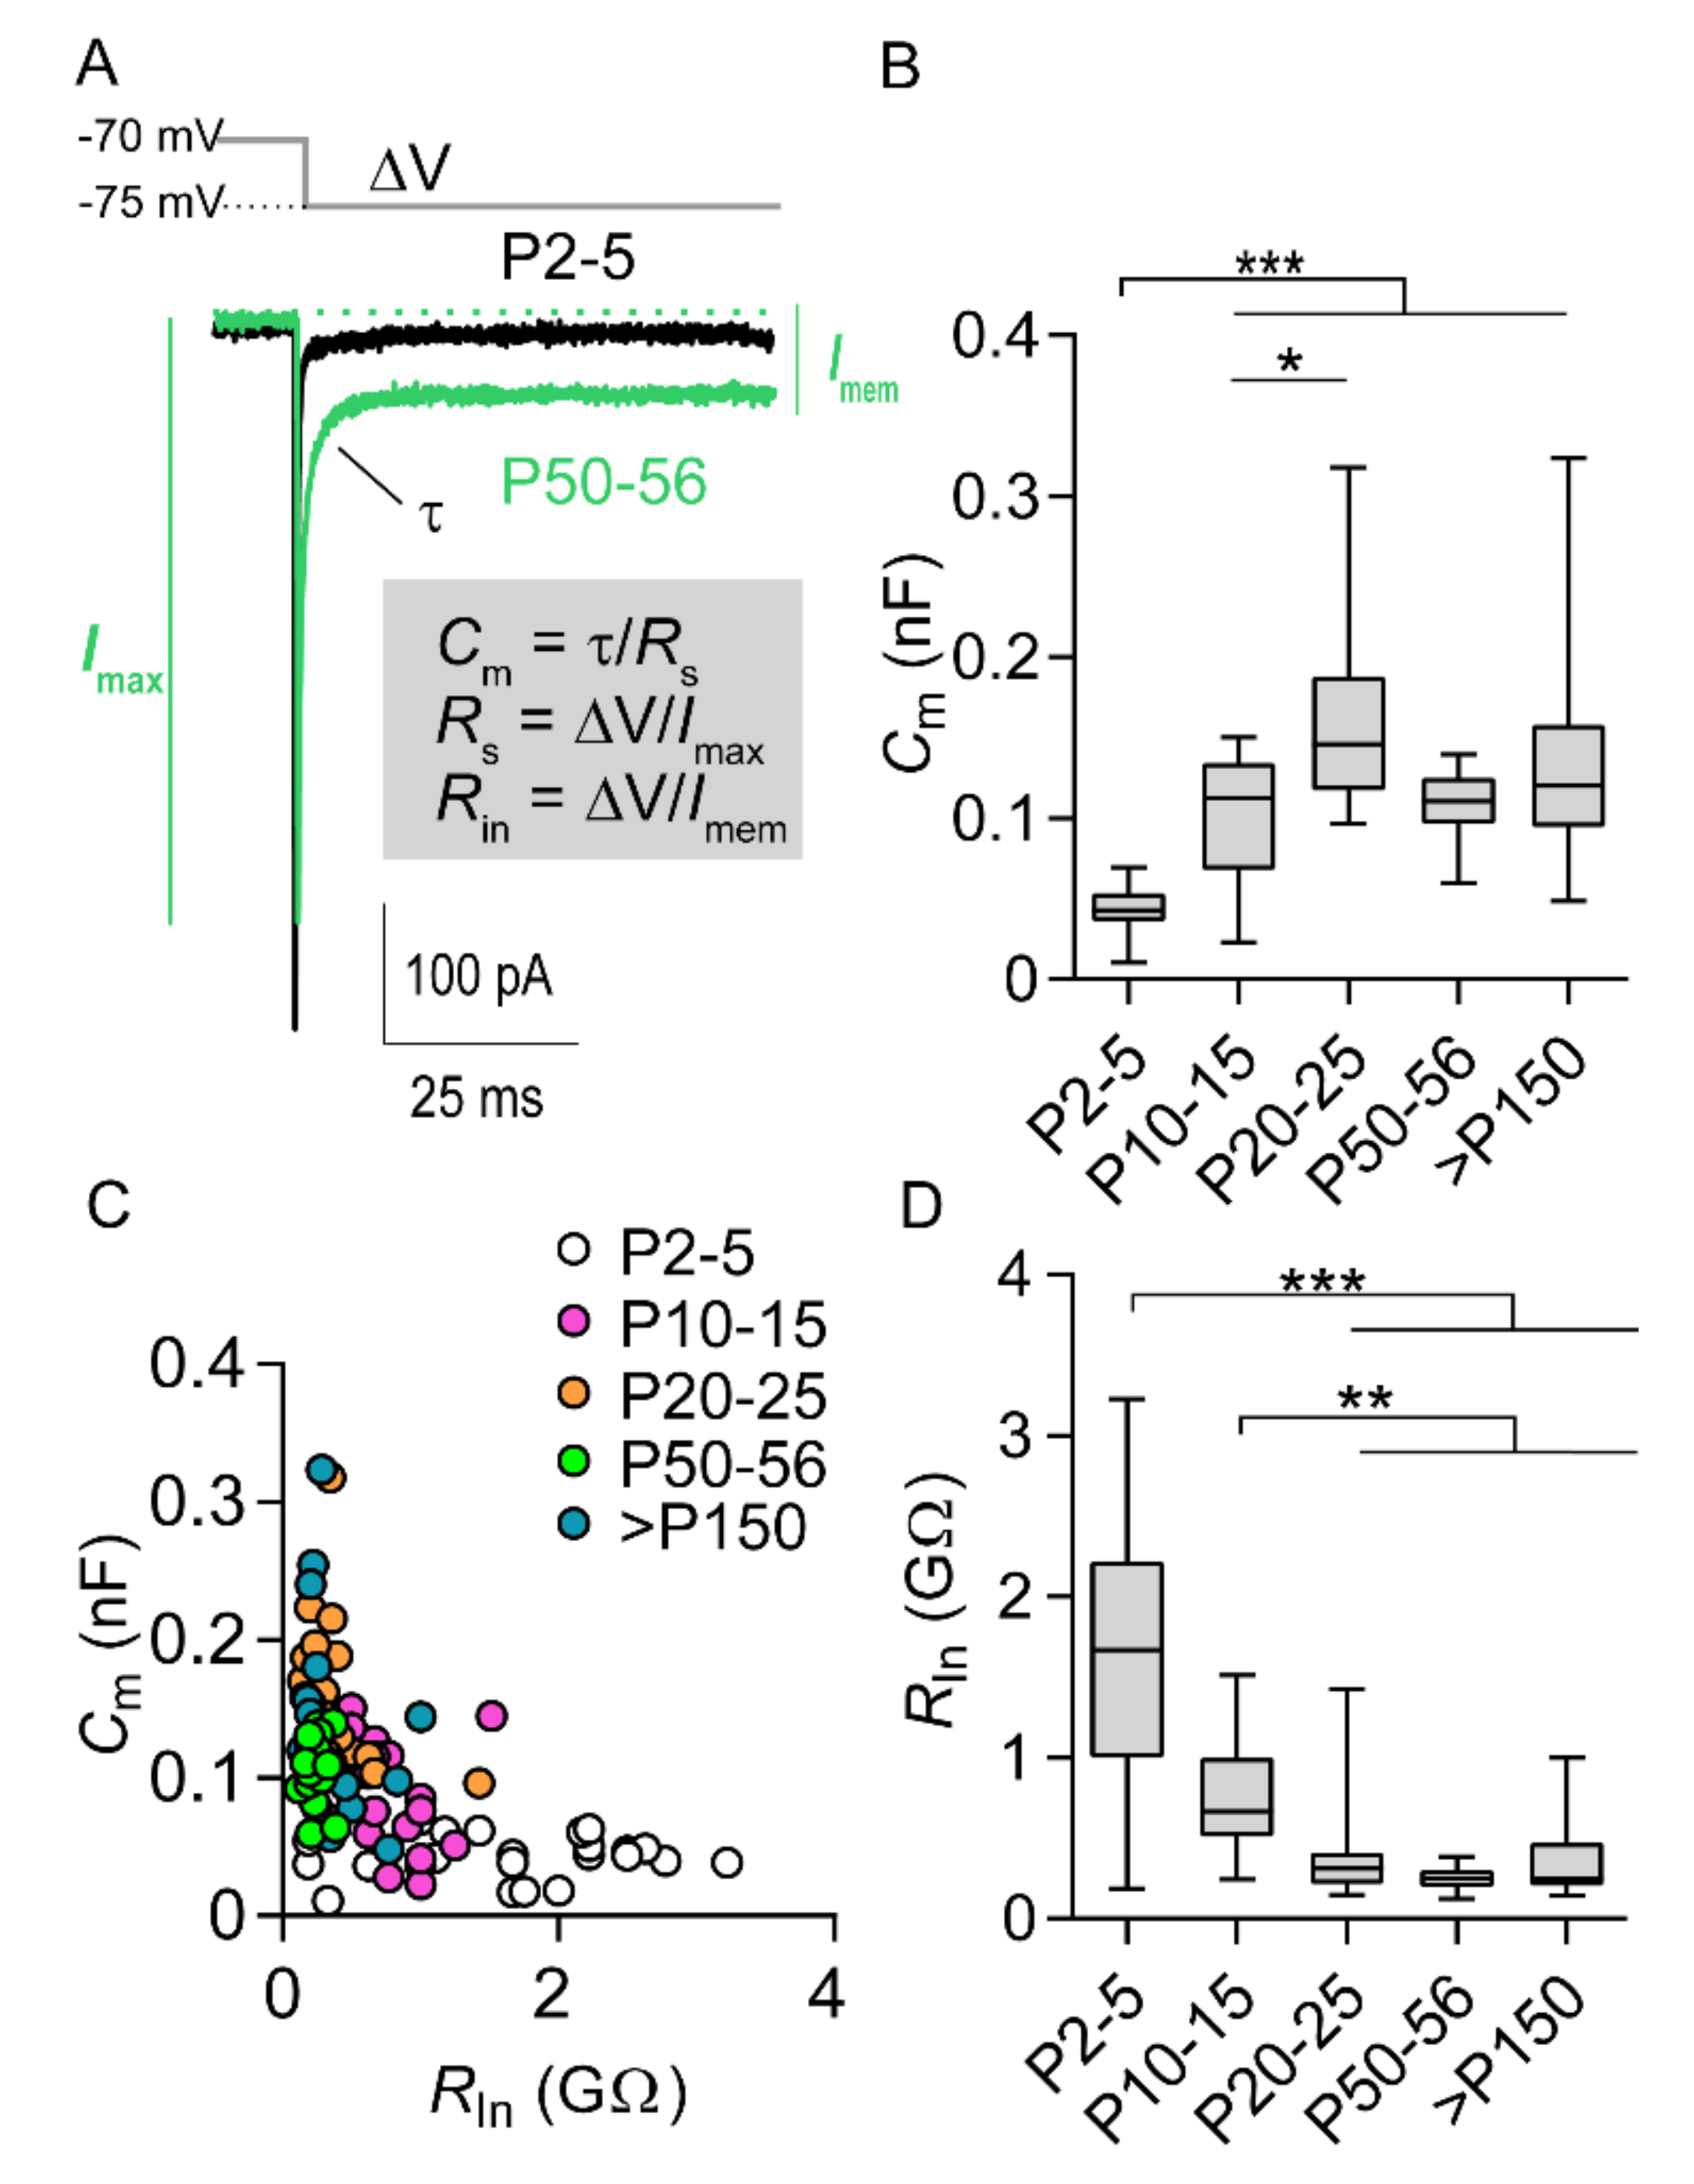
Abstract
:1. Introduction
2. Results
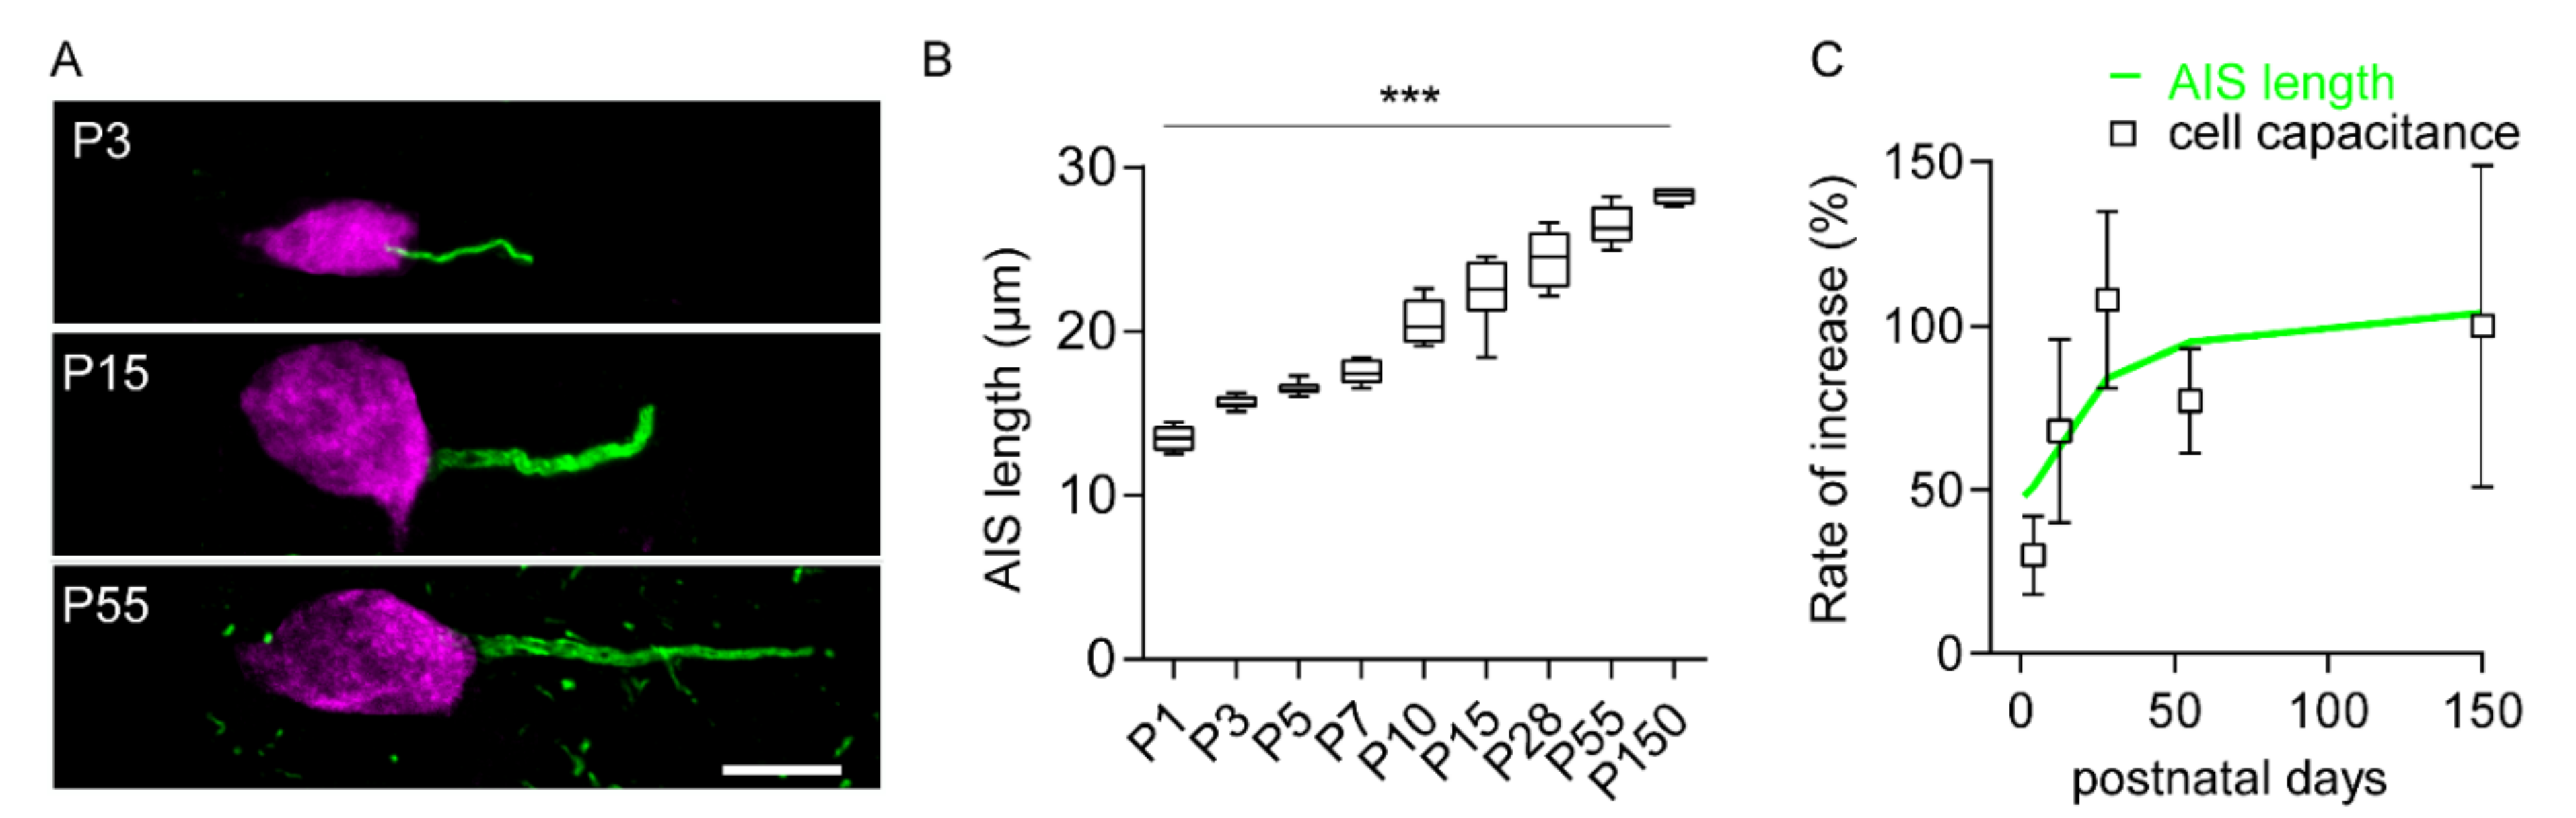
2.1. Increase in Cell Size and AIS Elongation Are Synchronized in the First Postnatal Weeks
2.2. Postnatal Development of Functional Output Mirrors Prominent AIS Elongation
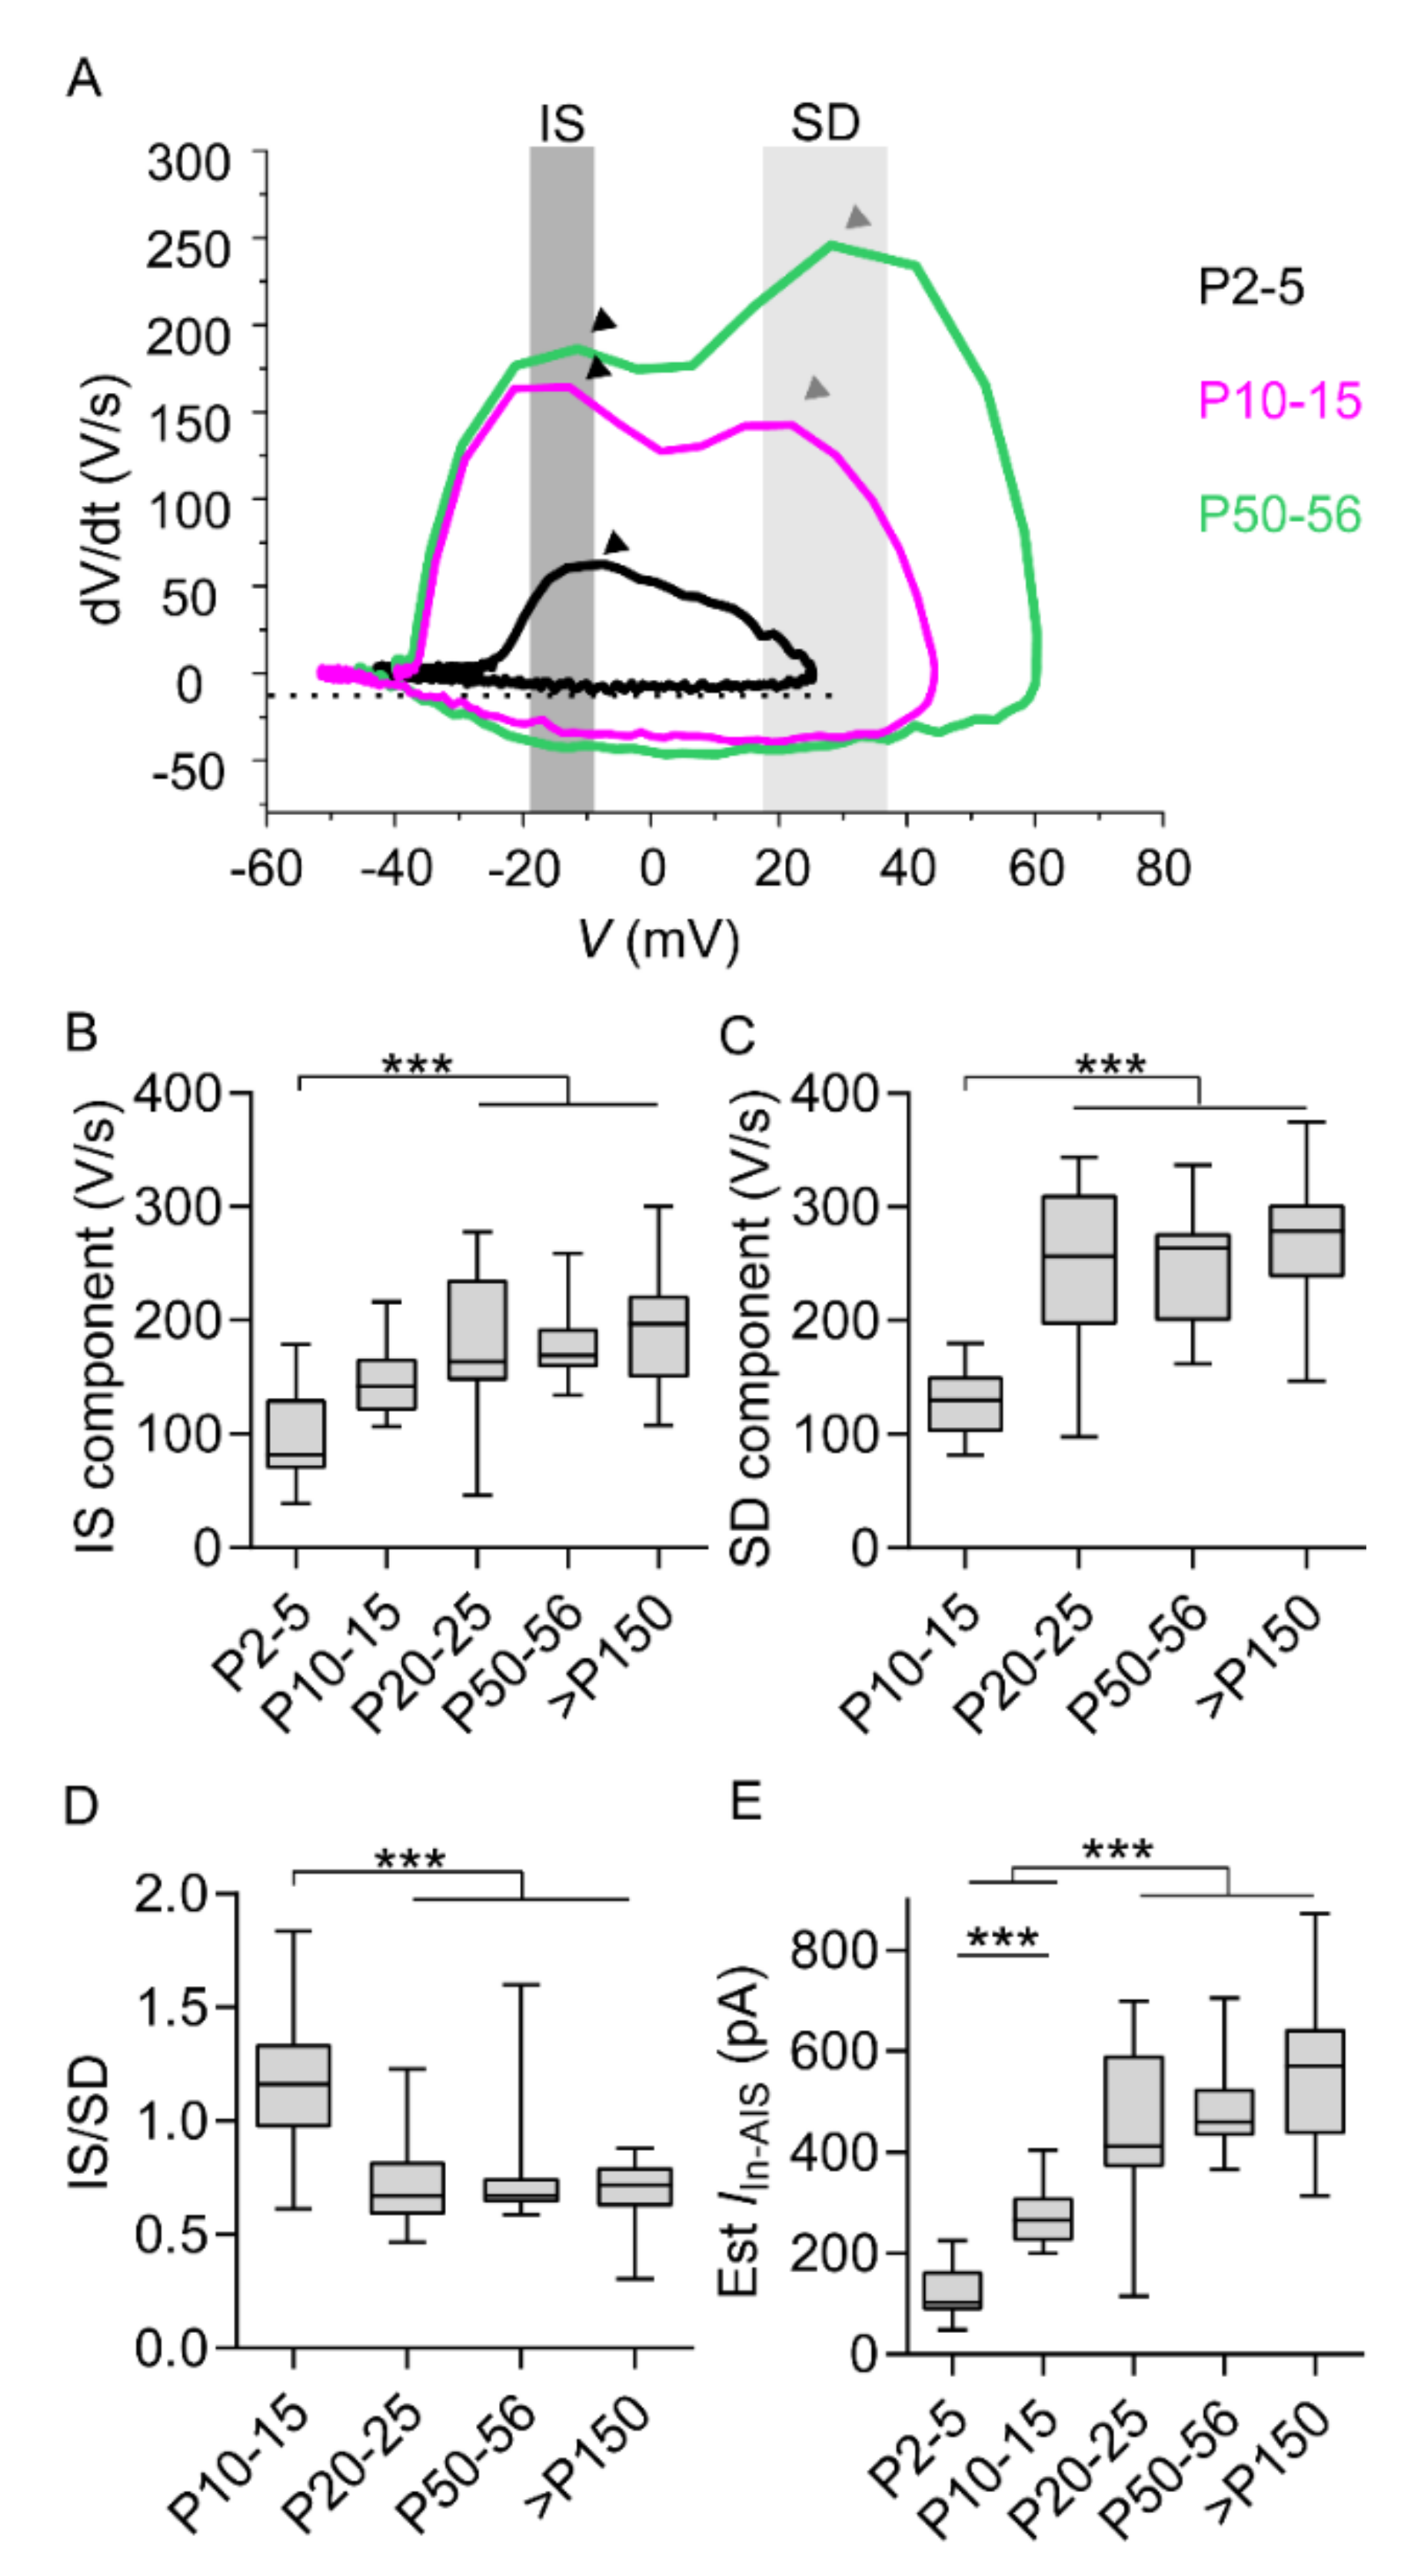
2.3. Initial Segment Component and Somatodendritic Component Mirror Prominent AIS Elongation
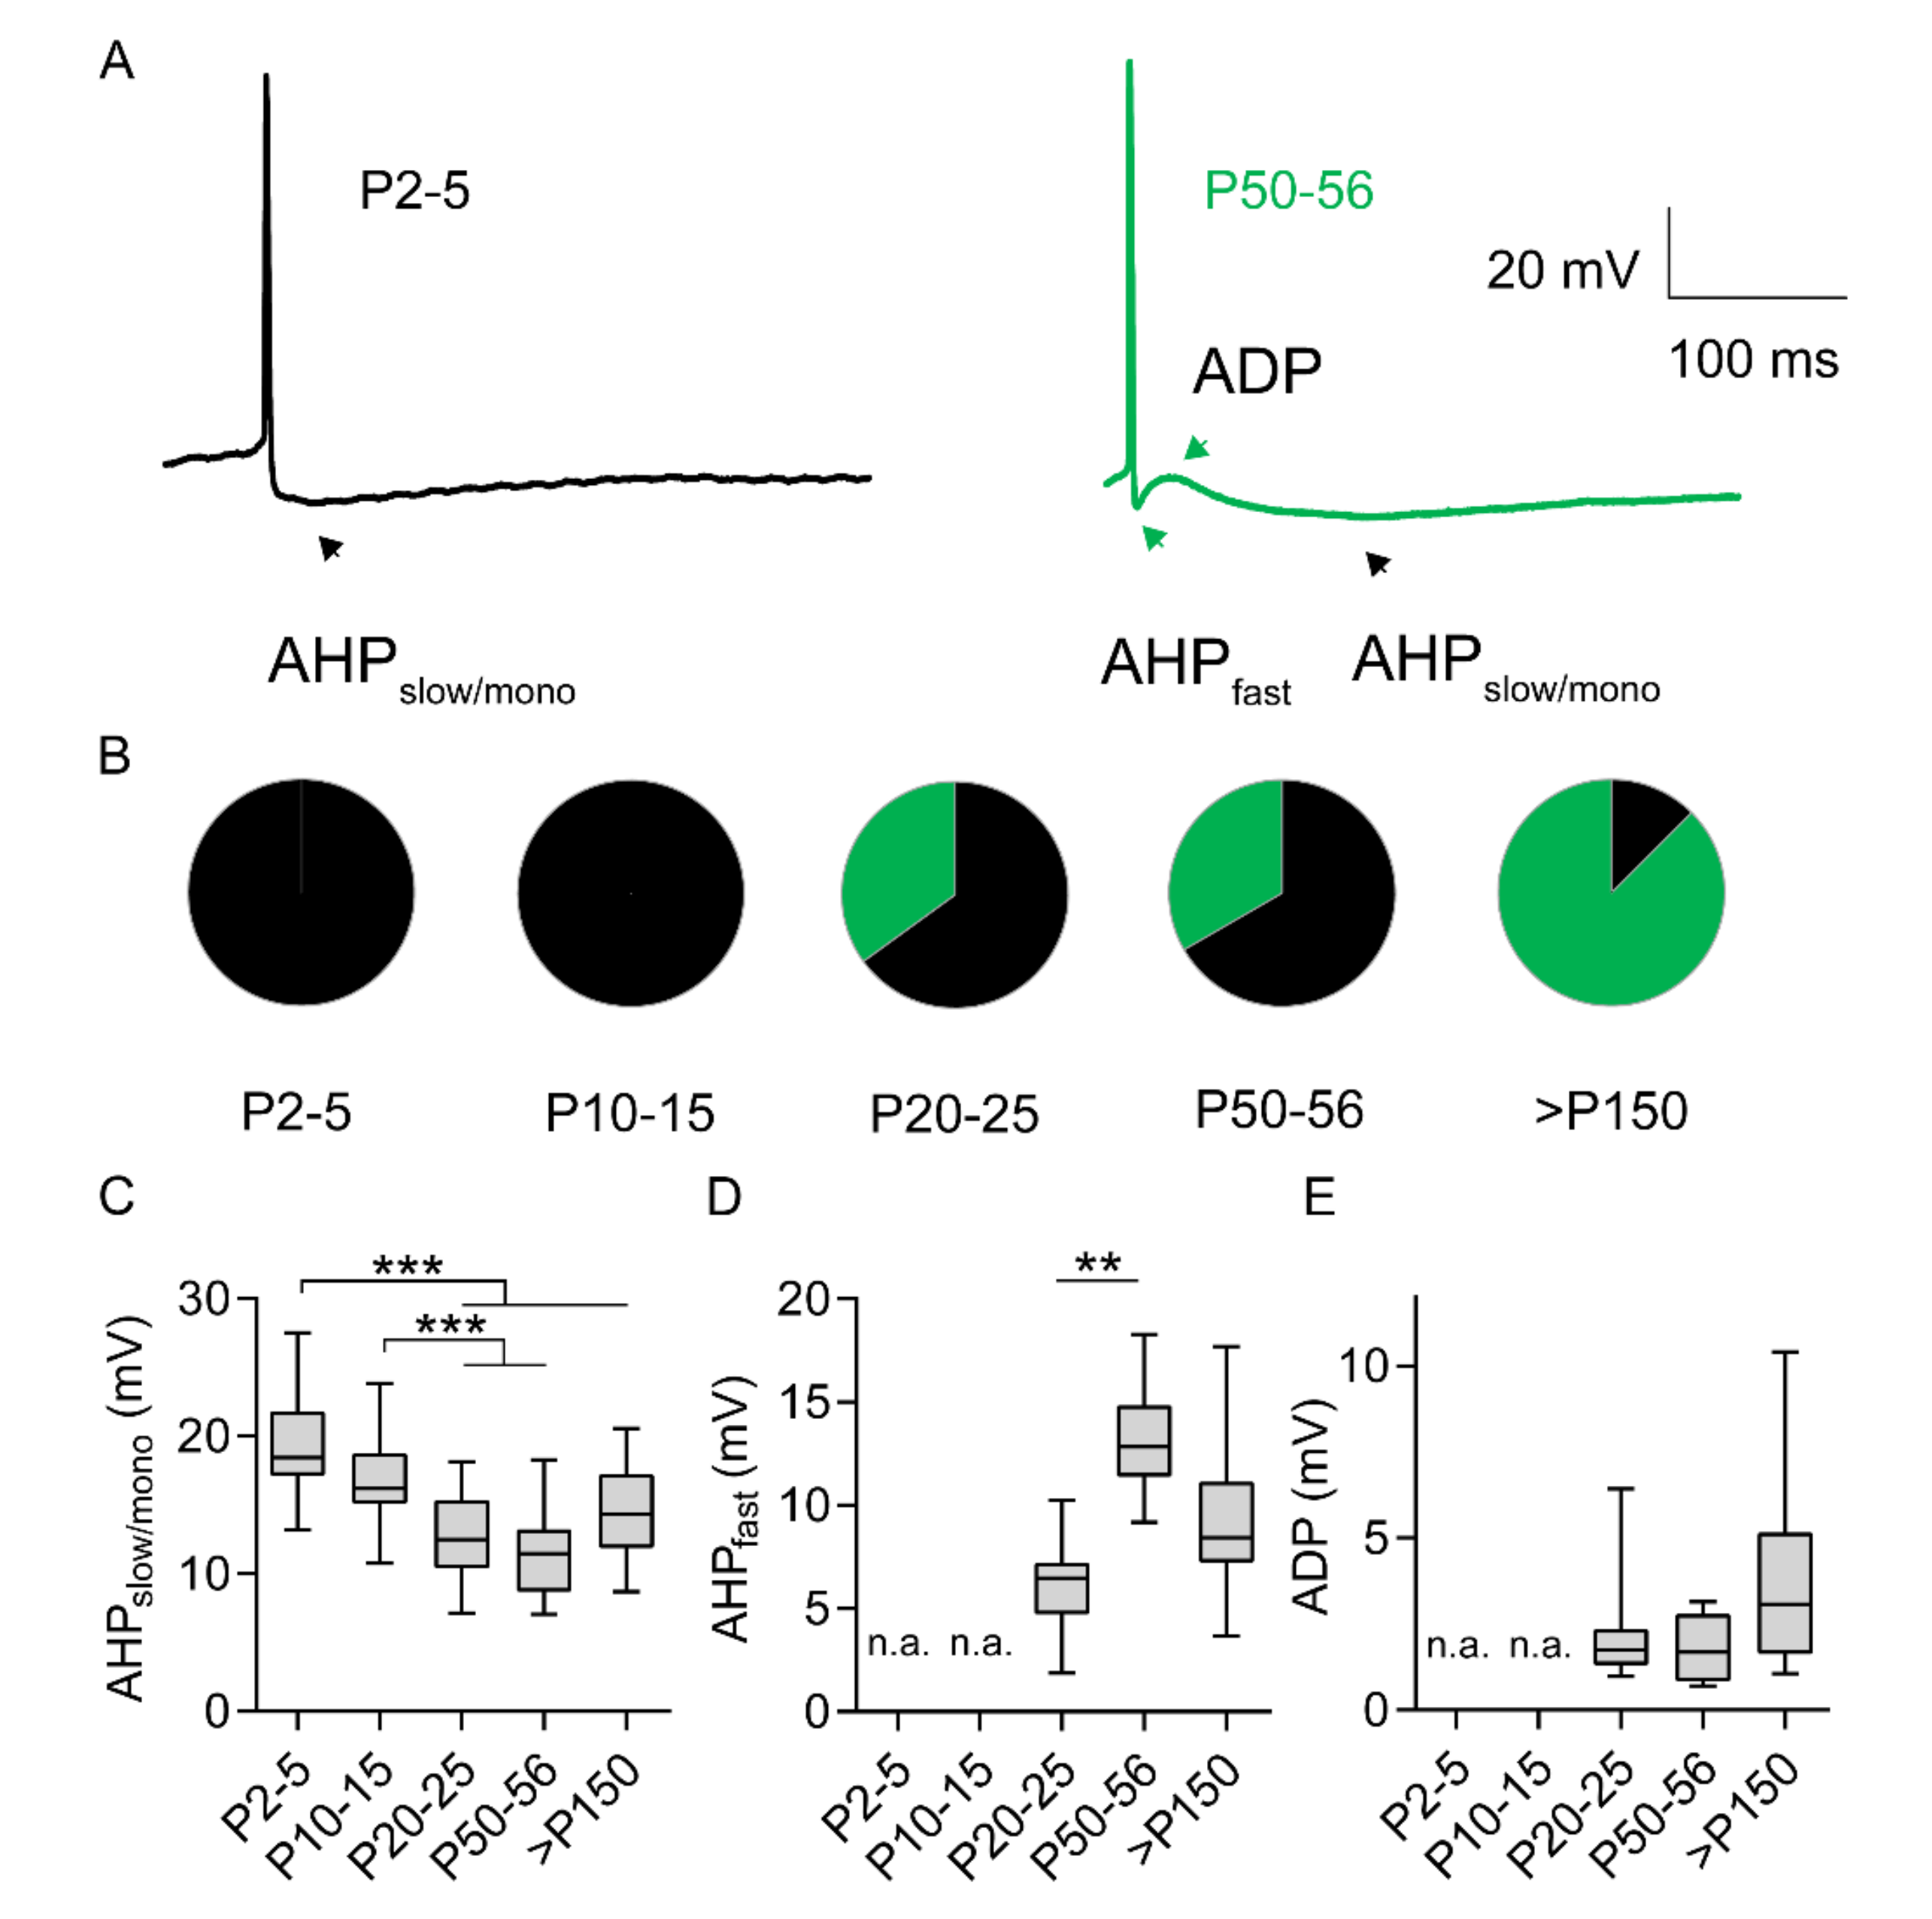
2.4. Development of AP After-Hyperpolarization and AP After-Depolarization Endure Throughout Adulthood
3. Discussion
4. Materials and Methods
4.1. Use of Animals for Experiments
4.2. Immunofluorescence and Image Analysis
4.3. Electrophysiology
4.4. Experimental Design and Statistical Analysis
Supplementary Materials
Author Contributions
Funding
Conflicts of Interest
Abbreviations
| AIS | Axon initial segment |
| AP | Action potential |
| M1 | Primary motor cortex |
| M1LV | Layer V of the primary motor cortex |
| Cm | Membrane capacitance |
| Rin | Input resistance |
| Erest | Resting membrane potential |
| V | Voltage |
| R | Resistance |
| I | Current |
| Imax | Maximal current |
| Imem | Steady-state membrane leak current |
| IIn | Inward current |
| IInVHalf | Voltage of half-maximal activation of the inward current |
| dV/dt | Derivative of voltage over time |
| τ | Decay time-constant of maximal current |
| IS | Axon initial segment component |
| SD | Somatodendritic component |
| EstIIn-AIS | Estimated current at the axon initial segment |
| CAIS | Capacitance of the axon initial segment |
| ADP | After-depolarization |
| AHP | After-hyperpolarization |
| AHPfast | Fast component of the after-hyperpolarization |
| AHPslow/mono | Slow or single component of the after-hyperpolarization |
Appendix A
Development of Voltage-Gated Currents in MILV Neurons
References
- Bakkum, D.J.; Obien, M.E.J.; Radivojevic, M.; Jäckel, D.; Frey, U.; Takahashi, H.; Hierlemann, A. The axon initial segment is the dominant contributor to the neuron’ s extracellular electrical potential landscape. Adv. Biosys 2018, 3, 1800308. [Google Scholar] [CrossRef] [PubMed]
- Hodgkin, A.L.; Huxley, F. A quantitative description of membrane current and its application to conduction and excitation in nerve. J. Physiol. 1952, 117, 500–544. [Google Scholar] [CrossRef] [PubMed]
- Kole, M.H.P.; Ilschner, S.U.; Kampa, B.M.; Williams, S.R.; Ruben, P.C.; Stuart, G.J. Action potential generation requires a high sodium channel density in the axon initial segment. Nat. Neurosci. 2008, 11, 178–186. [Google Scholar] [CrossRef]
- Bender, K.J.; Trussell, L.O. The physiology of the axon initial segment. Annu. Rev. Neurosci. 2012, 35, 249–265. [Google Scholar] [CrossRef] [PubMed]
- Kole, M.H.P.; Stuart, G.J. Signal processing in the axon initial segment. Neuron 2012, 73, 235–247. [Google Scholar] [CrossRef] [PubMed] [Green Version]
- Susuki, K.; Kuba, H. Activity-dependent regulation of excitable axonal domains. J. Physiol. Sci. 2016, 66, 99–104. [Google Scholar] [CrossRef]
- Petersen, A.V.; Cotel, F.; Perrier, J.F. Plasticity of the axon initial segment: fast and slow processes with multiple functional roles. Neuroscientist 2017, 23, 364–373. [Google Scholar] [CrossRef]
- Jamann, N.; Jordan, M.; Engelhardt, M. Activity-dependent axonal plasticity in sensory systems. Neuroscience 2018, 368, 268–282. [Google Scholar] [CrossRef]
- Wefelmeyer, W.; Puhl, C.J.; Burrone, J. Homeostatic plasticity of subcellular neuronal structures: from inputs to outputs. Trends Neurosci. 2016, 39, 656–667. [Google Scholar] [CrossRef] [Green Version]
- Grubb, M.S.; Burrone, J. Activity-dependent relocation of the axon initial segment fine-tunes neuronal excitability. Nature 2010, 465, 1070–1074. [Google Scholar] [CrossRef] [Green Version]
- Kuba, H.; Oichi, Y.; Ohmori, H. Presynaptic activity regulates Na 1 channel distribution at the axon initial segment. Nature 2010, 465, 1075–1078. [Google Scholar] [CrossRef] [PubMed]
- Kole, M.H.; Brette, R. The electrical significance of axon location diversity. Curr. Opin. Neurobiol. 2018, 51, 52–59. [Google Scholar] [CrossRef] [PubMed]
- Goethals, S.; Brette, R. Theoretical relation between axon initial segment geometry and excitability. Elife 2020, 9, 1–34. [Google Scholar] [CrossRef] [PubMed]
- Kast, R.J.; Levitt, P. Progress in Neurobiology Precision in the development of neocortical architecture: From progenitors to cortical networks. Prog. Neurobiol. 2019, 175, 77–95. [Google Scholar] [CrossRef]
- Schlüter, A.; Del Turco, D.; Deller, T.; Gutzmann, A.; Schultz, C.; Engelhardt, M. Structural plasticity of synaptopodin in the axon initial segment during visual cortex development. Cereb. Cortex 2017, 27, 4662–4675. [Google Scholar] [CrossRef]
- Kuba, H.; Adachi, R.; Ohmori, H. Activity-dependent and activity-independent development of the axon initial segment. J. Neurosci. 2014, 34, 3443–3453. [Google Scholar] [CrossRef]
- Gutzmann, A.; Ergül, N.; Grossmann, R.; Schultz, C.; Wahle, P.; Engelhardt, M. A period of structural plasticity at the axon initial segment in developing visual cortex. Front. Neuroanat. 2014, 8, 11. [Google Scholar] [CrossRef] [Green Version]
- Kim, E.J.; Feng, C.; Santamaria, F.; Kim, J.H.; Inserm, U. Impact of auditory experience on the structural plasticity of the ais in the mouse brainstem throughout the lifespan. Front. Cell. Neurosci. 2019, 13, 456. [Google Scholar] [CrossRef] [Green Version]
- Dooley, J.C.; Blumberg, M.S. Developmental ’awakening’ of primary motor cortex to the sensory consequences of movement. Elife 2018, 7, e41841. [Google Scholar] [CrossRef]
- Weiler, N.; Wood, L.; Yu, J.; Solla, S.A.; Shepherd, G.M.G. Top-down laminar organization of the excitatory network in motor cortex. Nat. Neurosci. 2008, 11, 360–366. [Google Scholar] [CrossRef] [Green Version]
- Tjia, M.; Yu, X.; Jammu, L.S.; Lu, J.; Zuo, Y. Pyramidal neurons in different cortical layers exhibit distinct dynamics and plasticity of apical dendritic spines. Front. Neural Circuits 2017, 11, 1–10. [Google Scholar] [CrossRef] [PubMed] [Green Version]
- Young, N.A.; Vuong, J.; Teskey, G.C.; Young, N.A.; Vuong, J.; Teskey, G.C. Development of motor maps in rats and their modulation by experience. J. Neurophysiol. 2012, 1309–1317. [Google Scholar] [CrossRef]
- Katz, E.; Stoler, O.; Scheller, A.; Khrapunsky, Y.; Goebbels, S.; Kirchhoff, F. Role of sodium channel subtype in action potential generation by neocortical pyramidal neurons. Proc. Natl. Acad. Sci. USA 2018, 30, 7184–7192. [Google Scholar] [CrossRef] [Green Version]
- Lazarov, E.; Dannemeyer, M.; Feulner, B.; Enderlein, J.; Gutnick, M.J.; Wolf, F.; Neef, A. An axon initial segment is required for temporal precision in action potential encoding by neuronal populations. Sci. Adv. 2018, 4, eaau8621. [Google Scholar] [CrossRef] [Green Version]
- Benedetti, B.; Dannehl, D.; König, R.; Coviello, S.; Kreutzer, C.; Zaunmair, P.; Jakubecova, D.; Weiger, T.M.; Aigner, L.; Nacher, J.; et al. Functional Integration of Neuronal Precursors in the Adult Murine Piriform Cortex. Cereb. Cortex 2019, 30, 1499–1515. [Google Scholar] [CrossRef] [PubMed] [Green Version]
- Schmidt-Hieber, C.; Jonas, P.; Bischofberger, J. Enhanced synaptic plasticity in newly generated granule cells of the adult hippocampus. Nature 2004, 429, 184–187. [Google Scholar] [CrossRef] [PubMed]
- Liu, Y.B.; Lio, P.A.; Pasternak, J.F.; Trommer, B.L. Developmental changes in membrane properties and postsynaptic currents of granule cells in rat dentate gyrus. J. Neurophysiol. 1996, 76, 1074–1088. [Google Scholar] [CrossRef]
- Lodge, M.; Bischofberger, J. Synaptic properties of newly generated granule cells support sparse coding in the adult hippocampus. Behav. Brain Res. 2019, 372, 112036. [Google Scholar] [CrossRef]
- Suwabe, T.; Mistretta, C.M.; Krull, C.; Bradley, R.M. Pre-and postnatal differences in membrane, action potential, and ion channel properties of rostral nucleus of the solitary tract neurons. J. Neurophysiol. 2011, 106, 2709–2719. [Google Scholar] [CrossRef] [Green Version]
- Bao, H.; Bradley, M.R.; Mistretta, M.C. Development of intrinsic electrophysiological properties in neurons from the gustatory region of rat nucleus of solitary tract. Dev. Brain Res. 1995, 86, 143–154. [Google Scholar] [CrossRef]
- Hu, W.; Bean, B.P. Differential control of axonal and somatic resting potential by voltage-dependent conductances in cortical layer 5 pyramidal neurons. Neuron 2018, 97, 1315–1326. [Google Scholar] [CrossRef] [PubMed] [Green Version]
- Beckh, S.; Noda, M.; Lübbert, H.; Numa, S. Differential regulation of three sodium channel messenger RNAs in the rat central nervous system during development. EMBO J. 1989, 8, 3611–3616. [Google Scholar] [CrossRef] [PubMed]
- Yarowsky, P.J.; Krueger, B.K.; Erik Olson, C.; Clevinger, E.C.; Koos, R.D. Brain and heart sodium channel subtype mRNA expression in rat cerebral cortex. Proc. Natl. Acad. Sci. USA 1991, 88, 9453–9457. [Google Scholar] [CrossRef] [PubMed] [Green Version]
- Boiko, T.; Rasband, M.N.; Levinson, S.R.; Caldwell, J.H.; Mandel, G.; Trimmer, J.S.; Matthews, G. Compact myelin dictates the differential targeting of two sodium channel isoforms in the same axon. Neuron 2001, 30, 91–104. [Google Scholar] [CrossRef] [Green Version]
- Boiko, T.; Van Wart, A.; CaldWell, J.H.; Levinson, S.R.; Trimmer, J.S.; Matthews, G. Functional specialization of the axon initial segment by isoform-specific sodium channel targeting. J. Neurosci. 2003, 23, 2306–2313. [Google Scholar] [CrossRef] [PubMed] [Green Version]
- Alberto Sánchez-Aguilera, G.M.; Colino, A.; Vicente-Torres, M.Á. Development of action potential waveform in hippocampal CA1 pyramidal neurons. Neuroscience 2020, 442, 151–167. [Google Scholar] [CrossRef]
- Jamann, N.; Dannehl, D.; Wagener, R.; Corcelli, C.; Schultz, C.; Staiger, J.; Kole, M.H.P.; Engelhardt, M. Sensory input drives rapid homeostatic scaling of the axon initial segment in mouse barrel cortex. bioRxiv 2020. [Google Scholar] [CrossRef]
- Suter, B.A.; Migliore, M.; Shepherd, G.M.G. Intrinsic electrophysiology of mouse corticospinal neurons: A class-specific triad of spike-related properties. Cereb. Cortex 2013, 23, 1965–1977. [Google Scholar] [CrossRef] [Green Version]
- Höfflin, F.; Jack, A.; Riedel, C.; Mack-Bucher, J.; Roos, J.; Corcelli, C.; Schultz, C.; Wahle, P.; Engelhardt, M. Heterogeneity of the axon initial segment in interneurons and pyramidal cells of rodent visual cortex. Front. Cell. Neurosci. 2017, 11, 332. [Google Scholar] [CrossRef] [Green Version]
- Schlüter, A.; Rossberger, S.; Dannehl, D.; Janssen, J.M.; Vorwald, S.; Hanne, J.; Schultz, C.; Mauceri, D.; Engelhardt, M. Dynamic Regulation of Synaptopodin and the Axon Initial Segment in Retinal Ganglion Cells During Postnatal Development. Front. Cell. Neurosci. 2019, 13, 318. [Google Scholar] [CrossRef] [Green Version]
- Ernst, L.; Darschnik, S.; Roos, J.; González-Gómez, M.; Beemelmans, C.; Beemelmans, C.; Engelhardt, M.; Meyer, G.; Wahle, P. Fast prenatal development of the NPY neuron system in the neocortex of the European wild boar, Sus scrofa. Brain Struct. Funct. 2018, 223, 3855–3873. [Google Scholar] [CrossRef] [PubMed]
- Van Aerde, K.I.; Feldmeyer, D. Morphological and physiological characterization of pyramidal neuron subtypes in rat medial prefrontal cortex. Cereb. Cortex 2015, 25, 788–805. [Google Scholar] [CrossRef] [PubMed] [Green Version]


© 2020 by the authors. Licensee MDPI, Basel, Switzerland. This article is an open access article distributed under the terms and conditions of the Creative Commons Attribution (CC BY) license (http://creativecommons.org/licenses/by/4.0/).
Share and Cite
Benedetti, B.; Dannehl, D.; Janssen, J.M.; Corcelli, C.; Couillard-Després, S.; Engelhardt, M. Structural and Functional Maturation of Rat Primary Motor Cortex Layer V Neurons. Int. J. Mol. Sci. 2020, 21, 6101. https://0-doi-org.brum.beds.ac.uk/10.3390/ijms21176101
Benedetti B, Dannehl D, Janssen JM, Corcelli C, Couillard-Després S, Engelhardt M. Structural and Functional Maturation of Rat Primary Motor Cortex Layer V Neurons. International Journal of Molecular Sciences. 2020; 21(17):6101. https://0-doi-org.brum.beds.ac.uk/10.3390/ijms21176101
Chicago/Turabian StyleBenedetti, Bruno, Dominik Dannehl, Jan Maximilian Janssen, Corinna Corcelli, Sébastien Couillard-Després, and Maren Engelhardt. 2020. "Structural and Functional Maturation of Rat Primary Motor Cortex Layer V Neurons" International Journal of Molecular Sciences 21, no. 17: 6101. https://0-doi-org.brum.beds.ac.uk/10.3390/ijms21176101