Proteomics and Metabolomics Approaches towards a Functional Insight onto AUTISM Spectrum Disorders: Phenotype Stratification and Biomarker Discovery

 , ,
, , 
Abstract
:
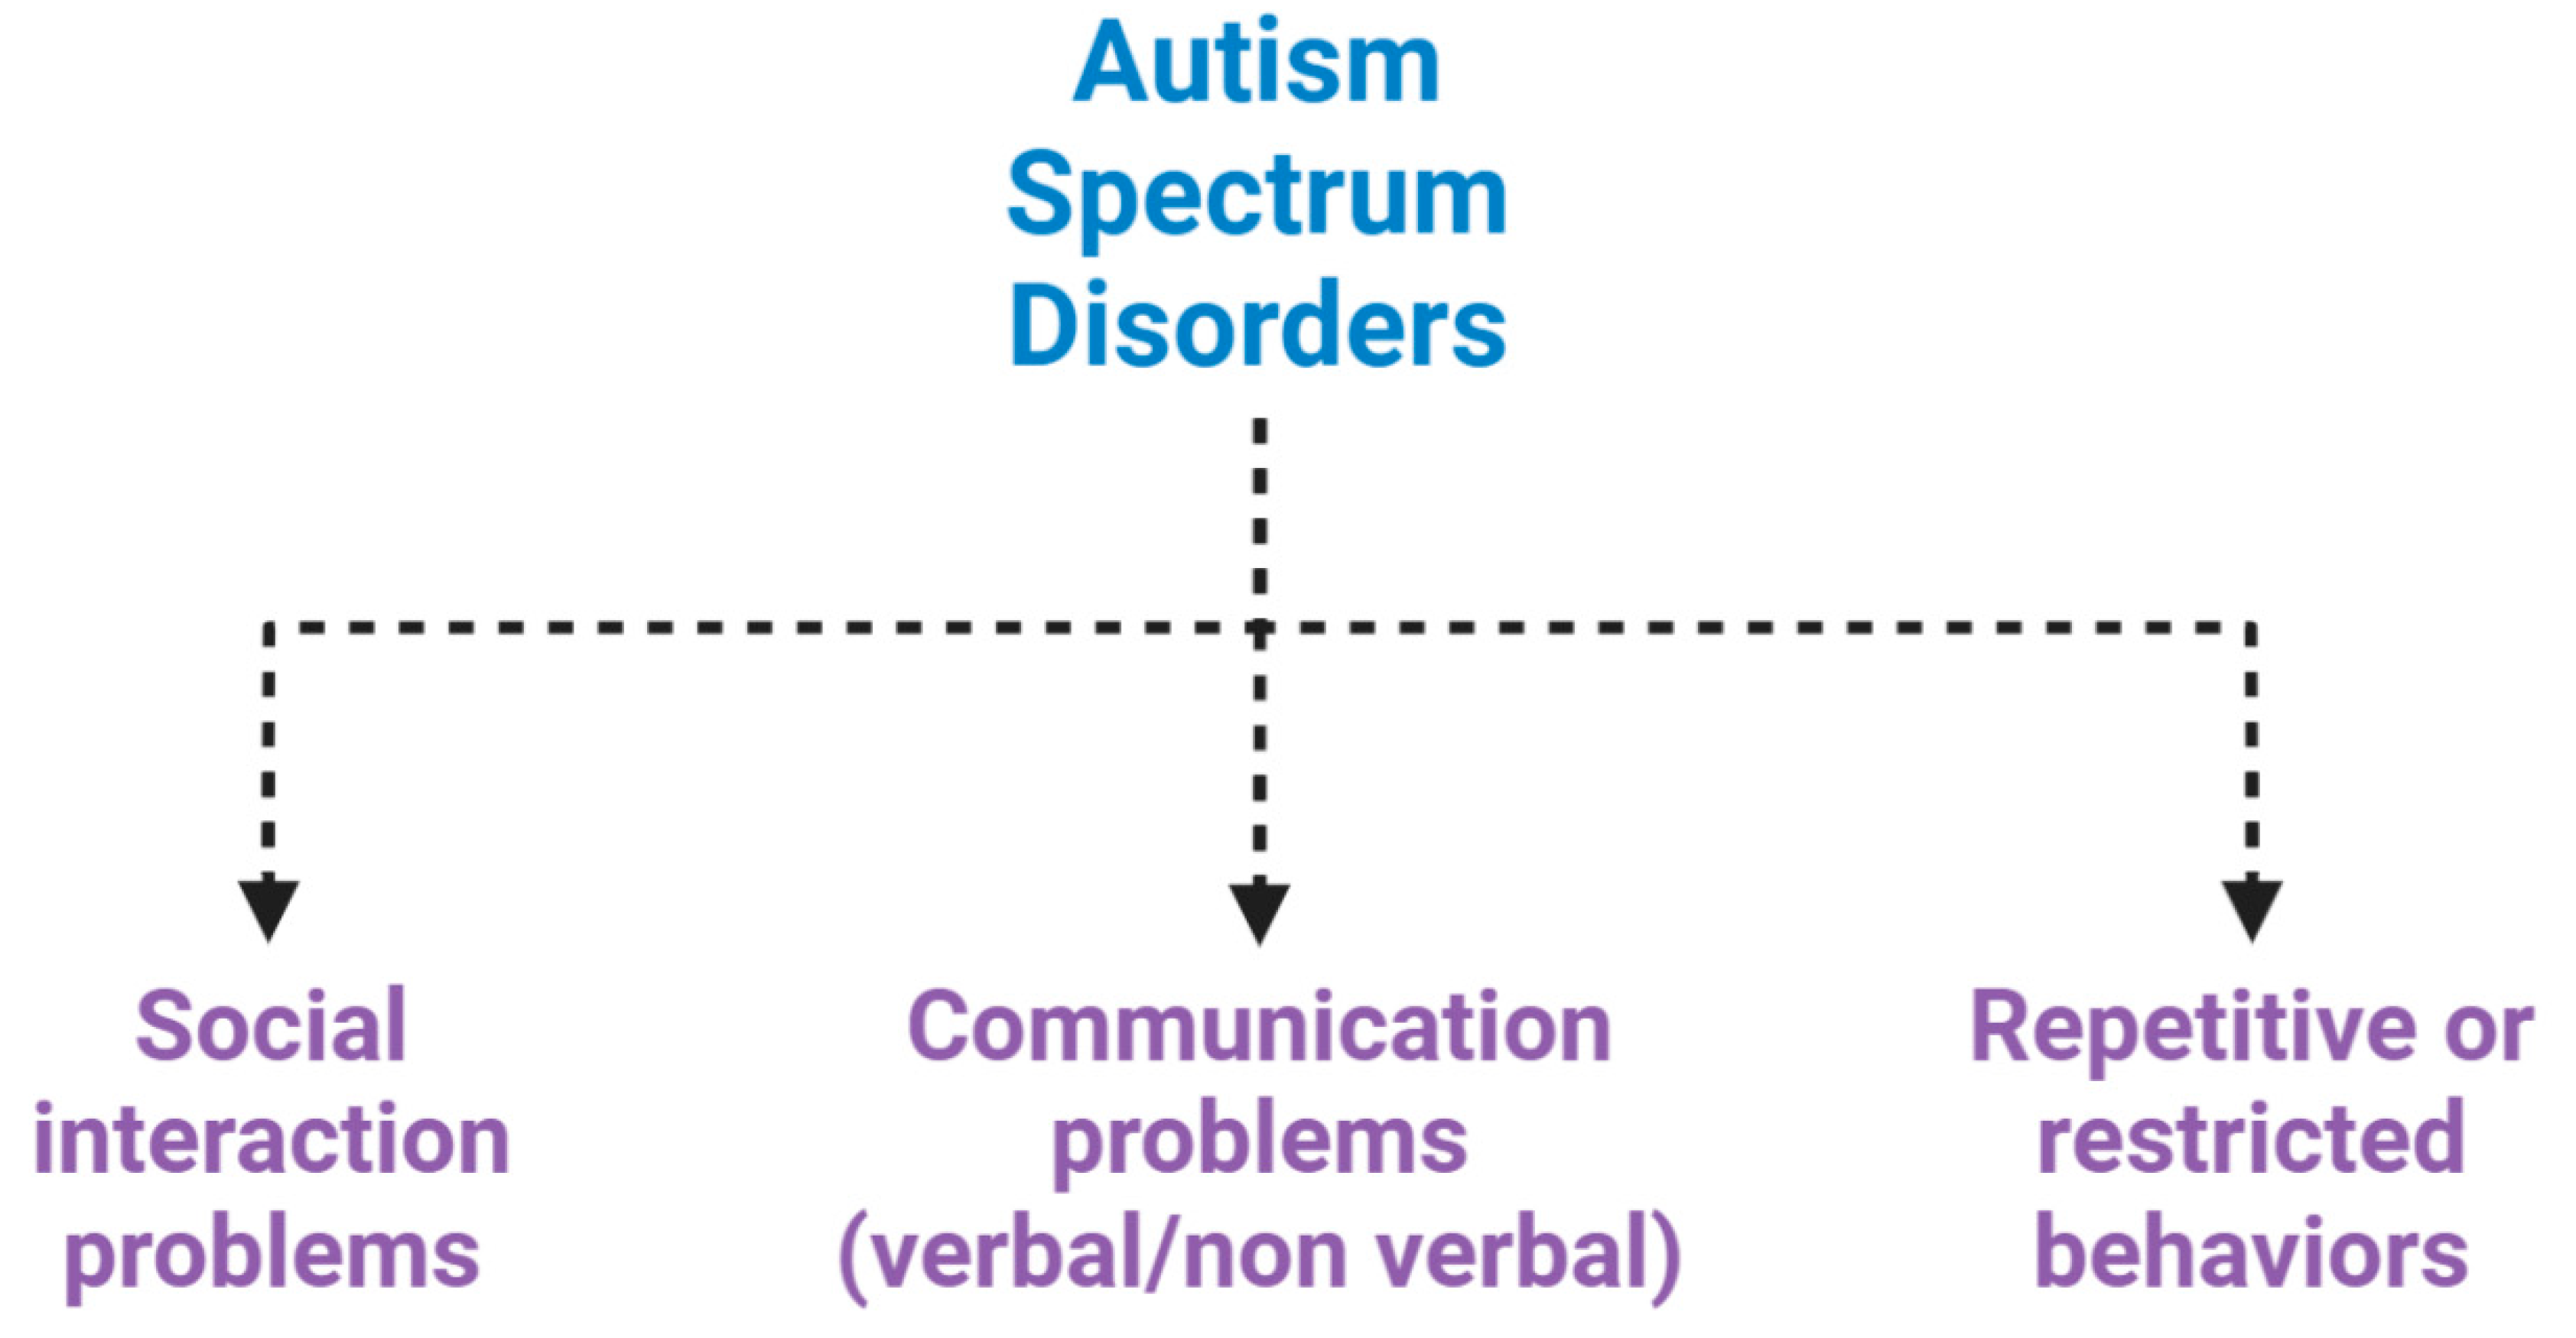
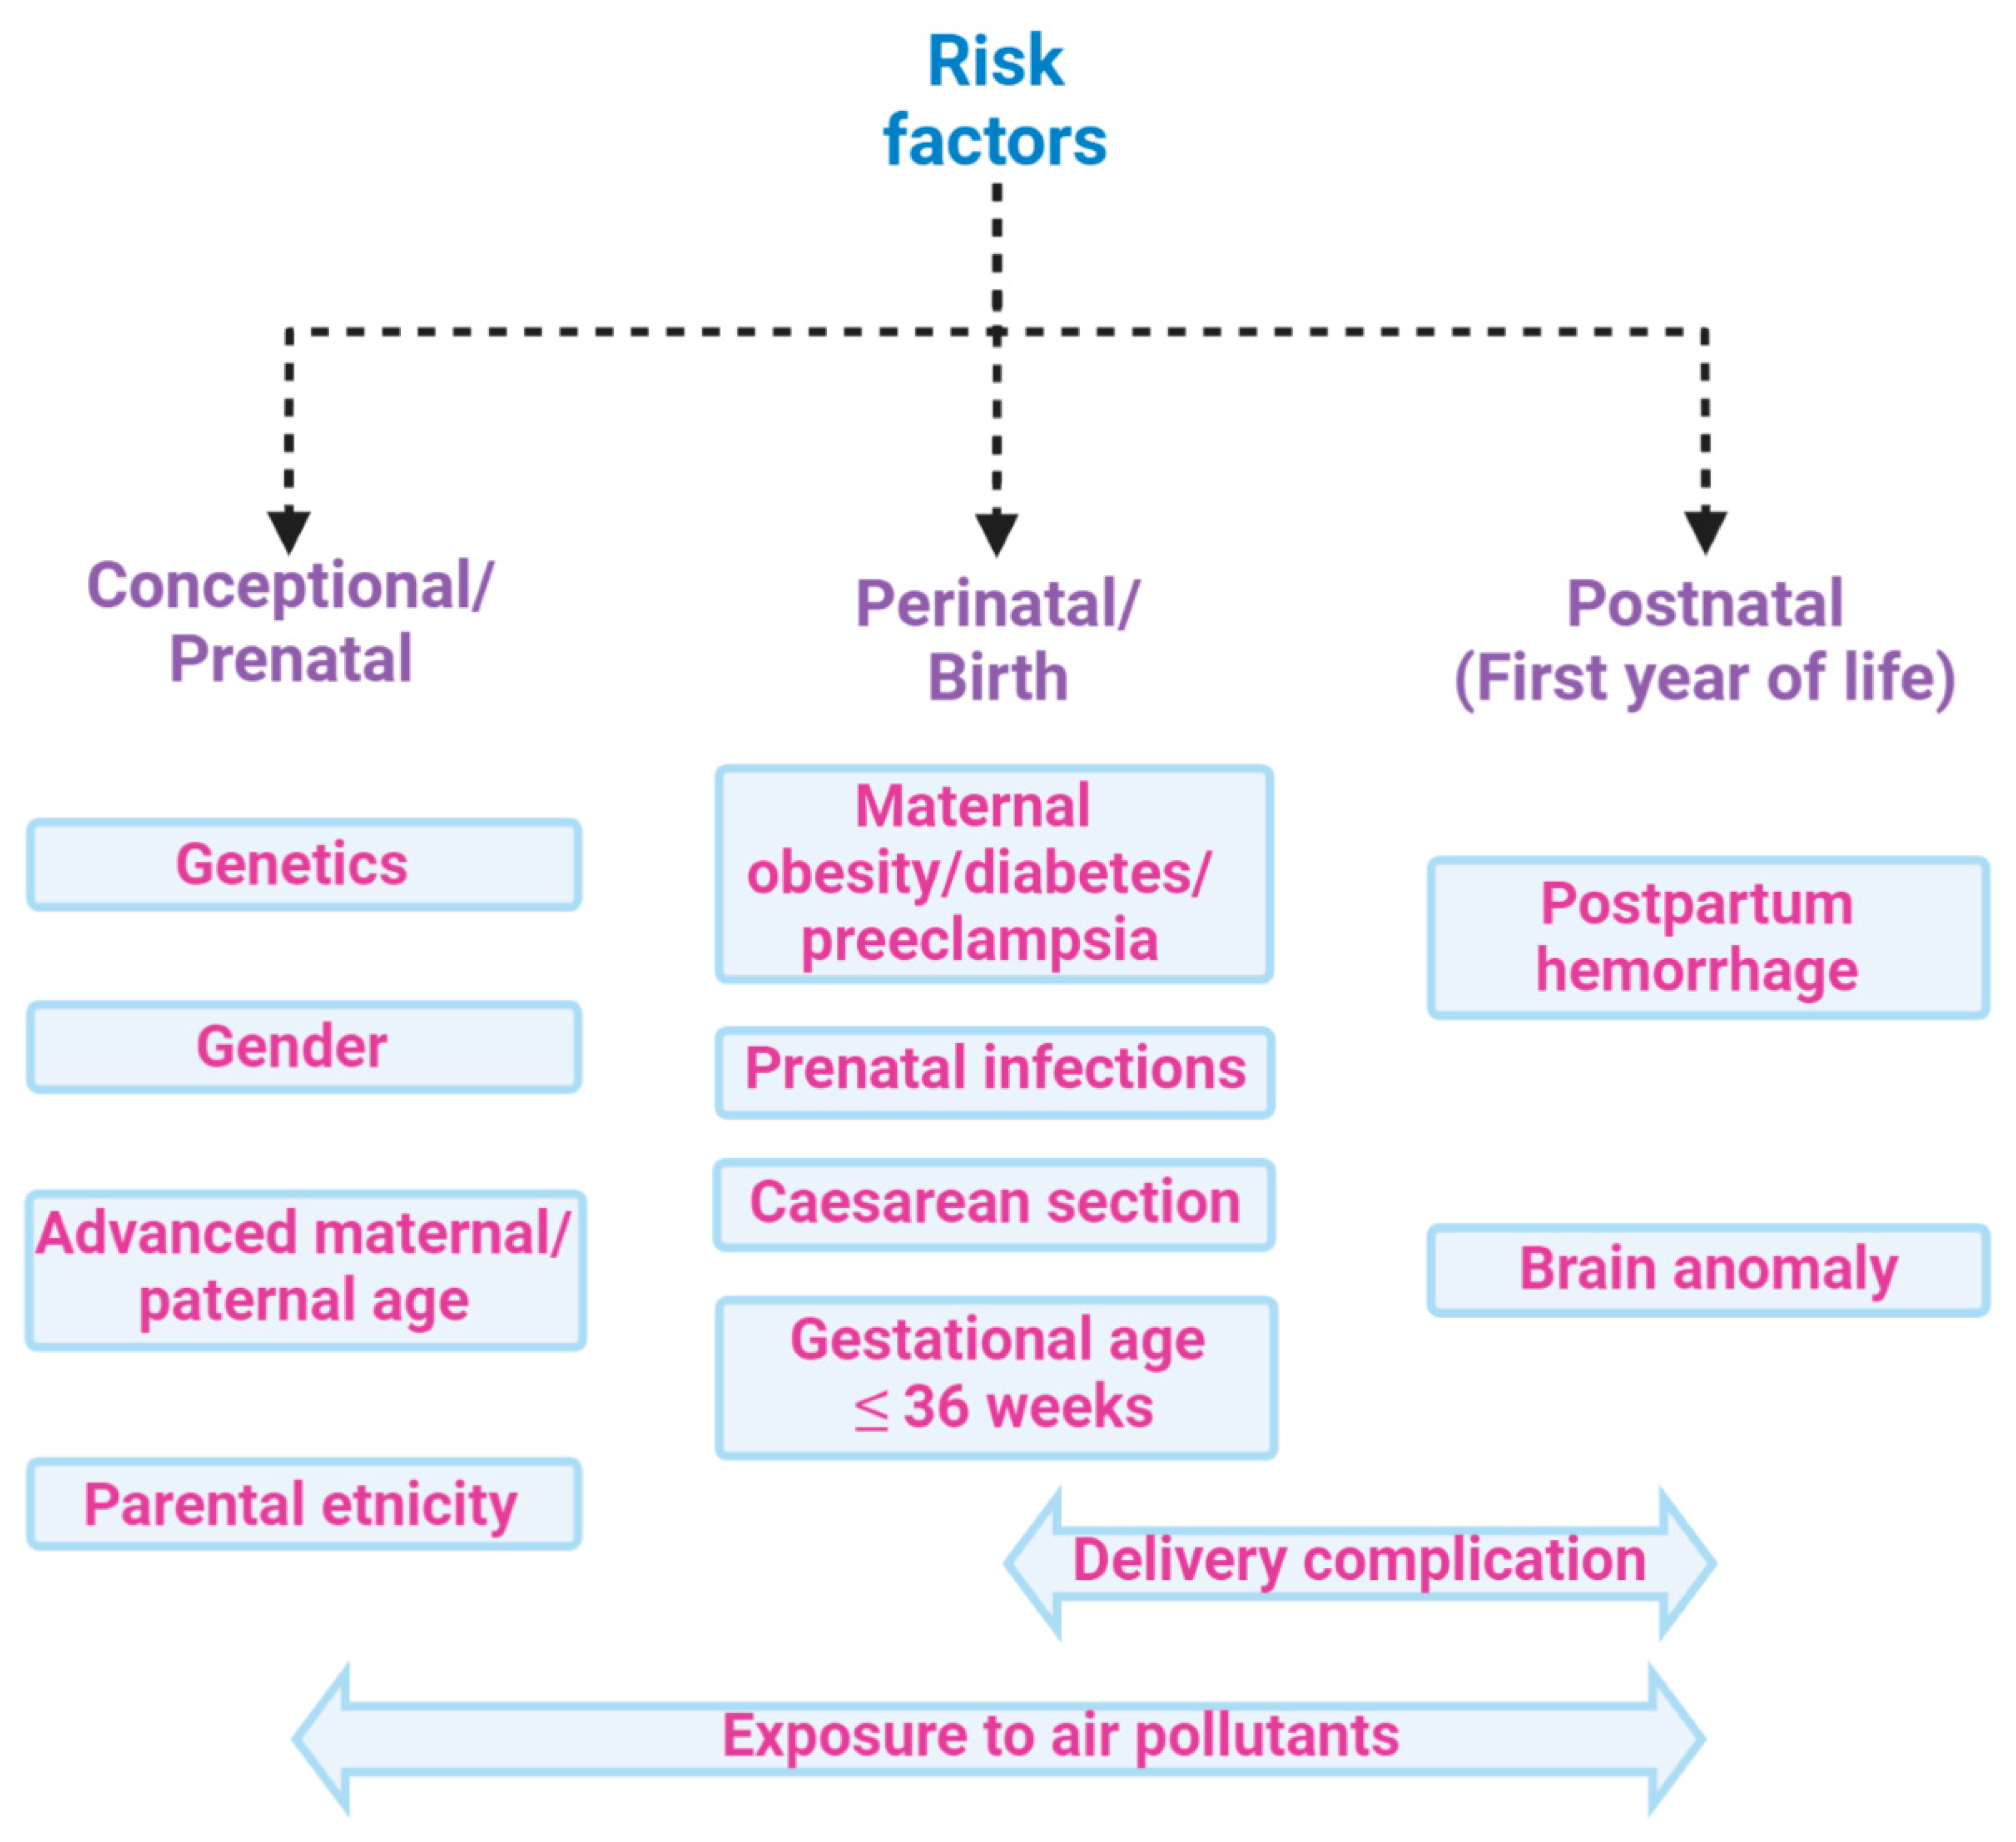
1. Introduction
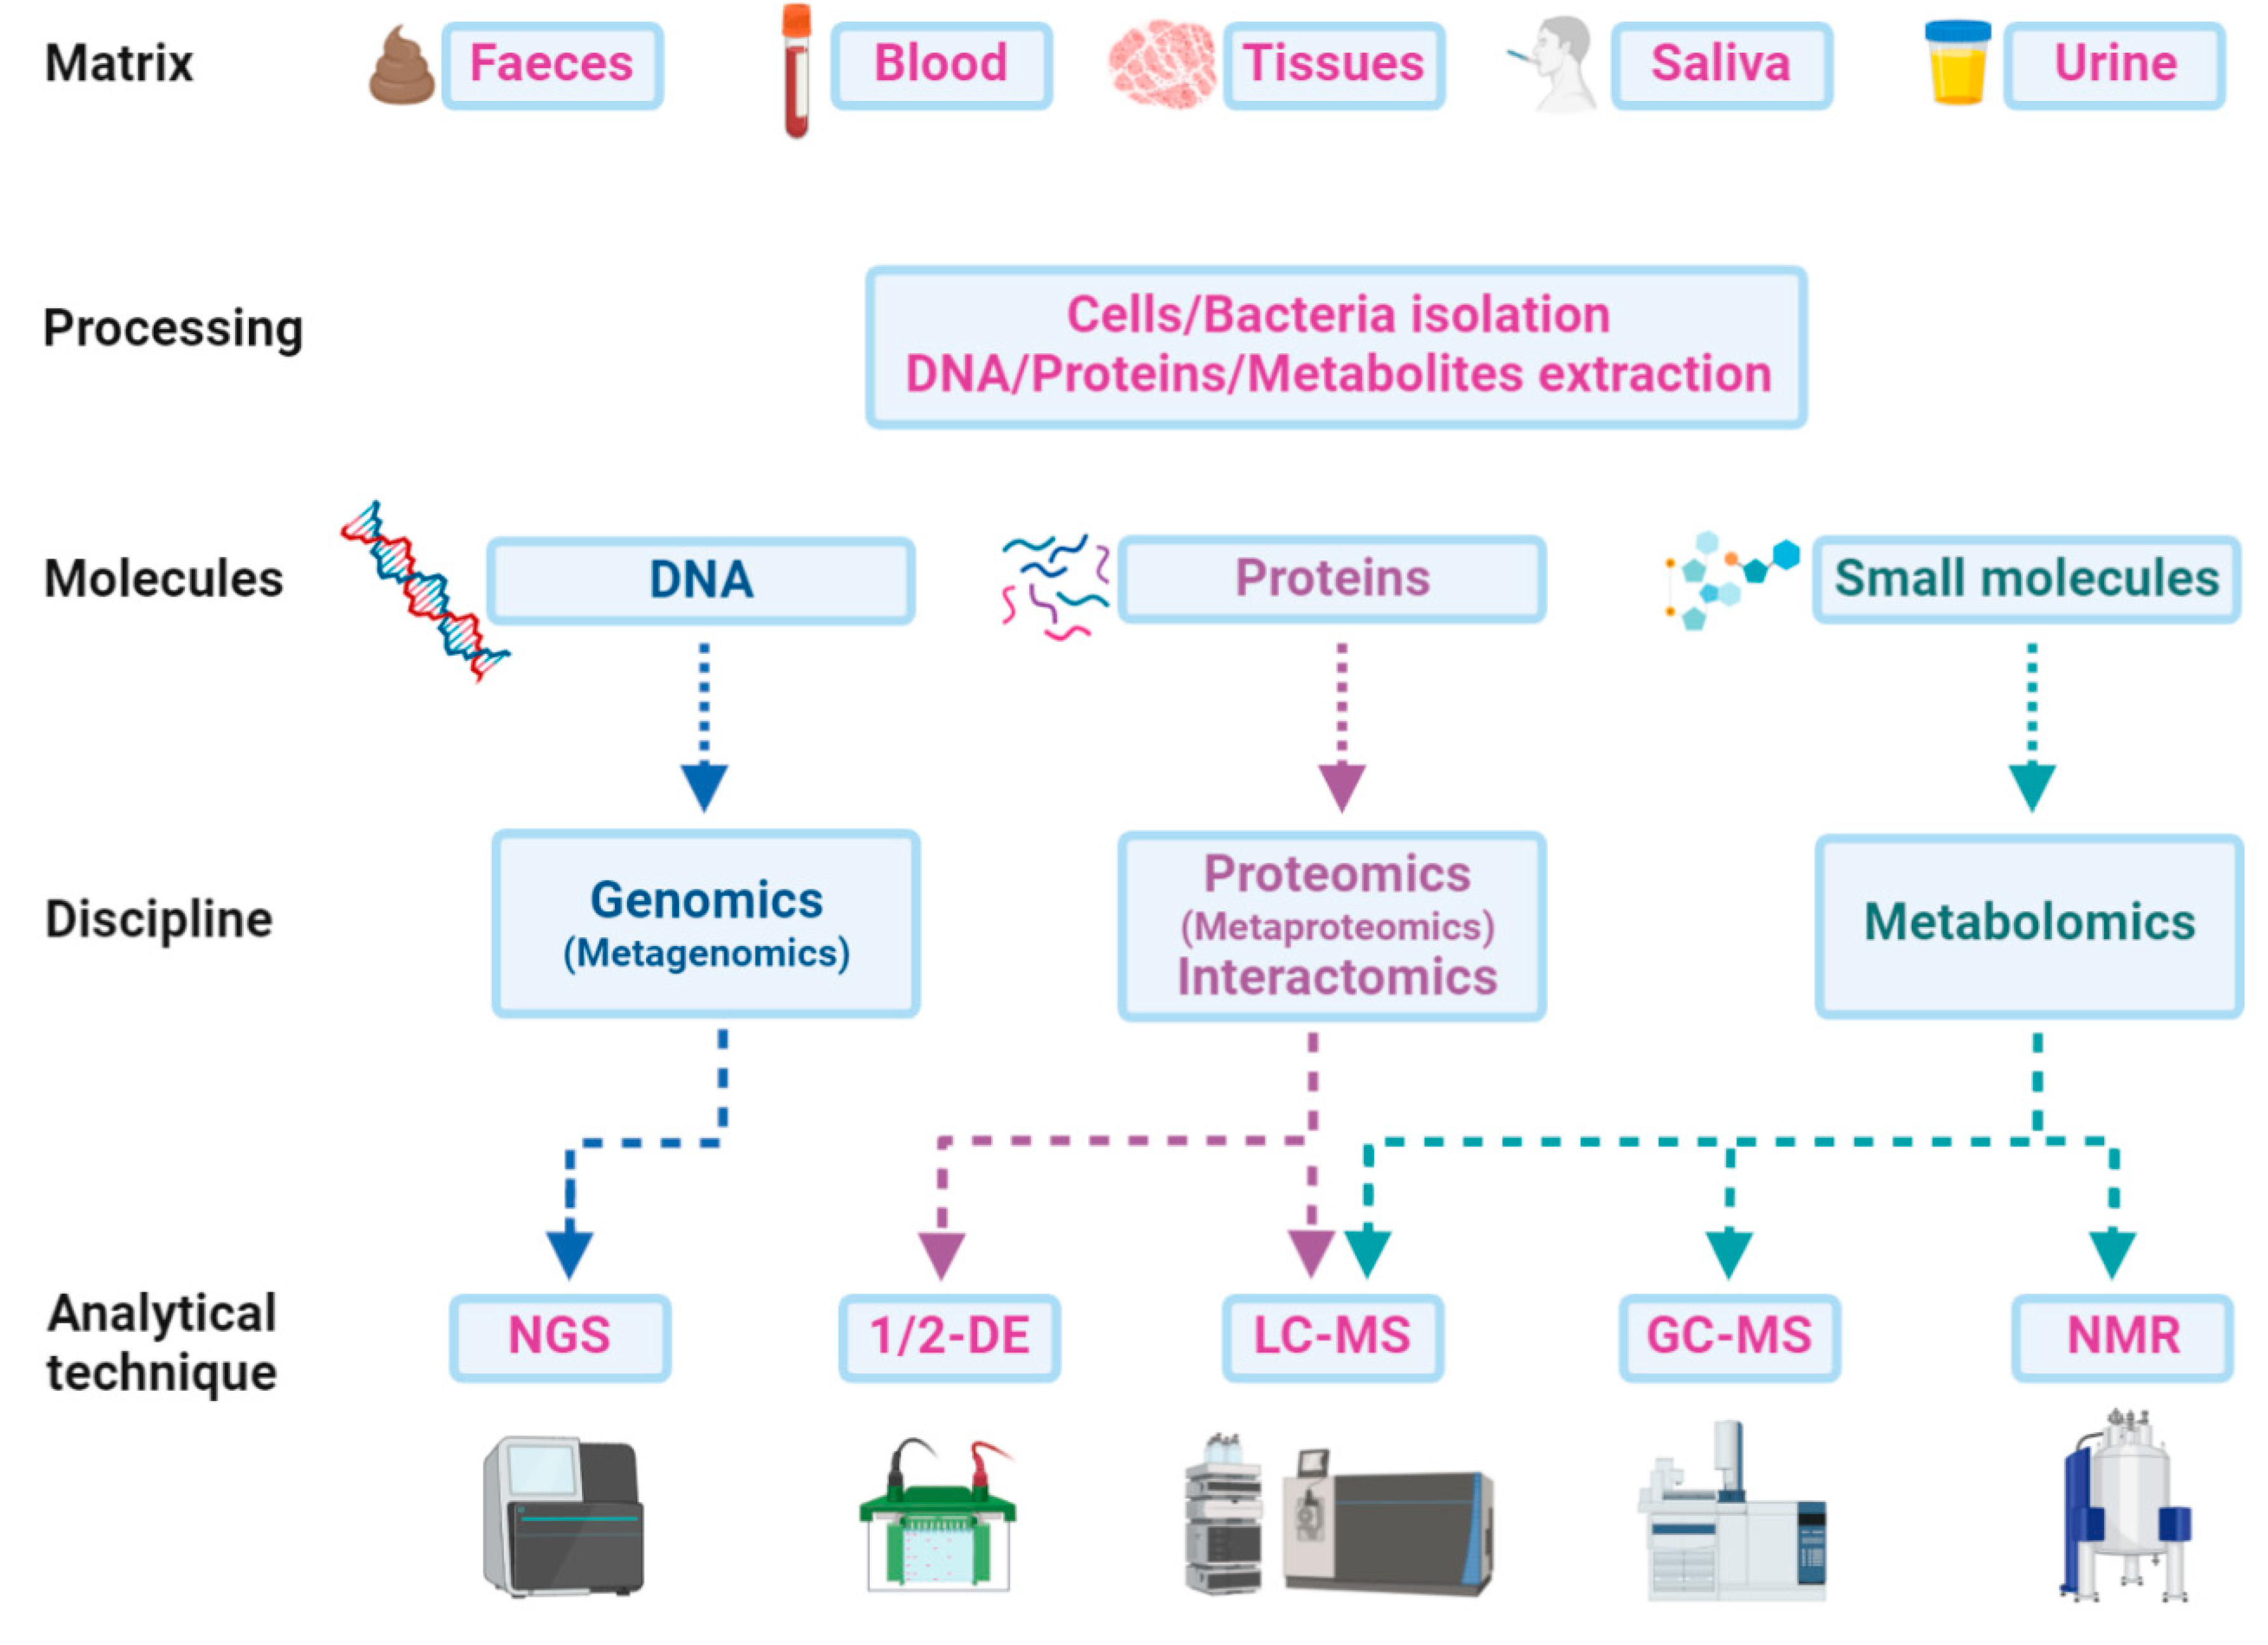
2. Methods
2.1. Search Strategy
2.2. Selection Criteria
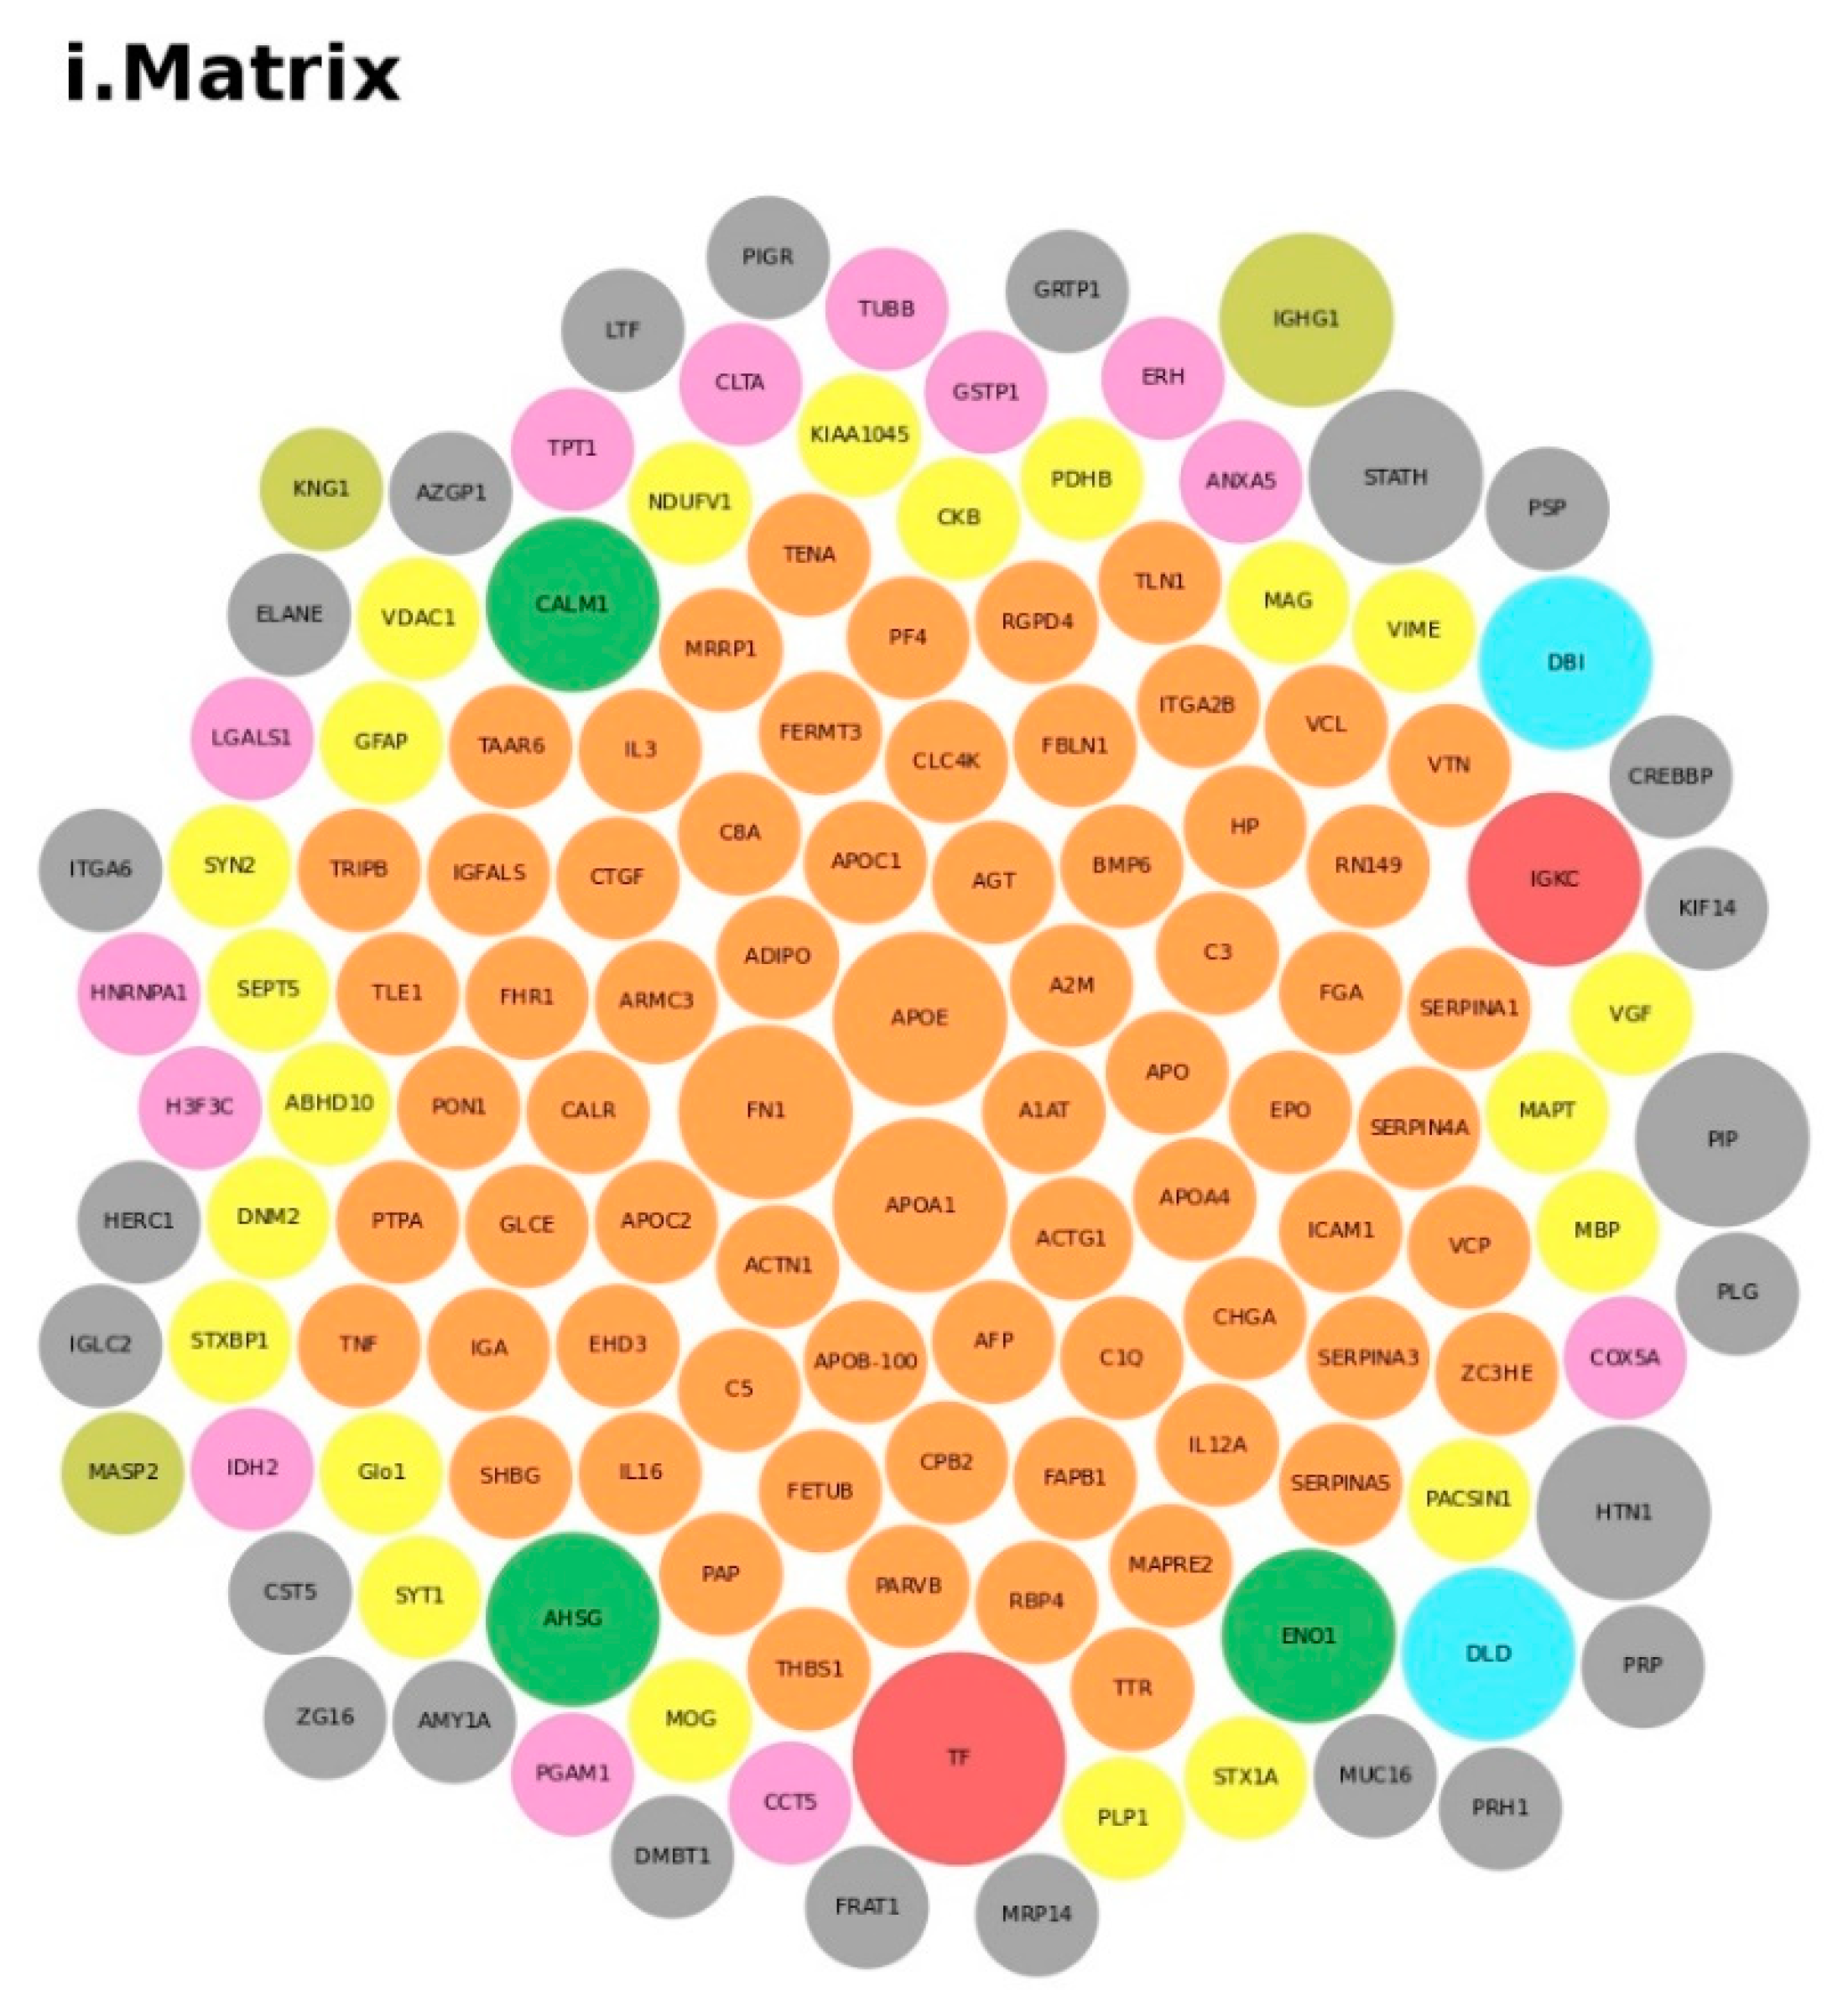
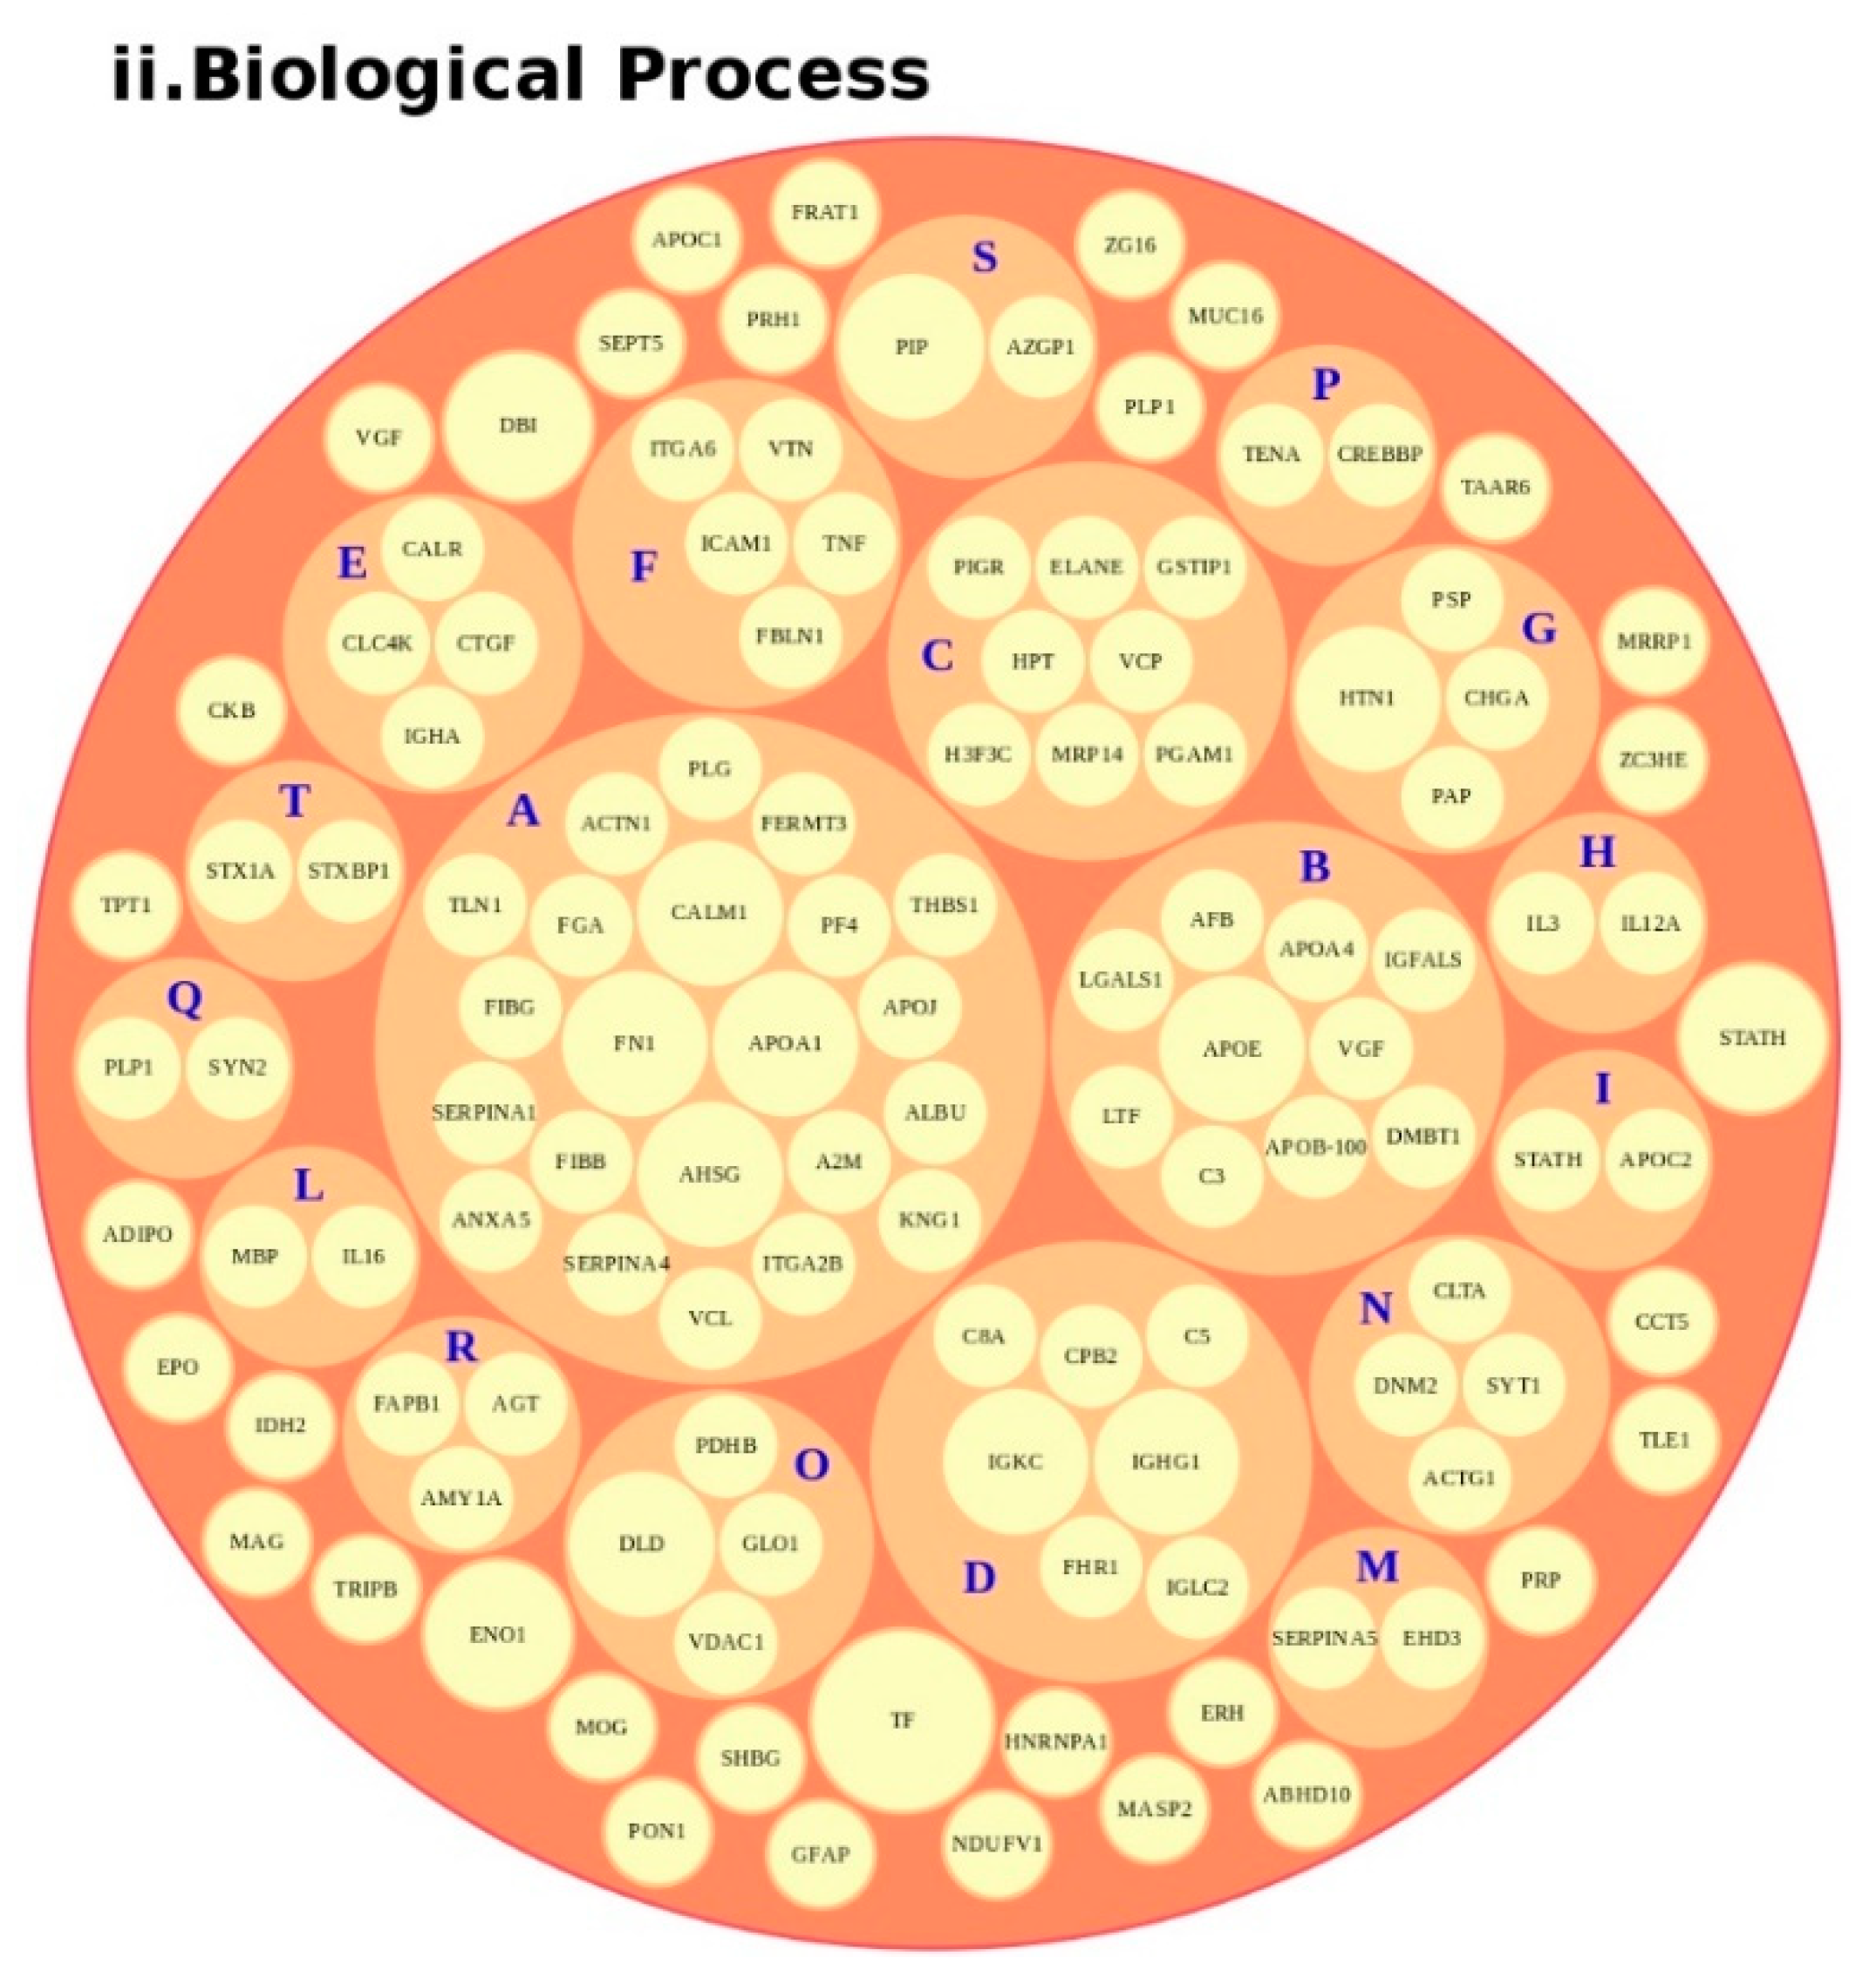
2.3. Analysis of Protein and Metabolites Highlighted in Table 1 and Table 2
- we downloaded all the information from the UniProt database [80], via a Perl script;
- we analyzed all of the Gene Ontology terms for “Biological Process” (GOTERM-BP) [81];
- we calculated the terms found through ad hoc scripts in bash;
- we designed a bubble chart by taking GOTERM-BP with the source “Traceable author statement” (e.g., TAS: Reactome) starting from the highest value (count) and then descending ending the list of proteins. Thus, we clustered all of the proteins for GOTERM-BP with at least one term.
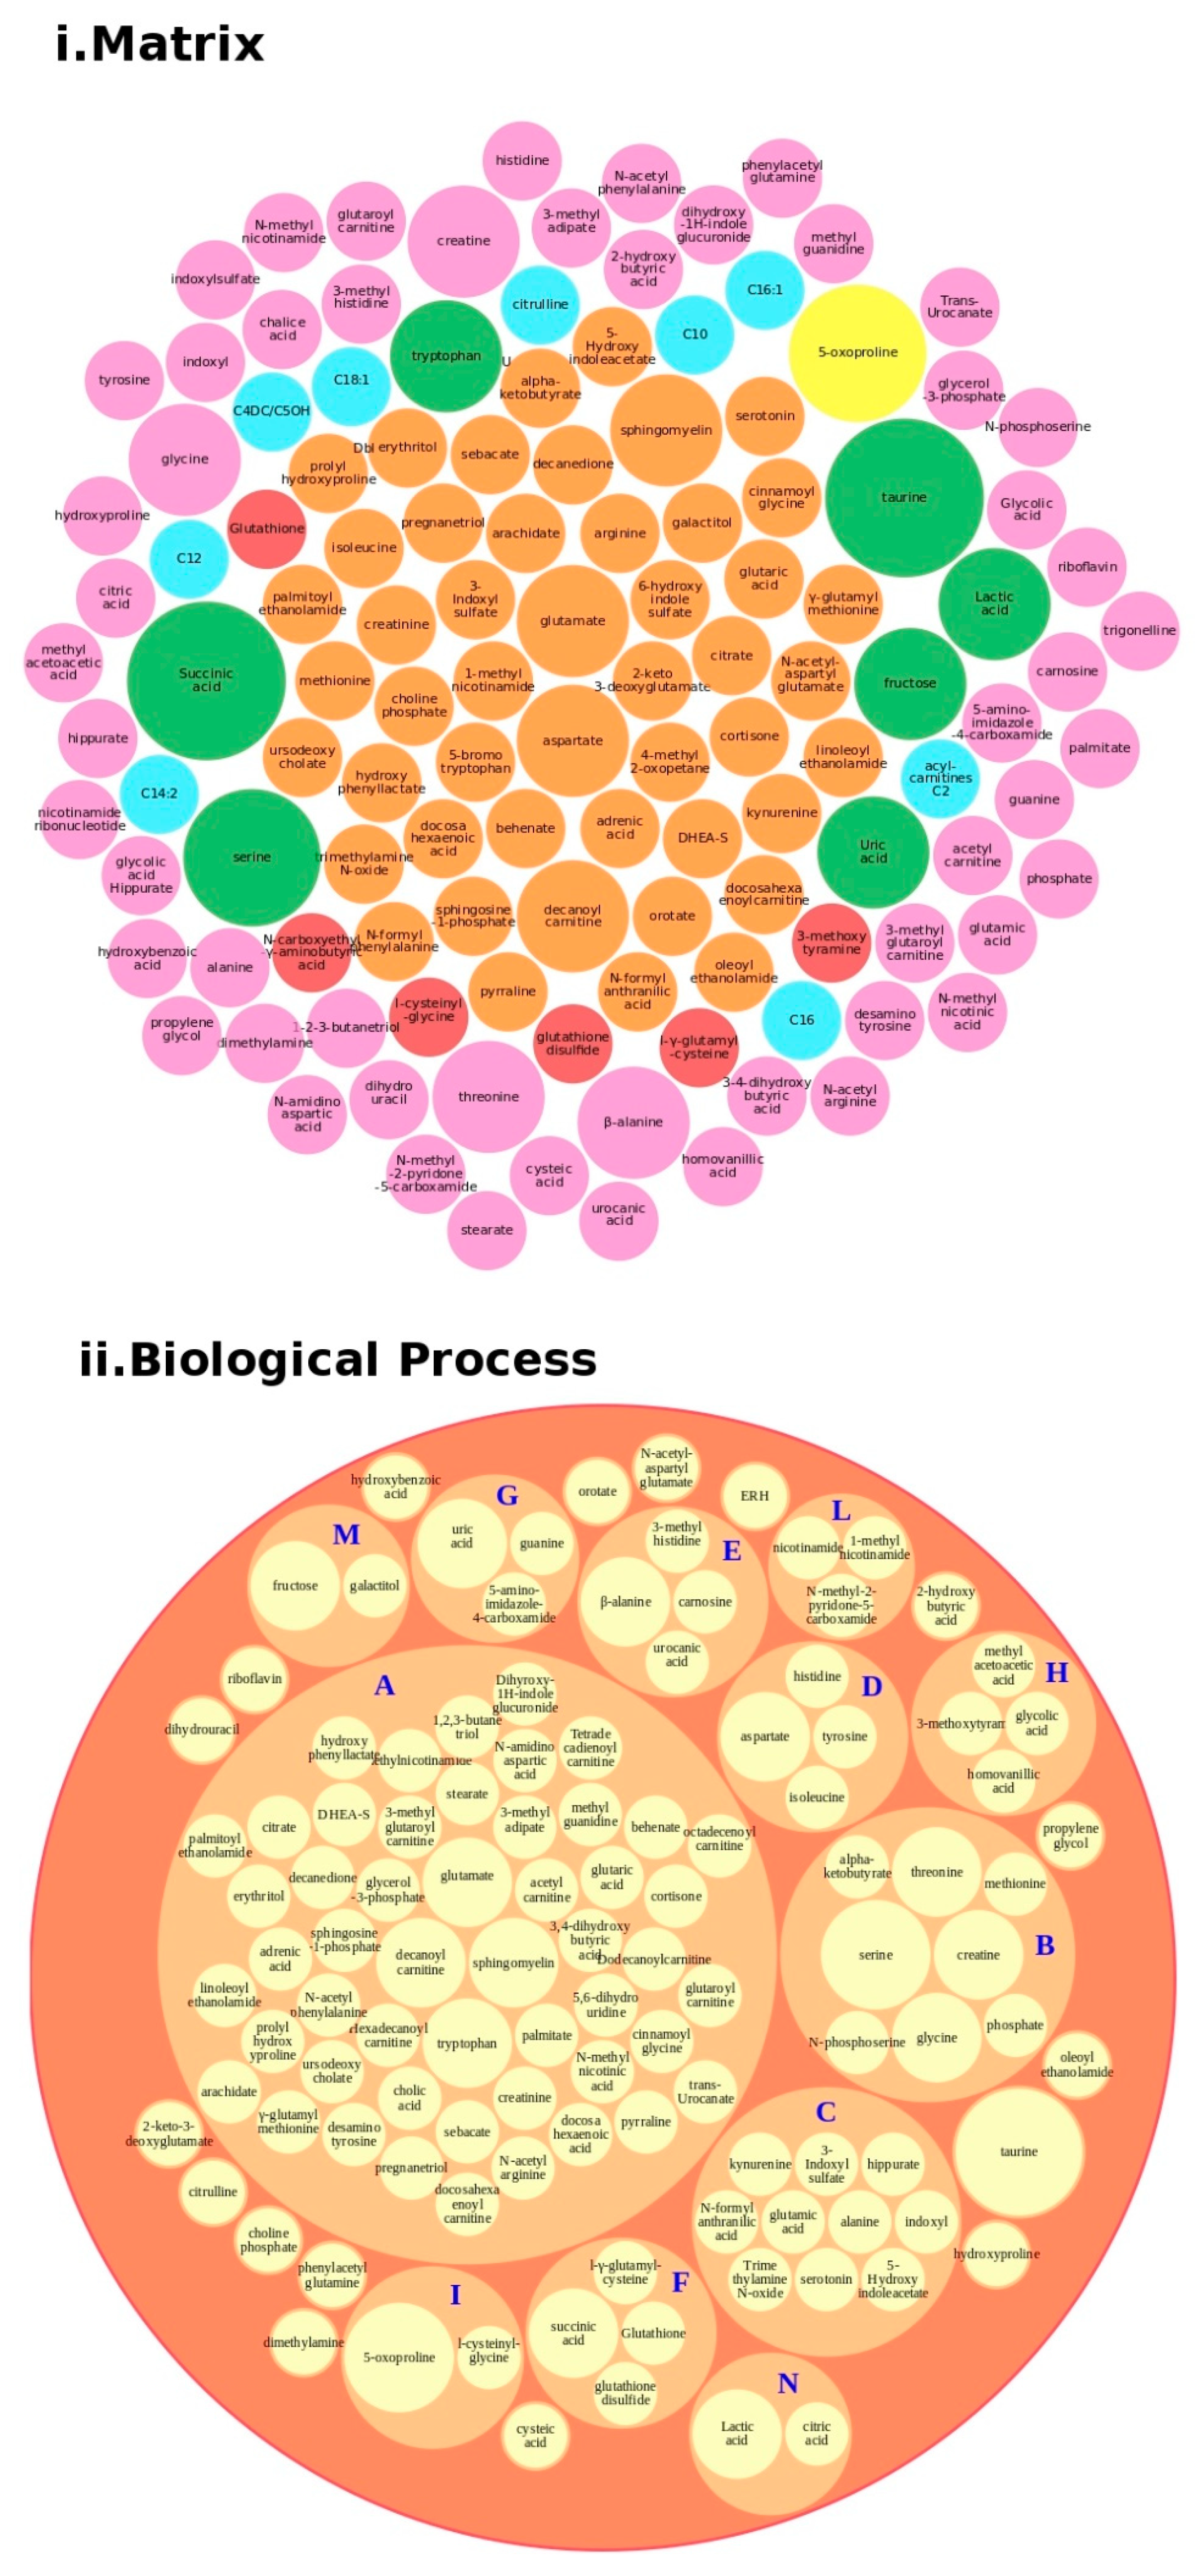
- we started from the complete Human Metabolome Database (HMDB) [82];
- we selected our metabolites, analyzed the classes, subclasses and all terms under the Ontology category and Biochemical Pathway terms, such as biological process and physiological effect, via an ad hoc script in Python;
- we calculated the terms found through ad hoc scripts in Python;
- we designed a bubble chart by taking all of the associated biological processes.
3. Stratification of Complex Disease Phenotypes, Early Interventions and Omics-Generated Biomarkers
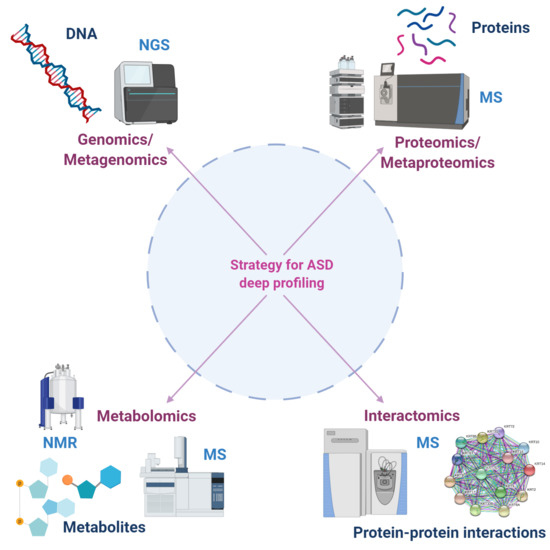
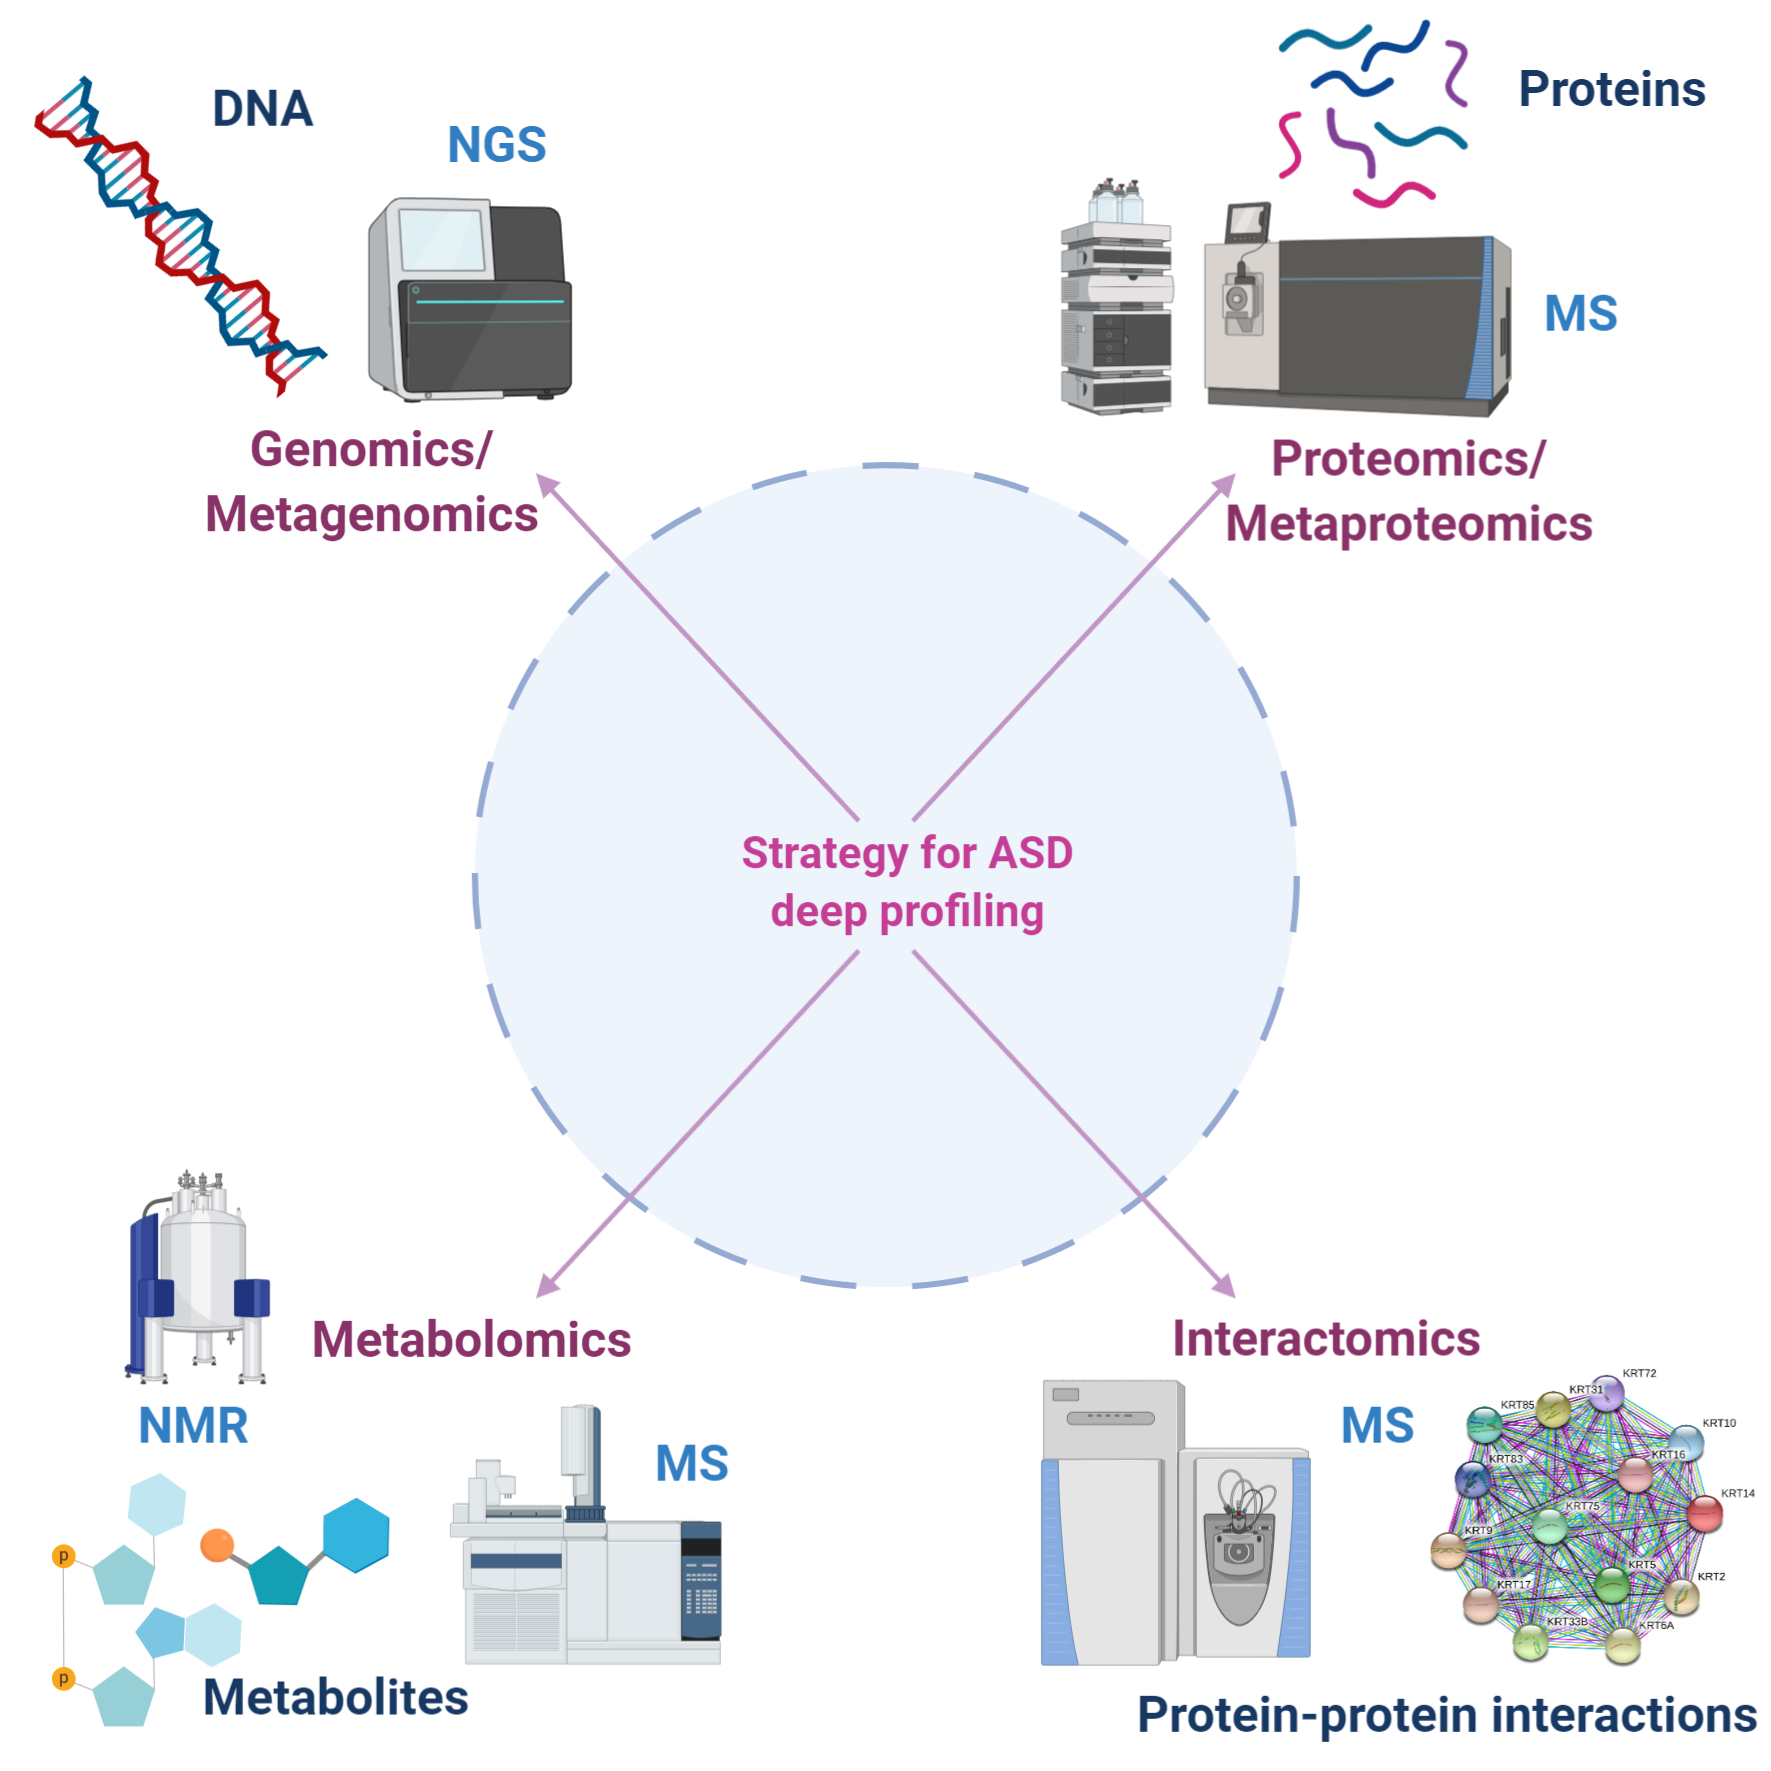
Computational Models Used to Generate Proteomics and Metabolomics Single and Fused Data
4. Translational and Clinical Proteomics
5. Metabolomics
6. Interactome in ASD
7. Clinical Decision Support Systems to Improve Medical Diagnosis on ASD
8. Discussion and Future Prospects
Supplementary Materials
Author Contributions
Funding
Conflicts of Interest
Abbreviations
| 1-DE | one-dimensional gel electrophoresis |
| 2-DE | two-dimensional gel electrophoresis |
| 5′-HT | 5-hydroxytryptamine |
| ADI-R | Autism Diagnostic Interview-Revised |
| ANR | without neurologic regression |
| APO | apolipoprotein |
| AR | neurologic regression |
| ASD | Autism Spectrum Disorders |
| AUC | area under the ROC curve |
| BBB | Blood–brain barrier |
| CDSS | Clinical decision support system |
| CHD8 | chromodomain helicase DNA binding protein 8 |
| CHICA | Child Health Improvement Trough Computer Automation |
| CNTNAP2 | Contactin associated protein-like 2 |
| DB | protein databases |
| DBI | diazepam-binding inhibitor |
| DBS | dried blood spots |
| DHA | docosahexaenoic acid |
| DHEA-S | Dehydroepiandrosterone sulfate |
| DIA | Data-independent analysis |
| DISC1 | Disrupted in Schizophrenia 1 |
| DSS | Decision support systems |
| EC | external calibration |
| EHR | electronic health record |
| ELISA | enzyme-linked immunoadsorbent assay |
| FHR1 | complement factor H-related protein |
| FN1 | fibronectin 1 |
| GC | gas chromatography |
| GI | Gastrointestinal symptoms |
| Glo1 | glyoxalase 1 |
| GSH | glutathione |
| 1H-NMR | proton nuclear magnetic resonance spectroscopy |
| HPLC-MS/MS | high-performance liquid chromatography with tandem mass spectrometry |
| IC | internal calibration |
| ID | identification |
| IPA | Ingenuity Pathway Analysis |
| IS | internal standards |
| LC | liquid chromatography |
| LC-MS/MS | liquid chromatography-tandem mass spectrometry |
| MS | mass spectrometry |
| NGS | Next-generation sequencing |
| NMR | nuclear magnetic resonance spectroscopy |
| PPIs | Protein–protein interactions |
| ROC | receiver operating characteristic |
| S1P | sphingosine 1-phosphate |
| SH3 | SRC Homology 3 Domain |
| SHANK 3 | SH3 and multiple ankyrin repeat domain 3 |
| SIL | Synthetic stable isotope labelled |
| SRM-MS | selected reaction monitoring mass spectrometry |
| SRM/MRM | selected reaction monitoring/multiple reaction monitoring |
| SRS | Social Responsiveness Scale |
| SWATH | Sequential Window Acquisition of all Theoretical Mass Spectra |
| TJ | tight junction |
| TSC | tuberous sclerosis complex |
| TSC1 | tuberous sclerosis 1 |
| TSC2 | tuberous sclerosis 2 |
| tSIL | synthetic labeled tryptic peptides |
| UPLC/Q-TOF MS/MS | ultra-performance liquid chromatography quadrupole time-of-flight tandem mass tandem mass spectrometry |
References
- Nomi, J.S.; Uddin, L.Q. Developmental changes in large-scale network connectivity in autism. Neuroimage Clin. 2015, 7, 732–741. [Google Scholar] [CrossRef] [Green Version]
- Uddin, L.Q.; Supekar, K.; Menon, V. Reconceptualizing functional brain connectivity in autism from a developmental perspective. Front. Hum. Neurosci. 2013, 7, 458. [Google Scholar] [CrossRef] [Green Version]
- Fulceri, F.; Morelli, M.; Santocchi, E.; Cena, H.; Del Bianco, T.; Narzisi, A.; Calderoni, S.; Muratori, F. Gastrointestinal symptoms and behavioral problems in preschoolers with Autism Spectrum Disorder. Dig. Liver Dis. 2016, 48, 248–254. [Google Scholar] [CrossRef]
- Prosperi, M.; Santocchi, E.; Balboni, G.; Narzisi, A.; Bozza, M.; Fulceri, F.; Apicella, F.; Igliozzi, R.; Cosenza, A.; Tancredi, R.; et al. Behavioral phenotype of ASD preschoolers with gastrointestinal symptoms or food selectivity. J. Autism. Dev. Disord. 2017, 47, 3574–3588. [Google Scholar] [CrossRef]
- Erratum: Vol. 67, No. SS-6. MMWR Morb. Mortal. Wkly. Rep. 2018, 67, 564. [CrossRef] [PubMed]
- Baio, J.; Wiggins, L.; Christensen, D.L.; Maenner, M.J.; Daniels, J.; Warren, Z.; Kurzius-Spencer, M.; Zahorodny, W.; Robinson Rosenberg, C.; White, T.; et al. Prevalence of autism spectrum disorder among children aged 8 years—autism and developmental disabilities monitoring network, 11 sites, United States, 2014. MMWR Surveill. Summ. 2018, 67, 1–23. [Google Scholar] [CrossRef] [PubMed]
- Fombonne, E.; Quirke, S.; Hagen, A. Prevalence and interpretation of recent trends in rates of pervasive developmental disorders. Mcgill J. Med. 2009, 12, 73. [Google Scholar] [PubMed]
- Kupfer, D.J.; Regier, D.A.; Narrow, W.E.; American Psychiatric Association. Diagnostic and Statistical Manual of Mental Disorders, 5th ed.; American Psychiatric Association: Philadelphia, PA, USA, 2013; ISBN 978-0-89042-555-8. [Google Scholar]
- Doernberg, E.; Hollander, E. Neurodevelopmental disorders (ASD and ADHD): DSM-5, ICD-10, and ICD-11. CNS Spectr. 2016, 21, 295–299. [Google Scholar] [CrossRef] [PubMed] [Green Version]
- Risch, N.; Hoffmann, T.J.; Anderson, M.; Croen, L.A.; Grether, J.K.; Windham, G.C. Familial recurrence of autism spectrum disorder: Evaluating genetic and environmental contributions. Am. J. Psychiatry 2014, 171, 1206–1213. [Google Scholar] [CrossRef] [PubMed]
- Gaugler, T.; Klei, L.; Sanders, S.J.; Bodea, C.A.; Goldberg, A.P.; Lee, A.B.; Mahajan, M.; Manaa, D.; Pawitan, Y.; Reichert, J.; et al. Most genetic risk for autism resides with common variation. Nat. Genet. 2014, 46, 881–885. [Google Scholar] [CrossRef] [Green Version]
- Huguet, G.; Ey, E.; Bourgeron, T. The genetic landscapes of autism spectrum disorders. Annu. Rev. Genom. Hum. Genet. 2013, 14, 191–213. [Google Scholar] [CrossRef] [PubMed]
- Sandin, S.; Lichtenstein, P.; Kuja-Halkola, R.; Hultman, C.; Larsson, H.; Reichenberg, A. The heritability of autism spectrum disorder. JAMA 2017, 318, 1182–1184. [Google Scholar] [CrossRef]
- Durand, C.M.; Betancur, C.; Boeckers, T.M.; Bockmann, J.; Chaste, P.; Fauchereau, F.; Nygren, G.; Rastam, M.; Gillberg, I.C.; Anckarsäter, H.; et al. Mutations in the gene encoding the synaptic scaffolding protein SHANK3 are associated with autism spectrum disorders. Nat. Genet. 2007, 39, 25–27. [Google Scholar] [CrossRef] [PubMed] [Green Version]
- Griswold, A.J.; Ma, D.; Cukier, H.N.; Nations, L.D.; Schmidt, M.A.; Chung, R.-H.; Jaworski, J.M.; Salyakina, D.; Konidari, I.; Whitehead, P.L.; et al. Evaluation of copy number variations reveals novel candidate genes in autism spectrum disorder-associated pathways. Hum. Mol. Genet. 2012, 21, 3513–3523. [Google Scholar] [CrossRef] [PubMed] [Green Version]
- Higdon, R.; Earl, R.K.; Stanberry, L.; Hudac, C.M.; Montague, E.; Stewart, E.; Janko, I.; Choiniere, J.; Broomall, W.; Kolker, N.; et al. The promise of multi-omics and clinical data integration to identify and target personalized healthcare approaches in autism spectrum disorders. OMICS 2015, 19, 197–208. [Google Scholar] [CrossRef] [PubMed] [Green Version]
- Shen, L.; Liu, X.; Zhang, H.; Lin, J.; Feng, C.; Iqbal, J. Biomarkers in autism spectrum disorders: Current progress. Clin. Chim. Acta 2020, 502, 41–54. [Google Scholar] [CrossRef]
- Shen, L.; Zhao, Y.; Zhang, H.; Feng, C.; Gao, Y.; Zhao, D.; Xia, S.; Hong, Q.; Iqbal, J.; Liu, X.K.; et al. Advances in biomarker studies in autism spectrum disorders. Adv. Exp. Med. Biol. 2019, 1118, 207–233. [Google Scholar] [CrossRef]
- Ruggeri, B.; Sarkans, U.; Schumann, G.; Persico, A.M. Biomarkers in autism spectrum disorder: The old and the new. Psychopharmacology 2014, 231, 1201–1216. [Google Scholar] [CrossRef]
- de Theije, C.G.M.; Wu, J.; da Silva, S.L.; Kamphuis, P.J.; Garssen, J.; Korte, S.M.; Kraneveld, A.D. Pathways underlying the gut-to-brain connection in autism spectrum disorders as future targets for disease management. Eur. J. Pharmacol. 2011, 668, S70–S80. [Google Scholar] [CrossRef]
- Lai, M.-C.; Lombardo, M.V.; Baron-Cohen, S. Autism. Lancet 2014, 383, 896–910. [Google Scholar] [CrossRef]
- Raz, R.; Roberts, A.L.; Lyall, K.; Hart, J.E.; Just, A.C.; Laden, F.; Weisskopf, M.G. Autism spectrum disorder and particulate matter air pollution before, during, and after pregnancy: A nested case-control analysis within the Nurses’ Health Study II Cohort. Environ. Health Perspect. 2015, 123, 264–270. [Google Scholar] [CrossRef] [PubMed]
- Modabbernia, A.; Velthorst, E.; Reichenberg, A. Environmental risk factors for autism: An evidence-based review of systematic reviews and meta-analyses. Mol. Autism 2017, 8, 13. [Google Scholar] [CrossRef] [PubMed] [Green Version]
- Geschwind, D.H.; Levitt, P. Autism spectrum disorders: Developmental disconnection syndromes. Curr. Opin. Neurobiol. 2007, 17, 103–111. [Google Scholar] [CrossRef] [PubMed]
- Hegarty, J.P.; Lazzeroni, L.C.; Raman, M.M.; Pegoraro, L.F.L.; Monterrey, J.C.; Cleveland, S.C.; Hallmayer, J.F.; Wolke, O.N.; Phillips, J.M.; Reiss, A.L.; et al. Genetic and environmental influences on lobar brain structures in twins with autism. Cereb. Cortex 2019. [Google Scholar] [CrossRef] [PubMed]
- Gorrindo, P.; Williams, K.C.; Lee, E.B.; Walker, L.S.; McGrew, S.G.; Levitt, P. Gastrointestinal dysfunction in autism: Parental report, clinical evaluation, and associated factors. Autism Res. 2012, 5, 101–108. [Google Scholar] [CrossRef] [PubMed]
- Adams, J.B.; Johansen, L.J.; Powell, L.D.; Quig, D.; Rubin, R.A. Gastrointestinal flora and gastrointestinal status in children with autism—comparisons to typical children and correlation with autism severity. BMC Gastroenterol. 2011, 11. [Google Scholar] [CrossRef] [Green Version]
- Wang, L.W.; Tancredi, D.J.; Thomas, D.W. The prevalence of gastrointestinal problems in children across the United States with autism spectrum disorders from families with multiple affected members. J. Dev. Behav. Pediatr. 2011, 32, 351–360. [Google Scholar] [CrossRef]
- Chaidez, V.; Hansen, R.L.; Hertz-Picciotto, I. Gastrointestinal problems in children with autism, developmental delays or typical development. J. Autism Dev. Disord 2014, 44, 1117–1127. [Google Scholar] [CrossRef] [Green Version]
- Tomova, A.; Husarova, V.; Lakatosova, S.; Bakos, J.; Vlkova, B.; Babinska, K.; Ostatnikova, D. Gastrointestinal microbiota in children with autism in Slovakia. Physiol. Behav. 2015, 138, 179–187. [Google Scholar] [CrossRef]
- Bresnahan, M.; Hornig, M.; Schultz, A.F.; Gunnes, N.; Hirtz, D.; Lie, K.K.; Magnus, P.; Reichborn-Kjennerud, T.; Roth, C.; Schjølberg, S.; et al. Association of maternal report of infant and toddler gastrointestinal symptoms with autism: Evidence from a prospective birth cohort. JAMA Psychiatry 2015, 72, 466–474. [Google Scholar] [CrossRef] [Green Version]
- Valicenti-McDermott, M.; McVicar, K.; Rapin, I.; Wershil, B.K.; Cohen, H.; Shinnar, S. Frequency of gastrointestinal symptoms in children with autistic spectrum disorders and association with family history of autoimmune disease. J. Dev. Behav. Pediatr. 2006, 27, S128–S136. [Google Scholar] [CrossRef]
- Horvath, K.; Perman, J.A. Autistic disorder and gastrointestinal disease. Curr. Opin. Pediatr. 2002, 14, 583–587. [Google Scholar] [CrossRef] [PubMed]
- Peters, B.; Williams, K.C.; Gorrindo, P.; Rosenberg, D.; Lee, E.B.; Levitt, P.; Veenstra-VanderWeele, J. Rigid-compulsive behaviors are associated with mixed bowel symptoms in autism spectrum disorder. J. Autism Dev. Disord 2014, 44, 1425–1432. [Google Scholar] [CrossRef] [PubMed] [Green Version]
- Marler, S.; Ferguson, B.J.; Lee, E.B.; Peters, B.; Williams, K.C.; McDonnell, E.; Macklin, E.A.; Levitt, P.; Margolis, K.G.; Beversdorf, D.Q.; et al. Association of rigid-compulsive behavior with functional constipation in autism spectrum disorder. J. Autism Dev. Disord 2017, 47, 1673–1681. [Google Scholar] [CrossRef]
- Mazurek, M.O.; Vasa, R.A.; Kalb, L.G.; Kanne, S.M.; Rosenberg, D.; Keefer, A.; Murray, D.S.; Freedman, B.; Lowery, L.A. Anxiety, sensory over-responsivity, and gastrointestinal problems in children with autism spectrum disorders. J. Abnorm. Child. Psychol. 2013, 41, 165–176. [Google Scholar] [CrossRef] [PubMed]
- Maenner, M.J.; Arneson, C.L.; Levy, S.E.; Kirby, R.S.; Nicholas, J.S.; Durkin, M.S. Brief report: Association between behavioral features and gastrointestinal problems among children with autism spectrum disorder. J. Autism Dev. Disord 2012, 42, 1520–1525. [Google Scholar] [CrossRef] [PubMed]
- Molloy, C.A.; Manning-Courtney, P. Prevalence of chronic gastrointestinal symptoms in children with autism and autistic spectrum disorders. Autism 2003, 7, 165–171. [Google Scholar] [CrossRef]
- Parracho, H.M.R.T.; Bingham, M.O.; Gibson, G.R.; McCartney, A.L. Differences between the gut microflora of children with autistic spectrum disorders and that of healthy children. J. Med. Microbiol. 2005, 54, 987–991. [Google Scholar] [CrossRef]
- Taylor, B.; Miller, E.; Lingam, R.; Andrews, N.; Simmons, A.; Stowe, J. Measles, mumps, and rubella vaccination and bowel problems or developmental regression in children with autism: Population study. BMJ 2002, 324, 393–396. [Google Scholar] [CrossRef] [Green Version]
- Fombonne, E.; Chakrabarti, S. No evidence for a new variant of measles-mumps-rubella-induced autism. Pediatrics 2001, 108, E58. [Google Scholar] [CrossRef] [Green Version]
- Xue, M.; Brimacombe, M.; Chaaban, J.; Zimmerman-Bier, B.; Wagner, G.C. Autism spectrum disorders: Concurrent clinical disorders. J. Child. Neurol. 2008, 23, 6–13. [Google Scholar] [CrossRef]
- Stilling, R.M.; Bordenstein, S.R.; Dinan, T.G.; Cryan, J.F. Friends with social benefits: Host-microbe interactions as a driver of brain evolution and development? Front. Cell Infect. Microbiol. 2014, 4, 147. [Google Scholar] [CrossRef] [PubMed] [Green Version]
- de Angelis, M.; Piccolo, M.; Vannini, L.; Siragusa, S.; de Giacomo, A.; Serrazzanetti, D.I.; Cristofori, F.; Guerzoni, M.E.; Gobbetti, M.; Francavilla, R. Fecal microbiota and metabolome of children with autism and pervasive developmental disorder not otherwise specified. PLoS ONE 2013, 8, e76993. [Google Scholar] [CrossRef] [Green Version]
- Kang, D.-W.; Park, J.G.; Ilhan, Z.E.; Wallstrom, G.; Labaer, J.; Adams, J.B.; Krajmalnik-Brown, R. Reduced incidence of Prevotella and other fermenters in intestinal microflora of autistic children. PLoS ONE 2013, 8, e68322. [Google Scholar] [CrossRef] [Green Version]
- Williams, B.L.; Hornig, M.; Buie, T.; Bauman, M.L.; Cho Paik, M.; Wick, I.; Bennett, A.; Jabado, O.; Hirschberg, D.L.; Lipkin, W.I. Impaired carbohydrate digestion and transport and mucosal dysbiosis in the intestines of children with autism and gastrointestinal disturbances. PLoS ONE 2011, 6, e24585. [Google Scholar] [CrossRef] [PubMed] [Green Version]
- Ristori, M.V.; Quagliariello, A.; Reddel, S.; Ianiro, G.; Vicari, S.; Gasbarrini, A.; Putignani, L. Autism, gastrointestinal symptoms and modulation of gut microbiota by nutritional interventions. Nutrients 2019, 11. [Google Scholar] [CrossRef] [Green Version]
- Falkmer, T.; Anderson, K.; Falkmer, M.; Horlin, C. Diagnostic procedures in autism spectrum disorders: A systematic literature review. Eur. Child. Adolesc. Psychiatry 2013, 22, 329–340. [Google Scholar] [CrossRef]
- Putignani, L.; Gasbarrini, A.; Dallapiccola, B. Potential of multiomics technology in precision medicine. Curr. Opin. Gastroenterol. 2019, 35, 491–498. [Google Scholar] [CrossRef]
- Junaid, M.A.; Kowal, D.; Barua, M.; Pullarkat, P.S.; Sklower Brooks, S.; Pullarkat, R.K. Proteomic studies identified a single nucleotide polymorphism in glyoxalase I as autism susceptibility factor. Am. J. Med. Genet. A 2004, 131, 11–17. [Google Scholar] [CrossRef] [Green Version]
- Broek, J.A.; Guest, P.C.; Rahmoune, H.; Bahn, S. Proteomic analysis of post mortem brain tissue from autism patients: Evidence for opposite changes in prefrontal cortex and cerebellum in synaptic connectivity-related proteins. Mol. Autism 2014, 5, 41. [Google Scholar] [CrossRef] [Green Version]
- Wingo, A.P.; Dammer, E.B.; Breen, M.S.; Logsdon, B.A.; Duong, D.M.; Troncosco, J.C.; Thambisetty, M.; Beach, T.G.; Serrano, G.E.; Reiman, E.M.; et al. Large-scale proteomic analysis of human brain identifies proteins associated with cognitive trajectory in advanced age. Nat. Commun. 2019, 10, 1619. [Google Scholar] [CrossRef] [PubMed] [Green Version]
- Corbett, B.A.; Kantor, A.B.; Schulman, H.; Walker, W.L.; Lit, L.; Ashwood, P.; Rocke, D.M.; Sharp, F.R. A proteomic study of serum from children with autism showing differential expression of apolipoproteins and complement proteins. Mol. Psychiatry 2007, 12, 292–306. [Google Scholar] [CrossRef] [PubMed]
- Ngounou, W.A.G.; Wormwood, K.; Thome, J.; Dudley, E.; Taurines, R.; Gerlach, M.; Woods, A.G.; Darie, C.C. A pilot proteomic study of protein markers in autism spectrum disorder. Electrophoresis 2014, 35, 2046–2054. [Google Scholar] [CrossRef] [PubMed]
- Steeb, H.; Ramsey, J.M.; Guest, P.C.; Stocki, P.; Cooper, J.D.; Rahmoune, H.; Ingudomnukul, E.; Auyeung, B.; Ruta, L.; Baron-Cohen, S.; et al. Serum proteomic analysis identifies sex-specific differences in lipid metabolism and inflammation profiles in adults diagnosed with Asperger syndrome. Mol. Autism 2014, 5, 4. [Google Scholar] [CrossRef] [PubMed] [Green Version]
- Yang, J.; Chen, Y.; Xiong, X.; Zhou, X.; Han, L.; Ni, L.; Wang, W.; Wang, X.; Zhao, L.; Shao, D.; et al. Peptidome analysis reveals novel serum biomarkers for children with autism spectrum disorder in china. Proteomics Clin. Appl. 2018, 12, e1700164. [Google Scholar] [CrossRef]
- Cortelazzo, A.; de Felice, C.; Guerranti, R.; Signorini, C.; Leoncini, S.; Zollo, G.; Leoncini, R.; Timperio, A.M.; Zolla, L.; Ciccoli, L.; et al. Expression and oxidative modifications of plasma proteins in autism spectrum disorders: Interplay between inflammatory response and lipid peroxidation. Proteomics Clin. Appl. 2016, 10, 1103–1112. [Google Scholar] [CrossRef]
- Feng, C.; Chen, Y.; Pan, J.; Yang, A.; Niu, L.; Min, J.; Meng, X.; Liao, L.; Zhang, K.; Shen, L. Redox proteomic identification of carbonylated proteins in autism plasma: Insight into oxidative stress and its related biomarkers in autism. Clin. Proteomics 2017, 14, 2. [Google Scholar] [CrossRef] [Green Version]
- Shen, L.; Zhang, K.; Feng, C.; Chen, Y.; Li, S.; Iqbal, J.; Liao, L.; Zhao, Y.; Zhai, J. iTRAQ-based proteomic analysis reveals protein profile in plasma from children with autism. Proteomics Clin. Appl. 2018, 12. [Google Scholar] [CrossRef]
- Castagnola, M.; Messana, I.; Inzitari, R.; Fanali, C.; Cabras, T.; Morelli, A.; Pecoraro, A.M.; Neri, G.; Torrioli, M.G.; Gurrieri, F. Hypo-phosphorylation of salivary peptidome as a clue to the molecular pathogenesis of autism spectrum disorders. J. Proteome Res. 2008, 7, 5327–5332. [Google Scholar] [CrossRef]
- Ngounou, W.A.G.; Wormwood, K.L.; Charette, L.; Ryan, J.P.; Woods, A.G.; Darie, C.C. Comparative two-dimensional polyacrylamide gel electrophoresis of the salivary proteome of children with autism spectrum disorder. J. Cell. Mol. Med. 2015, 19, 2664–2678. [Google Scholar] [CrossRef]
- Ngounou, W.A.G.; Wormwood, K.L.; Russell, S.; Ryan, J.P.; Darie, C.C.; Woods, A.G. A Pilot proteomic analysis of salivary biomarkers in autism spectrum disorder. Autism Res. 2015, 8, 338–350. [Google Scholar] [CrossRef] [PubMed]
- Suganya, V.; Geetha, A.; Sujatha, S. Urine proteome analysis to evaluate protein biomarkers in children with autism. Clin. Chim. Acta 2015, 450, 210–219. [Google Scholar] [CrossRef] [PubMed]
- Pichitpunpong, C.; Thongkorn, S.; Kanlayaprasit, S.; Yuwattana, W.; Plaingam, W.; Sangsuthum, S.; Aizat, W.M.; Baharum, S.N.; Tencomnao, T.; Hu, V.W.; et al. Phenotypic subgrouping and multi-omics analyses reveal reduced diazepam-binding inhibitor (DBI) protein levels in autism spectrum disorder with severe language impairment. PLoS ONE 2019, 14, e0214198. [Google Scholar] [CrossRef] [PubMed] [Green Version]
- Graham, S.F.; Chevallier, O.P.; Kumar, P.; Türkoğlu, O.; Bahado-Singh, R.O. High resolution metabolomic analysis of ASD human brain uncovers novel biomarkers of disease. Metabolomics 2016, 12, 62. [Google Scholar] [CrossRef]
- Kurochkin, I.; Khrameeva, E.; Tkachev, A.; Stepanova, V.; Vanyushkina, A.; Stekolshchikova, E.; Li, Q.; Zubkov, D.; Shichkova, P.; Halene, T.; et al. Metabolome signature of autism in the human prefrontal cortex. Commun. Biol. 2019, 2, 234. [Google Scholar] [CrossRef] [PubMed]
- Kuwabara, H.; Yamasue, H.; Koike, S.; Inoue, H.; Kawakubo, Y.; Kuroda, M.; Takano, Y.; Iwashiro, N.; Natsubori, T.; Aoki, Y.; et al. Altered metabolites in the plasma of autism spectrum disorder: A capillary electrophoresis time-of-flight mass spectroscopy study. PLoS ONE 2013, 8, e73814. [Google Scholar] [CrossRef] [PubMed]
- West, P.R.; Amaral, D.G.; Bais, P.; Smith, A.M.; Egnash, L.A.; Ross, M.E.; Palmer, J.A.; Fontaine, B.R.; Conard, K.R.; Corbett, B.A.; et al. Metabolomics as a tool for discovery of biomarkers of autism spectrum disorder in the blood plasma of children. PLoS ONE 2014, 9, e112445. [Google Scholar] [CrossRef]
- Wang, H.; Liang, S.; Wang, M.; Gao, J.; Sun, C.; Wang, J.; Xia, W.; Wu, S.; Sumner, S.J.; Zhang, F.; et al. Potential serum biomarkers from a metabolomics study of autism. J. Psychiatry Neurosci. 2016, 41, 27–37. [Google Scholar] [CrossRef] [Green Version]
- Rangel-Huerta, O.D.; Gomez-Fernández, A.; de la Torre-Aguilar, M.J.; Gil, A.; Perez-Navero, J.L.; Flores-Rojas, K.; Martín-Borreguero, P.; Gil-Campos, M. Metabolic profiling in children with autism spectrum disorder with and without mental regression: Preliminary results from a cross-sectional case-control study. Metabolomics 2019, 15, 99. [Google Scholar] [CrossRef]
- Kelly, R.S.; Boulin, A.; Laranjo, N.; Lee-Sarwar, K.; Chu, S.H.; Yadama, A.P.; Carey, V.; Litonjua, A.A.; Lasky-Su, J.; Weiss, S.T. Metabolomics and communication skills development in children; evidence from the ages and stages questionnaire. Metabolites 2019, 9. [Google Scholar] [CrossRef] [Green Version]
- Yap, I.K.S.; Angley, M.; Veselkov, K.A.; Holmes, E.; Lindon, J.C.; Nicholson, J.K. Urinary metabolic phenotyping differentiates children with autism from their unaffected siblings and age-matched controls. J. Proteome Res. 2010, 9, 2996–3004. [Google Scholar] [CrossRef] [PubMed] [Green Version]
- Ming, X.; Stein, T.P.; Barnes, V.; Rhodes, N.; Guo, L. Metabolic perturbance in autism spectrum disorders: A metabolomics study. J. Proteome Res. 2012, 11, 5856–5862. [Google Scholar] [CrossRef] [PubMed]
- Mavel, S.; Nadal-Desbarats, L.; Blasco, H.; Bonnet-Brilhault, F.; Barthélémy, C.; Montigny, F.; Sarda, P.; Laumonnier, F.; Vourc’h, P.; Andres, C.R.; et al. 1H-13C NMR-based urine metabolic profiling in autism spectrum disorders. Talanta 2013, 114, 95–102. [Google Scholar] [CrossRef] [PubMed] [Green Version]
- Emond, P.; Mavel, S.; Aïdoud, N.; Nadal-Desbarats, L.; Montigny, F.; Bonnet-Brilhault, F.; Barthélémy, C.; Merten, M.; Sarda, P.; Laumonnier, F.; et al. GC-MS-based urine metabolic profiling of autism spectrum disorders. Anal. Bioanal. Chem. 2013, 405, 5291–5300. [Google Scholar] [CrossRef] [PubMed] [Green Version]
- Noto, A.; Fanos, V.; Barberini, L.; Grapov, D.; Fattuoni, C.; Zaffanello, M.; Casanova, A.; Fenu, G.; de Giacomo, A.; De Angelis, M.; et al. The urinary metabolomics profile of an Italian autistic children population and their unaffected siblings. J. Matern. Fetal. Neonatal. Med. 2014, 27, 46–52. [Google Scholar] [CrossRef] [PubMed]
- Diémé, B.; Mavel, S.; Blasco, H.; Tripi, G.; Bonnet-Brilhault, F.; Malvy, J.; Bocca, C.; Andres, C.R.; Nadal-Desbarats, L.; Emond, P. Metabolomics study of urine in autism spectrum disorders using a multiplatform analytical methodology. J. Proteome Res. 2015, 14, 5273–5282. [Google Scholar] [CrossRef] [Green Version]
- Bitar, T.; Mavel, S.; Emond, P.; Nadal-Desbarats, L.; Lefèvre, A.; Mattar, H.; Soufia, M.; Blasco, H.; Vourc’h, P.; Hleihel, W.; et al. Identification of metabolic pathway disturbances using multimodal metabolomics in autistic disorders in a Middle Eastern population. J. Pharm. Biomed. Anal. 2018, 152, 57–65. [Google Scholar] [CrossRef]
- Barone, R.; Alaimo, S.; Messina, M.; Pulvirenti, A.; Bastin, J.; Ferro, A.; Frye, R.E.; Rizzo, R.; MIMIC-Autism Group. A subset of patients with autism spectrum disorders show a distinctive metabolic profile by dried blood spot analyses. Front. Psychiatry 2018, 9, 636. [Google Scholar] [CrossRef] [Green Version]
- UniProt Consortium. UniProt: A worldwide hub of protein knowledge. Nucleic Acids Res. 2019, 47, D506–D515. [Google Scholar] [CrossRef] [Green Version]
- The Gene Ontology Consortium. The Gene Ontology Resource: 20 years and still GOing strong. Nucleic Acids Res. 2019, 47, D330–D338. [Google Scholar] [CrossRef] [Green Version]
- Wishart, D.S.; Feunang, Y.D.; Marcu, A.; Guo, A.C.; Liang, K.; Vázquez-Fresno, R.; Sajed, T.; Johnson, D.; Li, C.; Karu, N.; et al. HMDB 4.0: The human metabolome database for 2018. Nucleic Acids Res. 2018, 46, D608–D617. [Google Scholar] [CrossRef] [PubMed]
- DiCicco-Bloom, E.; Lord, C.; Zwaigenbaum, L.; Courchesne, E.; Dager, S.R.; Schmitz, C.; Schultz, R.T.; Crawley, J.; Young, L.J. The developmental neurobiology of autism spectrum disorder. J. Neurosci. 2006, 26, 6897–6906. [Google Scholar] [CrossRef] [PubMed] [Green Version]
- Zachor, D.A. Autism spectrum disorders–a syndrome on the rise: Risk factors and advances in early detection and intervention. Harefuah 2012, 151, 162–164. [Google Scholar] [PubMed]
- Dawson, G. Early behavioral intervention, brain plasticity, and the prevention of autism spectrum disorder. Dev. Psychopathol. 2008, 20, 775–803. [Google Scholar] [CrossRef] [PubMed]
- Saeliw, T.; Tangsuwansri, C.; Thongkorn, S.; Chonchaiya, W.; Suphapeetiporn, K.; Mutirangura, A.; Tencomnao, T.; Hu, V.W.; Sarachana, T. Integrated genome-wide Alu methylation and transcriptome profiling analyses reveal novel epigenetic regulatory networks associated with autism spectrum disorder. Mol. Autism 2018, 9, 27. [Google Scholar] [CrossRef] [Green Version]
- Talebizadeh, Z.; Arking, D.E.; Hu, V.W. A novel stratification method in linkage studies to address inter and intra-family heterogeneity in autism. PLoS ONE 2013, 8, e67569. [Google Scholar] [CrossRef]
- Hu, V.W.; Frank, B.C.; Heine, S.; Lee, N.H.; Quackenbush, J. Gene expression profiling of lymphoblastoid cell lines from monozygotic twins discordant in severity of autism reveals differential regulation of neurologically relevant genes. BMC Genom. 2006, 7, 118. [Google Scholar] [CrossRef]
- Hu, V.W.; Sarachana, T.; Kim, K.S.; Nguyen, A.; Kulkarni, S.; Steinberg, M.E.; Luu, T.; Lai, Y.; Lee, N.H. Gene expression profiling differentiates autism case-controls and phenotypic variants of autism spectrum disorders: Evidence for circadian rhythm dysfunction in severe autism. Autism Res. 2009, 2, 78–97. [Google Scholar] [CrossRef] [Green Version]
- Hu, V.W.; Lai, Y. Developing a predictive gene classifier for autism spectrum disorders based upon differential gene expression profiles of phenotypic subgroups. North. Am. J. Med. Sci. 2013, 6. [Google Scholar] [CrossRef]
- Karahalil, B. Overview of systems biology and omics technologies. Curr. Med. Chem. 2016, 23, 4221–4230. [Google Scholar] [CrossRef]
- del Chierico, F.; Nobili, V.; Vernocchi, P.; Russo, A.; de Stefanis, C.; Gnani, D.; Furlanello, C.; Zandonà, A.; Paci, P.; Capuani, G.; et al. Gut microbiota profiling of pediatric nonalcoholic fatty liver disease and obese patients unveiled by an integrated meta-omics-based approach. Hepatology 2017, 65, 451–464. [Google Scholar] [CrossRef] [PubMed]
- Vernocchi, P.; del Chierico, F.; Russo, A.; Majo, F.; Rossitto, M.; Valerio, M.; Casadei, L.; La Storia, A.; de Filippis, F.; Rizzo, C.; et al. Gut microbiota signatures in cystic fibrosis: Loss of host CFTR function drives the microbiota enterophenotype. PLoS ONE 2018, 13, e0208171. [Google Scholar] [CrossRef] [PubMed]
- del Chierico, F.; Vernocchi, P.; Petrucca, A.; Paci, P.; Fuentes, S.; Praticò, G.; Capuani, G.; Masotti, A.; Reddel, S.; Russo, A.; et al. Phylogenetic and metabolic tracking of gut microbiota during perinatal development. PLoS ONE 2015, 10, e0137347. [Google Scholar] [CrossRef] [PubMed] [Green Version]
- Miccheli, A.; Capuani, G.; Marini, F.; Tomassini, A.; Praticò, G.; Ceccarelli, S.; Gnani, D.; Baviera, G.; Alisi, A.; Putignani, L.; et al. Urinary (1)H-NMR-based metabolic profiling of children with NAFLD undergoing VSL#3 treatment. Int. J. Obes. 2015, 39, 1118–1125. [Google Scholar] [CrossRef]
- Szymańska, E.; Saccenti, E.; Smilde, A.K.; Westerhuis, J.A. Double-check: Validation of diagnostic statistics for PLS-DA models in metabolomics studies. Metabolomics 2012, 8, 3–16. [Google Scholar] [CrossRef] [Green Version]
- Domon, B.; Aebersold, R. Options and considerations when selecting a quantitative proteomics strategy. Nat. Biotechnol. 2010, 28, 710–721. [Google Scholar] [CrossRef] [PubMed]
- Oeckl, P.; Steinacker, P.; Otto, M. Comparison of internal standard approaches for srm analysis of alpha-synuclein in cerebrospinal fluid. J. Proteome Res. 2018, 17, 516–523. [Google Scholar] [CrossRef] [Green Version]
- Shuford, C.M.; Walters, J.J.; Holland, P.M.; Sreenivasan, U.; Askari, N.; Ray, K.; Grant, R.P. Absolute protein quantification by mass spectrometry: Not as simple as advertised. Anal. Chem. 2017, 89, 7406–7415. [Google Scholar] [CrossRef]
- Pino, L.K.; Searle, B.C.; Huang, E.L.; Noble, W.S.; Hoofnagle, A.N.; MacCoss, M.J. Calibration using a single-point external reference material harmonizes quantitative mass spectrometry proteomics data between platforms and laboratories. Anal. Chem. 2018, 90, 13112–13117. [Google Scholar] [CrossRef]
- Schubert, O.T.; Gillet, L.C.; Collins, B.C.; Navarro, P.; Rosenberger, G.; Wolski, W.E.; Lam, H.; Amodei, D.; Mallick, P.; MacLean, B.; et al. Building high-quality assay libraries for targeted analysis of SWATH MS data. Nat. Protoc. 2015, 10, 426–441. [Google Scholar] [CrossRef]
- Levi Mortera, S.; Soggiu, A.; Vernocchi, P.; del Chierico, F.; Piras, C.; Carsetti, R.; Marzano, V.; Britti, D.; Urbani, A.; Roncada, P.; et al. Metaproteomic investigation to assess gut microbiota shaping in newborn mice: A combined taxonomic, functional and quantitative approach. J. Proteom. 2019, 203, 103378. [Google Scholar] [CrossRef] [PubMed]
- Slavomíra, N.; Zdeno, Š.; Andrej, K.; vana, F.; Gábor, B.; Maksym, D. Corrigendum to ”Cucumber mosaic virus resistance: Comparative proteomics of contrasting Cucumis sativus cultivars after long-term infection”. J. Proteom. 2020, 214, 103674. [Google Scholar] [CrossRef]
- Wang, M.; Jarmusch, A.K.; Vargas, F.; Aksenov, A.A.; Gauglitz, J.M.; Weldon, K.; Petras, D.; da Silva, R.; Quinn, R.; Melnik, A.V.; et al. Mass spectrometry searches using MASST. Nat. Biotechnol. 2020, 38, 23–26. [Google Scholar] [CrossRef]
- Kalsner, L.; Twachtman-Bassett, J.; Tokarski, K.; Stanley, C.; Dumont-Mathieu, T.; Cotney, J.; Chamberlain, S. Genetic testing including targeted gene panel in a diverse clinical population of children with autism spectrum disorder: Findings and implications. Mol. Genet. Genomic Med. 2018, 6, 171–185. [Google Scholar] [CrossRef] [PubMed]
- Won, H.; Mah, W.; Kim, E. Autism spectrum disorder causes, mechanisms, and treatments: Focus on neuronal synapses. Front. Mol. Neurosci. 2013, 6, 19. [Google Scholar] [CrossRef] [PubMed] [Green Version]
- Wang, P.; Mokhtari, R.; Pedrosa, E.; Kirschenbaum, M.; Bayrak, C.; Zheng, D.; Lachman, H.M. CRISPR/Cas9-mediated heterozygous knockout of the autism gene CHD8 and characterization of its transcriptional networks in cerebral organoids derived from iPS cells. Mol. Autism 2017, 8, 11. [Google Scholar] [CrossRef] [Green Version]
- Fiorentino, M.; Sapone, A.; Senger, S.; Camhi, S.S.; Kadzielski, S.M.; Buie, T.M.; Kelly, D.L.; Cascella, N.; Fasano, A. Blood-brain barrier and intestinal epithelial barrier alterations in autism spectrum disorders. Mol. Autism 2016, 7, 49. [Google Scholar] [CrossRef] [PubMed] [Green Version]
- Esnafoglu, E.; Cırrık, S.; Ayyıldız, S.N.; Erdil, A.; Ertürk, E.Y.; Daglı, A.; Noyan, T. Increased serum zonulin levels as an intestinal permeability marker in autistic subjects. J. Pediatr. 2017, 188, 240–244. [Google Scholar] [CrossRef]
- Hayashi-Takagi, A.; Vawter, M.P.; Iwamoto, K. Peripheral biomarkers revisited: Integrative profiling of peripheral samples for psychiatric research. Biol. Psychiatry 2014, 75, 920–928. [Google Scholar] [CrossRef] [Green Version]
- Skafidas, E.; Testa, R.; Zantomio, D.; Chana, G.; Everall, I.P.; Pantelis, C. Predicting the diagnosis of autism spectrum disorder using gene pathway analysis. Mol. Psychiatry 2014, 19, 504–510. [Google Scholar] [CrossRef] [Green Version]
- Yorbik, O.; Mutlu, C.; Tanju, I.A.; Celik, D.; Ozcan, O. Mean platelet volume in children with attention deficit hyperactivity disorder. Med. Hypotheses 2014, 82, 341–345. [Google Scholar] [CrossRef] [PubMed]
- Muller, C.L.; Anacker, A.M.J.; Veenstra-Vanderweele, J. The serotonin system in autism spectrum disorder: From biomarker to animal models. Neuroscience 2016, 321, 24–41. [Google Scholar] [CrossRef] [PubMed] [Green Version]
- Aaron, E.; Montgomery, A.; Ren, X.; Guter, S.; Anderson, G.; Carneiro, A.M.D.; Jacob, S.; Mosconi, M.; Pandey, G.N.; Cook, E.; et al. Whole blood serotonin levels and platelet 5-HT2A binding in autism spectrum disorder. J. Autism Dev. Disord 2019, 49, 2417–2425. [Google Scholar] [CrossRef]
- The Handbook of Metabonomics and Metabolomics—1st Edition. Available online: https://0-www-elsevier-com.brum.beds.ac.uk/books/the-handbook-of-metabonomics-and-metabolomics/lindon/978-0-444-52841-4 (accessed on 3 December 2019).
- Serkova, N.J.; Jackman, M.; Brown, J.L.; Liu, T.; Hirose, R.; Roberts, J.P.; Maher, J.J.; Niemann, C.U. Metabolic profiling of livers and blood from obese Zucker rats. J. Hepatol. 2006, 44, 956–962. [Google Scholar] [CrossRef] [PubMed]
- Gloyn, A.L.; Faber, J.H.; Malmodin, D.; Thanabalasingham, G.; Lam, F.; Ueland, P.M.; McCarthy, M.I.; Owen, K.R.; Baunsgaard, D. Metabolic profiling in Maturity-onset diabetes of the young (MODY) and young onset type 2 diabetes fails to detect robust urinary biomarkers. PLoS ONE 2012, 7, e40962. [Google Scholar] [CrossRef] [PubMed] [Green Version]
- Brindle, J.T.; Antti, H.; Holmes, E.; Tranter, G.; Nicholson, J.K.; Bethell, H.W.L.; Clarke, S.; Schofield, P.M.; McKilligin, E.; Mosedale, D.E.; et al. Rapid and noninvasive diagnosis of the presence and severity of coronary heart disease using 1H-NMR-based metabonomics. Nat. Med. 2002, 8, 1439–1444. [Google Scholar] [CrossRef]
- Kaddurah-Daouk, R.; Krishnan, K.R.R. Metabolomics: A global biochemical approach to the study of central nervous system diseases. Neuropsychopharmacology 2009, 34, 173–186. [Google Scholar] [CrossRef]
- Pearl, P.L.; Gibson, K.M.; Acosta, M.T.; Vezina, L.G.; Theodore, W.H.; Rogawski, M.A.; Novotny, E.J.; Gropman, A.; Conry, J.A.; Berry, G.T.; et al. Clinical spectrum of succinic semialdehyde dehydrogenase deficiency. Neurology 2003, 60, 1413–1417. [Google Scholar] [CrossRef]
- El-Ansary, A.K.; Bacha, A.G.B.; Al-Ayahdi, L.Y. Plasma fatty acids as diagnostic markers in autistic patients from Saudi Arabia. Lipids Health Dis. 2011, 10, 62. [Google Scholar] [CrossRef] [Green Version]
- Ryan, D.P.; Matthews, J.M. Protein-protein interactions in human disease. Curr. Opin. Struct. Biol. 2005, 15, 441–446. [Google Scholar] [CrossRef]
- Stumpf, M.P.H.; Thorne, T.; de Silva, E.; Stewart, R.; An, H.J.; Lappe, M.; Wiuf, C. Estimating the size of the human interactome. Proc. Natl. Acad. Sci. USA 2008, 105, 6959–6964. [Google Scholar] [CrossRef] [PubMed] [Green Version]
- Careaga, M.; Van de Water, J.; Ashwood, P. Immune dysfunction in autism: A pathway to treatment. Neurotherapeutics 2010, 7, 283–292. [Google Scholar] [CrossRef] [PubMed] [Green Version]
- Malki, K.; Pain, O.; Tosto, M.G.; Du Rietz, E.; Carboni, L.; Schalkwyk, L.C. Identification of genes and gene pathways associated with major depressive disorder by integrative brain analysis of rat and human prefrontal cortex transcriptomes. Transl. Psychiatry 2015, 5. [Google Scholar] [CrossRef] [Green Version]
- Nascimento, J.M.; Martins-de-Souza, D. The proteome of schizophrenia. NPJ Schizophr. 2015, 1, 14003. [Google Scholar] [CrossRef] [PubMed] [Green Version]
- Kilpinen, H.; Ylisaukko-Oja, T.; Hennah, W.; Palo, O.M.; Varilo, T.; Vanhala, R.; Nieminen-von Wendt, T.; von Wendt, L.; Paunio, T.; Peltonen, L. Association of DISC1 with autism and Asperger syndrome. Mol. Psychiatry 2008, 13, 187–196. [Google Scholar] [CrossRef]
- Camargo, L.M.; Collura, V.; Rain, J.-C.; Mizuguchi, K.; Hermjakob, H.; Kerrien, S.; Bonnert, T.P.; Whiting, P.J.; Brandon, N.J. Disrupted in Schizophrenia 1 Interactome: Evidence for the close connectivity of risk genes and a potential synaptic basis for schizophrenia. Mol. Psychiatry 2007, 12, 74–86. [Google Scholar] [CrossRef]
- Sakai, Y.; Shaw, C.A.; Dawson, B.C.; Dugas, D.V.; Al-Mohtaseb, Z.; Hill, D.E.; Zoghbi, H.Y. Protein interactome reveals converging molecular pathways among autism disorders. Sci. Transl. Med. 2011, 3, 86ra49. [Google Scholar] [CrossRef] [Green Version]
- Vignoli, A.; La Briola, F.; Peron, A.; Turner, K.; Vannicola, C.; Saccani, M.; Magnaghi, E.; Scornavacca, G.F.; Canevini, M.P. Autism spectrum disorder in tuberous sclerosis complex: Searching for risk markers. Orphanet J. Rare Dis. 2015, 10, 154. [Google Scholar] [CrossRef] [Green Version]
- Alfieri, A.; Sorokina, O.; Adrait, A.; Angelini, C.; Russo, I.; Morellato, A.; Matteoli, M.; Menna, E.; Boeri Erba, E.; McLean, C.; et al. Synaptic interactome mining reveals p140Cap as a new hub for PSD proteins involved in psychiatric and neurological disorders. Front. Mol. Neurosci. 2017, 10, 212. [Google Scholar] [CrossRef]
- Qiu, S.; Lu, Z.; Levitt, P. MET receptor tyrosine kinase controls dendritic complexity, spine morphogenesis, and glutamatergic synapse maturation in the hippocampus. J. Neurosci. 2014, 34, 16166–16179. [Google Scholar] [CrossRef] [Green Version]
- Han, K.; Holder, J.L.; Schaaf, C.P.; Lu, H.; Chen, H.; Kang, H.; Tang, J.; Wu, Z.; Hao, S.; Cheung, S.W.; et al. SHANK3 overexpression causes manic-like behaviour with unique pharmacogenetic properties. Nature 2013, 503, 72–77. [Google Scholar] [CrossRef] [PubMed] [Green Version]
- Boeckers, T.M.; Bockmann, J.; Kreutz, M.R.; Gundelfinger, E.D. ProSAP/Shank proteins a family of higher order organizing molecules of the postsynaptic density with an emerging role in human neurological disease. J. Neurochem. 2002, 81, 903–910. [Google Scholar] [CrossRef] [PubMed]
- Naisbitt, S.; Kim, E.; Tu, J.C.; Xiao, B.; Sala, C.; Valtschanoff, J.; Weinberg, R.J.; Worley, P.F.; Sheng, M. Shank, a novel family of postsynaptic density proteins that binds to the NMDA receptor/PSD-95/GKAP complex and cortactin. Neuron 1999, 23, 569–582. [Google Scholar] [CrossRef] [Green Version]
- Lee, Y.; Kim, S.G.; Lee, B.; Zhang, Y.; Kim, Y.; Kim, S.; Kim, E.; Kang, H.; Han, K. Striatal transcriptome and interactome analysis of shank3-overexpressing mice reveals the connectivity between shank3 and mTORC1 signaling. Front. Mol. Neurosci. 2017, 10, 201. [Google Scholar] [CrossRef] [PubMed]
- Wyatt, J.; Spiegelhalter, D. Field trials of medical decision-aids: Potential problems and solutions. Proc. Annu. Symp. Comput. Appl. Med. Care. 1991, 3–7. [Google Scholar]
- Amarasingham, R.; Plantinga, L.; Diener-West, M.; Gaskin, D.J.; Powe, N.R. Clinical information technologies and inpatient outcomes: A multiple hospital study. Arch. Intern. Med. 2009, 169, 108–114. [Google Scholar] [CrossRef] [Green Version]
- Institute of Medicine (US). Committee on Quality of Health Care in America Crossing the Quality Chasm: A New Health System for the 21st Century; National Academies Press (US): Washington, DC, USA, 2001; ISBN 978-0-309-07280-9. [Google Scholar]
- Jaspers, M.W.M.; Smeulers, M.; Vermeulen, H.; Peute, L.W. Effects of clinical decision-support systems on practitioner performance and patient outcomes: A synthesis of high-quality systematic review findings. J. Am. Med. Inform. Assoc. 2011, 18, 327–334. [Google Scholar] [CrossRef] [Green Version]
- Ingraham, A.M.; Cohen, M.E.; Bilimoria, K.Y.; Dimick, J.B.; Richards, K.E.; Raval, M.V.; Fleisher, L.A.; Hall, B.L.; Ko, C.Y. Association of surgical care improvement project infection-related process measure compliance with risk-adjusted outcomes: Implications for quality measurement. J. Am. Coll. Surg. 2010, 211, 705–714. [Google Scholar] [CrossRef]
- Kuperman, G.J.; Bobb, A.; Payne, T.H.; Avery, A.J.; Gandhi, T.K.; Burns, G.; Classen, D.C.; Bates, D.W. Medication-related clinical decision support in computerized provider order entry systems: A review. J. Am. Med. Inform. Assoc. 2007, 14, 29–40. [Google Scholar] [CrossRef] [Green Version]
- Kaushal, R.; Kern, L.M.; Barrón, Y.; Quaresimo, J.; Abramson, E.L. Electronic prescribing improves medication safety in community-based office practices. J. Gen. Intern. Med. 2010, 25, 530–536. [Google Scholar] [CrossRef] [Green Version]
- Bates, D.W.; Cohen, M.; Leape, L.L.; Overhage, J.M.; Shabot, M.M.; Sheridan, T. Reducing the frequency of errors in medicine using information technology. J. Am. Med. Inform. Assoc. 2001, 8, 299–308. [Google Scholar] [CrossRef] [PubMed] [Green Version]
- Bryan, C.; Boren, S.A. The use and effectiveness of electronic clinical decision support tools in the ambulatory/primary care setting: A systematic review of the literature. Inform. Prim. Care 2008, 16, 79–91. [Google Scholar] [CrossRef] [PubMed] [Green Version]
- Eslami, S.; Abu-Hanna, A.; de Keizer, N.F. Evaluation of outpatient computerized physician medication order entry systems: A systematic review. J. Am. Med. Inform. Assoc. 2007, 14, 400–406. [Google Scholar] [CrossRef] [PubMed]
- Pearson, S.-A.; Moxey, A.; Robertson, J.; Hains, I.; Williamson, M.; Reeve, J.; Newby, D. Do computerised clinical decision support systems for prescribing change practice? A systematic review of the literature (1990-2007). BMC Health Serv. Res. 2009, 9, 154. [Google Scholar] [CrossRef] [PubMed] [Green Version]
- Shojania, K.G.; Jennings, A.; Mayhew, A.; Ramsay, C.R.; Eccles, M.P.; Grimshaw, J. The effects of on-screen, point of care computer reminders on processes and outcomes of care. Cochrane Database Syst. Rev. 2009, CD001096. [Google Scholar] [CrossRef]
- Anand, V.; Carroll, A.E.; Biondich, P.G.; Dugan, T.M.; Downs, S.M. Pediatric decision support using adapted Arden Syntax. Artif. Intell. Med. 2018, 92, 15–23. [Google Scholar] [CrossRef] [PubMed] [Green Version]
- Anand, V.; Carroll, A.E.; Downs, S.M. Automated primary care screening in pediatric waiting rooms. Pediatrics 2012, 129, e1275–e1281. [Google Scholar] [CrossRef] [Green Version]
- Downs, S.M.; Bauer, N.S.; Saha, C.; Ofner, S.; Carroll, A.E. Effect of a computer-based decision support intervention on autism spectrum disorder screening in pediatric primary care clinics: A cluster randomized clinical trial. JAMA Netw. Open 2019, 2, e1917676. [Google Scholar] [CrossRef] [Green Version]
- Cancer Genome Atlas Research Network. Comprehensive genomic characterization defines human glioblastoma genes and core pathways. Nature 2008, 455, 1061–1068. [Google Scholar] [CrossRef]
- Higdon, R.; Stewart, E.; Stanberry, L.; Haynes, W.; Choiniere, J.; Montague, E.; Anderson, N.; Yandl, G.; Janko, I.; Broomall, W.; et al. MOPED enables discoveries through consistently processed proteomics data. J. Proteome Res. 2014, 13, 107–113. [Google Scholar] [CrossRef] [Green Version]
- Kolker, E.; Higdon, R.; Haynes, W.; Welch, D.; Broomall, W.; Lancet, D.; Stanberry, L.; Kolker, N. MOPED: Model organism protein expression database. Nucleic Acids Res. 2012, 40, D1093–D1099. [Google Scholar] [CrossRef] [PubMed] [Green Version]
- Montague, E.; Janko, I.; Stanberry, L.; Lee, E.; Choiniere, J.; Anderson, N.; Stewart, E.; Broomall, W.; Higdon, R.; Kolker, N.; et al. Beyond protein expression, MOPED goes multi-omics. Nucleic Acids Res. 2015, 43, D1145–D1151. [Google Scholar] [CrossRef] [PubMed] [Green Version]
- Montague, E.; Stanberry, L.; Higdon, R.; Janko, I.; Lee, E.; Anderson, N.; Choiniere, J.; Stewart, E.; Yandl, G.; Broomall, W.; et al. MOPED 2.5—An integrated multi-omics resource: Multi-omics profiling expression database now includes transcriptomics data. OMICS 2014, 18, 335–343. [Google Scholar] [CrossRef] [PubMed]
- Hall, D.; Huerta, M.F.; McAuliffe, M.J.; Farber, G.K. Sharing heterogeneous data: The national database for autism research. Neuroinformatics 2012, 10, 331–339. [Google Scholar] [CrossRef] [PubMed] [Green Version]
- Wright, A.; Sittig, D.F.; Ash, J.S.; Feblowitz, J.; Meltzer, S.; McMullen, C.; Guappone, K.; Carpenter, J.; Richardson, J.; Simonaitis, L.; et al. Development and evaluation of a comprehensive clinical decision support taxonomy: Comparison of front-end tools in commercial and internally developed electronic health record systems. J. Am. Med. Inform. Assoc. 2011, 18, 232–242. [Google Scholar] [CrossRef] [PubMed] [Green Version]


| Reference | Matrix | N° of Subjects | Analytical Technique | Proteins Implicated and Pathways |
|---|---|---|---|---|
| [50] Junaid MA et al., 2004 | Brain | 8 ASD and 10 controls | 2-DE, LC-MS/MS | Glo1 (osteoclastogenesis and ASD etiology) |
| [51] Broek JA et al., 2014 | Brain | prefrontal cortex, 10 ASD and 10 controls; cerebellum, 16 ASD, 17 controls | SRM-MS | VIME, CKB, MAG, MBP, MOG, PLP1, DNM2, STX1A, STXBP1, GFAP, PACSIN1, SYN2, SYT1 (synaptic transmission and energy metabolism) |
| [52] Wingo et al., 2019 | Brain | 27 ASD, 76 controls | Large-scale proteome-wide association | VGF, SEPT5, DBI, MAPT, KIAA1045, DLD, ABHD10, VDAC1, NDUFV1, PDHB (cognitive stability) |
| [53] Corbett et al., 2007 | Blood | 69 ASD and 35 controls | LC-MS/MS | FHR1, C1Q, FN1, APOB-100 (indirect impact on brain development in ASD) |
| [54] Ngounou Wetie et al., 2014 | Blood | 7 ASD and 7 controls | one dimensional gel electrophoresis (1-DE), LC-MS/MS | APOA1, APOA4, PON1 (Lipid metabolism - paraoxonase activity) |
| [55] Steeb et al., 2014 | Blood | 30 ASD and 29 controls | Immunoassay, LC-MS/MS | ADIPO, ARMC3, APOA1, APOE, APOC2, BMP6, CHGA, CLC4K, CTGF, EPO, FETUB, GLCE, ICAM1, IL3, IGA, IL16, IL12A, MRRP1, RGPD4, SHBG, PAP, PTPA, RN149, TENA, TLE1, TNF, TF, TRIPB, ZC3HE (Lipid metabolism, cell growth, inflammation) |
| [56] Yang et al., 2018 | Blood | 68 ASD and 80 controls | MALDI-TOF MS | APOC1, AFP, CPB2, FAPB1, FGA, PF4, SERPINA5, TAAR6 (lipid metabolism) |
| [57] Cortelazzo et al., 2016 | Blood | 30 ASD and 30 controls | 2-DE, LC-MS/MS | A1AT, A2M, HPT, FIBB, FIBG, APOA1, APOA4, APOJ, ALBU, IGHA1, IGHAG (acute inflammatory and lipid metabolism) |
| [58] Feng et al., 2017 | Blood | 15 ASD and 15 controls | 2-DE, Western blot/protein carbonylation and MALDI-TOF | C8A, IGKC (Immune system) |
| [59] Shen et al., 2018 | Blood | 30 ASD and 30 controls | Proteo-Miner protein enrichment, iTRAQ, LC-M S/MS | ACTG1, ACTN1, AGT, APOE, CALM1, CALR, C3, C5, EHD3, ENO1, FERMT3, FBLN1, FN1, IGFALS, ITGA2B, MAPRE2, PARVB, SERPINA1, SERPIN4A, THBS1, TLN1, VCL, VCP, VTN (complement system, platelet function, focal adhesions, cytoskeleton, motility and migration and synaptogenesis) |
| [60] Castagnola et al., 2008 | Saliva | 27 ASD and 23 controls | LC-MS/MS | HTN1, PRP, STATH (Antimicrobial peptides and central nervous system) |
| [61] Ngounou Wetie et al., 2015 | Saliva | 6 ASD and 6 controls | 2-DE, LC-MS/MS | AMY1A, AZGP1, CREBBP, CST5, FRAT1, GRTP1, KIF14, ITGA6, HERC1, MRP14, MUC16, PLG, PSP, PIP, TF, ZG16 (immune and inflammation response, lipid metabolism, oxidative stress) |
| [62] Ngounou Wetie et al., 2015 | Saliva | 6 ASD and 6 controls | LC-MS/MS | DMBT1, ELANE, HTN1, IGKC, IGHG1, IGLC2, LTF, PIGR, PIP, PRH1, STATH (Inflammation and Immune response) |
| [63] Suganya et al., 2015 | Urine | 30 ASD and 30 controls | 2-DE, MALDI-TOF MS | IGHG1, KNG1, MASP2 (Inflammation, coagulation and complement system) |
| [64] Pichitpunpong et al., 2019 | lymphoblastoid cell lines | Not available | 2-DE, LC-MS/MS, Western blotting | DLD, IDH2, TPT1, ANXA5, CCT5, COX5A, LGALS1, GSTP1, HNRNPA1, PGAM1, TUBB, H3F3C, DBI, AHSG, ERH, CLTA, CALM1, ENO1 (Neurological functions and inflammation) |
| Reference | Matrix | N of Subjects | Analytical Technique | Metabolite Implicated and Metabolic Process |
|---|---|---|---|---|
| [65] Graham et al., 2016 | Brain | 11 ASD and 11 controls | LC-LTQ Orbitrap MS | 3-methoxytyramine, 5,6-dihydrouridine, N-carboxyethyl-γ-aminobutyric acid (dopamine, nucleotide metabolism and cell growth and proliferation) |
| [66] Kurochkin et al., 2019 | Brain | 32 ASD and 40 controls | UPLC–MS/MS | 5-oxoproline, glutathione disulfide, Glutathione, l-γ-glutamyl-cysteine, l-cysteinyl-glycine (glutathione; purine; pyruvate; propanoate; TCA cycle; galactose; starch and sucrose; nicotinate and nicotinamide; cysteine and methionine; arginine and proline metabolism) |
| [67] Kuwabara et al., 2013 | Blood | 25 ASD and 28 controls | CE-TOF MS | arginine, taurine, 5-Oxoproline, lactic acid (oxidative stress and mitochondrial dysfunction) |
| [68] West et al., 2014 | Blood | 52 ASD and 30 controls | LC-MS and GC-MS | aspartate, DHEA-S, glutaric acid, serine, succinic acid citrate, creatinine, isoleucine, hydroxyphenyllactate, glutamate (energy production, mitochondrial disease or dysfunction and oxidative stress) |
| [69] Wang et al., 2016 | Blood | 173 ASD and 163 controls | UPLC/Q–TOF– MS/MS | decanoylcarnitine, pregnanetriol, adrenic acid, docosahexaenoic acid, sphingosine-1-phosphate, uric acid (β-oxidation, fatty acid and mitochondrial dysfunction) |
| [70] Rangel-Huerta et al., 2019 | Blood | 20 ASD and 30 controls | UPLC–MS/MS | 1-methylnicotinamide, 3-Indoxyl sulfate, 4-methyl-2-oxopetane, 5-bromotryptophan, 6-hydroxyindole sulfate, cortisone, methionine, tryptophan, γ-glutamylmethionine, ursodeoxycholate, sphingomyelins, kynurenine, choline phosphate, decanoylcarnitine, 2-keto-3-deoxyglutamate, arachidate, behenate, fructose, sebacate, dodecanedioate, glutamate, aspartate, orotate, galactitol, N-acetyl-aspartyl glutamate (amino acid, lipid, nicotinamide) |
| [71] Kelly RS et al., 2019 | Blood | 403 children of which 52 ASD | UPLC-MS / MS | trimethylamine N-oxide, cinnamoylglycine, linoleoyl ethanolamide, palmitoyl ethanolamide, erythritol, docosahexaenoylcarnitine, prolylhydroxyproline, alpha-ketobutyrate, serotonin, oleoyl ethanolamide, N-formylphenylalanine, 5-Hydroxyindoleacetate, pyrraline, sphingomyelin, N-formylanthranilic acid (Endocannabinoid metabolism, Xenobiotics, Tryptophan metabolism, Urea cycle, Amino acid mebolism, Fatty acid metabolism, Phospholipid metabolism, Sphingolipid metabolism) |
| [72] Yap et al., 2010 | Urine | 39 ASD and 34 controls | 1H-NMR | N-methylnicotinamide, N-methylnicotinic acid, dimethylamine, succinic acid, taurine, N-methyl-2-pyridone-5-carboxamide, hippurate, phenylacetylglutamine, platelet serotonin (gut microbiota and gastrointestinal dysfunction) |
| [73] Ming et al., 2012 | Urine | 48 ASD and 53 controls | UPLC–MS/MS and GC-MS | trans-Urocanate, glutaroylcarnitine, 3-methylglutaroylcarnitine, β-alanine, alanine, carnosine, glycine, histidine, serine, threonine, taurine, uric acid (oxidative stress; amino acid; mammalian microbial co-metabolism) |
| [74] Mavel et al., 2013 | Urine | 30 ASD and 28 controls | 2D-NMR | serotonin, glycine, β-alanine, taurine, succinic acid, creatine, 3-methylhistidine (dopaminergic, serotonergic, synapse, tryptophan, oxidation, amino acids metabolism) |
| [75] Emond et al., 2013 | Urine | 26 ASD and 24 controls | GC-MS | succinic acid, glycolic acid, hippurate, phosphate, palmitate, stearate, 3-methyladipate (gut microbiota) |
| [76] Noto et al., 2014 | Urine | 21 ASD and 21 controls | GC-MS | 3,4-dihydroxybutyric acid, glycolic acid, homovanillic acid, tryptophan 1,2,3-butanetriol, fructose, propylene glycol (interactions among diet, gut microbiota and host genetics) |
| [77] Diémé et al., 2015 | Urine | 30 ASD and 32 controls | 1H-NMR, 2D-HSQC NMR, LC-HRMS | N-acetylarginine, indoxyl, indoxylsulfate, dihydroxy-1H-indole glucuronide, methylguanidine, desaminotyrosine, dihydrouracil (gut microbiota) |
| [78] Bitar et al., 2018 | Urine | 40 ASD and 40 controls | 1H-NMR, 2D-HSQC NMR and LC-HRMS | 5-amino-imidazole-4-carboxamide, chalice acid, glutamic acid, N-phosphoserine, nicotinamide ribonucleotide, glycerol-3-phosphate, trigonelline, riboflavin, 2-hydroxybutyric acid, 5-oxoproline, acetylcarnitine, cysteic acid, citric acid, threonine, creatine, serine, N-acetylphenylalanine;tyrosine, hydroxybenzoic acid, hydroxyproline, lactic acid, guanine, N-amidino aspartic acid, methyl acetoacetic acid, urocanic acid (amino acids; carbohydrates and oxidative stress) |
| [79] Barone et al., 2018 | Dried Blood | 83 ASD and 79 controls | ESI-Tandem MS/MS system | citrulline, acetylcarnitine, methylmalonyl/3-OH isovalerylcarnitine, decanoylcarnitine, dodecanoylcarnitine, tetradecadienoylcarnitine, hexadecanoylcarnitine, octadecenoylcarnitine (amino acids, fatty acid, gastrointestinal disturbances and mitochondrial dysfunction) |
© 2020 by the authors. Licensee MDPI, Basel, Switzerland. This article is an open access article distributed under the terms and conditions of the Creative Commons Attribution (CC BY) license (http://creativecommons.org/licenses/by/4.0/).
Share and Cite
Ristori, M.V.; Mortera, S.L.; Marzano, V.; Guerrera, S.; Vernocchi, P.; Ianiro, G.; Gardini, S.; Torre, G.; Valeri, G.; Vicari, S.; et al. Proteomics and Metabolomics Approaches towards a Functional Insight onto AUTISM Spectrum Disorders: Phenotype Stratification and Biomarker Discovery. Int. J. Mol. Sci. 2020, 21, 6274. https://0-doi-org.brum.beds.ac.uk/10.3390/ijms21176274
Ristori MV, Mortera SL, Marzano V, Guerrera S, Vernocchi P, Ianiro G, Gardini S, Torre G, Valeri G, Vicari S, et al. Proteomics and Metabolomics Approaches towards a Functional Insight onto AUTISM Spectrum Disorders: Phenotype Stratification and Biomarker Discovery. International Journal of Molecular Sciences. 2020; 21(17):6274. https://0-doi-org.brum.beds.ac.uk/10.3390/ijms21176274
Chicago/Turabian StyleRistori, Maria Vittoria, Stefano Levi Mortera, Valeria Marzano, Silvia Guerrera, Pamela Vernocchi, Gianluca Ianiro, Simone Gardini, Giuliano Torre, Giovanni Valeri, Stefano Vicari, and et al. 2020. "Proteomics and Metabolomics Approaches towards a Functional Insight onto AUTISM Spectrum Disorders: Phenotype Stratification and Biomarker Discovery" International Journal of Molecular Sciences 21, no. 17: 6274. https://0-doi-org.brum.beds.ac.uk/10.3390/ijms21176274