Combined Treatment of Sulfonyl Chromen-4-Ones (CHW09) and Ultraviolet-C (UVC) Enhances Proliferation Inhibition, Apoptosis, Oxidative Stress, and DNA Damage against Oral Cancer Cells

 , , and
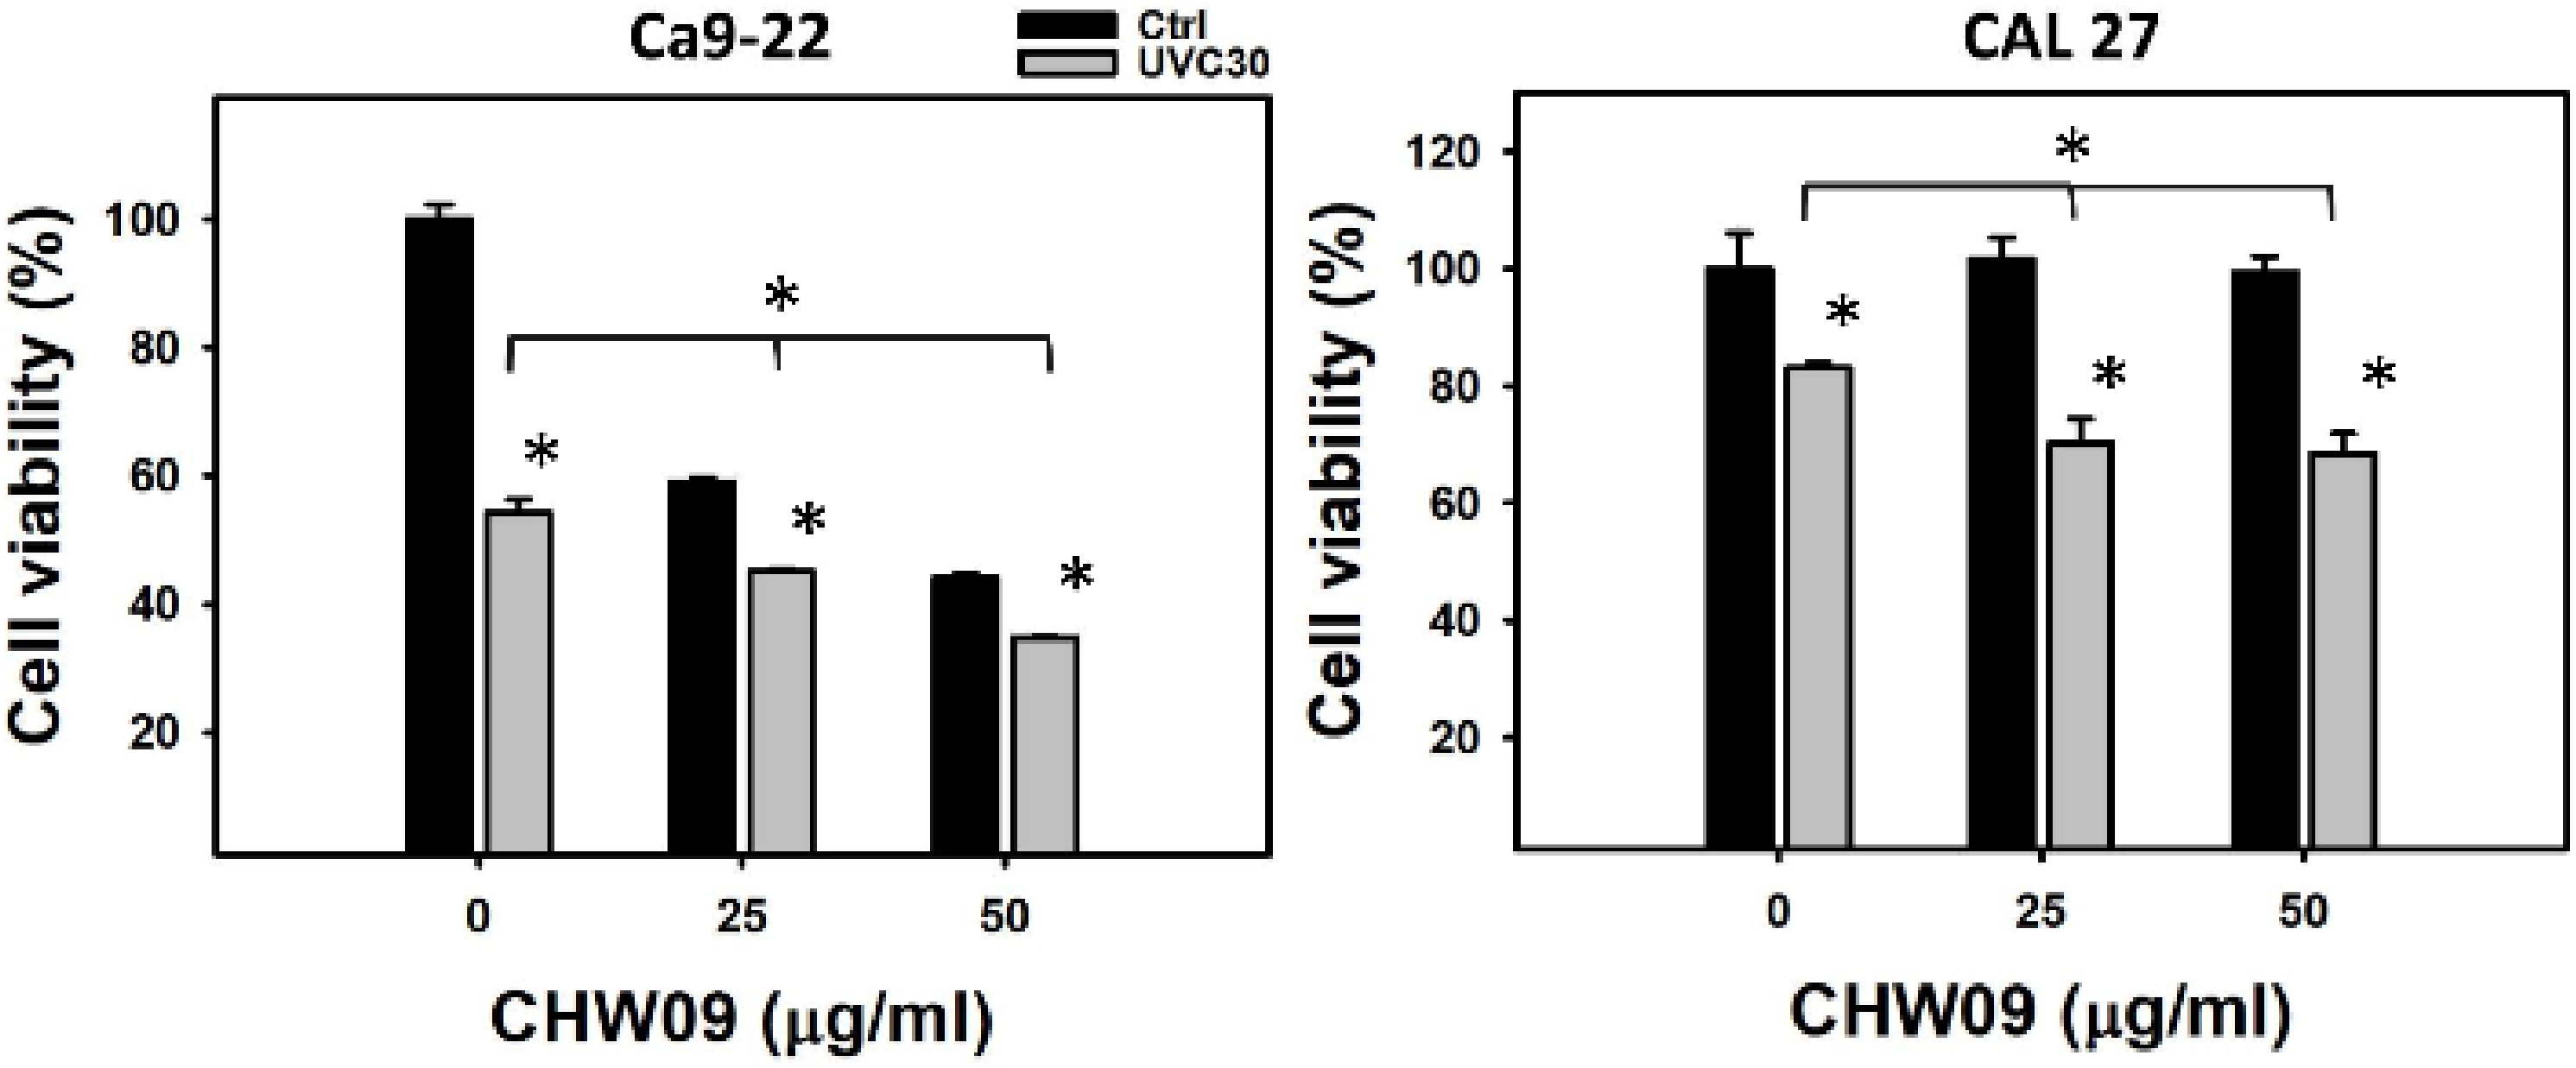
Abstract
:1. Introduction
2. Results
2.1. UVC/CHW09 Combined Treatment Shows High Cell Killing Effect to Oral Cancer Cells
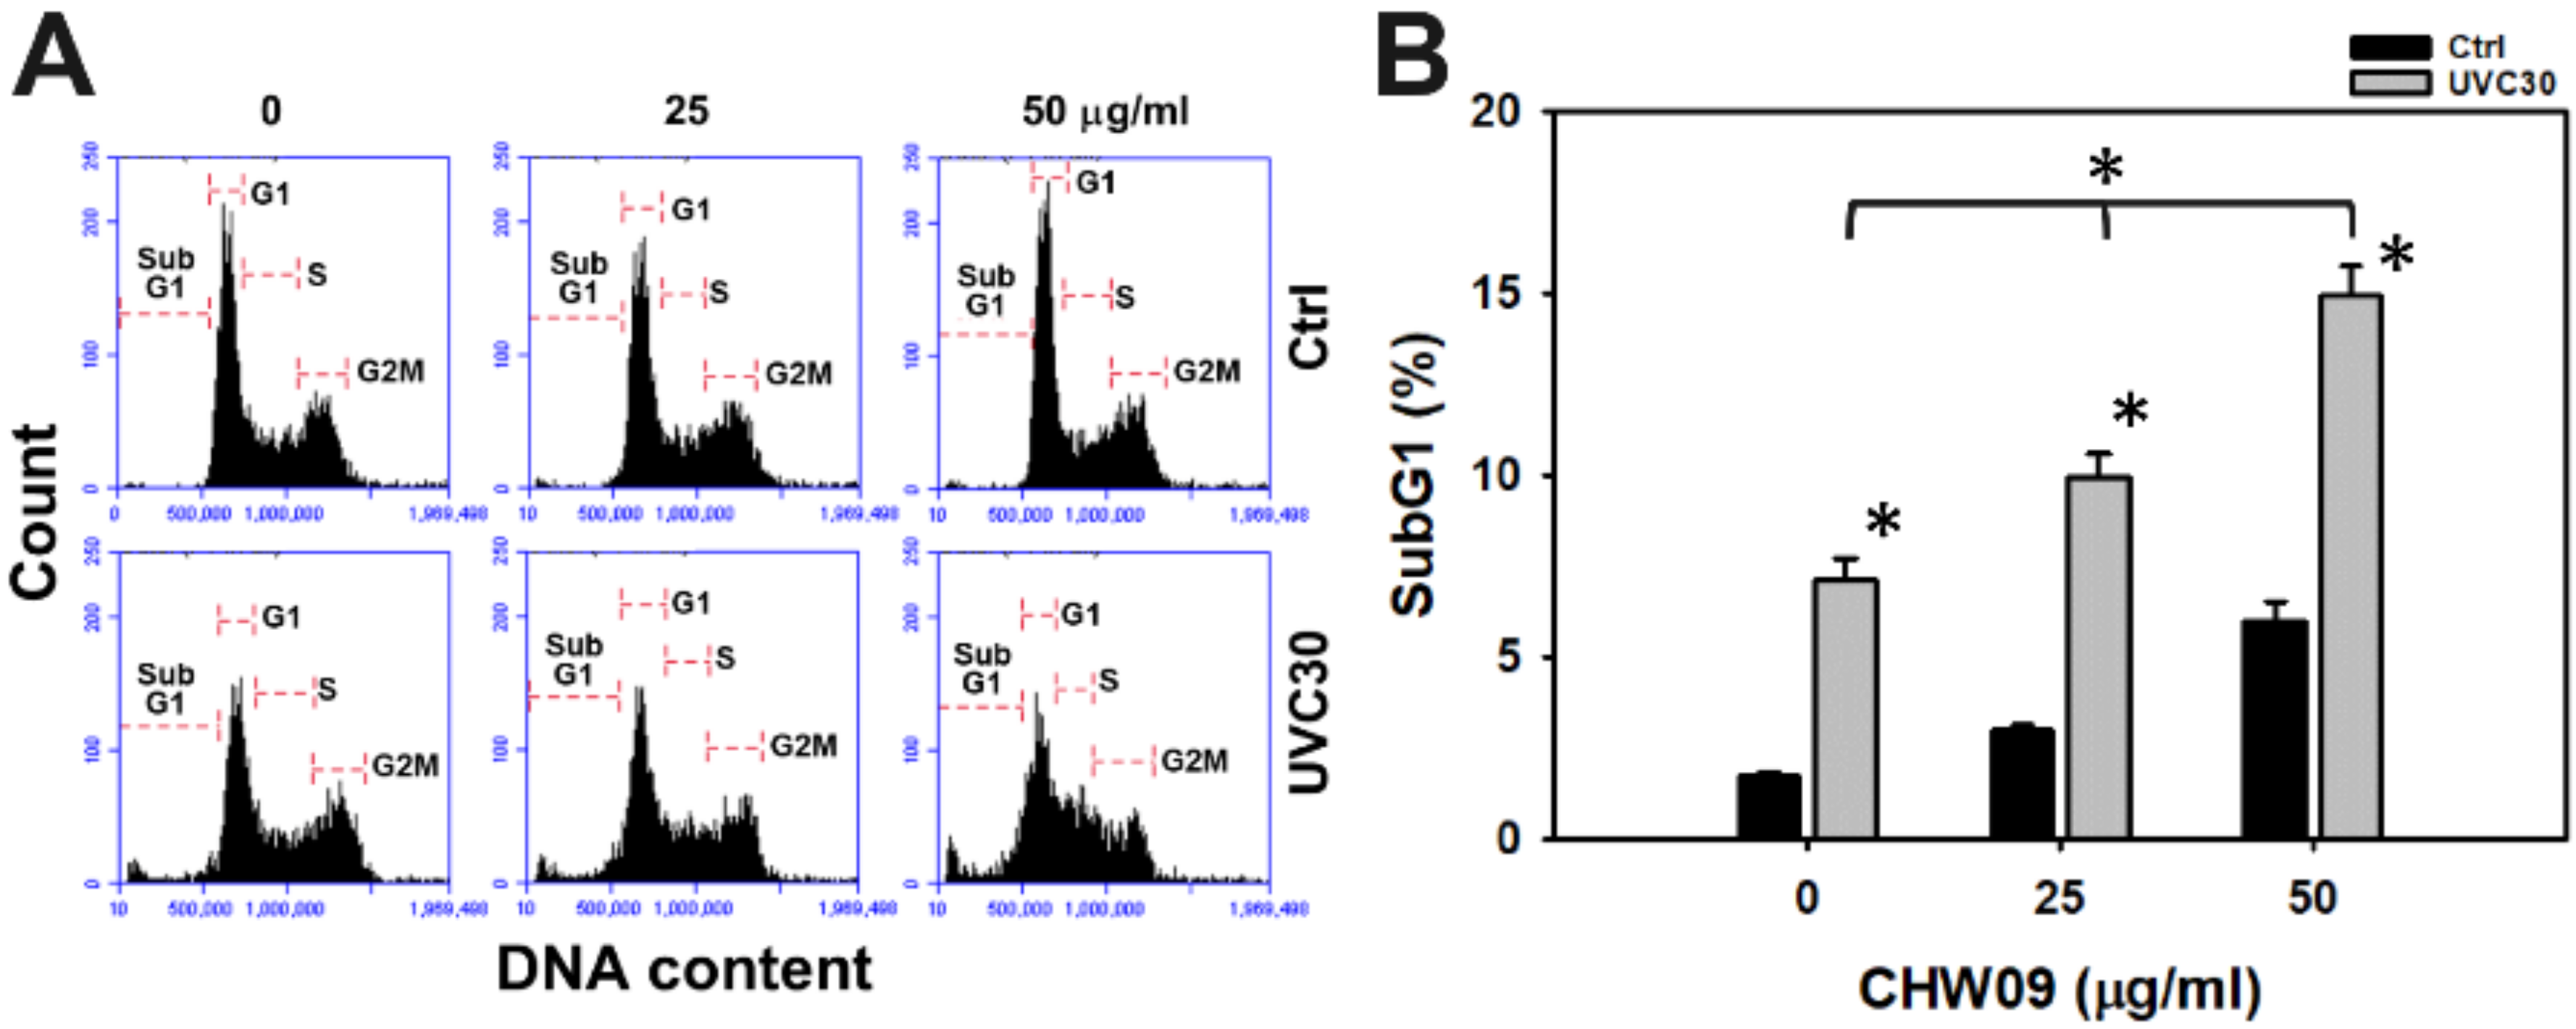
2.2. UVC/CHW09 Combined Treatment Shows High SubG1 Content to Oral Cancer Cells
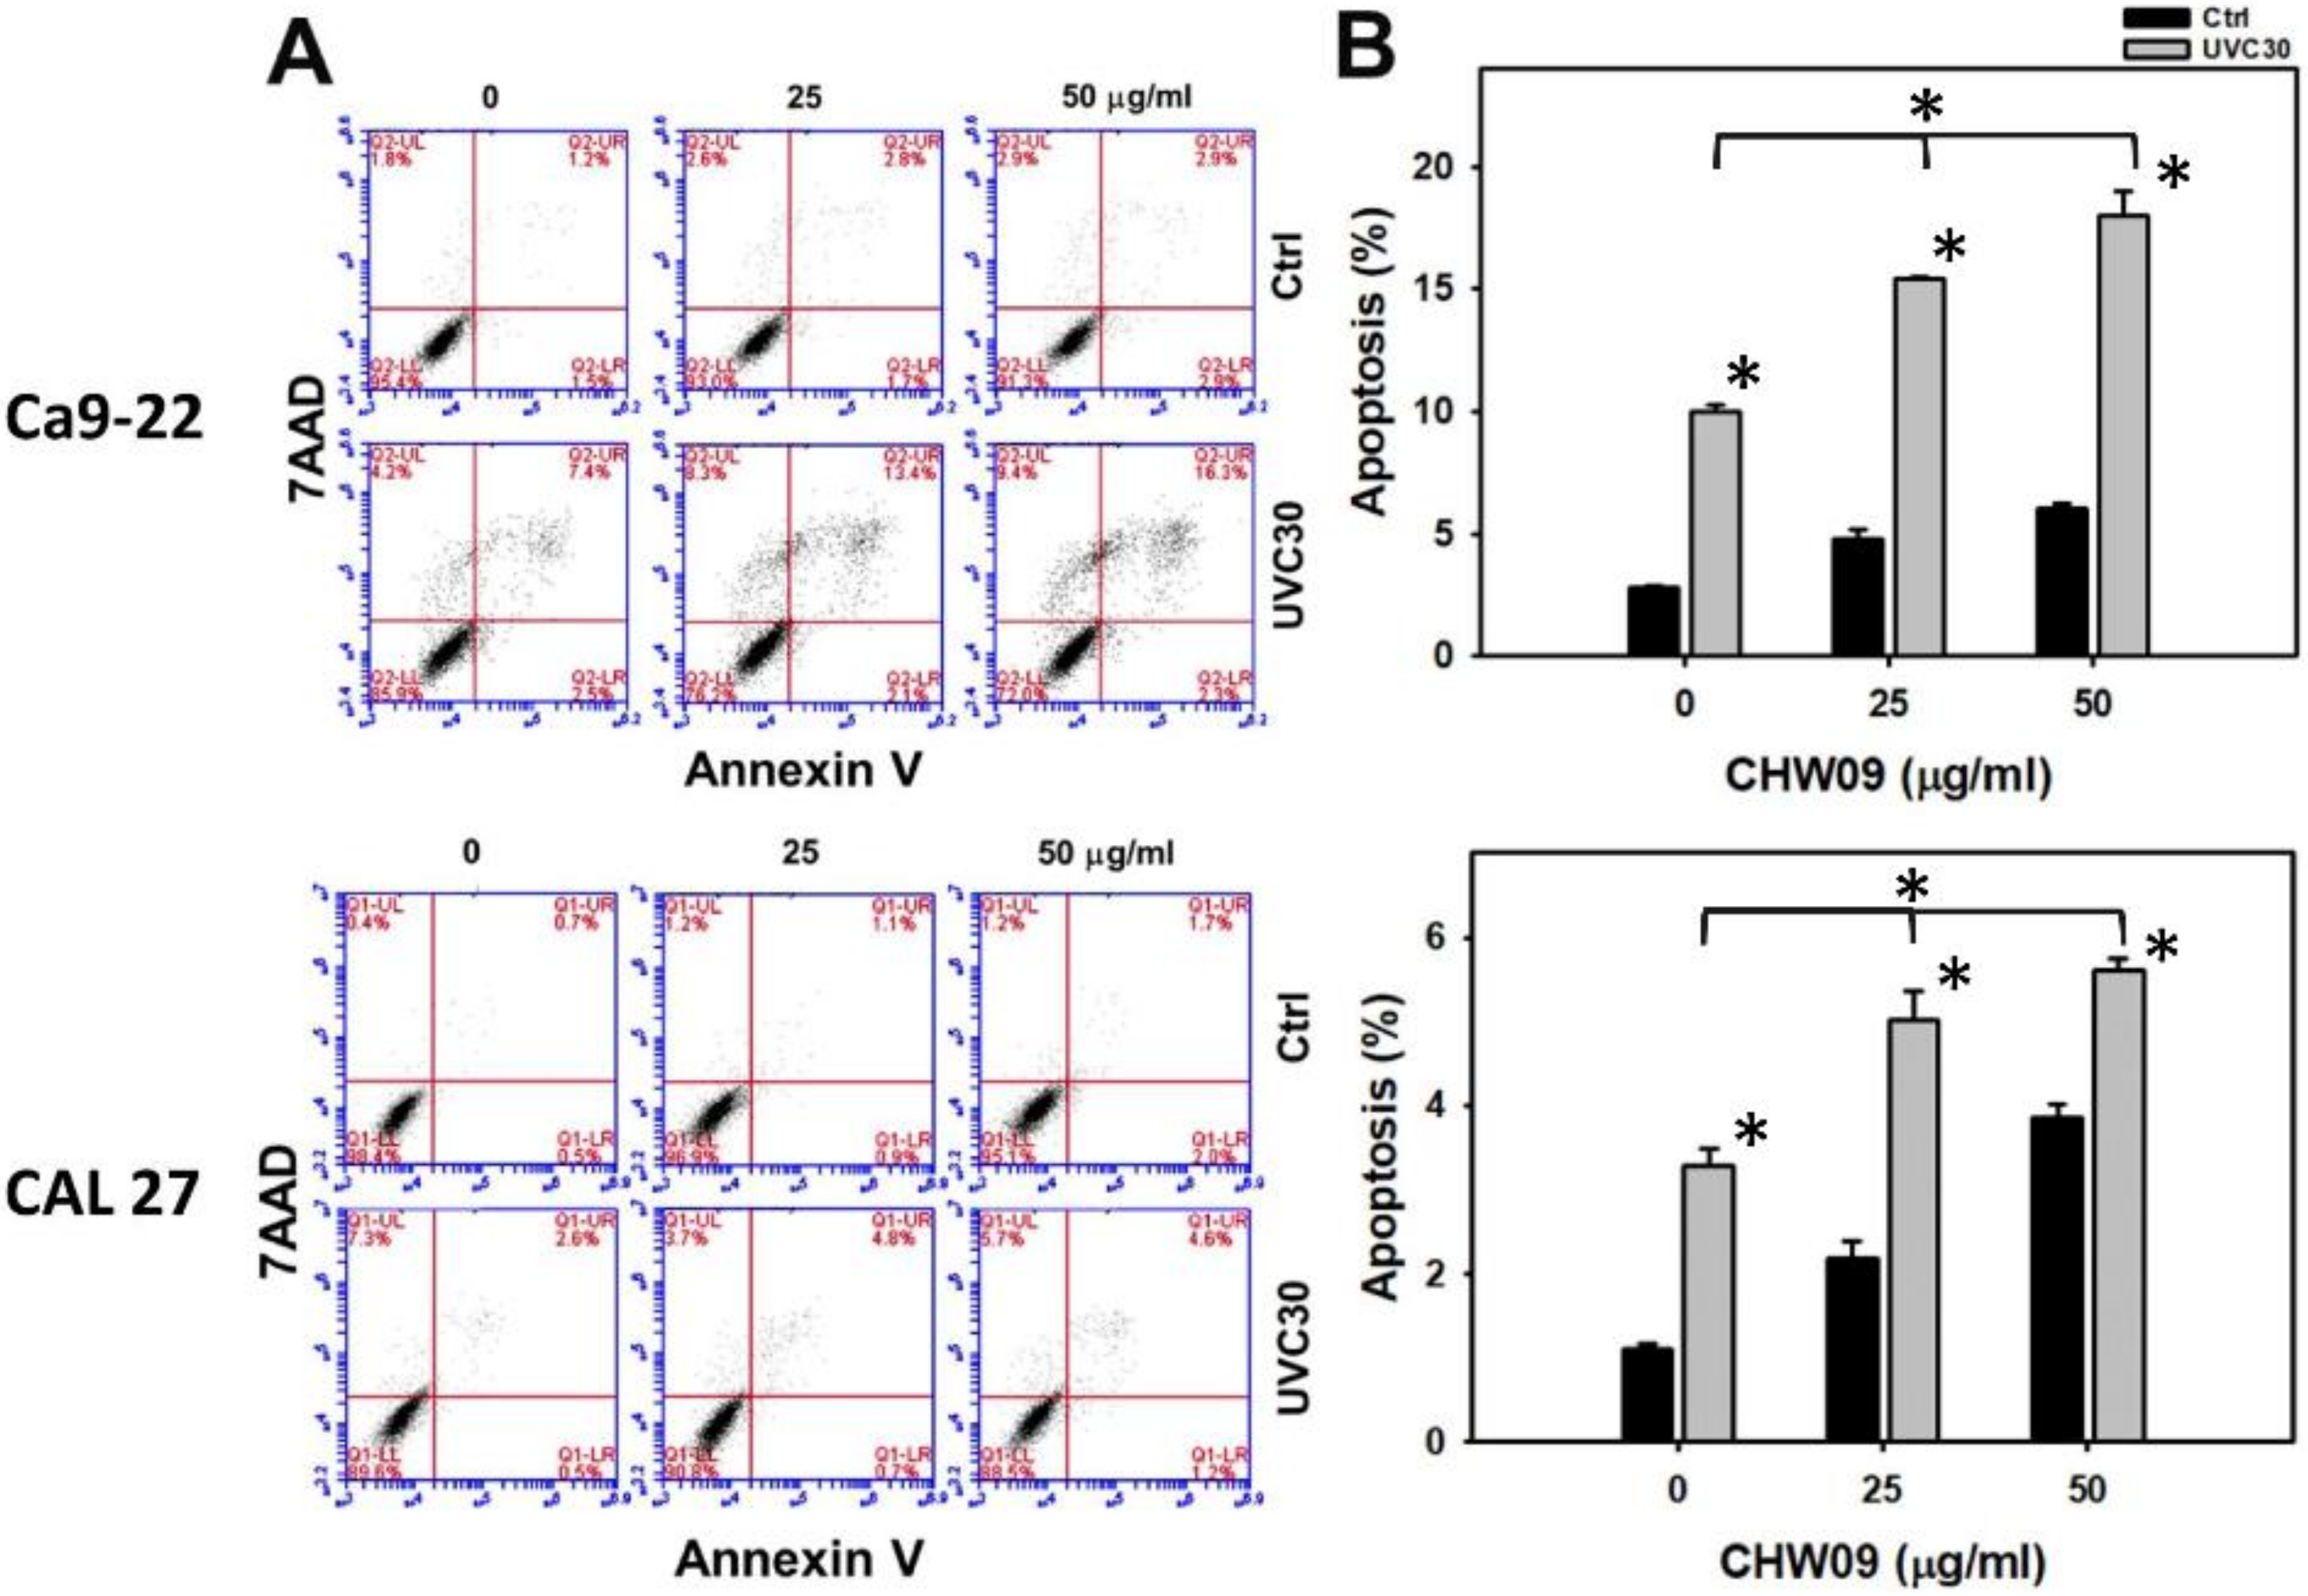
2.3. UVC/CHW09 Combined Treatment Shows High Annexin V Content to Oral Cancer Cells
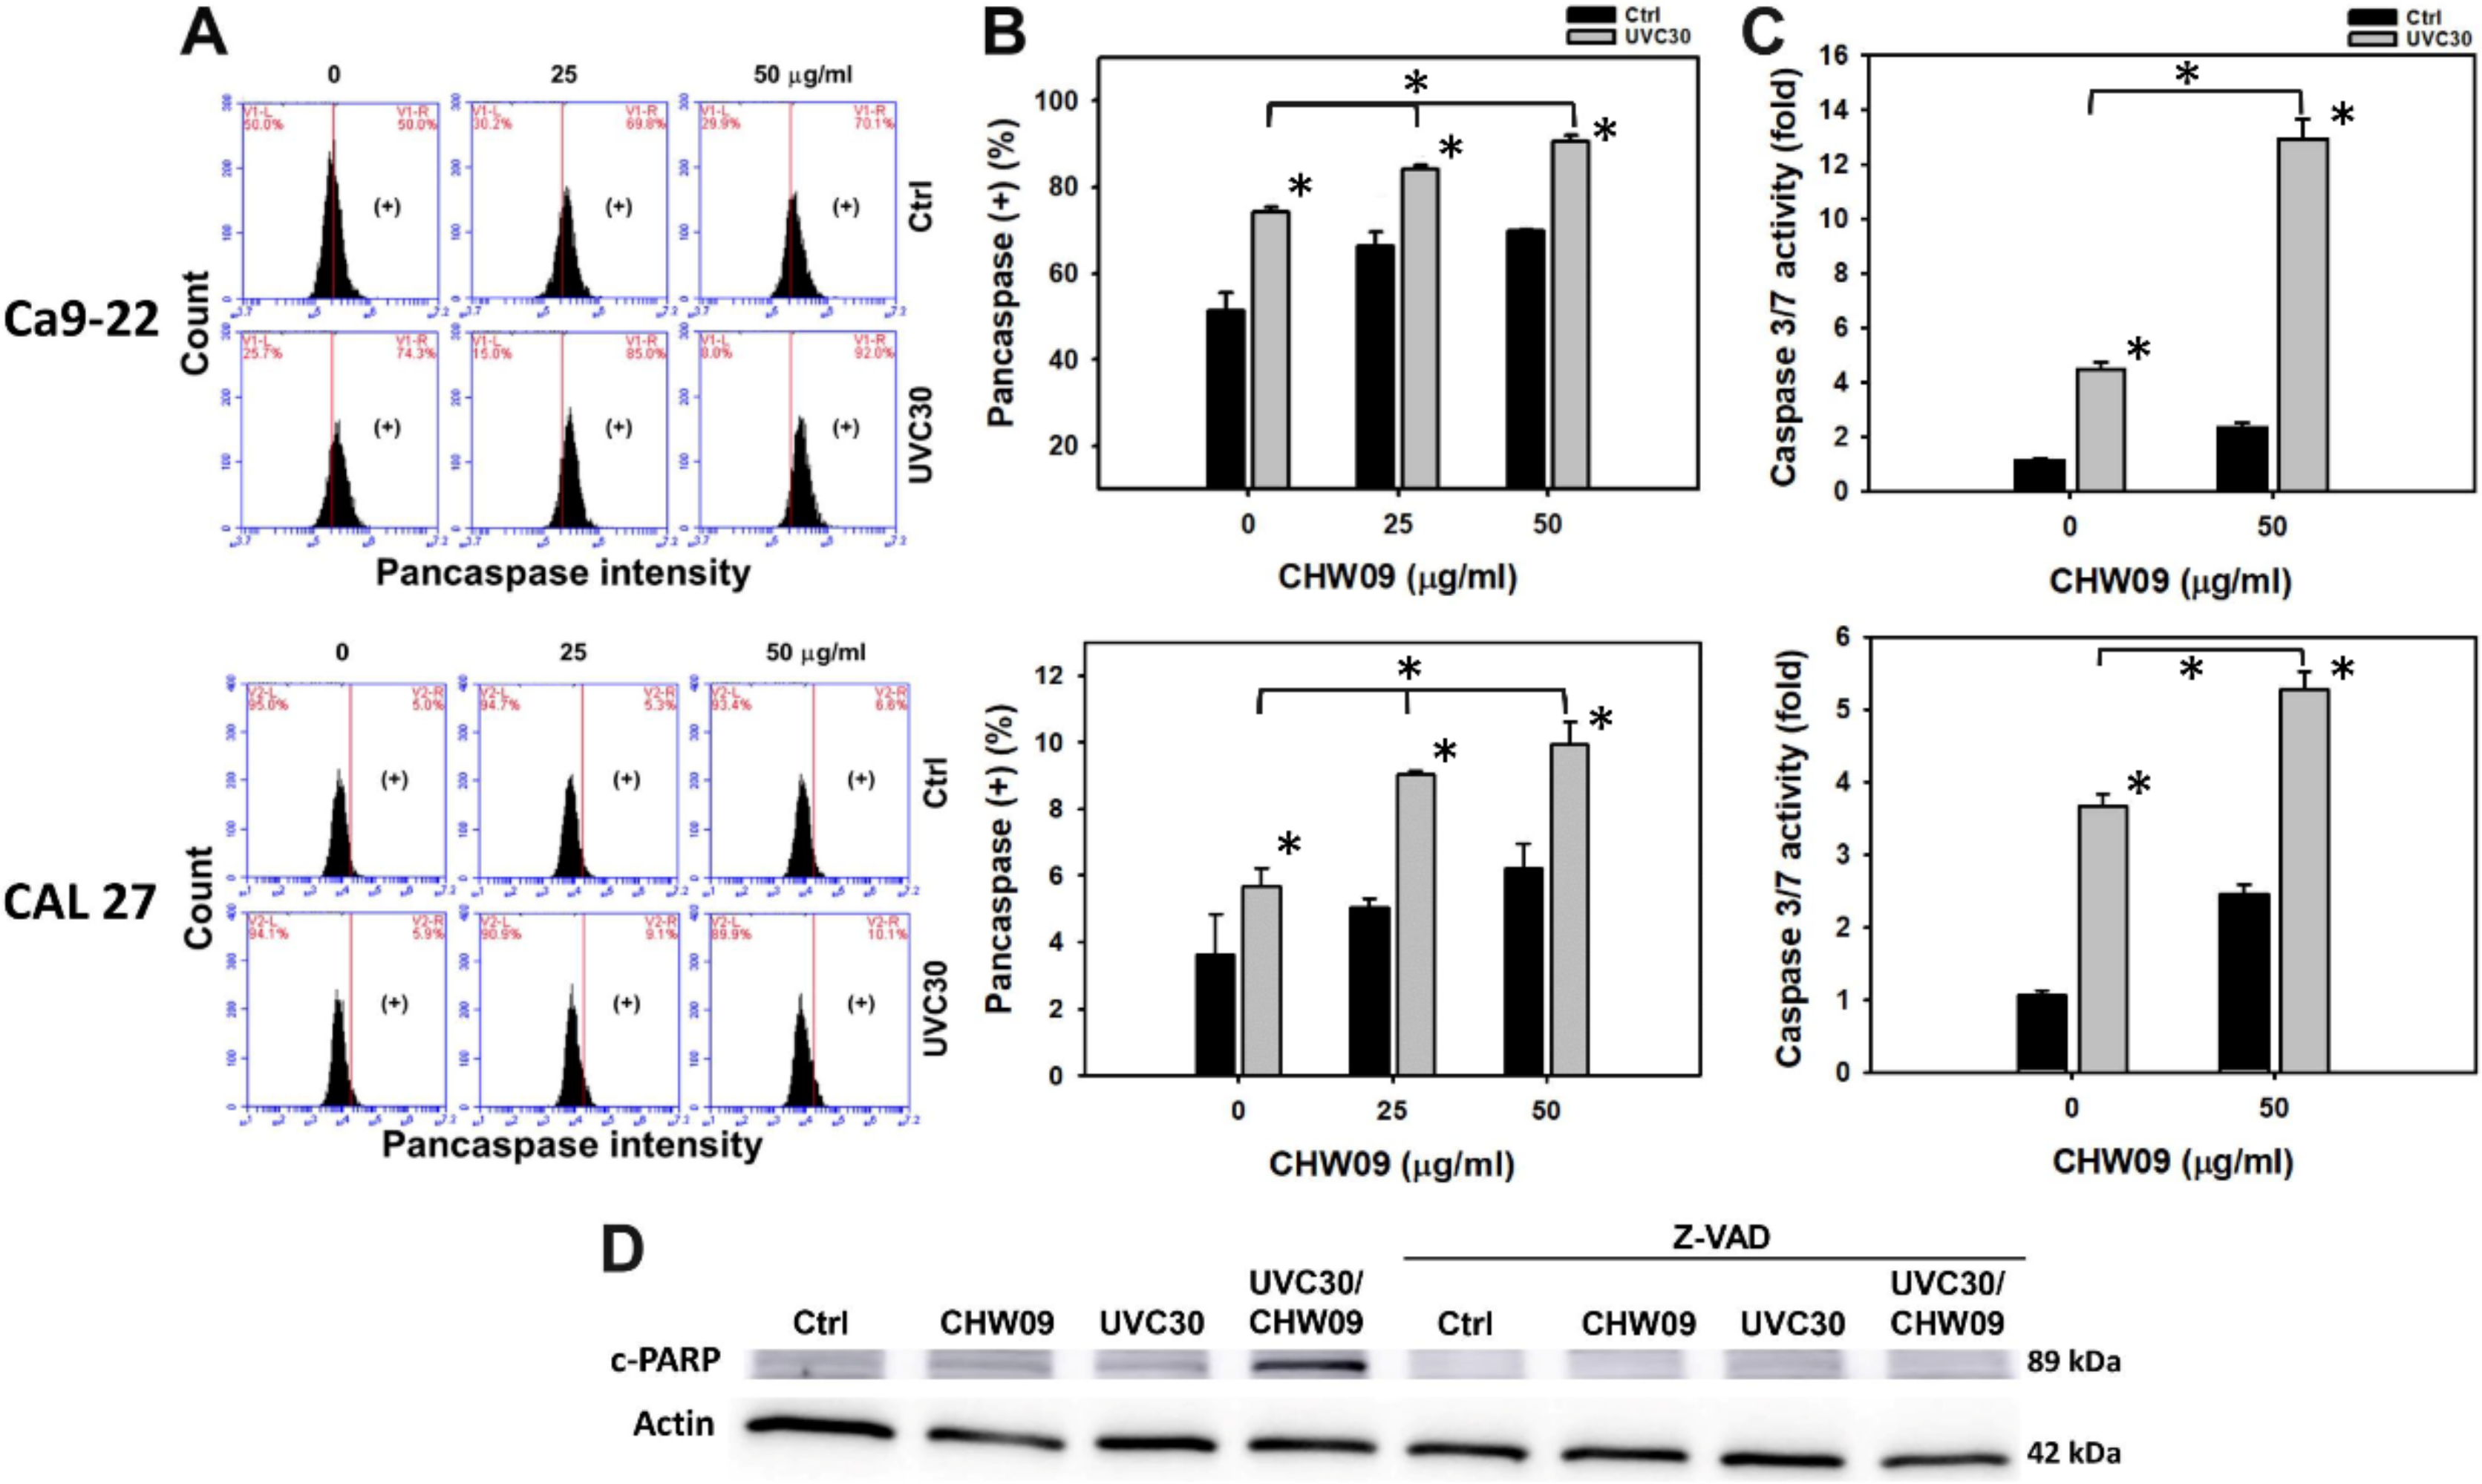
2.4. UVC/CHW09 Combined Treatment Shows High Caspase Activity to Oral Cancer Cells
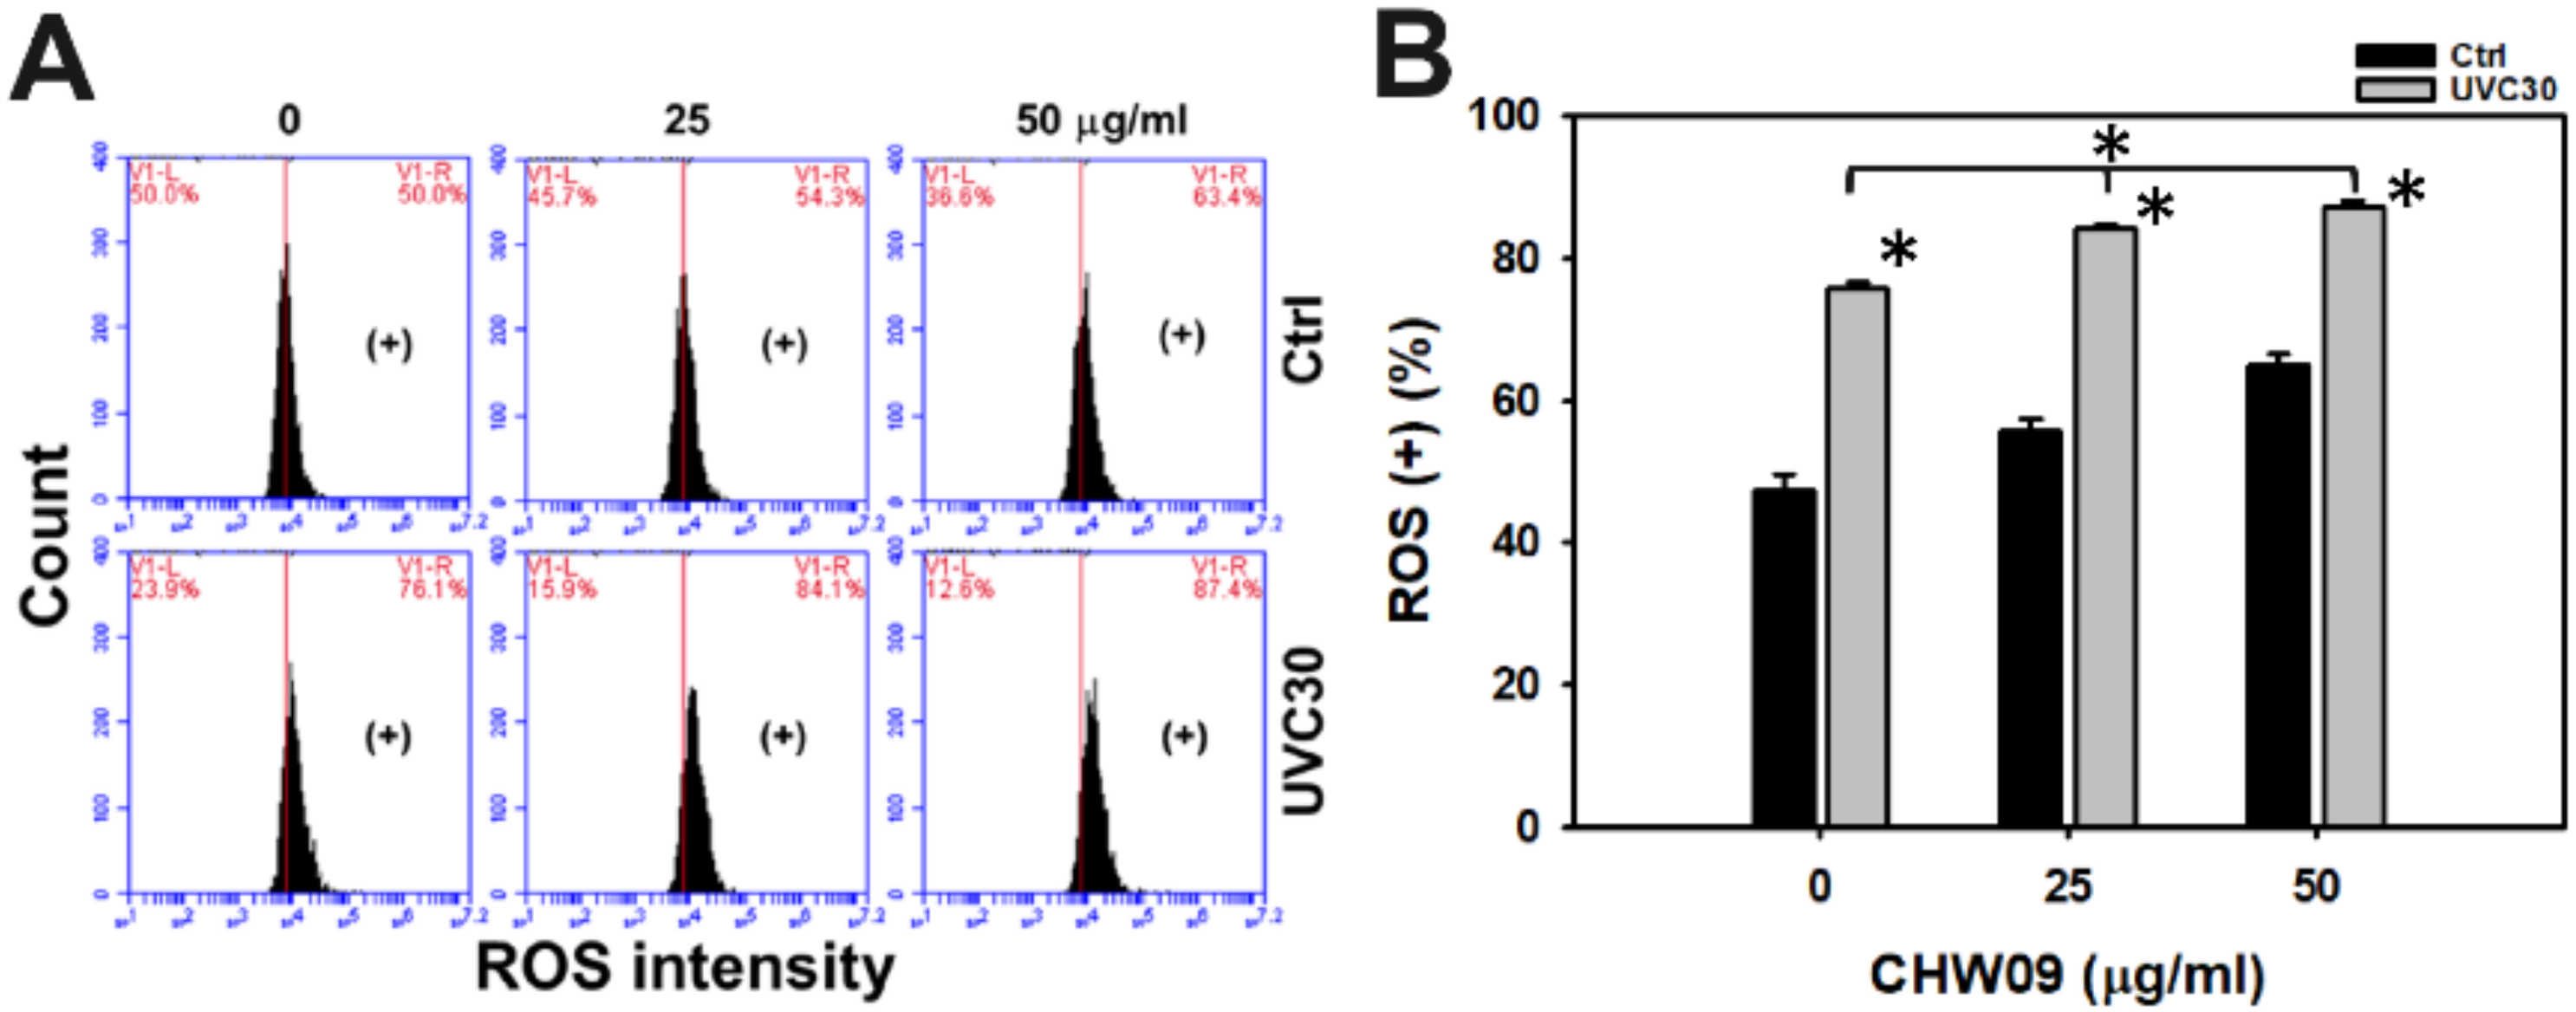
2.5. UVC/CHW09 Combined Treatment Shows High Reactive Oxygen Species (ROS) Generation to Oral Cancer Cells
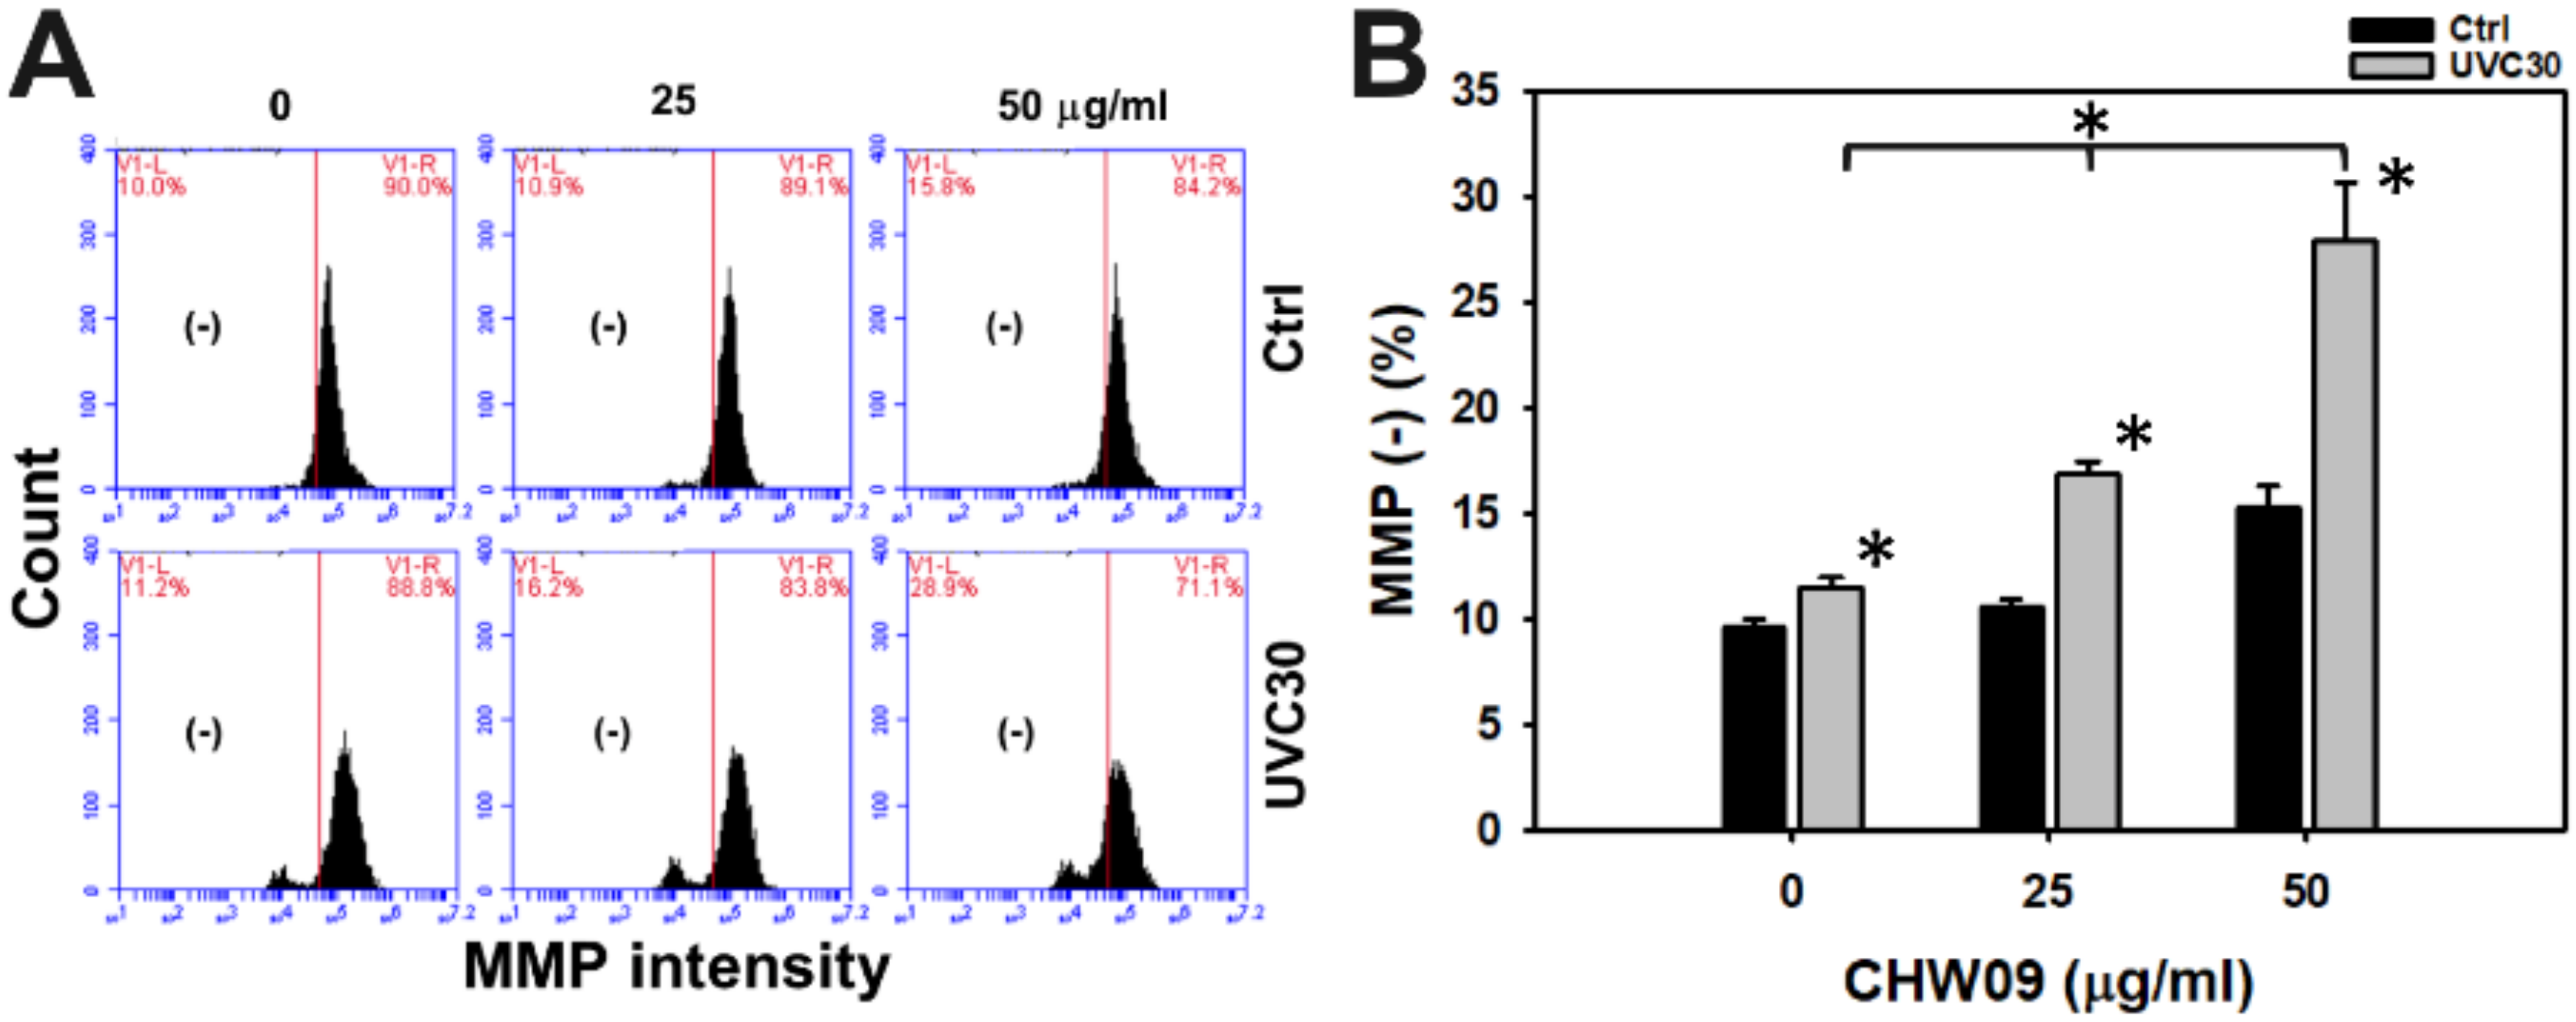
2.6. UVC/CHW09 Combined Treatment Shows High Mitochondrial Membrane Potential (MMP) Depletion to Oral Cancer Cells
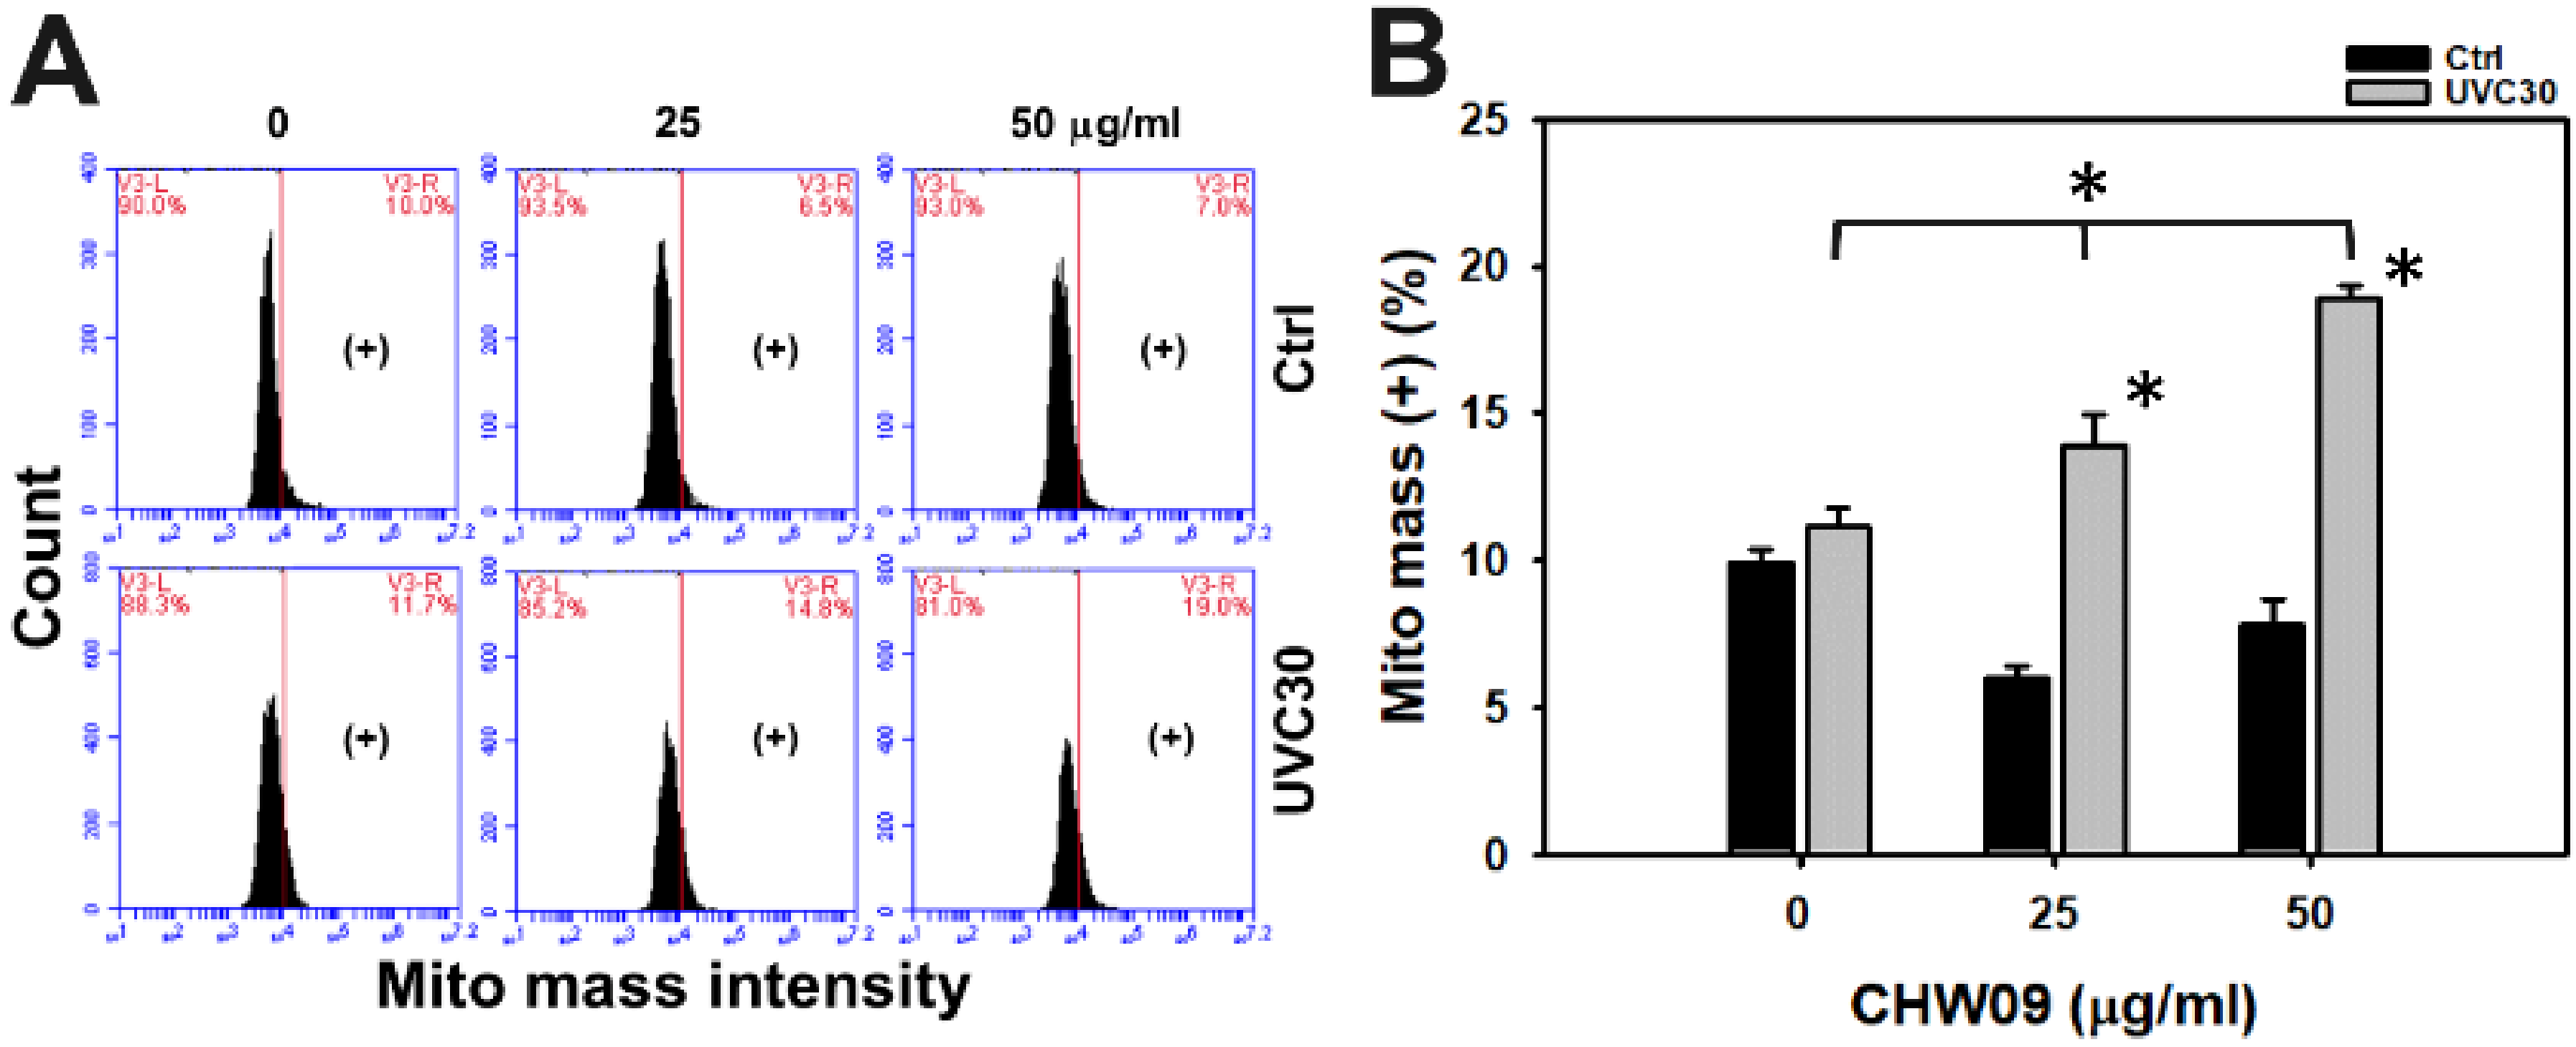
2.7. UVC/CHW09 Combined Treatment Shows High Mitochondrial Mass (Mito Mass) to Oral Cancer Cells
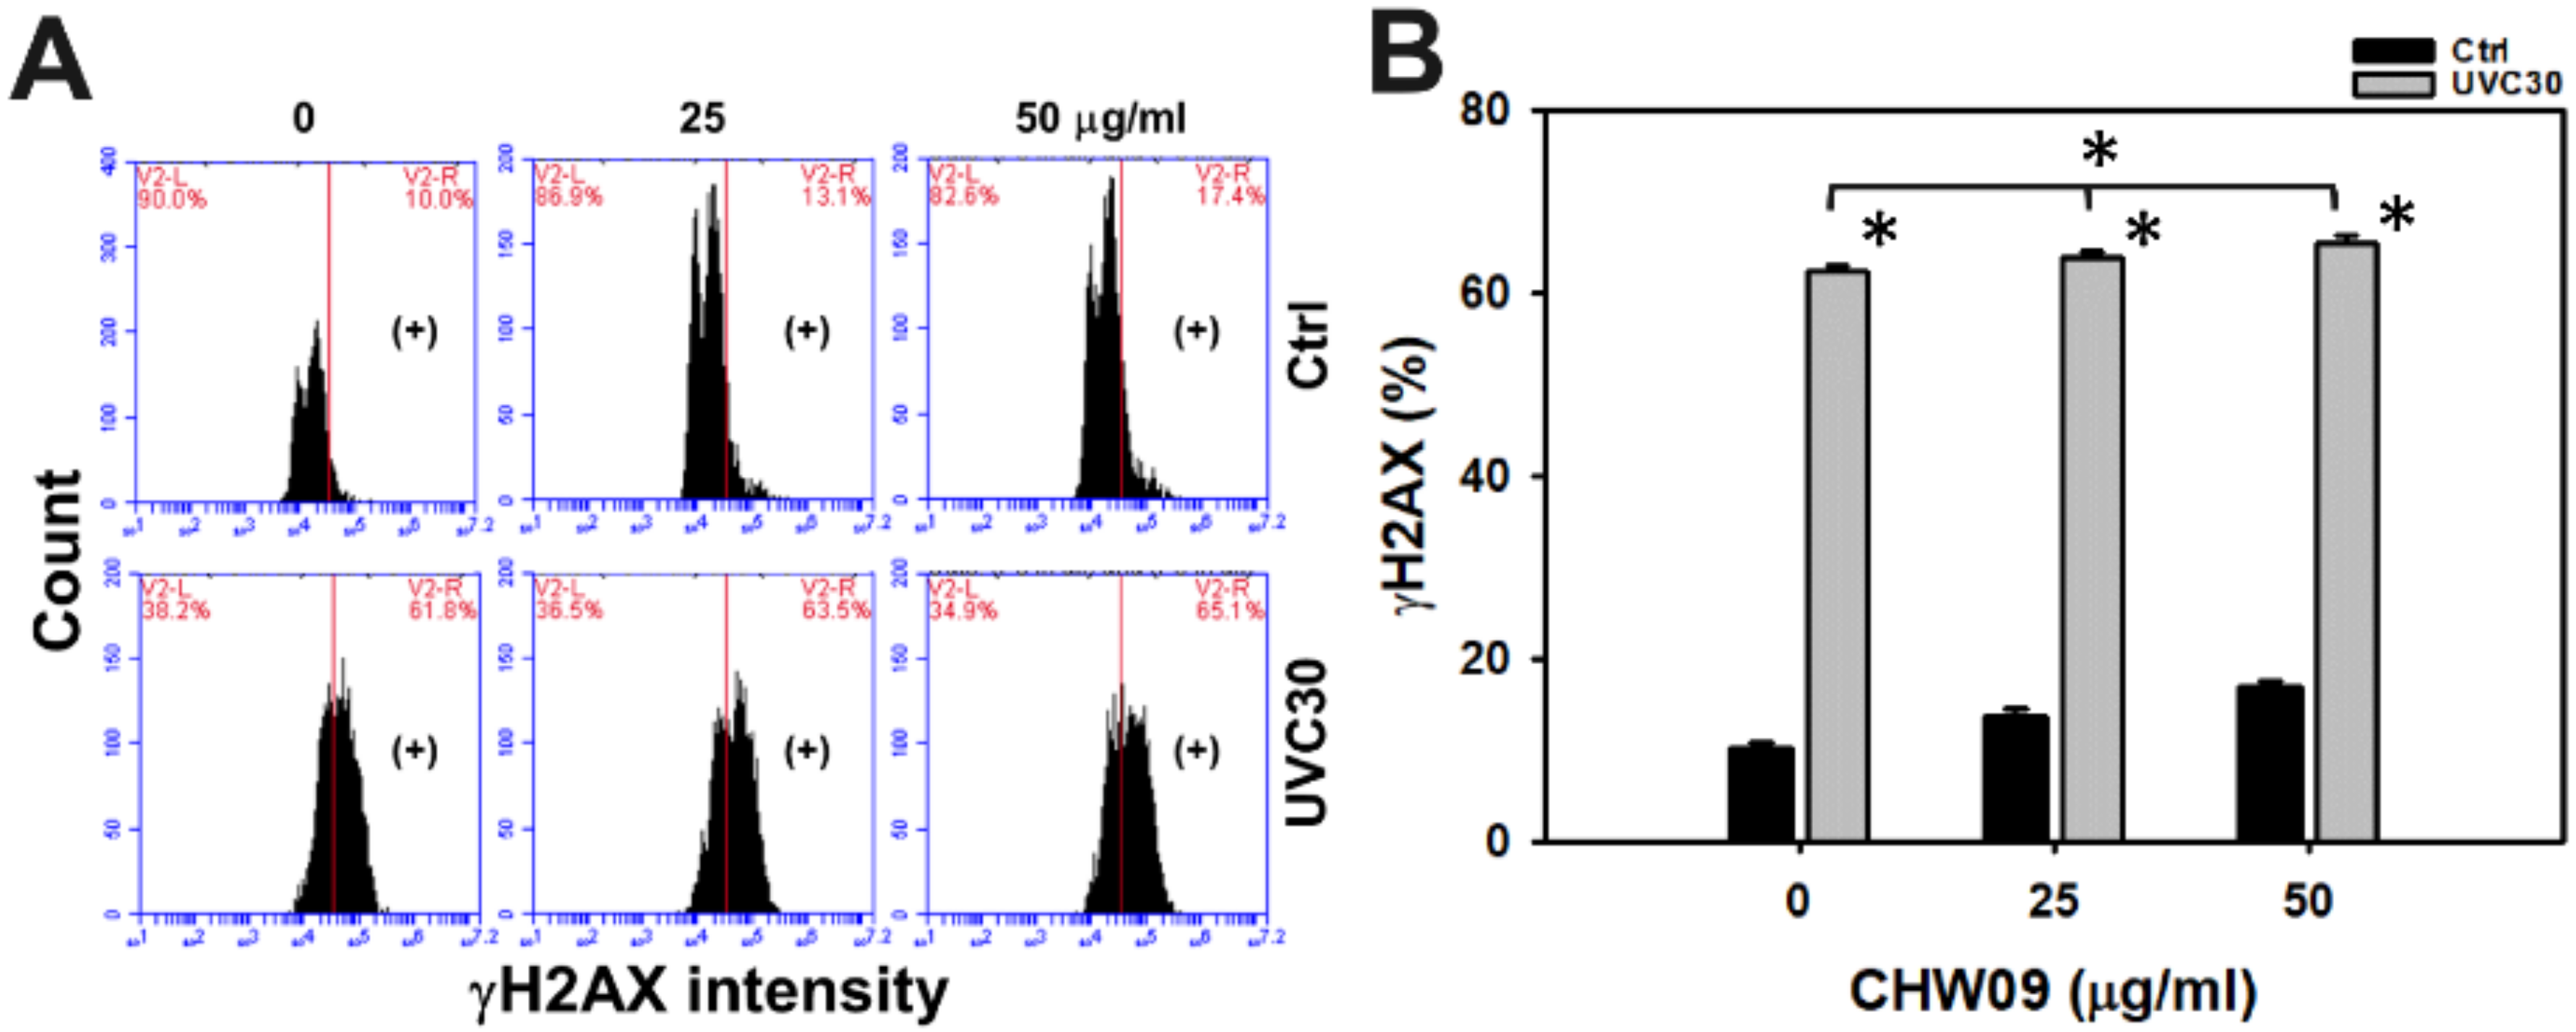
2.8. UVC/CHW09 Combined Treatment Showed High H2A Histone Family Member X (γH2AX) Content to Oral Cancer Cells
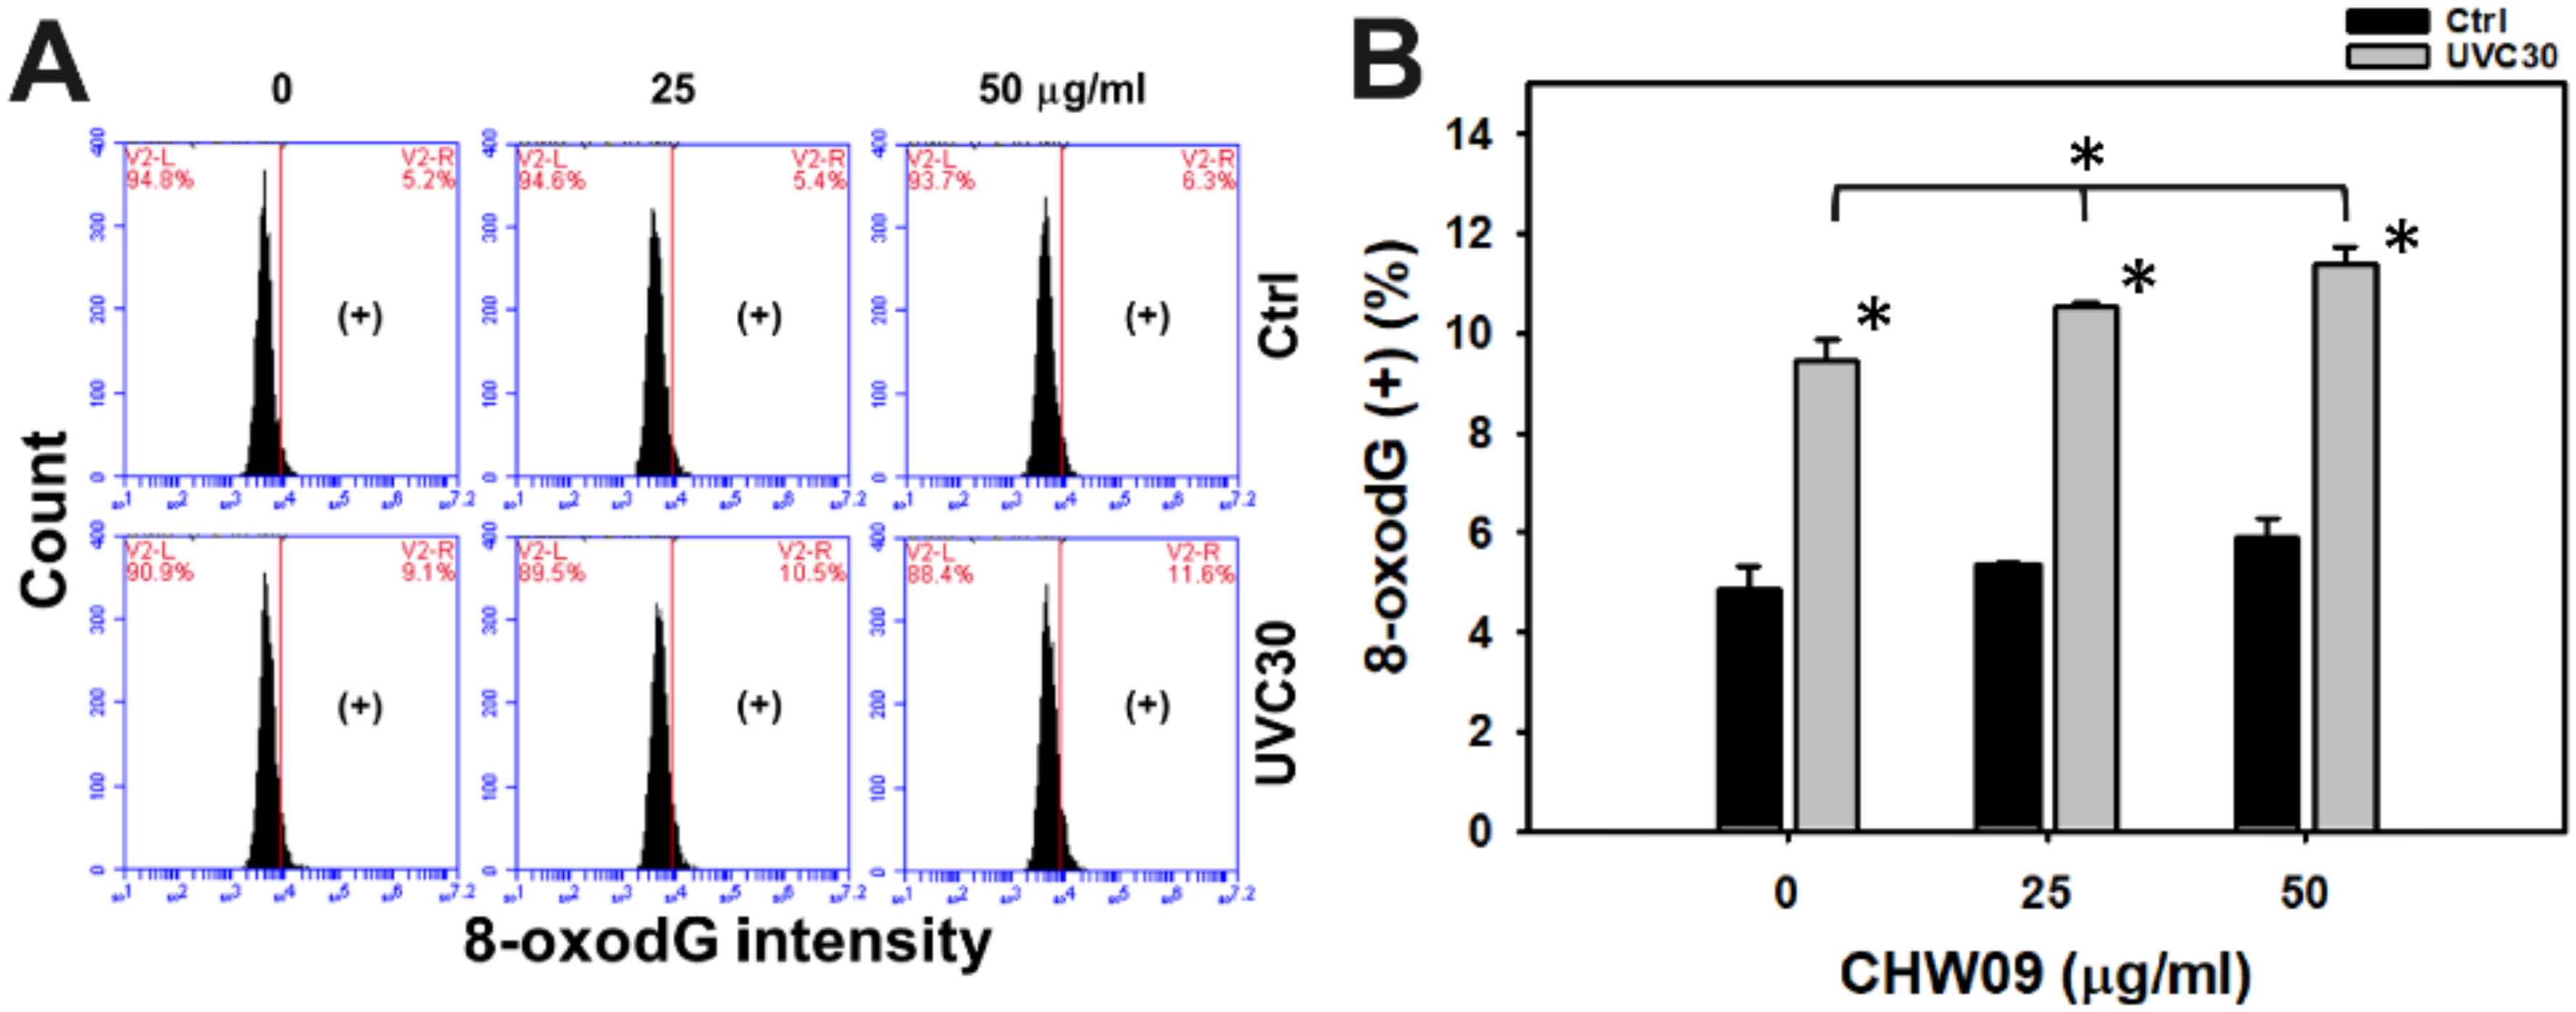
2.9. UVC/CHW09 Combined Treatment Shows High 8-Oxo-2’-Deoxyguanosine (8-OxodG) Content to Oral Cancer Cells
3. Discussion
3.1. CHW09 Is a Potential UVC Sensitizer
3.2. Oxidative Stress and Mito Mass Contribute to Enhance UVC Induced Proliferation Inhibition of CHW09 to Oral Cancer Cells
3.3. DNA Damage Contributes to Enhance UVC Induced Inhibitory Proliferation of CHW09 to Oral Cancer Cells
3.4. Apoptosis Contributes to Enhance UVC Induced Inhibitory Proliferation of CHW09 to Oral Cancer Cells
4. Materials and Methods
4.1. Cell Cultures, CHW09, Inhibitor, and Antibodies
4.2. UVC Irradiation and/or CHW09 Treatment
4.3. Cell Viability
4.4. Cell Cycle Analysis
4.5. Annexin V/7AAD Analysis
4.6. Pancaspase and Cas 3/7 Activity Analysis
4.7. ROS Analysis
4.8. MMP Analysis
4.9. Mito Mass Analysis
4.10. γH2AX Analysis
4.11. 8-OxodG Analysis
4.12. Statistical Analysis
5. Conclusions
Supplementary Materials
Author Contributions
Funding
Conflicts of Interest
References
- Lin, A. radiation therapy for oral cavity and oropharyngeal cancers. Dent. Clin. N. Am. 2018, 62, 99–109. [Google Scholar] [CrossRef] [PubMed]
- Hartner, L. Chemotherapy for oral cancer. Dent. Clin. N. Am. 2018, 62, 87–97. [Google Scholar] [CrossRef] [PubMed]
- Wang, S.-C.; Ji, H.-X.; Hsiao, C.-L.; Wang, T.-C.; Syu, Y.-R.; Miao, C.-E.; Hou, L.-L.; Lin, S.-S.; Chang, W.-S.; Tsai, C.-W. Protective effects of pyridoxamine against UVC-induced programmed cell death in HaCaT cells. Vivo 2015, 29, 379–383. [Google Scholar]
- Lee, Y.-S.; Doonan, B.B.; Wu, J.M.; Hsieh, T.-C. Combined metformin and resveratrol confers protection against UVC-induced DNA damage in A549 lung cancer cells via modulation of cell cycle checkpoints and DNA repair. Oncol. Rep. 2016, 35, 3735–3741. [Google Scholar] [CrossRef] [PubMed] [Green Version]
- Kawaguchi, J.; Adachi, S.; Yasuda, I.; Yamauchi, T.; Nakashima, M.; Ohno, T.; Shimizu, M.; Yoshioka, T.; Itani, M.; Kozawa, O.; et al. Cisplatin and ultra-violet-C synergistically down-regulate receptor tyrosine kinases in human colorectal cancer cells. Mol. Cancer 2012, 11, 45. [Google Scholar] [CrossRef] [Green Version]
- Chang, H.-W.; Tang, J.-Y.; Yen, C.-Y.; Chang, H.-S.; Huang, H.-W.; Chung, Y.-A.; Chen, I.-S.; Huang, M.-Y. Synergistic anti-oral cancer effects of UVC and methanolic extracts of Cryptocarya concinna roots via apoptosis, oxidative stress and DNA damage. Int. J. Radiat. Boil. 2016, 92, 1–10. [Google Scholar] [CrossRef]
- Tang, J.-Y.; Wu, C.-Y.; Shu, C.-W.; Wang, S.-C.; Chang, M.-Y.; Chang, H.-W. A novel sulfonyl chromen-4-ones (CHW09) preferentially kills oral cancer cells showing apoptosis, oxidative stress, and DNA damage. Environ. Toxicol. 2018, 33, 1195–1203. [Google Scholar] [CrossRef]
- Tang, J.-Y.; Shu, C.-W.; Wang, C.-L.; Wang, S.-C.; Chang, M.-Y.; Lin, L.-C.; Chang, H.-W. Sulfonyl chromen-4-ones (CHW09) shows an additive effect to inhibit cell growth of X-ray irradiated oral cancer cells, involving apoptosis and ROS generation. Int. J. Radiat. Boil. 2019, 95, 1226–1235. [Google Scholar] [CrossRef]
- Chan, W.-H.; Yu, J.-S. Inhibition of UV irradiation-induced oxidative stress and apoptotic biochemical changes in human epidermal carcinoma A431 cells by genistein. J. Cell. Biochem. 2000, 78, 73–84. [Google Scholar] [CrossRef]
- Wlodkowic, D.; Skommer, J.; Darzynkiewicz, Z. Flow cytometry-based apoptosis detection. Methods Mol. Biol. 2009, 559, 19–32. [Google Scholar] [CrossRef] [Green Version]
- De Jager, T.L.; Cockrell, A.E.; Du Plessis, S.S. Ultraviolet light induced generation of reactive oxygen species. Adv. Exp. Med. Biol. 2017, 996, 15–23. [Google Scholar] [CrossRef] [PubMed]
- Wei, Y.-H.; Lee, C.-F.; Lee5, H.-C.; Ma, Y.-S.; Wang, C.-W.; Lu, C.-Y.; Pang, C.-Y. Increases of mitochondrial mass and mitochondrial genome in association with enhanced oxidative stress in human cells harboring 4977 BP-deleted mitochondrial DNA. Ann. N. Y. Acad. Sci. 2001, 928, 97–112. [Google Scholar] [CrossRef] [PubMed]
- Kryston, T.B.; Georgiev, A.B.; Pissis, P.; Georgakilas, A.G. Role of oxidative stress and DNA damage in human carcinogenesis. Mutat. Res. Mol. Mech. Mutagen. 2011, 711, 193–201. [Google Scholar] [CrossRef] [PubMed]
- Chen, Y.; Liu, H.-R.; Cheng, M.; Xia, P.; Qian, K.; Wu, P.-C.; Lai, C.-Y.; Xia, Y.; Yang, Z.-Y.; Morris-Natschke, S.L.; et al. Antitumor agents 292. Design, synthesis and pharmacological study of S- and O-substituted 7-mercapto- or hydroxy-coumarins and chromones as potent cytotoxic agents. Eur. J. Med. Chem. 2012, 49, 74–85. [Google Scholar] [CrossRef] [PubMed]
- Apostolova, N.; Gomez-Sucerquia, L.; Moran, A.; Alvarez, A.; Blas-Garcia, A.; Esplugues, J. Enhanced oxidative stress and increased mitochondrial mass during Efavirenz-induced apoptosis in human hepatic cells. Br. J. Pharmacol. 2010, 160, 2069–2084. [Google Scholar] [CrossRef] [Green Version]
- Trachootham, D.; Alexandre, J.; Huang, P. Targeting cancer cells by ROS-mediated mechanisms: A radical therapeutic approach? Nat. Rev. Drug Discov. 2009, 8, 579–591. [Google Scholar] [CrossRef]
- Huang, M.L.-H.; Chiang, S.; Kalinowski, D.S.; Bae, D.-H.; Sahni, S.; Richardson, D.R. The role of the antioxidant response in mitochondrial dysfunction in degenerative diseases: Cross-Talk between antioxidant defense, autophagy, and apoptosis. Oxidative Med. Cell. Longev. 2019, 2019, 26. [Google Scholar] [CrossRef] [Green Version]
- Tang, J.-Y.; Ou-Yang, F.; Hou, M.-F.; Huang, H.-W.; Wang, H.-R.; Li, K.-T.; Fayyaz, S.; Shu, C.-W.; Chang, H.-W.; Farooqi, A.A. Oxidative stress-modulating drugs have preferential anticancer effects involving the regulation of apoptosis, DNA damage, endoplasmic reticulum stress, autophagy, metabolism, and migration. Semin. Cancer Boil. 2019, 58, 109–117. [Google Scholar] [CrossRef]
- Salehi, F.; Behboudi, H.; Kavoosi, G.; Ardestani, S.K. Oxidative DNA damage induced by ROS-modulating agents with the ability to target DNA: A comparison of the biological characteristics of citrus pectin and apple pectin. Sci. Rep. 2018, 8, 13902. [Google Scholar] [CrossRef]
- Hanasoge, S.; Ljungman, M. H2AX phosphorylation after UV irradiation is triggered by DNA repair intermediates and is mediated by the ATR kinase. Carcinogenesis 2007, 28, 2298–2304. [Google Scholar] [CrossRef]
- Wakasugi, M.; Sasaki, T.; Matsumoto, M.; Nagaoka, M.; Inoue, K.; Inobe, M.; Horibata, K.; Tanaka, K.; Matsunaga, T. Nucleotide excision repair-dependent DNA double-strand break formation and ATM signaling activation in mammalian quiescent cells. J. Boil. Chem. 2014, 289, 28730–28737. [Google Scholar] [CrossRef] [PubMed] [Green Version]
- Evans, M.; Cooke, M.S.; Podmore, I.D.; Zheng, Q.; Herbert, K.E.; Lunec, J. Discrepancies in the measurement of UVC-induced 8-Oxo-2′-deoxyguanosine: Implications for the analysis of oxidative DNA damage. Biochem. Biophys. Res. Commun. 1999, 259, 374–378. [Google Scholar] [CrossRef] [PubMed]
- McAdam, E.; Brem, R.; Karran, P. Oxidative stress-induced protein damage inhibits DNA repair and determines mutation risk and therapeutic efficacy. Mol. Cancer Res. 2016, 14, 612–622. [Google Scholar] [CrossRef] [PubMed] [Green Version]
- Van Houten, B.; Santa-Gonzalez, G.A.; Camargo, M. DNA repair after oxidative stress: Current challenges. Curr. Opin. Toxicol. 2017, 7, 9–16. [Google Scholar] [CrossRef]
- Davies, M.J. Protein oxidation and peroxidation. Biochem. J. 2016, 473, 805–825. [Google Scholar] [CrossRef] [Green Version]
- Janion, K.; Szczepańska, E.; Nowakowska-Zajdel, E.; Walkiewicz, K.; Strzelczyk, J. Lipid peroxidation and total oxidant/antioxidant status in colorectal cancer patients. J Biol Regul Homeost Agents 2020, 34, 239–244. [Google Scholar]
- Farooqi, A.A.; Li, K.-T.; Fayyaz, S.; Chang, Y.-T.; Ismail, M.; Liaw, C.-C.; Yuan, S.-S.F.; Tang, J.-Y.; Chang, H.-W. Anticancer drugs for the modulation of endoplasmic reticulum stress and oxidative stress. Tumor Boil. 2015, 36, 5743–5752. [Google Scholar] [CrossRef] [Green Version]
- Matés, J.M.; Segura, J.A.; Alonso, F.J.; Márquez, J.D. Oxidative stress in apoptosis and cancer: An update. Arch. Toxicol. 2012, 86, 1649–1665. [Google Scholar] [CrossRef]
- Yeh, C.-C.; Yang, J.-I.; Lee, J.-C.; Tseng, C.-N.; Chan, Y.-C.; Hseu, Y.-C.; Tang, J.-Y.; Chuang, L.-Y.; Huang, H.-W.; Chang, F.-R.; et al. Anti-proliferative effect of methanolic extract of Gracilaria tenuistipitata on oral cancer cells involves apoptosis, DNA damage, and oxidative stress. BMC Complement. Altern. Med. 2012, 12, 142. [Google Scholar] [CrossRef] [Green Version]
- Yen, C.-Y.; Chiu, C.-C.; Haung, R.-W.; Yeh, C.-C.; Huang, K.-J.; Chang, K.-F.; Hseu, Y.-C.; Chang, F.-R.; Chang, H.-W.; Wu, Y.-C. Antiproliferative effects of goniothalamin on Ca9-22 oral cancer cells through apoptosis, DNA damage and ROS induction. Mutat. Res. Toxicol. Environ. Mutagen. 2012, 747, 253–258. [Google Scholar] [CrossRef]
- Chiu, C.C.; Haung, J.W.; Chang, F.R.; Huang, K.J.; Huang, H.M.; Huang, H.W.; Chou, C.K.; Wu, Y.C.; Chang, H.W. Golden berry-derived 4beta-hydroxywithanolide E for selectively killing oral cancer cells by generating ROS, DNA damage, and apoptotic pathways. PLoS ONE 2013, 8, e64739. [Google Scholar] [CrossRef] [Green Version]
- Hiyama, H.; Reeves, S.A. Role for cyclin D1 in UVC-induced and p53-mediated apoptosis. Cell Death Differ. 1999, 6, 565–569. [Google Scholar] [CrossRef] [Green Version]
- Yen, Y.-H.; Farooqi, A.A.; Li, K.-T.; Butt, G.; Tang, J.-Y.; Wu, C.-Y.; Cheng, Y.-B.; Hou, M.-F.; Chang, H.-W. Methanolic extracts of Solieria robusta inhibits proliferation of oral cancer Ca9-22 cells via apoptosis and oxidative stress. Molecules 2014, 19, 18721–18732. [Google Scholar] [CrossRef] [PubMed] [Green Version]
- Wang, H.-R.; Tang, J.-Y.; Wang, Y.-Y.; Farooqi, A.A.; Yen, C.-Y.; Yuan, S.-S.F.; Huang, H.-W.; Chang, H.-W. Manoalide preferentially provides antiproliferation of oral cancer cells by oxidative stress-mediated apoptosis and DNA damage. Cancers 2019, 11, 1303. [Google Scholar] [CrossRef] [PubMed] [Green Version]
- Chen, C.-Y.; Yen, C.-Y.; Wang, H.-R.; Yang, H.-P.; Tang, J.-Y.; Huang, H.-W.; Hsu, S.-H.; Chang, H.-W. Tenuifolide B from Cinnamomum tenuifolium stem selectively inhibits proliferation of oral cancer cells via apoptosis, ROS generation, mitochondrial depolarization, and DNA damage. Toxins 2016, 8, 319. [Google Scholar] [CrossRef] [PubMed]
- Chang, H.W.; Lai, Y.C.; Cheng, C.Y.; Ho, J.L.; Ding, S.T.; Liu, Y.C. UV inducibility of rat proliferating cell nuclear antigen gene promoter. J. Cell Biochem. 1999, 73, 423–432. [Google Scholar] [CrossRef]
- Vignon, C.; Debeissat, C.; Georget, M.-T.; Bouscary, D.; Gyan, E.; Rosset, P.; Herault, O. Flow cytometric quantification of all phases of the cell cycle and apoptosis in a two-color fluorescence plot. PLoS ONE 2013, 8, e68425. [Google Scholar] [CrossRef] [Green Version]
- Chang, H.-W.; Li, R.-N.; Wang, H.-R.; Liu, J.-R.; Tang, J.-Y.; Huang, H.-W.; Chan, Y.-H.; Yen, C.-Y. Withaferin a induces oxidative stress-mediated apoptosis and DNA damage in oral cancer cells. Front. Physiol. 2017, 8, 634. [Google Scholar] [CrossRef] [Green Version]
- Yeh, C.-C.; Tseng, C.-N.; Yang, J.-I.; Huang, H.-W.; Fang, Y.; Tang, J.-Y.; Chang, F.-R.; Chang, H.-W. Antiproliferation and induction of apoptosis in Ca9-22 oral cancer cells by ethanolic extract of Gracilaria tenuistipitata. Molecules 2012, 17, 10916–10927. [Google Scholar] [CrossRef] [Green Version]
- Shih, H.-C.; El-Shazly, M.; Juan, Y.-S.; Chang, C.-Y.; Su, J.-H.; Chen, Y.-C.; Shih, S.-P.; Chen, H.-M.; Wu, Y.-C.; Lu, M.-C. Cracking the cytotoxicity code: Apoptotic induction of 10-Acetylirciformonin B is mediated through ROS generation and mitochondrial dysfunction. Mar. Drugs 2014, 12, 3072–3090. [Google Scholar] [CrossRef] [Green Version]
- Tang, J.; Peng, S.; Cheng, Y.; Wang, C.; Farooqi, A.A.; Yu, T.; Hou, M.-F.; Wang, S.; Yen, C.; Chan, L.; et al. Ethyl acetate extract of Nepenthes adrianii x clipeata induces antiproliferation, apoptosis, and DNA damage against oral cancer cells through oxidative stress. Environ. Toxicol. 2019, 34, 891–901. [Google Scholar] [CrossRef] [PubMed]
- Tang, J.Y.; Huang, H.W.; Wang, H.R.; Chan, Y.C.; Haung, J.W.; Shu, C.W.; Wu, Y.C.; Chang, H.W. 4beta-hydroxywithanolide E selectively induces oxidative DNA damage for selective killing of oral cancer cells. Environ. Toxicol. 2018, 33, 295–304. [Google Scholar] [CrossRef] [PubMed]


© 2020 by the authors. Licensee MDPI, Basel, Switzerland. This article is an open access article distributed under the terms and conditions of the Creative Commons Attribution (CC BY) license (http://creativecommons.org/licenses/by/4.0/).
Share and Cite
Wang, S.-C.; Wang, Y.-Y.; Lin, L.-C.; Chang, M.-Y.; Yuan, S.-S.F.; Tang, J.-Y.; Chang, H.-W. Combined Treatment of Sulfonyl Chromen-4-Ones (CHW09) and Ultraviolet-C (UVC) Enhances Proliferation Inhibition, Apoptosis, Oxidative Stress, and DNA Damage against Oral Cancer Cells. Int. J. Mol. Sci. 2020, 21, 6443. https://0-doi-org.brum.beds.ac.uk/10.3390/ijms21176443
Wang S-C, Wang Y-Y, Lin L-C, Chang M-Y, Yuan S-SF, Tang J-Y, Chang H-W. Combined Treatment of Sulfonyl Chromen-4-Ones (CHW09) and Ultraviolet-C (UVC) Enhances Proliferation Inhibition, Apoptosis, Oxidative Stress, and DNA Damage against Oral Cancer Cells. International Journal of Molecular Sciences. 2020; 21(17):6443. https://0-doi-org.brum.beds.ac.uk/10.3390/ijms21176443
Chicago/Turabian StyleWang, Sheng-Chieh, Yen-Yun Wang, Li-Ching Lin, Meng-Yang Chang, Shyng-Shiou F. Yuan, Jen-Yang Tang, and Hsueh-Wei Chang. 2020. "Combined Treatment of Sulfonyl Chromen-4-Ones (CHW09) and Ultraviolet-C (UVC) Enhances Proliferation Inhibition, Apoptosis, Oxidative Stress, and DNA Damage against Oral Cancer Cells" International Journal of Molecular Sciences 21, no. 17: 6443. https://0-doi-org.brum.beds.ac.uk/10.3390/ijms21176443