Article

Role of the Transcription Factor Yin Yang 1 and Its Selectively Identified Target Survivin in High-Grade B-Cells Non-Hodgkin Lymphomas: Potential Diagnostic and Therapeutic Targets

1
Laboratory of Translational Oncology, Department of Biomedical and Biotechnological Sciences, University of Catania, 95123 Catania, Italy
2
Epidemiology Unit, IRCCS Istituto Nazionale Tumori ‘Fondazione G. Pascale’, 80131 Naples, Italy
3
Research Center for Prevention, Diagnosis and Treatment of Cancer, University of Catania, 95123 Catania, Italy
4
Laboratory of Virology, Department of Biomedical and Biotechnological Sciences, University of Catania, 95123 Catania, Italy
5
Department of Medical and Surgical Sciences and Advanced Technology “G.F. Ingrassia”, University of Catania, 95123 Catania, Sicily, Italy
6
Department of Microbiology, Immunology and Molecular Genetics, David Geffen School of Medicine, University of California, Los Angeles, CA 90095, USA
*
Author to whom correspondence should be addressed.
Current address: Department of Medicine, Boston University School of Medicine, Boston, MA 02118, USA.
Int. J. Mol. Sci. 2020, 21(17), 6446; https://0-doi-org.brum.beds.ac.uk/10.3390/ijms21176446
Submission received: 24 July 2020 / Revised: 21 August 2020 / Accepted: 2 September 2020 / Published: 3 September 2020
(This article belongs to the Special Issue Transcription Factors in Cancer)

Abstract

:
B-cell non-Hodgkin lymphomas (B-NHLs) are often characterized by the development of resistance to chemotherapeutic drugs and/or relapse. During drug-induced apoptosis, Yin Yang 1 (YY1) transcription factor might modulate the expression of apoptotic regulators genes. The present study was aimed to: (1) examine the potential oncogenic role of YY1 in reversing drug resistance in B-NHLs; and (2) identify YY1 transcriptional target(s) that regulate the apoptotic pathway in B-NHLs. Predictive analyses coupled with database-deposited data suggested that YY1 binds the promoter of the BIRC5/survivin anti-apoptotic gene. Gene Expression Omnibus (GEO) analyses of several B-NHL repositories revealed a conserved positive correlation between YY1 and survivin, both highly expressed, especially in aggressive B-NHLs. Further validation experiments performed in Raji Burkitt’s lymphomas cells, demonstrated that YY1 silencing was associated with survivin downregulation and sensitized the cells to apoptosis. Overall, our results revealed that: (1) YY1 and survivin are positively correlated and overexpressed in B-NHLs, especially in BLs; (2) YY1 strongly binds to the survivin promoter, hence survivin may be suggested as YY1 transcriptional target; (3) YY1 silencing sensitizes Raji cells to drug-induced apoptosis via downregulation of survivin; (4) both YY1 and survivin are potential diagnostic markers and therapeutic targets for the treatment of resistant/relapsed B-NHLs.

Graphical Abstract

1. Introduction

Worldwide, non-Hodgkin lymphomas (NHLs) represent the tenth most frequent cancers in males and the twelfth most diffused tumors in females, respectively, with an estimation of 509,590 new cases and 248,724 deaths in the past 2018, according to The Global Cancer Observatory (GLOBOCAN) of the World Health Organization (WHO) [1]. This group of tumors stems from the malignant transformation of mature and immature cells of the immune system, affecting either B lymphocytes (B cells, representing around 86% of all NHLs), but also T- and natural killer (NK) cells (14% of all NHLs) [1]. According to the disease progression features, B-cells NHLs (B-NHLs) are further divided in aggressive—fast progressing—including Diffuse large B-cell lymphoma (DLBCL) and Burkitt’s lymphoma (BL) and indolent—slow growing—such as for example Follicular lymphoma (FL), Mantle Cell lymphoma (MCL), B-cell small lymphocytic lymphoma/chronic lymphocytic leukemia, Marginal Zone B-cell lymphoma (MZL) and lymphoplasmacytic lymphoma/Waldenström macroglobulinemia [2]. The main issue with NHLs, which could explain the still high global mortality rate, consists in their frequent resistance following anti-cancer treatments and relapse, which the current research is trying to fight by developing novel therapeutic strategies [3,4].
Yin Yang 1 (YY1) is a C2H2-type zinc finger protein, conserved amongst species and found ubiquitously expressed in the majority of human tissues and organs. This transcription factor is able to control, either activating or repressing, the transcription of up to the 7% of the whole human genome [5]. For that reason, YY1 may exert profound effects on several important cellular pathways, including the control of cell cycle, DNA repair, chromatin recruitment of Polycomb Group (PcG) proteins, chromatin remodeling, modulation of cellular metabolism, cell survival and programmed cell death [6]. Importantly, the molecular mechanisms by which YY1 modulates the transcription of its target genes are very heterogeneous and strictly dependent on the cellular-specific context [7,8,9]. In fact, YY1 positively or negatively regulates the expression of target genes directly, by binding a conserved 12-mer consensus sequence located within the DNA transcriptional regulatory region, or indirectly, following the interaction either with other transcription factors or with co-activators/co-repressors of the transcription, as well as general epigenetic modulators [6].
In cancer, the pleiotropic YY1 transcription factor plays a controversial role. It is still unclear in which cases YY1 acts as an oncogene or as a tumor suppressor. Therefore, a better comprehension of the YY1-mediated molecular mechanisms that are activated or inhibited in the different kind of cancers may help in the development of novel diagnostics, as well as effective therapeutic strategies [9].
Notably, YY1 plays a crucial role at all stages of B-cells development, in the immunoglobulin class switch recombination process and, also, during lymphomagenesis [10]. Prevalently, in hematological malignancies the role of YY1 seems to be pro-tumorigenic [11]. In this regard, our laboratory has previously demonstrated that YY1 is significantly overexpressed in high-grade lymphomas, including BLs and DLBCLs, when compared to normal B cells [12].
Although previous reports highlighted that YY1 inhibition resulted in the increased sensitization of NHL cells to drug- or immune- induced cell death, all downstream pathways modulated by YY1 have not been comprehensively characterized yet [13,14].
The goal of this study was to better understand the oncogenic function played by YY1 in the regulation of the apoptotic response following chemotherapeutic treatments, and to further shed light on the possible downstream targets of this transcription factor. In-silico JASPAR binding prediction, corroborated by in vitro YY1-ChIP-seq experiments deposited in ENCODE, demonstrated that YY1 strongly binds the BIRC5/survivin promoter, which is a negative regulator of the apoptosis. In addition, the computational analysis performed on several B-NHLs Gene Expression Omnibus (GEO) curated gene expression datasets gave new insights on the significantly correlated upregulation of both YY1 and survivin in cancer patients compared to normal subjects. Importantly, the positive correlation between YY1 and survivin expression was present in all the B-NHLs datasets analyzed, and it was consistently higher in aggressive B-NHLs specimens, including BLs.
Subsequently, by using a cellular model of—aggressive—BL, the Raji cell line, the roles of YY1 and survivin were further validated. Through a shRNA-mediated silencing approach it was possible to assess that survivin was selectively downregulated in association with YY1 knock-down, thus confirming that YY1 may be a potential positive transcriptional regulator of survivin in Raji BL cells. Moreover, the effect of modulating YY1 expression levels on Raji cellular growth, as well as on cellular viability following anti-cancer treatments was evaluated, confirming the pro-tumorigenic role of both YY1 and survivin in these cells. Overall, our findings suggest a potential diagnostic, as well as therapeutic role for both YY1 and survivin in B-NHLs.

2. Results

2.1. JASPAR Screening Allows the Identification of YY1 Putative Binding Sites on the Transcriptional Regulatory Regions of Several Apoptotic Genes: Identification of BIRC5/Survivin

During both B-NHL genesis and progression, YY1 mainly plays a pro-tumorigenic role. Recent studies suggested that YY1 negatively regulates apoptosis in B-NHL cells, therefore promoting pro-survival programs and, in turn, resistance to cytotoxic stimuli. To identify the potential direct transcriptional targets of YY1 in B-NHLs, JASPAR in-silico analysis was performed to search for the presence of YY1 putative binding sites located within the transcriptional regulatory region of the main genes involved in the modulation of the apoptosis, including the BCL2 family members, as well as IAPs members.
Once the 3000 bp long transcriptional regulatory sequence for each considered gene was identified through the use of Ensembl, the analysis of each sequence has been pursued with JASPAR open-access database, by using the deposited matrix of 12-mer binding domain for YY1. Following the in-silico analysis, a panel of 16 best putative YY1 targets candidates was shortlisted. The features of such selected genes in terms of the overall number of YY1 putative binding sites and the homology score have been reported in Table S1. All of the genes reported in the Table show more than one putative binding site for YY1 in their transcriptional regulatory region, with an homology higher than 80% with the 12-mer YY1-matrix sequence deposited in JASPAR, thus suggesting that all of them may be potentially bound by YY1 within their regulatory regions (Table S1). Amongst the best candidates, BIRC5 (or survivin), a member of the IAPs, was selected for further characterization, as it carries 5 putative YY1-binding sites along its DNA transcriptional regulatory region, with a homology higher than 80% (Table 1).

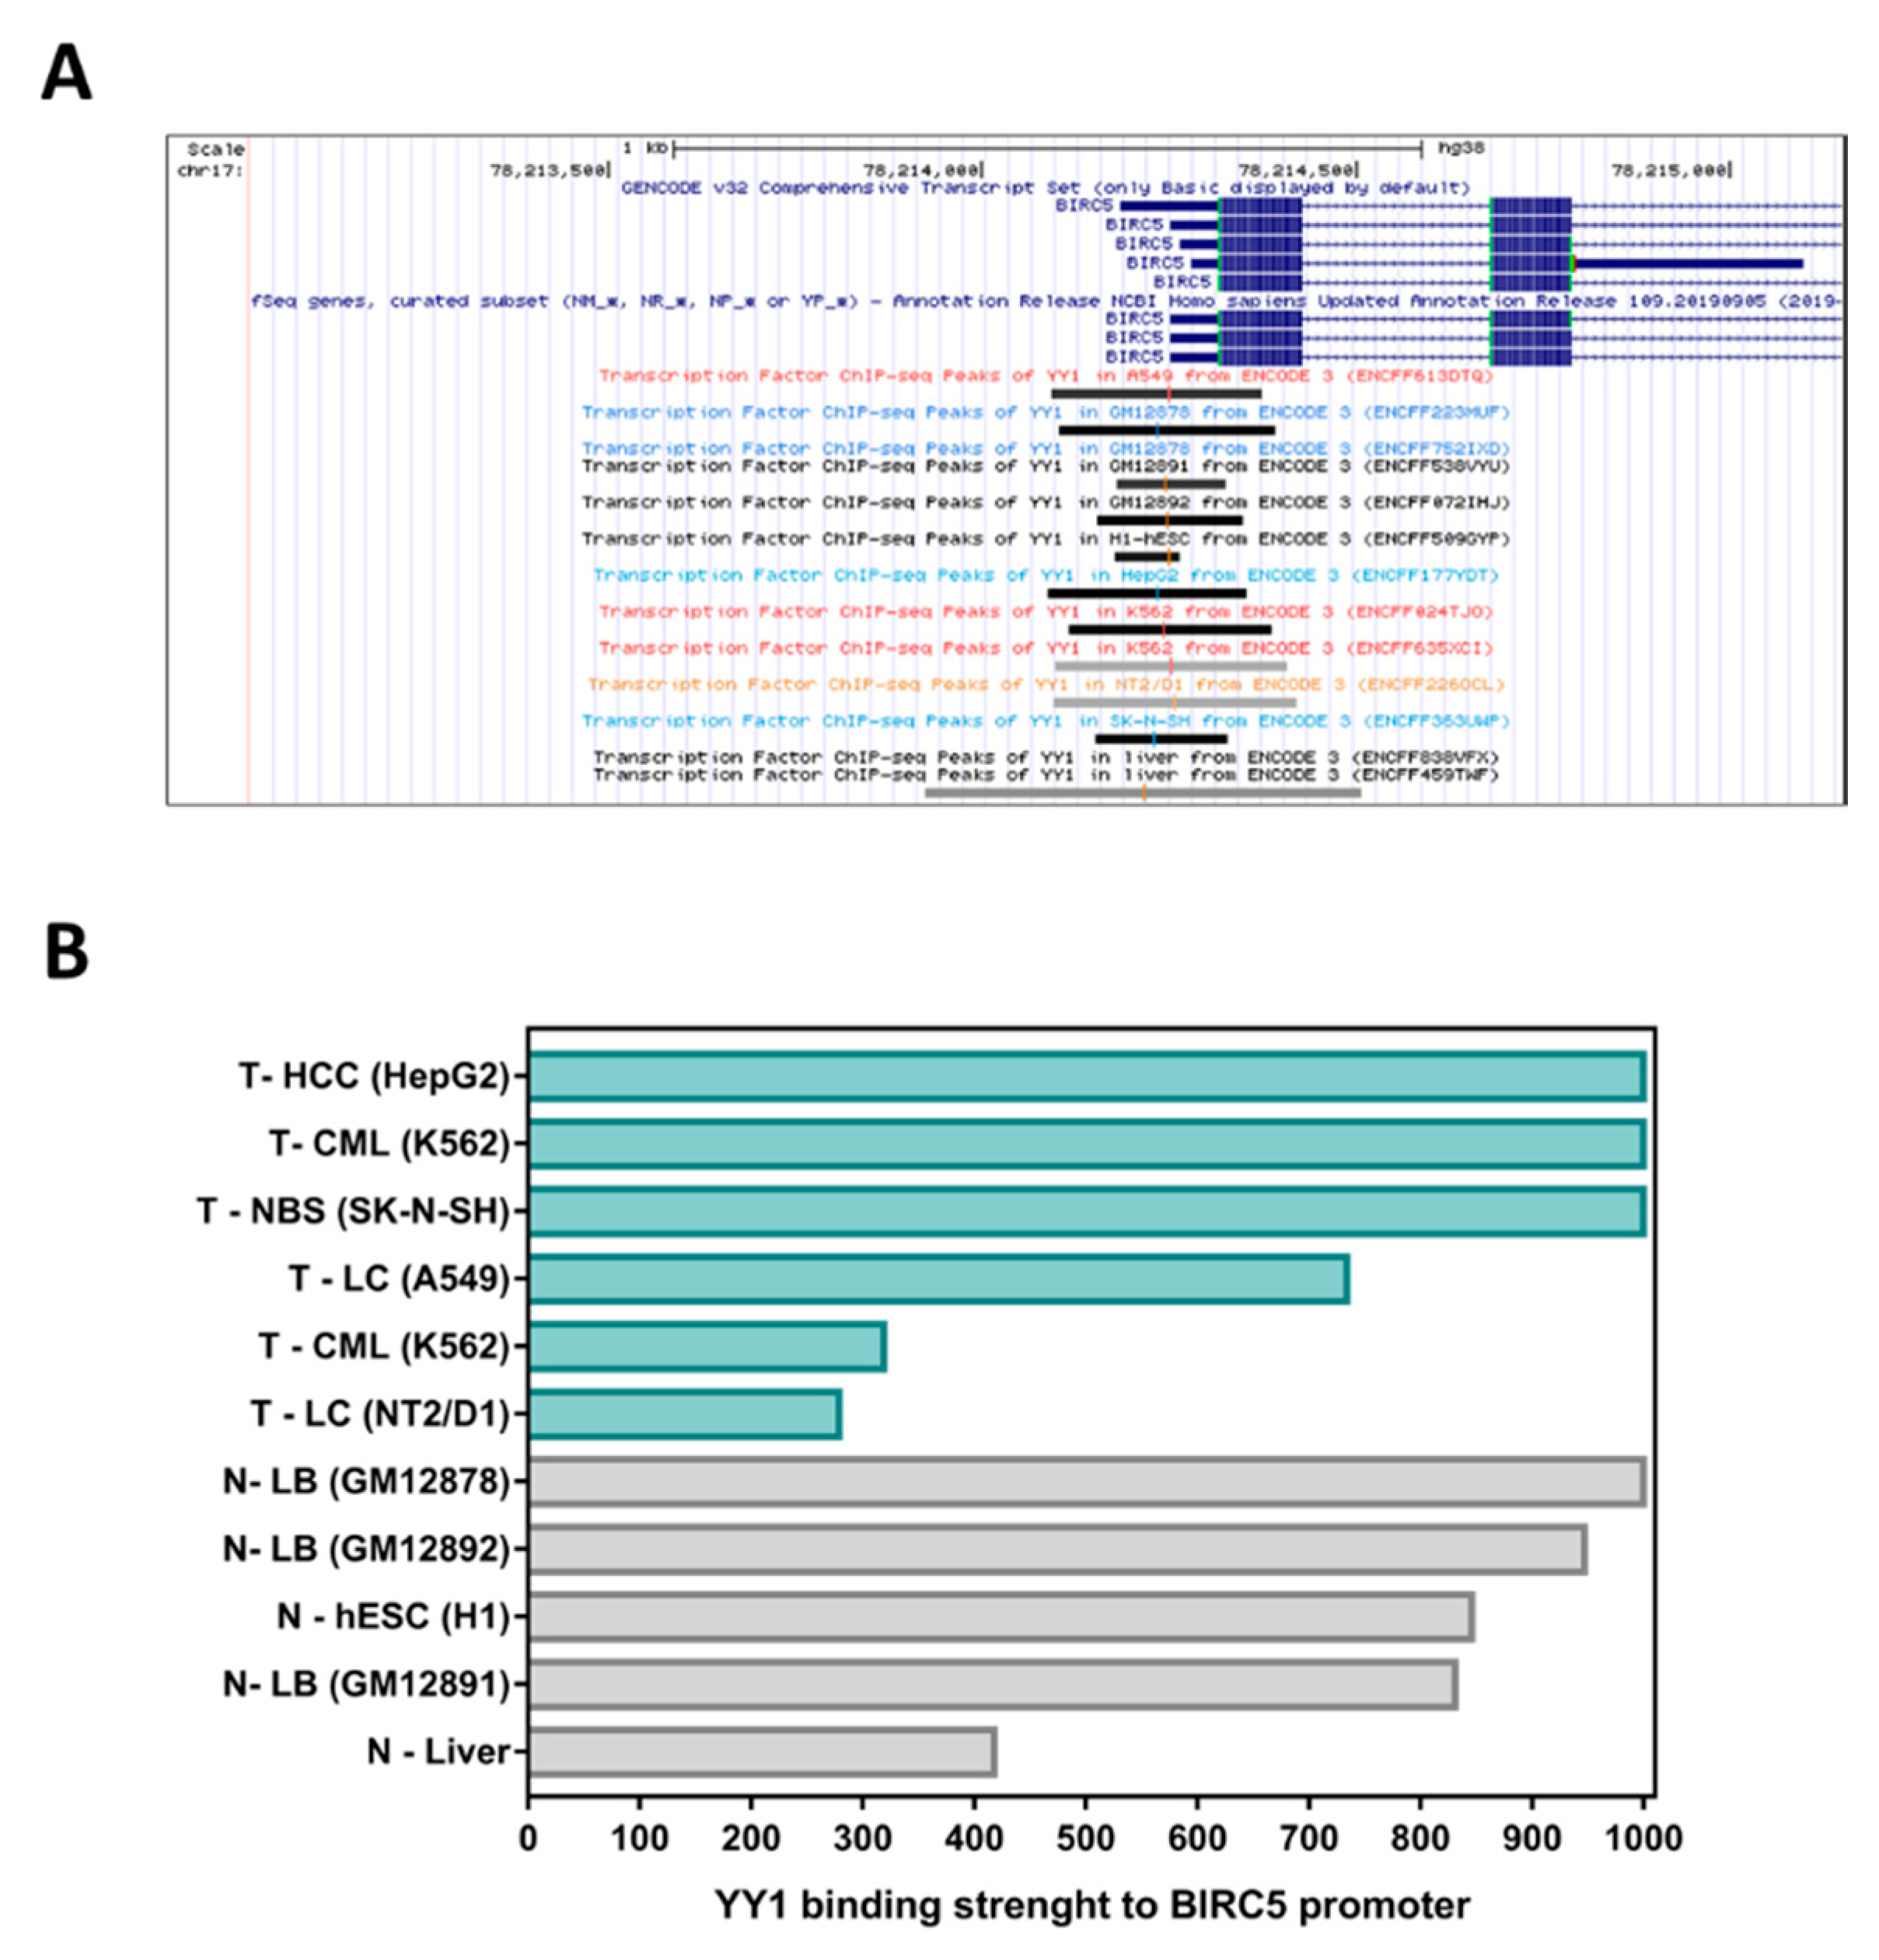
2.2. YY1-ChIP-Sequencing Data Confirm That YY1 Strongly Binds the BIRC5 Promoter

Bioinformatics analysis of “Transcription Factor ChIP-seq” experiments performed through the UCSC Genome Browser (Homo sapiens genome assembly GRCh38), revealed that the promoter region of BIRC5 (from −2000 bp upstream to +1000 downstream the TSS) is selectively bound by 138 different transcription factors, in turn able to modulate, with different strength, BIRC5 expression (Figure S1).
Amongst these transcription factors, YY1 showed moderate to high interaction strength with the BIRC5 promoter within 11 out of 13 YY1-ChIP-Seq experiments performed on different specimens, including three different lymphoid cell lines (respectively: GM12878, GM12891 and GM12892; Figure 1A). It is important to note that YY1 binds the BIRC5 promoter in both cancer and normal cell lines. However, by comparing the binding intensity obtained for YY1 binding to the BIRC5 promoter in normal liver tissues vs. hepatocellular carcinoma, it is possible to observe that YY1 shows a stronger interaction with the BIRC5 promoter in cancer tissues than in normal ones (i.e., strength of 418 in normal cells vs. 1000 in cancer cells; Figure 1B and Table S2).

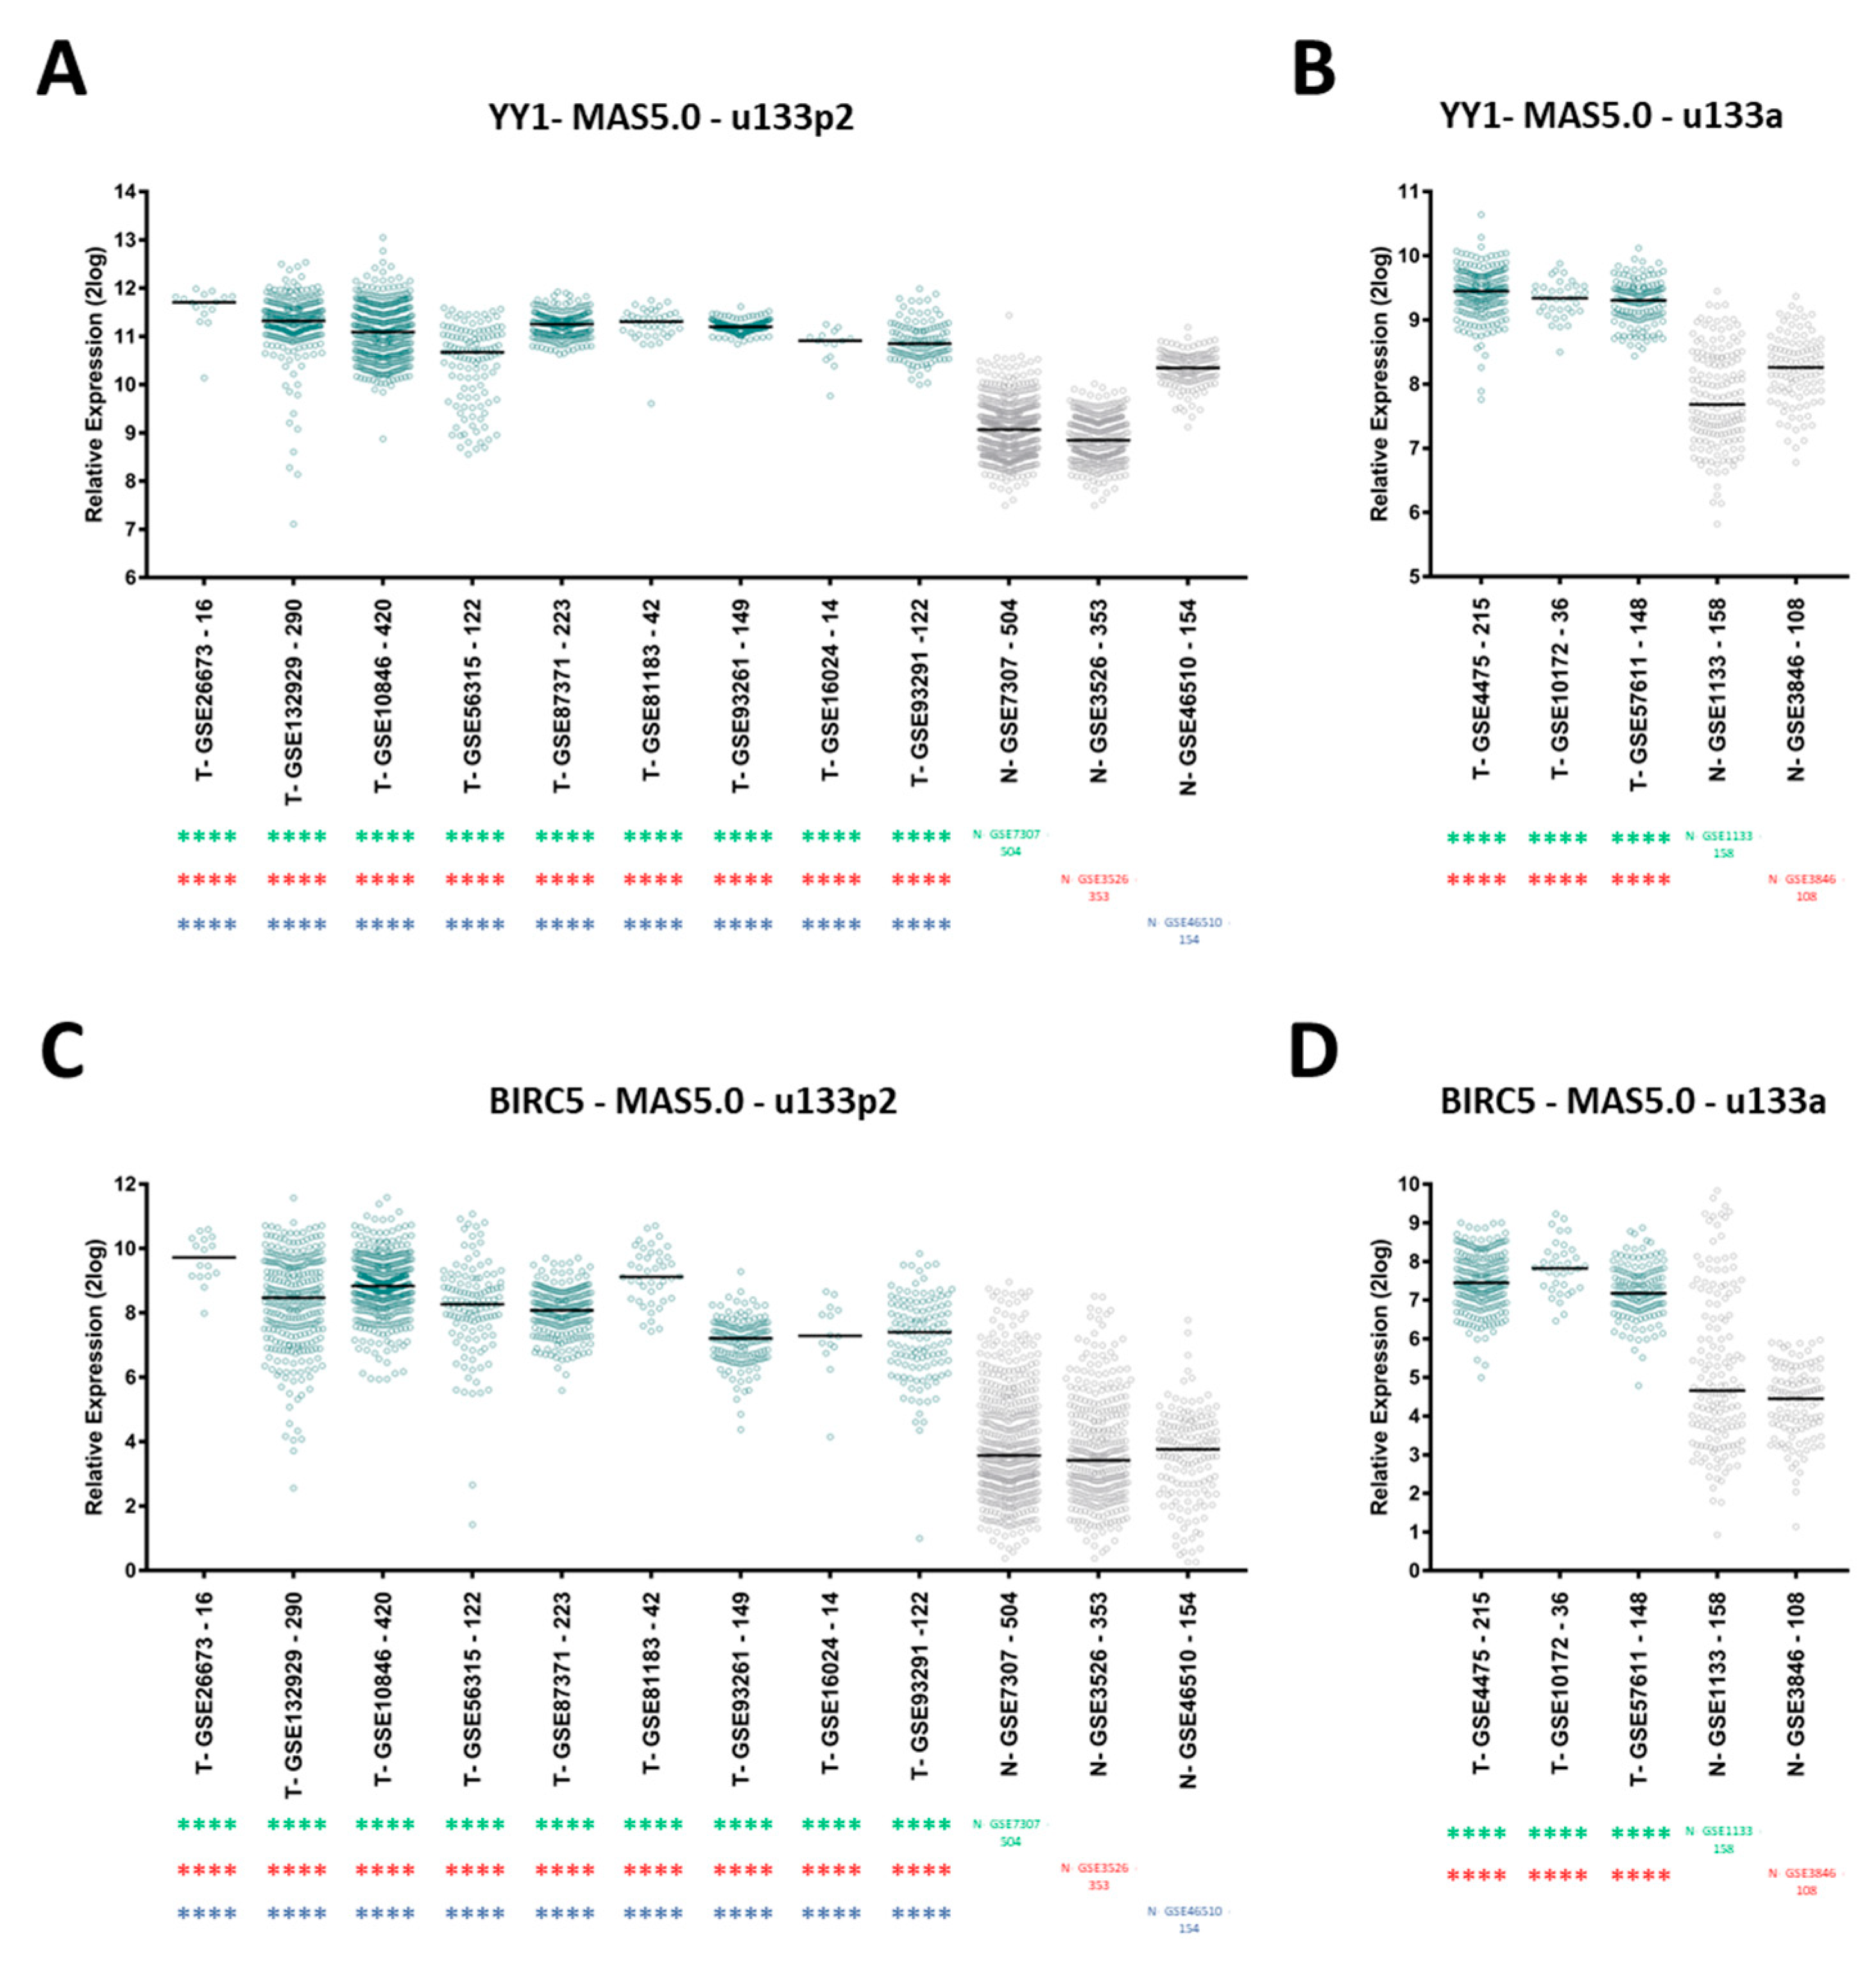
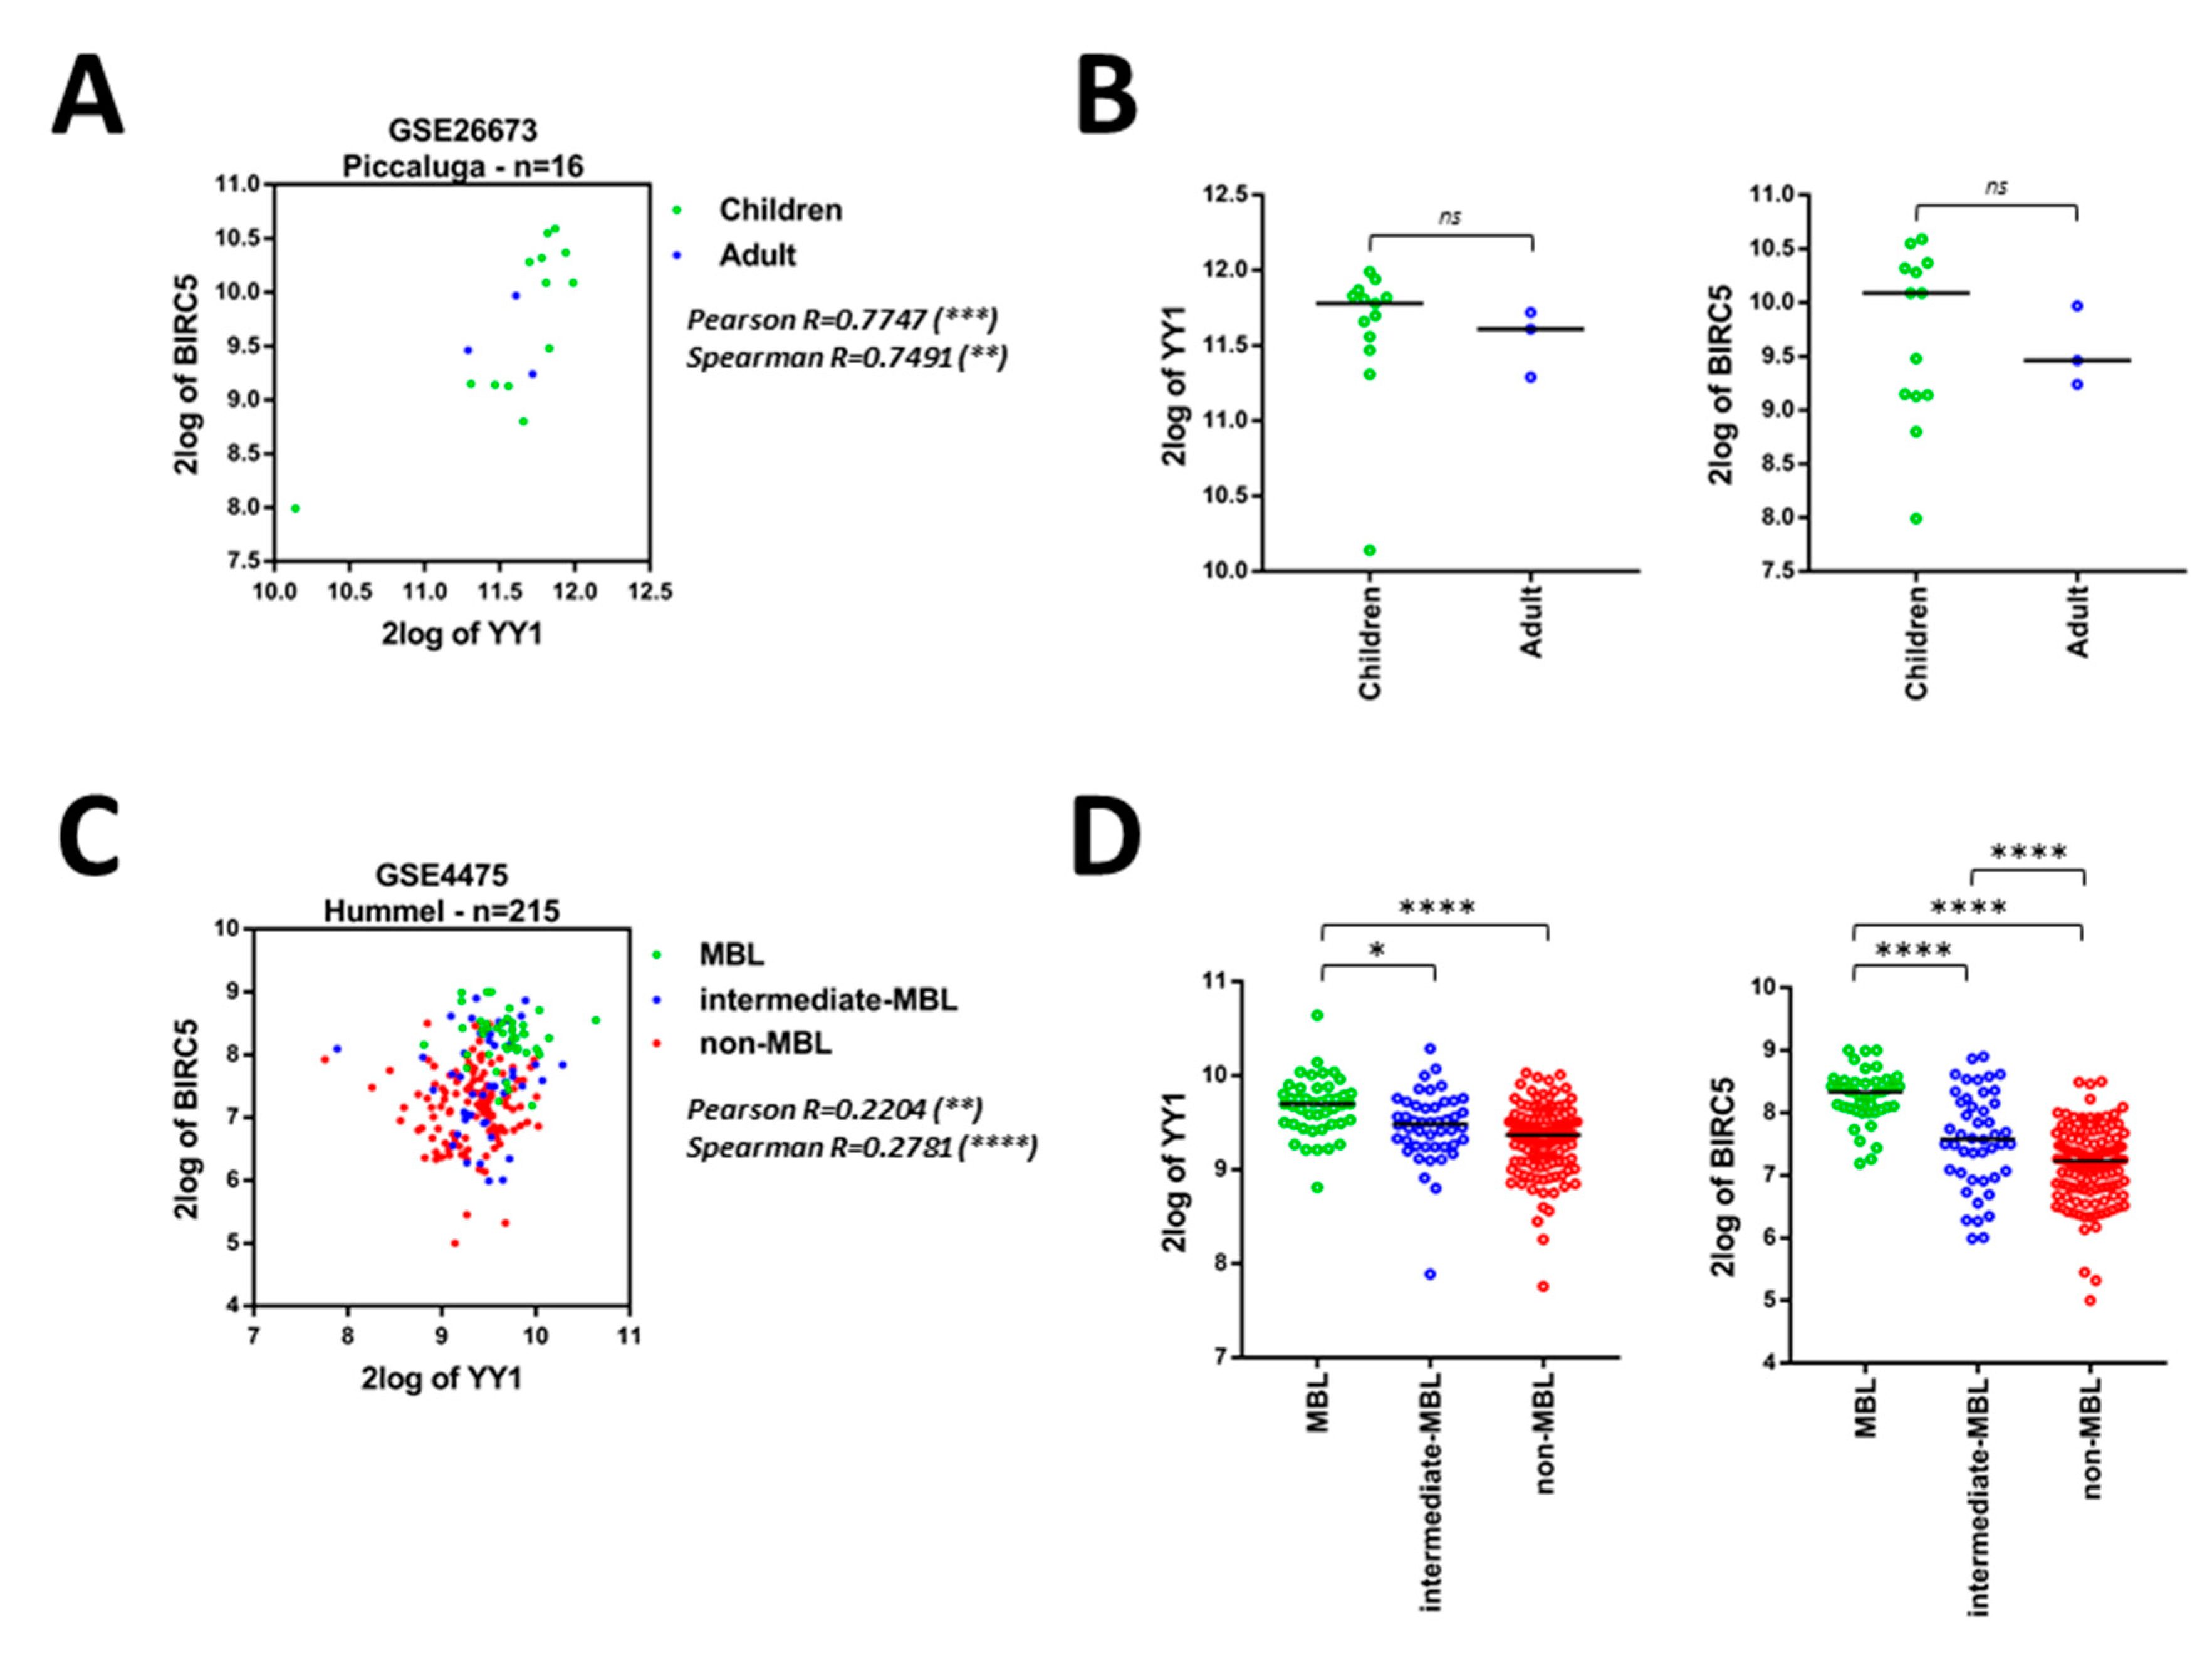
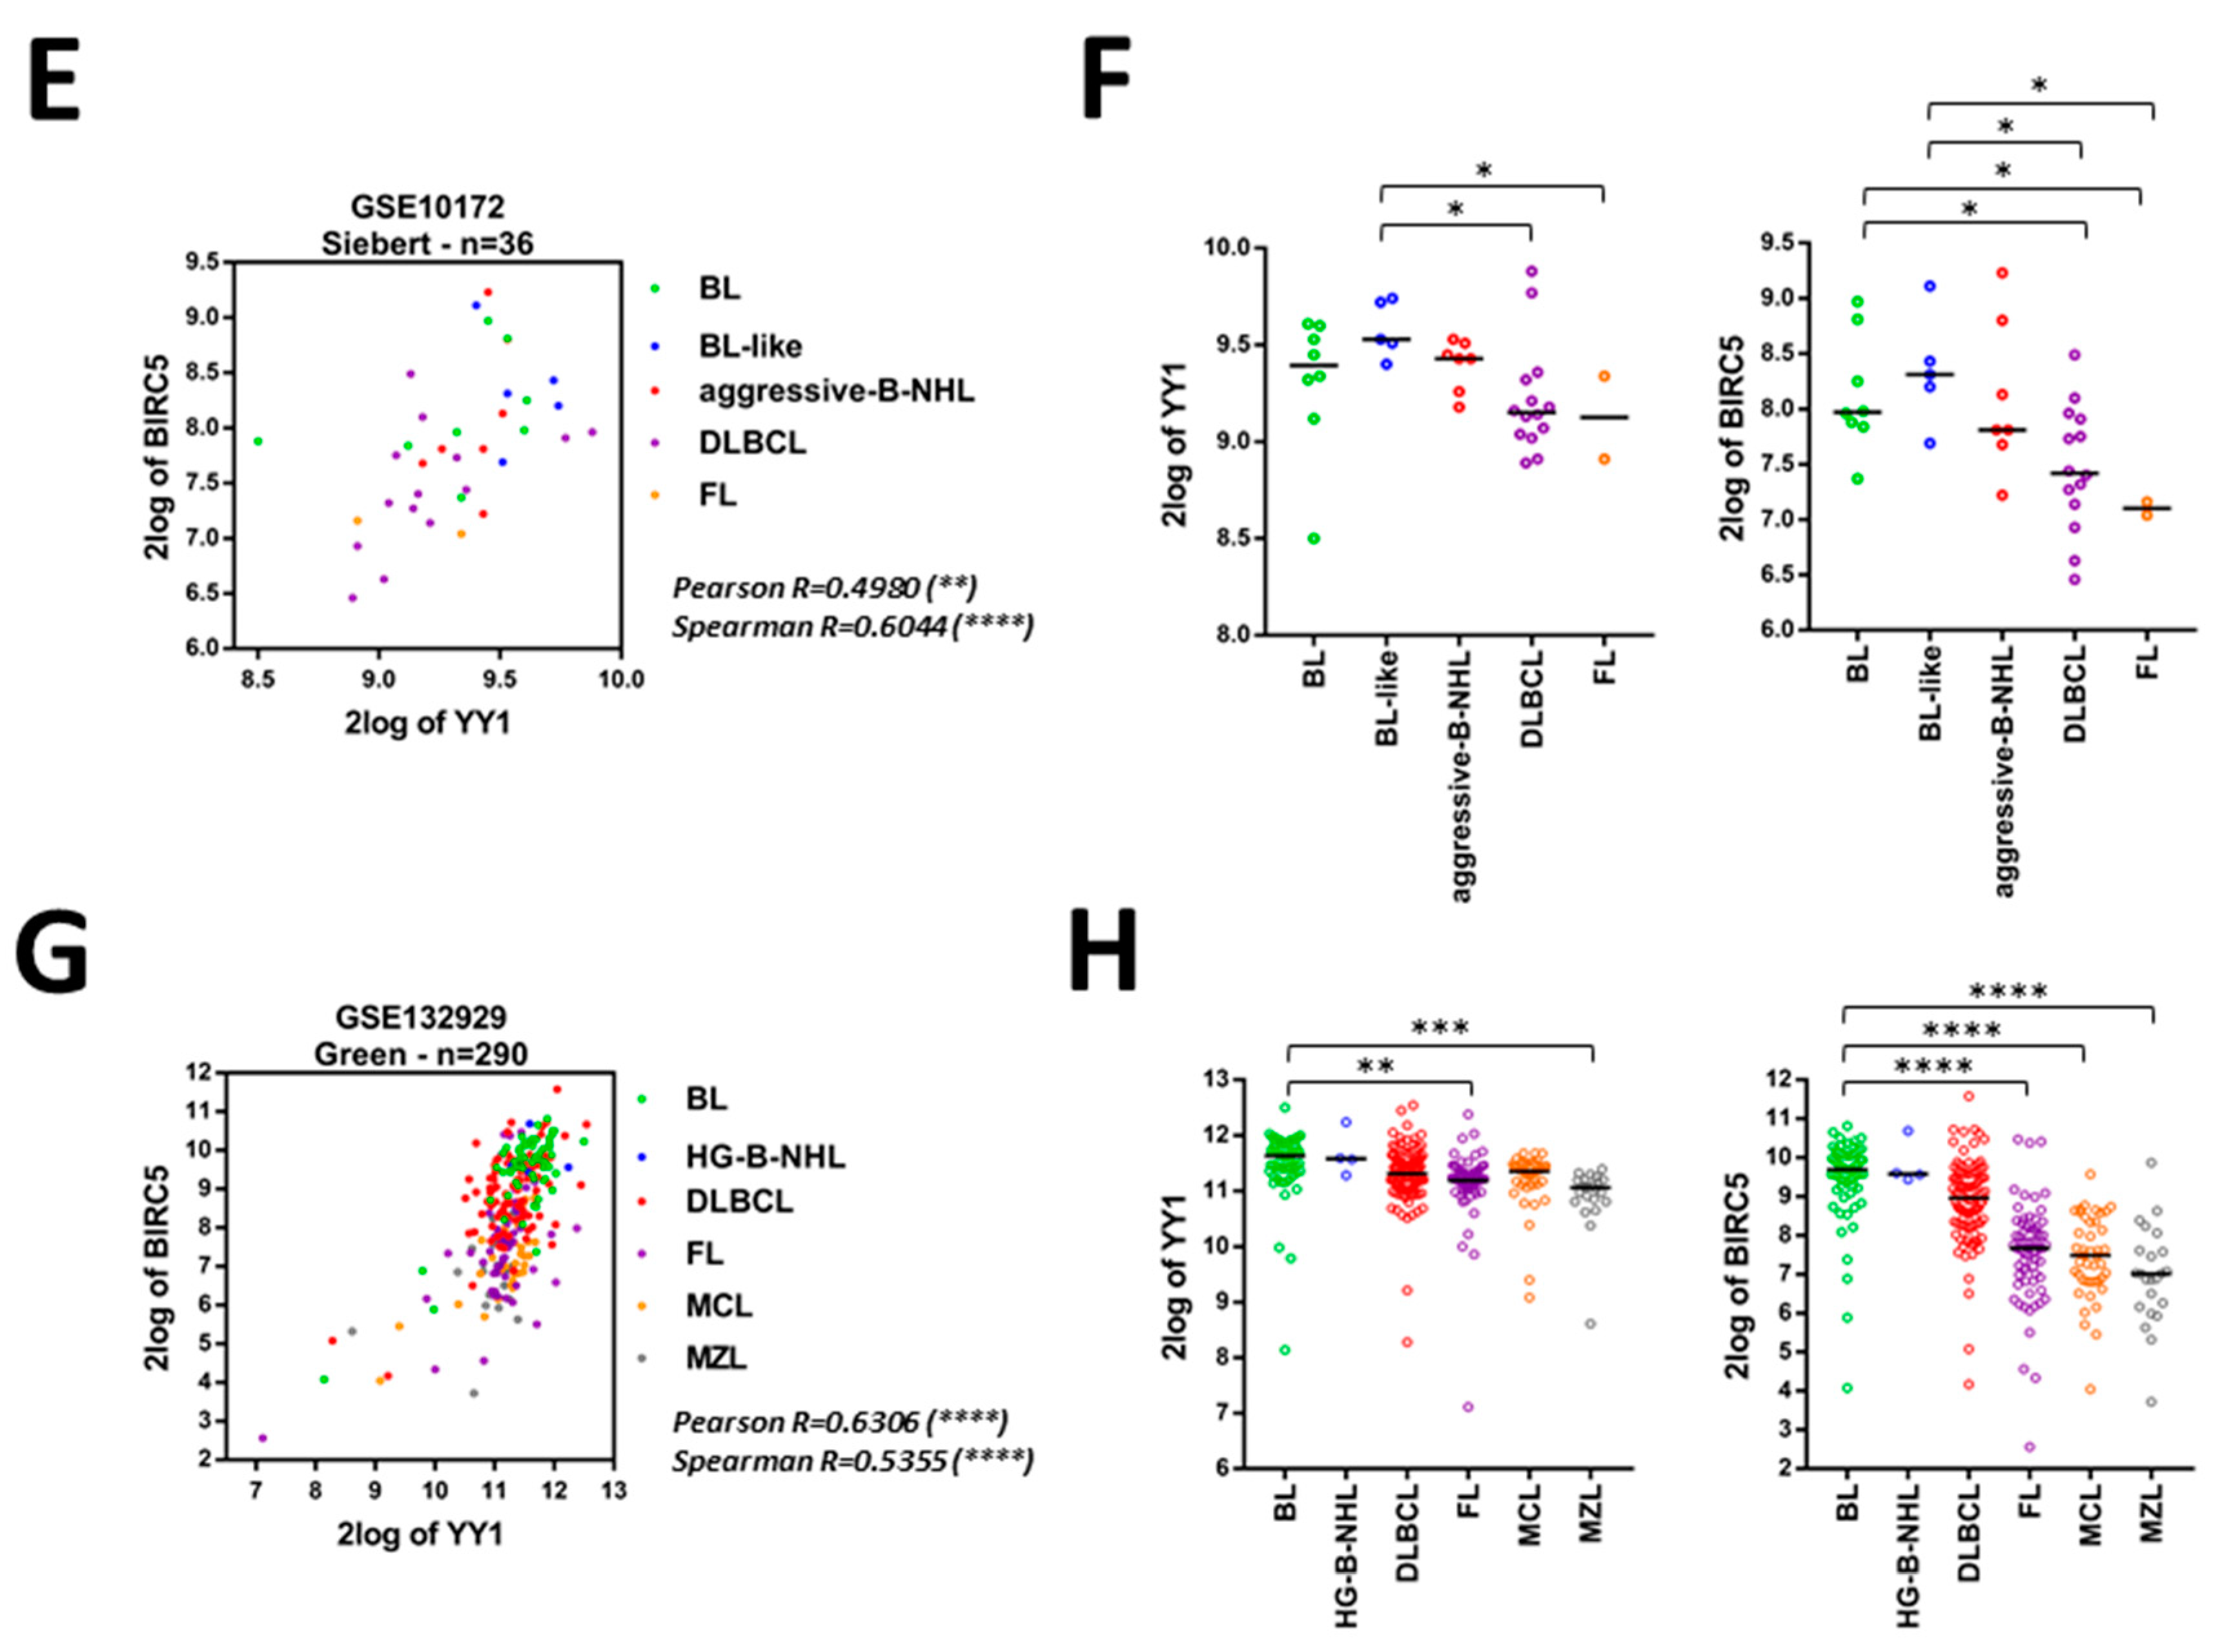
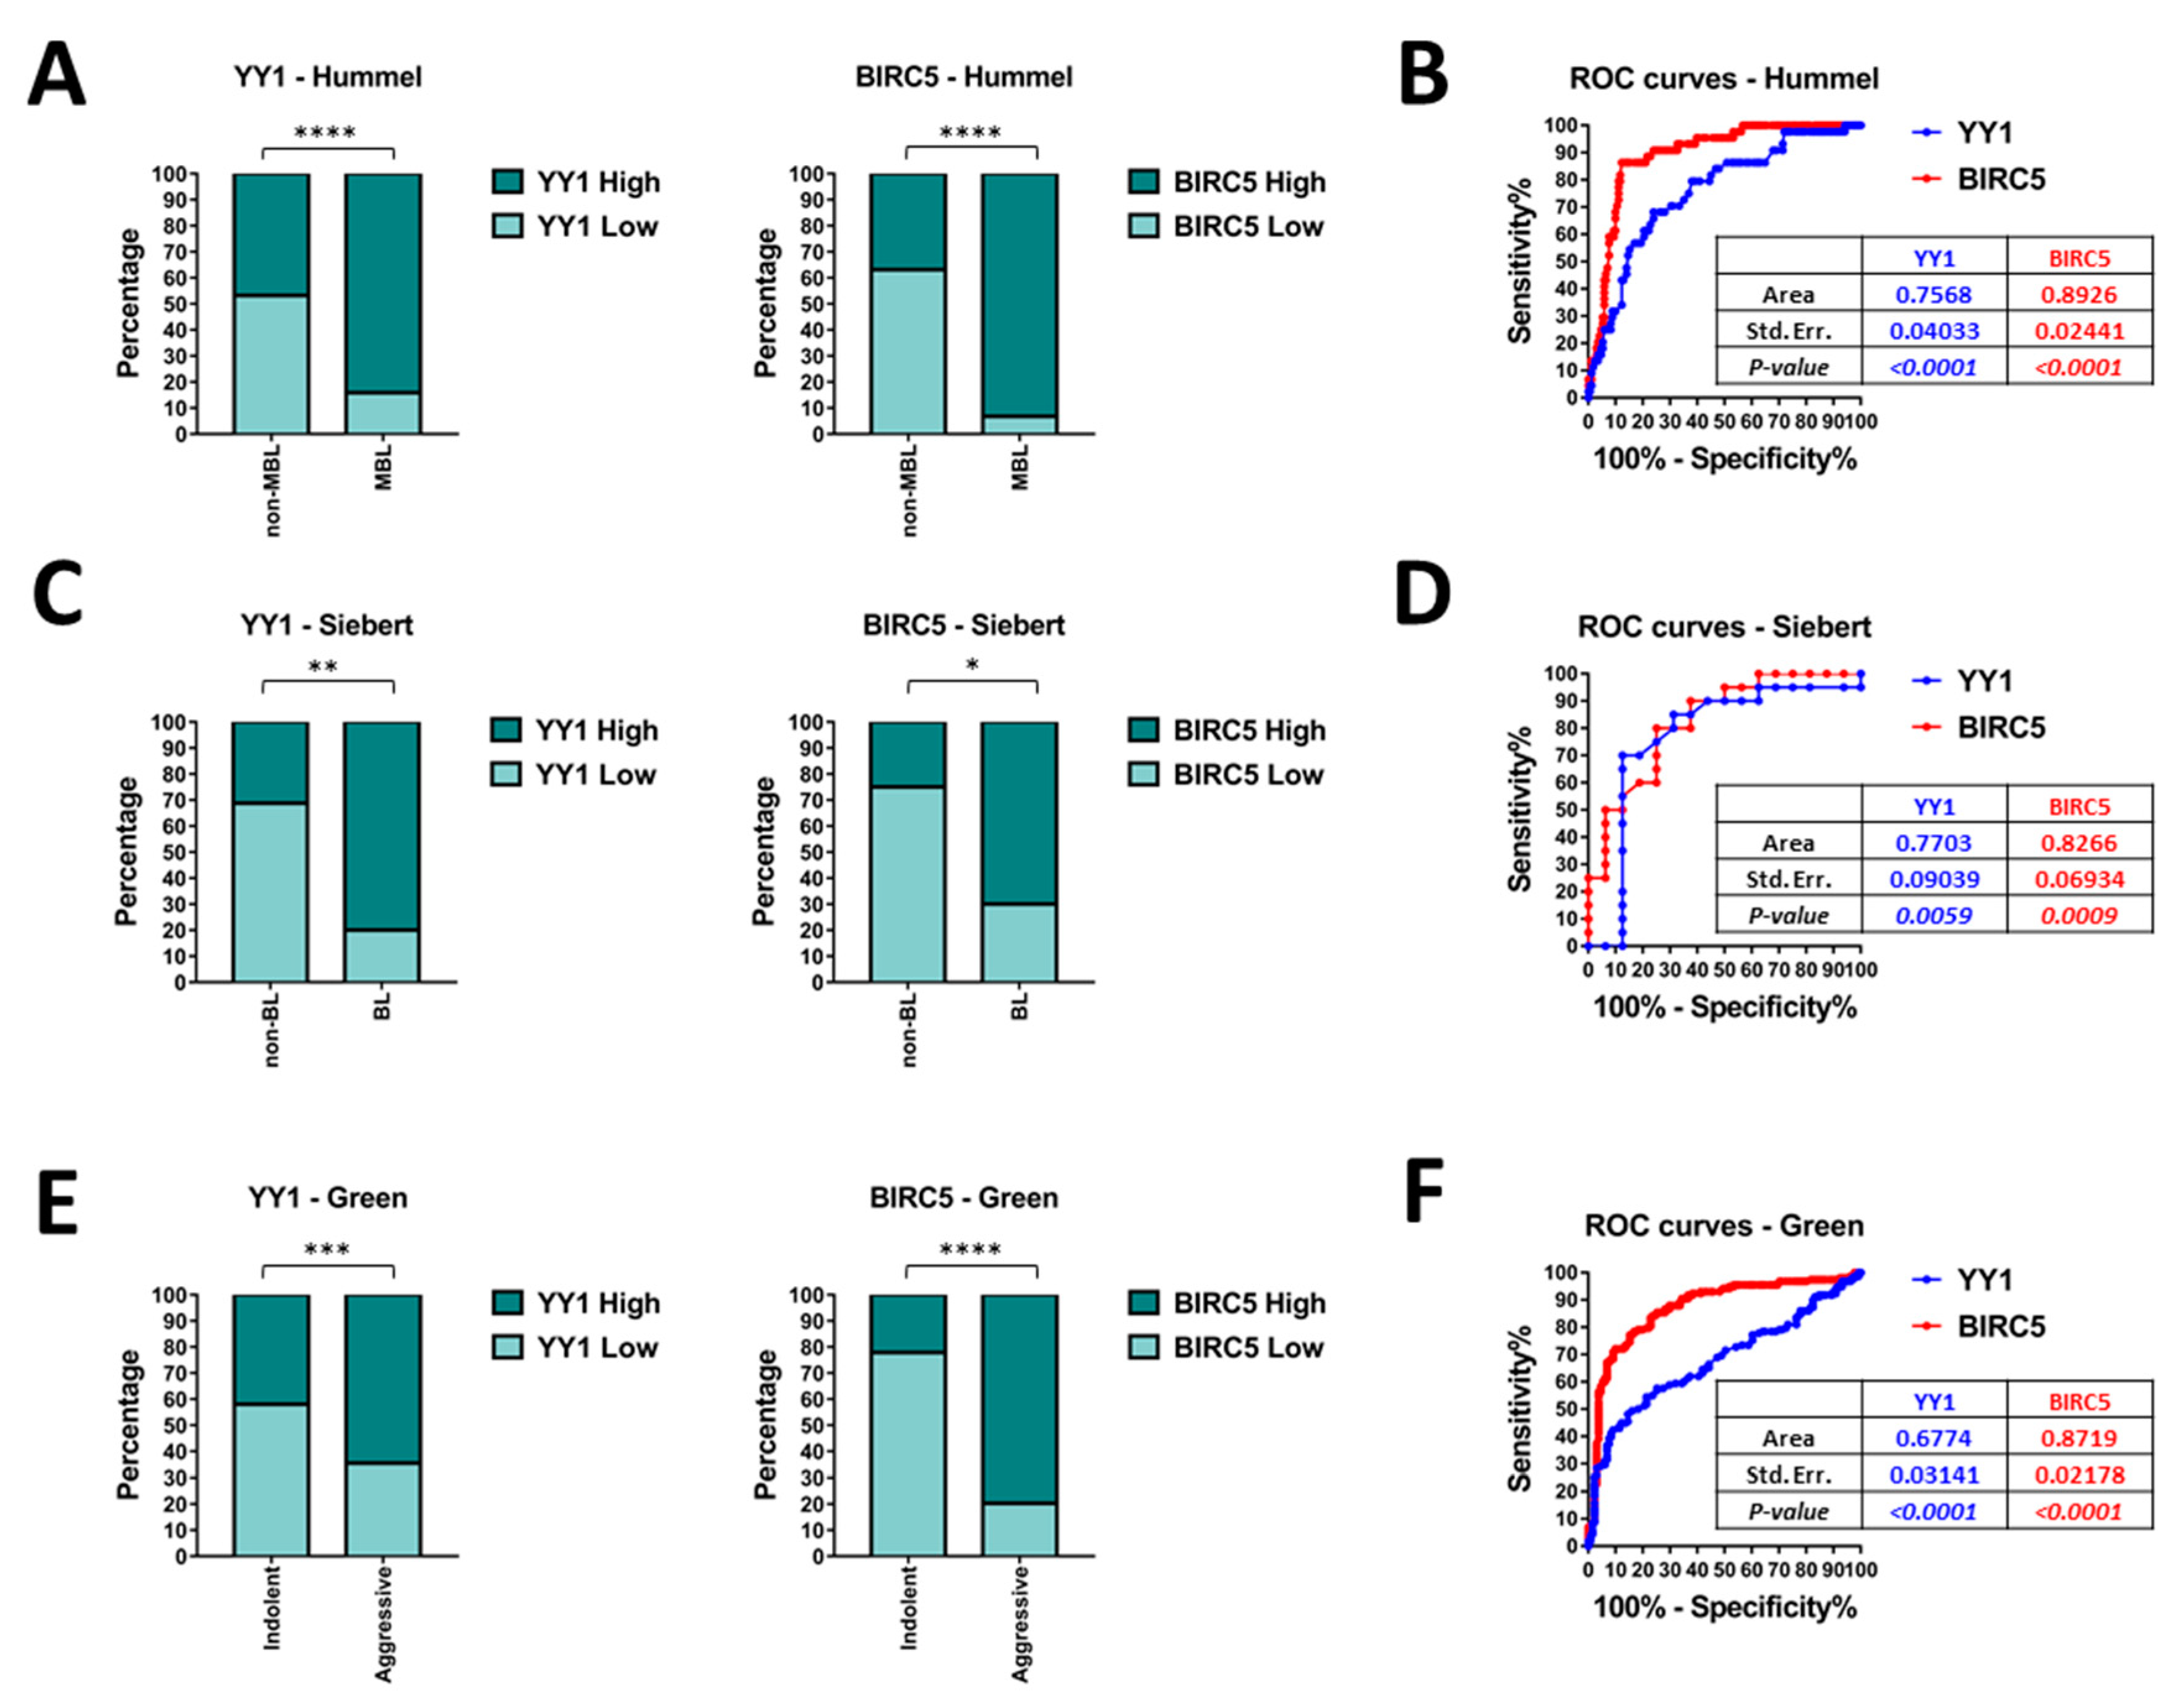
2.3. Bioinformatics Data Confirm That YY1 and BIRC5 Are Positively Correlated within the B-NHL GEO Datasets and They Are Both Associated with B-NHL Clinical-Pathological Features

To validate the association between YY1 and its hereby-identified transcriptional target BIRC5, several independent whole human genome expression array datasets, 12 generated with human B-NHL samples and five with normal healthy human control samples, have been selected from the National Center for Biotechnology Information GEO records (Table 2).
Firstly, to investigate the expression levels of both YY1 and BIRC5 across the selected GEO datasets, the “megasampler module” of the R2 genomics analysis and visualization platform was used. As shown in Figure 2, the results of the R2 megasampler analysis revealed that in all the independent GEO datasets analyzed, both YY1 and BIRC5 are significantly upregulated within the B-NHL patients datasets (T, Tumor) compared to healthy control ones (N, Normal; p < 0.0001; the complete statistics results are included in Table S3), thereby suggesting that the evaluation of the expression of these two genes may have a diagnostic value in suspicious cases or in individuals at risk for this pathology.
Subsequently, both YY1 and BIRC5 normalized expression values distribution in the 12 B-NHLs GEO datasets have been tested for normality (D’Agostino & Pearson normality test). A summary of the normalized expression values distribution and their relative frequency histograms is reported in Figure S2.
Furthermore, the B-NHLs GEO datasets were analyzed by using the functions “correlate two genes” and “view a gene” of the R2 genomics analysis and visualization platform. In Table 3 are summarized the Pearson and Spearman correlation results obtained, expressed as R-values, which all show a positive and highly significant (significance expressed as P-value) correlation between the expression of YY1 and BIRC5. Overall, the results suggest that the positive correlation of YY1 and BIRC5 expression may be a common feature of different classes of B-NHLs (Table 3 and Figure S3).
Importantly, four out of the 12 GEO datasets, containing samples from heterogeneous types of B-NHLs (respectively: GSE26673, GSE4475, GSE10172, GSE132929), including the aggressive BLs, have been analyzed. As reported in Table 3, significant positive Pearson and Spearman correlations between YY1 and BIRC5 expression levels were found in these GEO datasets (Table 3 and Figure 3). In particular, within a dataset of 16 BLs patients (Piccaluga, GSE26673) it was observed a significantly positive correlation between YY1 and BIRC5 expression (Figure 3A). Moreover, a higher, although not significant, YY1 and BIRC5 expression was noticeable in children, if compared with adult patients (Figure 3B).
In an expanded dataset (Hummel, GSE4475), 215 mature aggressive B-cell lymphomas patients were stratified into three categories, based on the presence (or absence) of a clear molecular Burkitt’s lymphoma (MBL) signature. The groups were respectively named: MBL (considered proper BL), intermediate-MBL and non-MBL. Interestingly, both YY1 and BIRC5 were significantly and positively correlated in all patients (Figure 3C). Strikingly, the MBL patients (green dots) showed a significantly higher expression of both YY1 and BIRC5 if compared with the other two groups (intermediate- and negative-MBL, respectively blue and red dots; Figure 3D).
In an additional dataset (Siebert, GSE10172), 36 pediatric mature aggressive B-cell lymphomas patients were divided according to the tumor type into five subgroups. The correlation between YY1 and BIRC5 expression was significantly positive in all the subjects (Figure 3E). Importantly, BL and BL-like patients showed a significantly higher expression of both YY1 and BIRC5, when compared to the other patient groups. Once again, the analysis showed that among the mature aggressive B-cell lymphomas, BLs, BLs-like were the tumor subtypes with a significantly higher expression of both YY1 and BIRC5 (Figure 3F).
Finally, a dataset of 290 patients affected by different subtypes of B-NHLs (Green, GSE132929) was analyzed. Coherently to the other results, also in this dataset the correlation between YY1 and BIRC5 expression was significantly positive when considering all the specimens (Figure 3G). Moreover, when samples were divided into six subgroups according to the tumor type, BL patients showed a significantly higher expression of both YY1 and BIRC5, if compared with less aggressive B-NHLs (including FL, MCL and MZL). Importantly, BIRC5 was found significantly higher not only in BLs, but also in High-Grade B-NHL (HG-B-NHL), when compared with FL, MCL and MZL (Figure 3H).
Overall, the bioinformatics results presented in Figure 3 demonstrate that both YY1 and BIRC5 are positively correlated within all the B-NHL datasets analyzed, but they appear significantly overexpressed in the more aggressive B-NHLs subsets, and, in particular, within the BL subtype (Table 3 and Figure 3). In conclusion, the levels of expression of both YY1 and BIRC5 are relatively higher in BLs subjects, if compared to other B-NHLs which, on the contrary, are considered less aggressive and indolent - including FLs and MCLs.
In order to further assess whether the differences in YY1 and BIRC5 expression levels might be used as significant discriminant factors between diverse B-NHL subgroups, Fisher’s exact test and receiver operating characteristics (ROC) analysis have been performed on relevant B-NHL GEO datasets. To conduct the studies, the expression values of both YY1 and BIRC5, in each GEO dataset, have been divided into High-expressing and Low-expressing groups, respectively including samples whose normalized expression was above or below the specific mean value. The contingency tables generated in the studies are summarized in Table S4.
Firstly, the Hummel (GSE4475) GEO dataset has been analyzed. Based on the significant differences reported in Figure 3D, the B-NHL samples have been further divided into two subgroups: the MBL (44 samples) and the non-MBL (including the intermediate and the non-MBL samples, 171 in total). As reported in Figure 4A, the contingency analysis through Fisher’s exact test evidenced an extremely significant difference in both YY1 and BIRC5 expression, with an 84% of YY1-High expressing samples and a 93% BIRC5-High expressing samples within the MBL subgroup. Coherently, the ROC curve reported in Figure 4B shows an area under the curve (AUC) of 0.76 for YY1 and 0.89 for BIRC5. These high and significant AUC performances suggest that both YY1 and BIRC5 expression levels can be considered as discriminators between MBL and non-MBL diagnostic subgroups.
Moreover, the Siebert (GSE10172) GEO dataset has been analyzed. Based on the results reported in Figure 3D, the samples have been clustered into two main subgroups: the BL subgroup (20 samples, including the BL, BL-like and aggressive-B-NHL) and non-BL subgroup (16 samples, including the DLBCL and FL). As reported in Figure 4C, the contingency analysis through Fisher’s exact test evidenced an extremely significant difference in both YY1 and BIRC5 expression, with an 80% of YY1-High expressing samples and a 70% BIRC5-High expressing samples within the BL subgroup. The ROC curve reported in Figure 4D shows an AUC of 0.77 for YY1 and 0.83 for BIRC5. In agreement with the previous dataset analysis, also in this case, these high and significant AUC performances suggest that both YY1 and BIRC5 can be considered as discriminators between BL and non-BL diagnostic subgroups.
Finally, the Green (GSE132929) GEO dataset has been analyzed. The six B-NHL groups were clustered into two separate subgroups, based on the results reported above in Figure 3H. In particular, the aggressive B-NHL subgroup (composed by BLs, HG-B-NHLs and DLBCLs, for a total of 131 samples) and the indolent B-NHL subgroup (including the FL, MCL and MZL subtypes, for a total of 158 samples) have been further analyzed. As reported in Figure 4E, the contingency analysis through Fisher’s exact test evidenced an extremely significant difference in both YY1 and BIRC5 expression, with an 65% of YY1-High expressing samples and an 80% BIRC5-High expressing samples within the aggressive B-NHL subgroup. The ROC curve reported in Figure 4F shows an AUC of 0.68 for YY1 and 0.87 for BIRC5. Analogously to the previous analyses, these high and significant AUC performances suggest that both YY1 and BIRC5 can be considered as discriminators between aggressive and non-aggressive diagnostic subgroups.
Overall, the results showed in Figure 4, evidenced that YY1 and BIRC5 expression level might be predictive of a specific diagnostic B-NHL subgroup. Notably, YY1 and BIRC5 expression levels are significantly higher in the more aggressive subtypes, and, in particular, in BL and BL-like samples. The ROC results suggest a potential diagnostic role for YY1 and BIRC5, as the AUC values in each dataset analyzed were found highly associated with worse B-NHL subtypes, such as BLs.

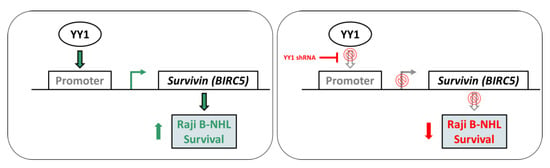
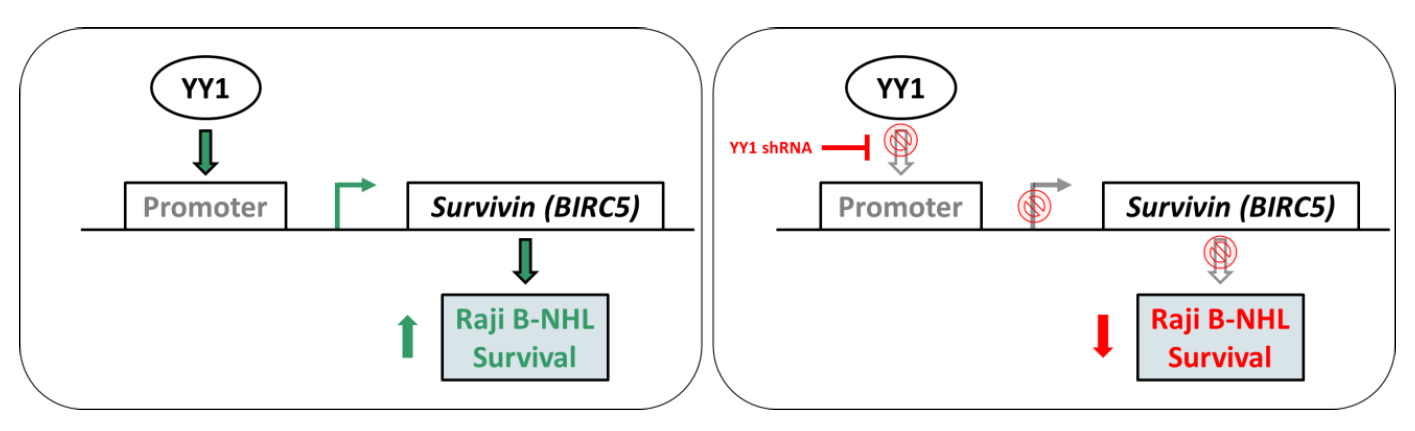
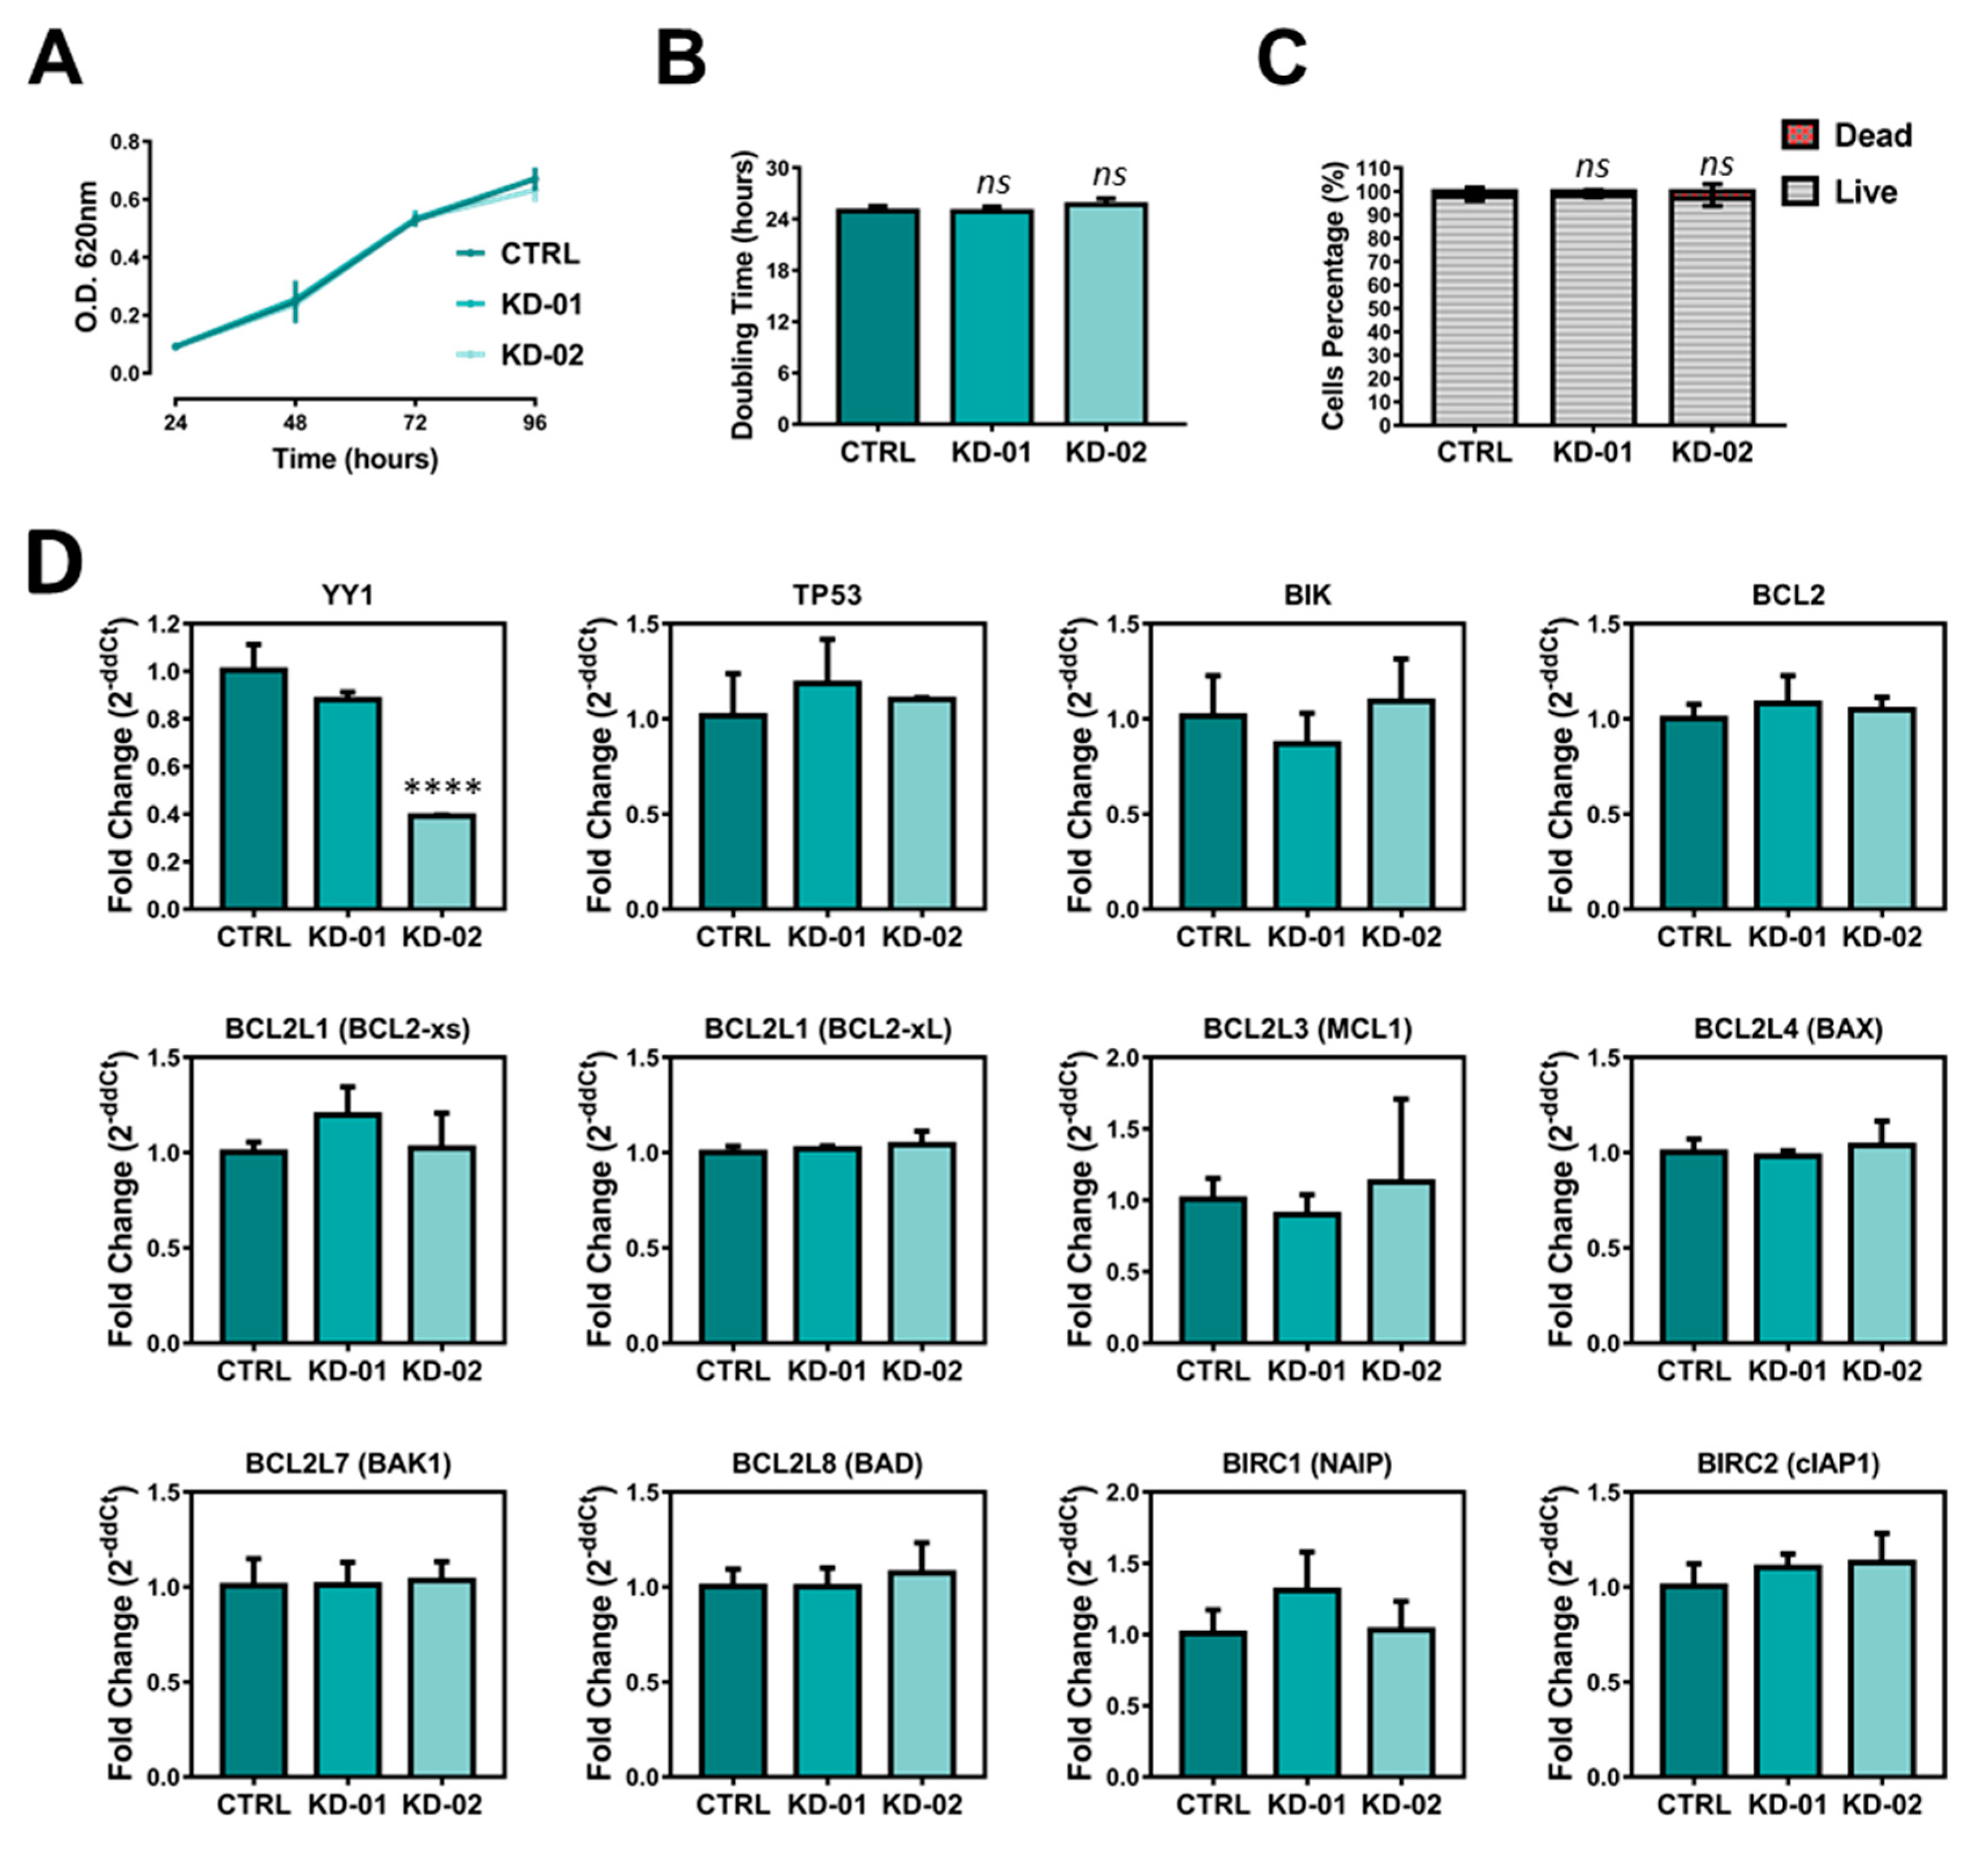
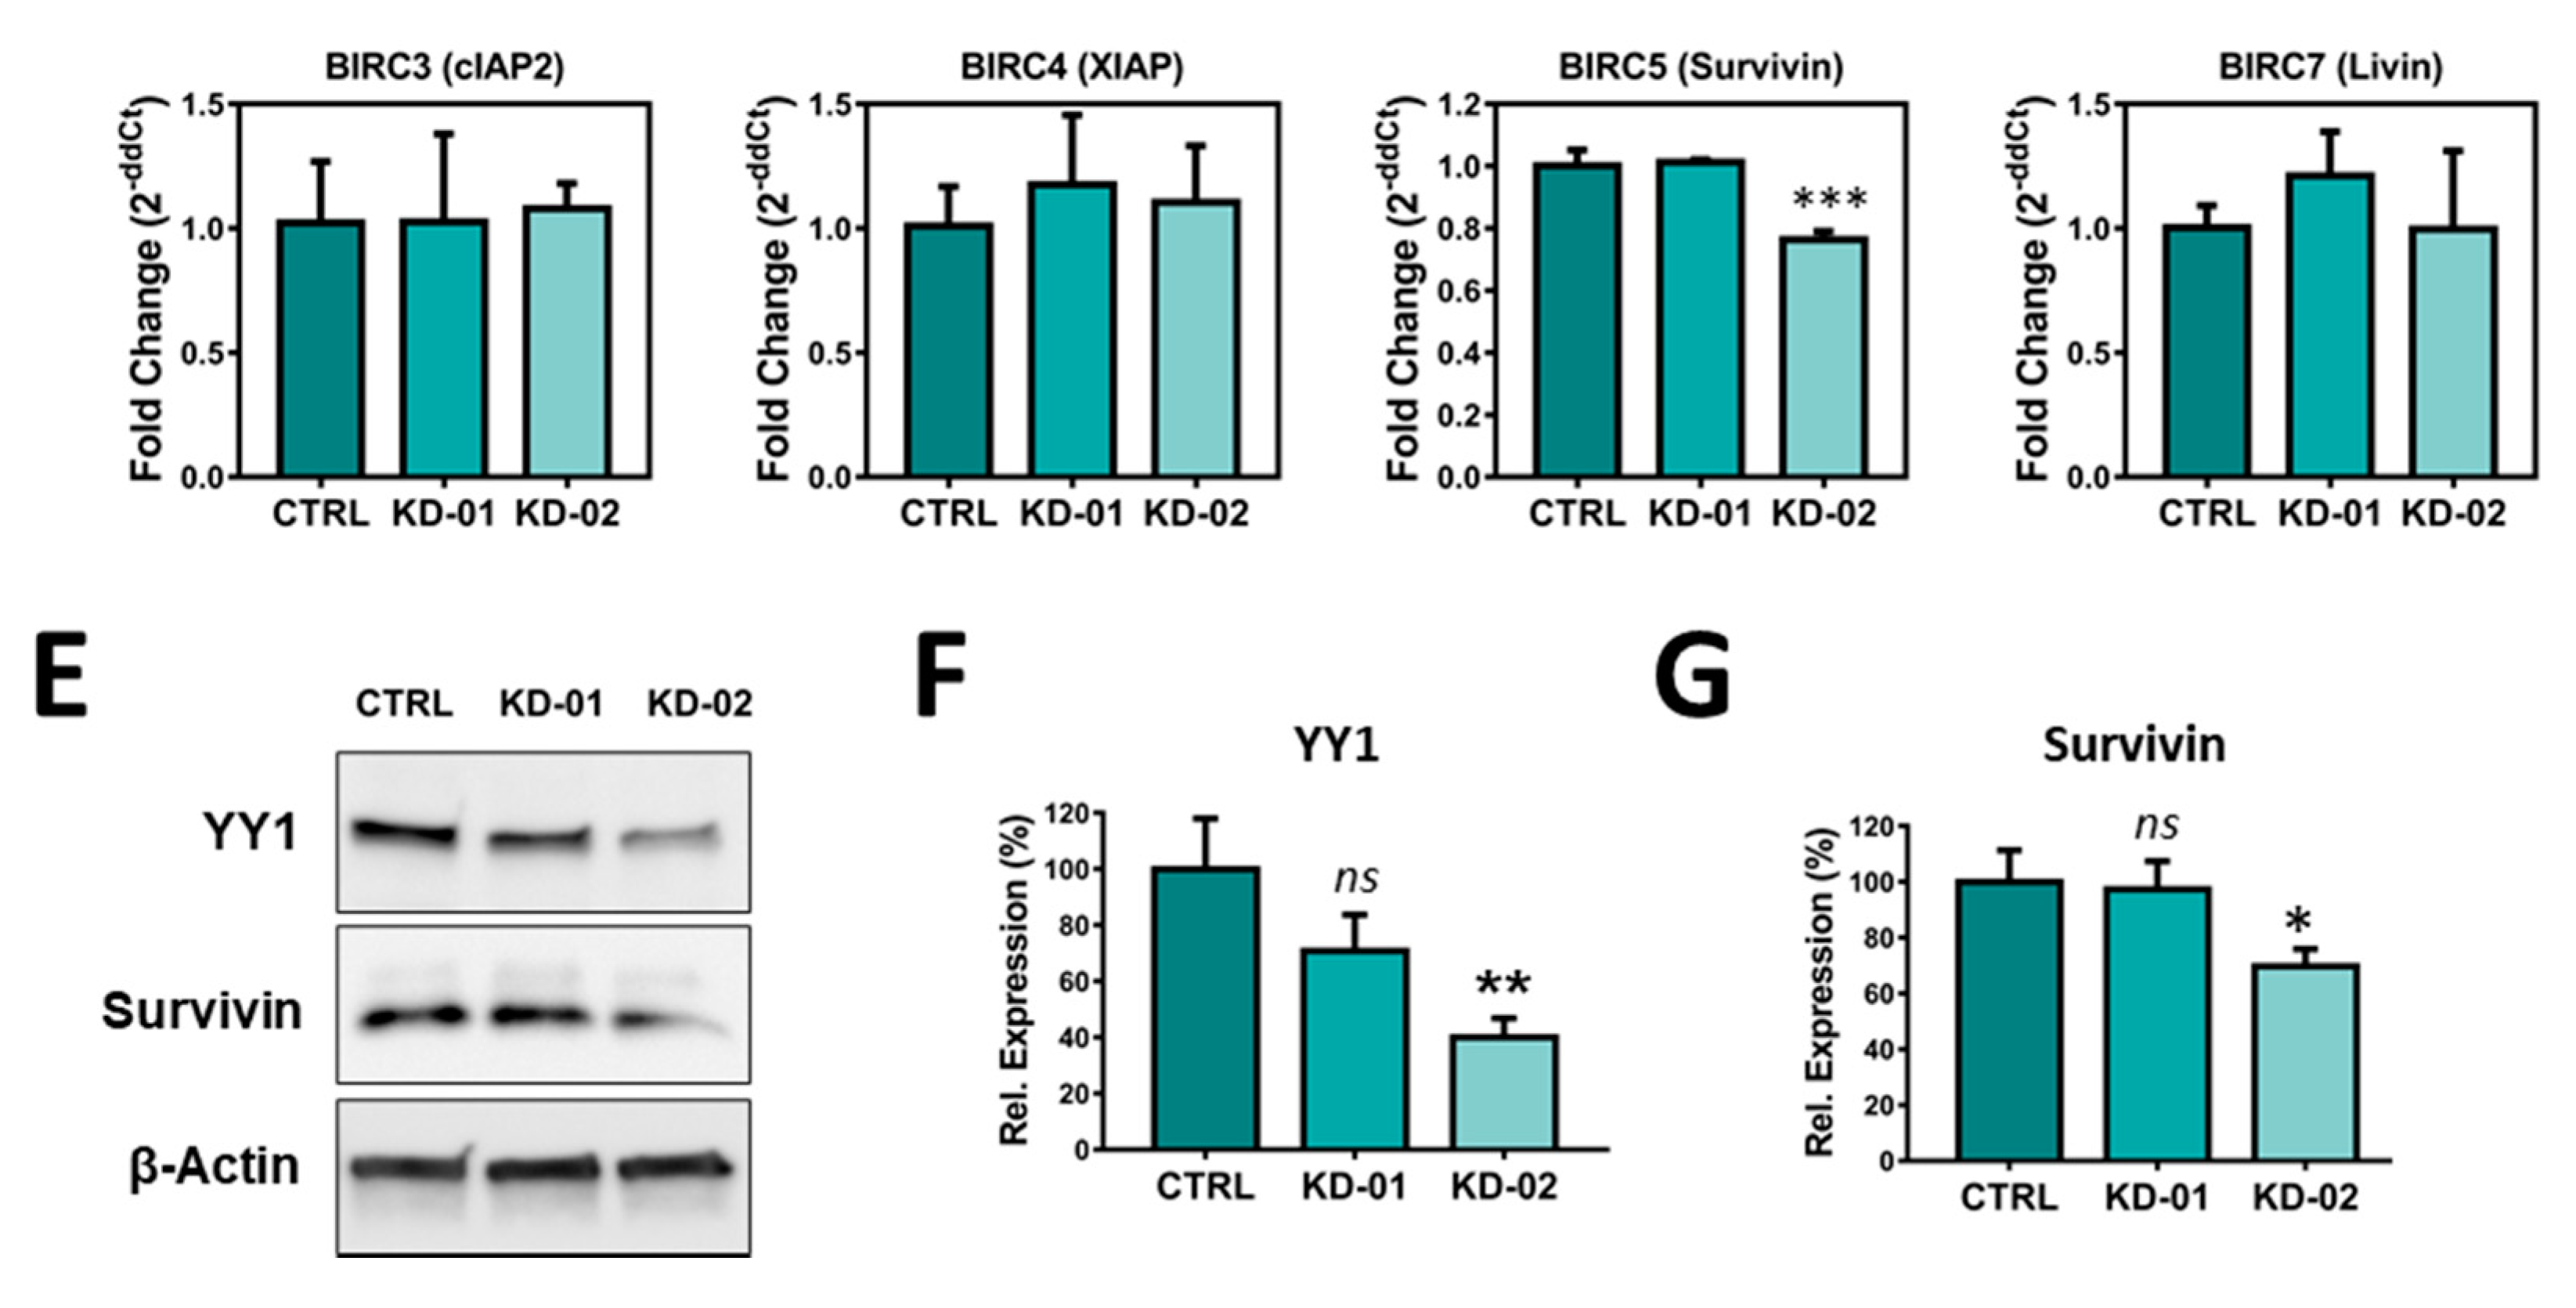
2.4. YY1 Silencing Does Not Affect Raji BL Cellular Growth and It Is Associated with Selective BIRC5 (Survivin) Downregulation

Given the significantly higher expression and positive correlation between YY1 and BIRC5/survivin observed in BLs, a model of aggressive B-NHL, the Raji BL cells have been selected for further validation at cellular and molecular levels. In particular, a shRNA mediated approach has been used to generate three stably transduced Raji-derived cell lines, named respectively KD-01 and KD-02 the two carrying the integrated shRNA against YY1 transcript, and CTRL the one carrying the shRNA targeting the exogenous luciferase gene, used as mock-non-silencing control.
To measure the efficiency of silencing, both the YY1 transcript and protein expression levels were analyzed in Raji cellular samples. Figure 5D (first upper left plot) shows q-RT-PCR results relative to YY1 transcript expression, demonstrating that in Raji KD-01 the silencing efficiency was about 12%, with an averaged residual YY1 mRNA expression of 88% (not significant, p = 0.1292), while in Raji KD-02 YY1 silencing efficiency was about 61%, with an averaged residual YY1 mRNA expression of 39% (extremely significant, p < 0.0001). Furthermore, YY1 protein levels have been analyzed through immunoblotting. β-Actin was used as normalization control. The immunoblotting images and their densitometric analyses showed a reduction of YY1 protein expression in both the knocked-down Raji cell lines, when compared with the CTRL, although significant only in the Raji KD-02 (Figure 5E,F).
In order to evaluate whether YY1 silencing affects Raji cellular growth, MTT and Trypan-Blue growth experiments were performed. The MTT-assay plotted results (the OD was plotted as function of the time in culture) highlighted that the three Raji cell lines showed perfectly overlapping growth curves, without any significant difference (Figure 5A). As shown in Figure 5B, the doubling time for the three cell lines was further calculated, and, accordingly, no significant difference was observed between the KD cells and the CTRL ones. Additionally, a Trypan Blue analysis was performed on the three Raji cell lines. Figure 5C illustrates the live vs. dead percentage analyses, following 96 h in culture. Noticeably, the time in culture did not significantly affect the cellular viability in none of the cell lines tested, with an average of 98% of the population alive vs. a 2% death. Altogether, the observations demonstrate the effectiveness of YY1 silencing in KD-02 Raji cells, and that YY1 knock-down does not affect their cellular growth, nor the basal viability.
To validate the positive correlation observed between YY1 and BIRC5 in B-NHL patients and, strongly, in BL patients, a RT-PCR-based screening was performed in Raji BL cells. In line with the oncogenic role played by YY1 in B-NHLs, the downregulation of one (or more) anti-apoptotic factor(s) or the upregulation of one (or more) pro-apoptotic factor(s) is expected in Raji BL cells which are significantly silenced for YY1 (KD-02). In particular, regarding BIRC5, to confirm its positive correlation with YY1, a downregulation in Raji BL YY1-KD-02 is expected.
In the sq-RT-PCR results reported in Figure S4A, the electrophoretic bands corresponding to the expression, for all the genes selected, in Raji CTRL, KD-01 and KD-02 cells are shown. Among the analyzed genes, both BCL2L2 and BCL2L15 were not expressed in Raji cell lines (the genes are expressed in other cell lines, used as positive controls; data not shown). Strikingly, from the sq-RT-PCR densitometry analysis reported in Figure S4B, it appears that only one gene, BIRC5, was selectively downregulated in Raji KD-02 cells compared with Raji CTRL.
Figure 5D illustrates the q-RT-PCR results for the genes which were found to be positively expressed in Raji cells and, for each gene, the relative expression of Raji KD-01 and KD-02 cells was compared with the Raji CTRL expression, considered as unitary (expression of the data are presented as 2−ddCt). In agreement with the sq-RT-PCR, from the q-RT-PCR study it emerges that only BIRC5/survivin is selectively modulated upon YY1 silencing. In particular, in Raji KD-02 cells, which are significantly silenced for YY1, the expression of BIRC5 transcript was significantly downregulated of about 24% (residual expression of 76%) compared to CTRL (p = 0.0003), whereas in Raji KD-01 cells (which are not significantly silenced for YY1) BIRC5 expression is comparable to CTRL cells.
In order to assess whether the association between YY1 silencing and BIRC5 downregulation is conserved at protein level, an immunoblot analysis has been performed. As shown in Figure 5E,G, in Raji KD-02 cells, survivin protein expression is significantly reduced to 70% compared with the CTRL expression (p = 0.0185), while in KD-01 its expression is comparable with the CTRL. In conclusion, as shown in Figure 5, YY1 silencing in Raji BL cells is associated with survivin downregulation, both at transcriptional and protein levels, therefore suggesting YY1 as a potential transcriptional regulator of the BIRC5 gene in BL Raji cells. In turn, such cells recapitulate the positive correlation, as well as the predictive diagnostic value observed for both YY1 and BIRC5 in B-NHL patients, and strongly in BLs (Table 3, Figure 3, Figure 4 and Figure S3).

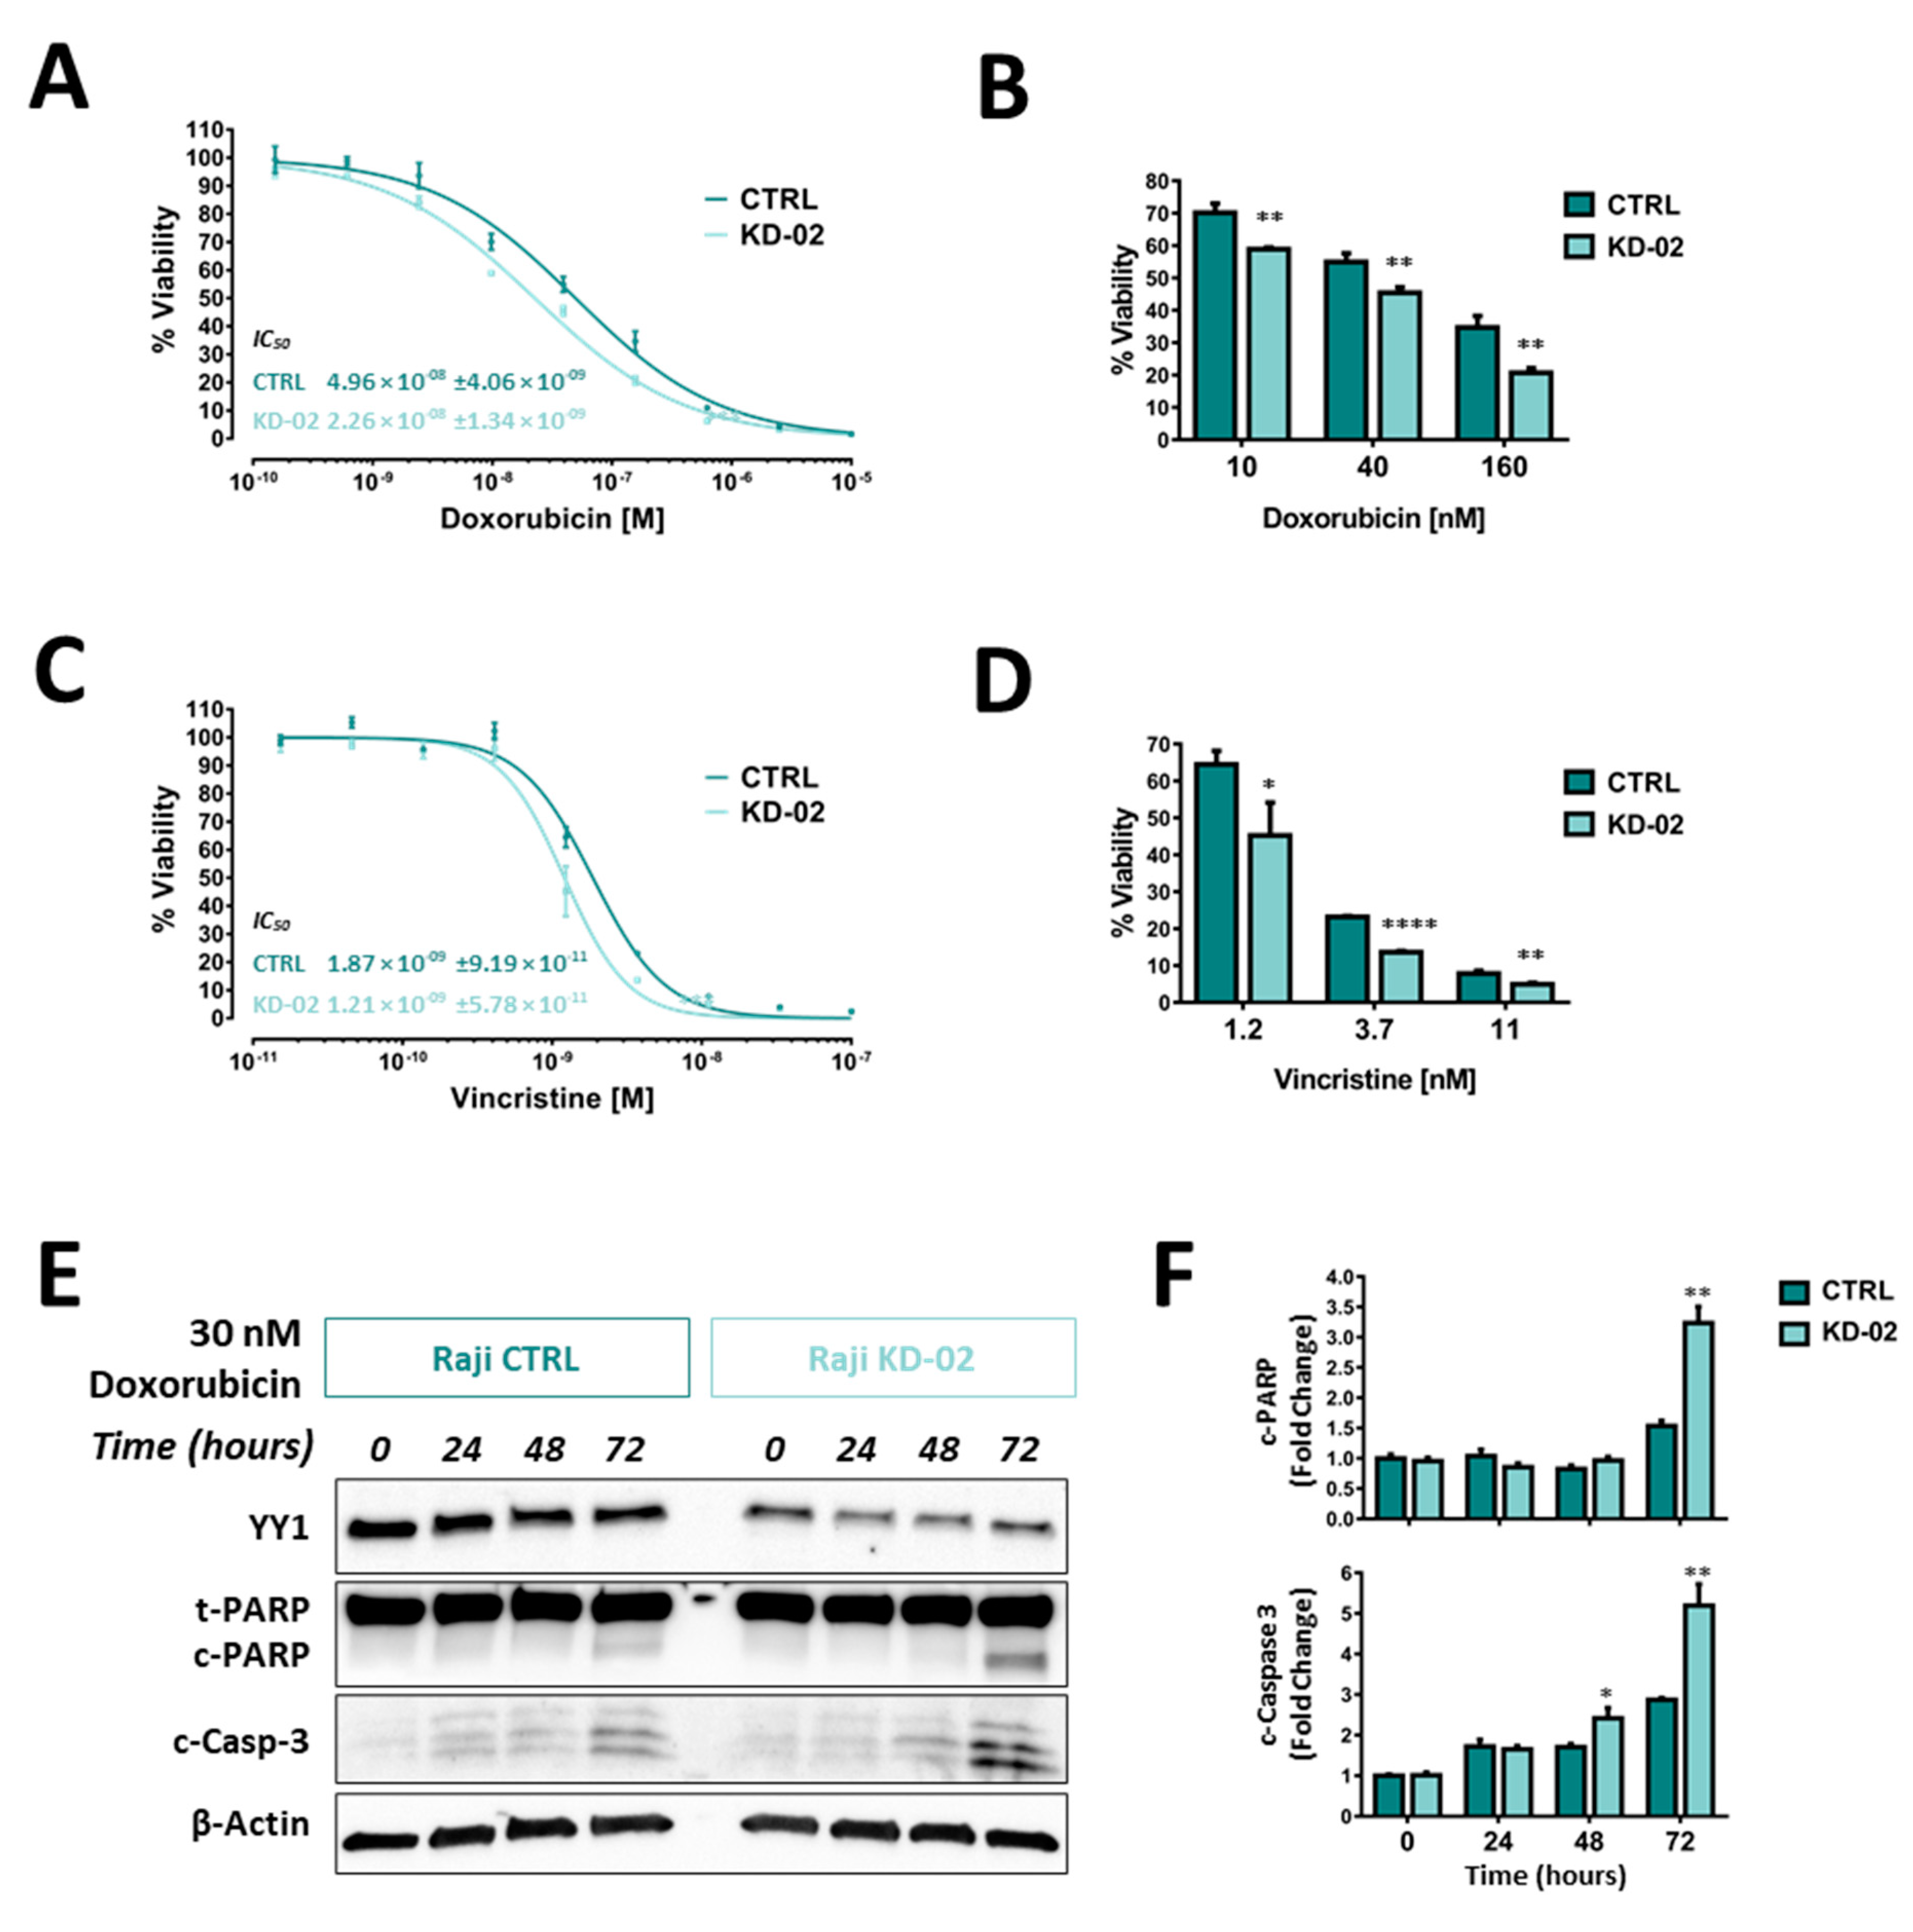
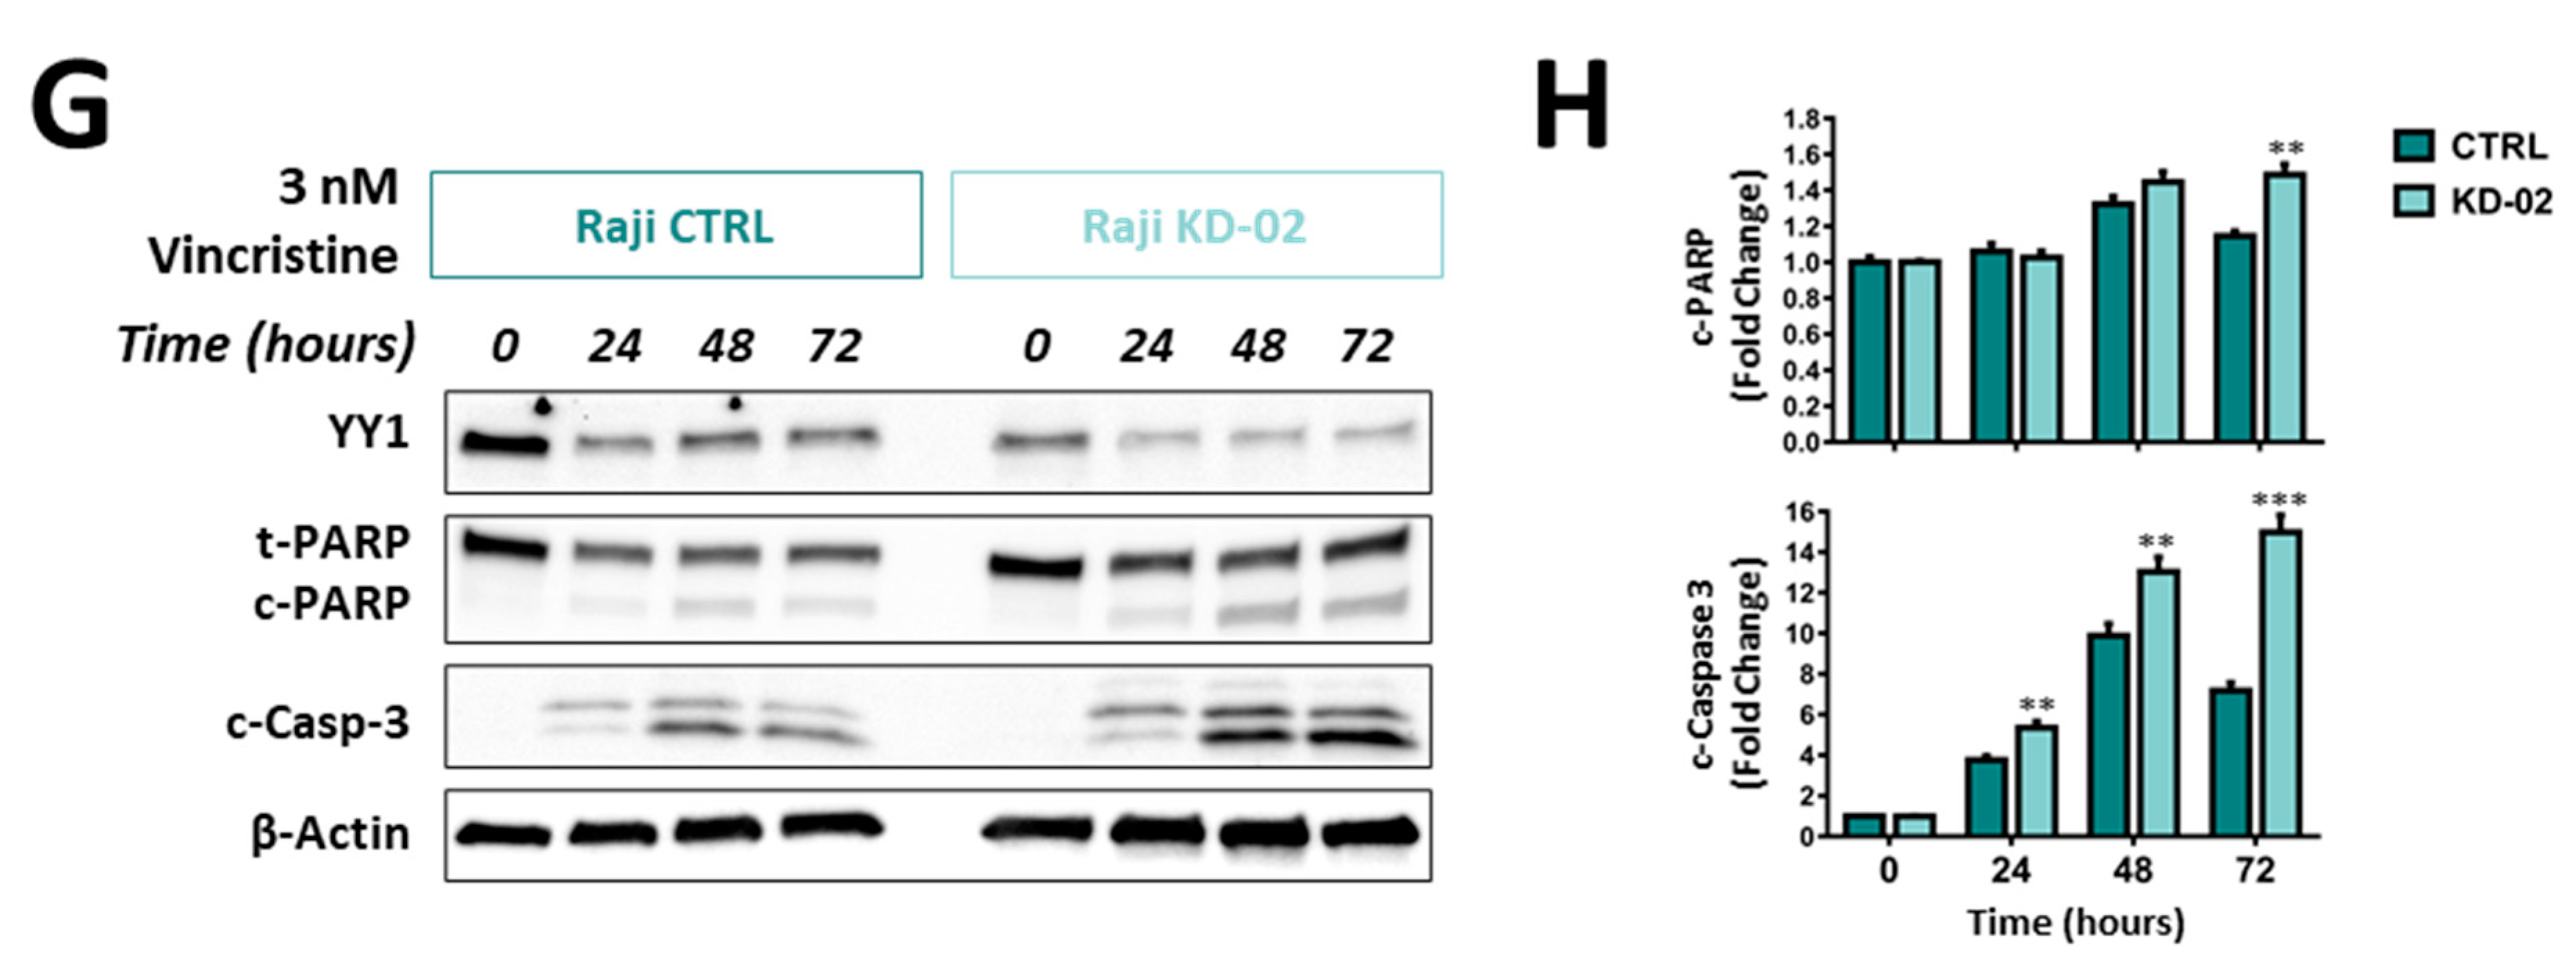
2.5. YY1 Silencing Sensitizes Raji BL Cells to Chemotherapy-Induced Cytotoxicity and Enhances Their Apoptotic Response UponTreatments

In order to evaluate whether YY1 silencing could affect the Raji BL cellular response to drug treatments, and therefore to validate its oncogenic role, Raji CTRL cells and Raji KD-02 cells (significantly silenced for YY1) were treated with two drugs, which are part of the first-line protocols used in B-NHL treatment (i.e., CHOP, R-CHOP): doxorubicin and vincristine. Concentration-response curves were setup for each drug, with the MTT assay as viability end-point readout.
For the doxorubicin treatment, the curve corresponding to the Raji cells silenced for YY1 (KD-02) showed a shift towards the left compared with the CTRL, meaning that the Raji cells knocked-down for YY1 were more sensitive to the doxorubicin treatment. The IC50 were respectively 4.96 × 10⁻⁸ M for Raji CTRL and 2.26 × 10⁻⁸ M for Raji KD-02 (p = 0.0004), being the latter significantly more sensitive to the cytotoxicity induced by doxorubicin (Figure 6A). Figure 6B shows the bars plot for the viability of Raji CTRL and KD-02 at three different concentrations around the IC50 (10, 40 and 160 nM) and, for each concentration, the viability was significantly reduced in the KD-02 cells compared with the CTRL (respectively, p = 0.0028, p = 0.0069, p = 0.0035).
Equally, for the vincristine treatment, the curve corresponding to the Raji cells silenced for YY1 (KD-02) showed a shift towards the left compared with the CTRL, meaning that the Raji cells knocked-down for YY1 were more sensitive to the vincristine treatment. The IC50 were respectively 1.87 × 10⁻⁹ M for Raji CTRL and 1.21 × 10⁻⁹ M for Raji KD-02 (p = 0.0005), being the latter significantly more sensitive to the cytotoxicity induced by vincristine (Figure 6C). Figure 6D shows the bars plot for the viability of Raji CTRL and KD-02 at three different concentrations around the IC50 (1.2; 3.7 and 11 nM) and, for each concentration, the viability is significantly reduced in KD-02 compared with CTRL ones (respectively, p = 0.0259, p < 0.0001, p = 0.0093).
Altogether, the results shown in Figure 6A–D demonstrate that YY1 silencing sensitizes Raji B-NHL cells to cytotoxicity induced by two different drug treatments, doxorubicin and vincristine. In fact, for both the drugs tested, when comparing the same concentrations, the KD-02 Raji cells, which are silenced for YY1, show a reduction in viability in comparison with the CTRL Raji cells.
Additionally, in order to demonstrate whether the reduction in viability within YY1 silenced Raji cells was coupled with a concomitant increase in apoptosis induction, a time-course experiment was performed. Figure 6E summarizes the immunoblotting results obtained, following a treatment of 30 nM doxorubicin, which is a concentration close to the calculated IC50s (see Figure 6B). Protein samples of Raji CTRL and KD-02 treated cells have been collected at 0, 24, 48 and 72 h post treatment. In order to evaluate the apoptosis activation, the levels of expression of two protein apoptotic markers have been evaluated: cleaved PARP and cleaved Caspase 3. Each marker is detected in apoptotic cells, and their relative levels allow to compare the activation of the apoptotic pathway among different samples. The immunoblotting results suggested that there was a time-dependent increase of both cleaved PARP and cleaved Caspase 3 signals, in both CTRL and KD-02 Raji cell lines. But, by comparing the relative levels of these apoptotic markers within the same time-points within the CTRL vs. KD-02 cells, it is clear that both cleaved PARP and cleaved Caspase 3 signals are higher in KD-02 than in CTRL cells. Therefore, in Raji cells the concentration-dependent decrease in viability is coupled with a time-dependent increase in apoptosis.
The reduction in viability and the concurrent increase in apoptosis are significantly greater in Raji cells which are knocked-down for YY1 when compared with their unsilenced control. Figure 6F shows the densitometry analysis for cleaved PARP and cleaved Caspase 3. In the bar plot, all normalized signals are expressed as fold change with respect to the normalized CTRL sample at 0 h of treatment, considered as unitary. The densitometry analysis for cleaved PARP at 72 h of treatment shows a significant increase from 1.5 in CTRL to 3.2 folds in KD-02 (p = 0.0020). Accordingly, the densitometry analysis for cleaved Caspase 3 shows a significant increase at 48 h of treatment from 1.7 in CTRL to 2.4 folds in KD-02 (p = 0.0290), and an increase at 72 h of treatment from 2.9 in CTRL to 5.2 folds in KD-02 (p = 0.0067).
Likewise, Figure 6G summarizes the immunoblotting results, following a treatment of 3 nM Vincristine, which is a concentration around the calculated IC50s (see Figure 6C). Similarly, cleaved PARP and cleaved Caspase 3 have been evaluated. For vincristine treatments, the immunoblotting results obtained suggest that there is a time-dependent increase of both cleaved PARP and cleaved Caspase 3 signals in both CTRL and KD-02 Raji cell lines. But, by comparing the relative levels of these apoptotic markers within the same time-points, the KD-02 cells show cleaved PARP and cleaved Caspase 3 signals higher in KD-02 than in CTRL cells. Therefore, also for vincristine, the concentration-dependent decrease in viability (reported in the MTT assay, is coupled with a time-dependent increase in apoptosis, which is greater in cells knock-down for YY1 compared with their unsilenced control. Figure 6H reports the levels of cleaved PARP and cleaved Caspase 3. All normalized signals are expressed as fold change with respect to the normalized CTRL sample at 0 h of treatment, considered as unitary. The densitometry analysis for cleaved PARP at 72 h of treatment shows a significant increase from 1.2 in CTRL to 1.5 folds in KD-02 (p = 0.0031). Accordingly, the densitometry analysis for cleaved Caspase 3 shows a significant increase at 24 h of treatment from 3.8 in CTRL to 5.4 folds in KD-02 (p = 0.0046), at 48 h of treatment from 9.9 in CTRL to 13.0 folds in KD-02 (p = 0.0086), and at 72 h of treatment from 7.2 in CTRL to 15.0 folds in KD-02 (p = 0.0005).
In summary, Raji cells which are silenced for YY1, when treated with a sub-lethal concentration of either doxorubicin or vincristine, although with different kinetics, showed a time-dependent increase of both cleaved PARP and cleaved Caspase 3 that was significantly greater than the increase detected in CTRL Raji cells, when comparing the same time-points. Altogether, the reported results suggest that YY1 silencing, in association with a reduction in cellular viability, potentiates the apoptotic response in Raji cells treated with the two different cytotoxic drugs.

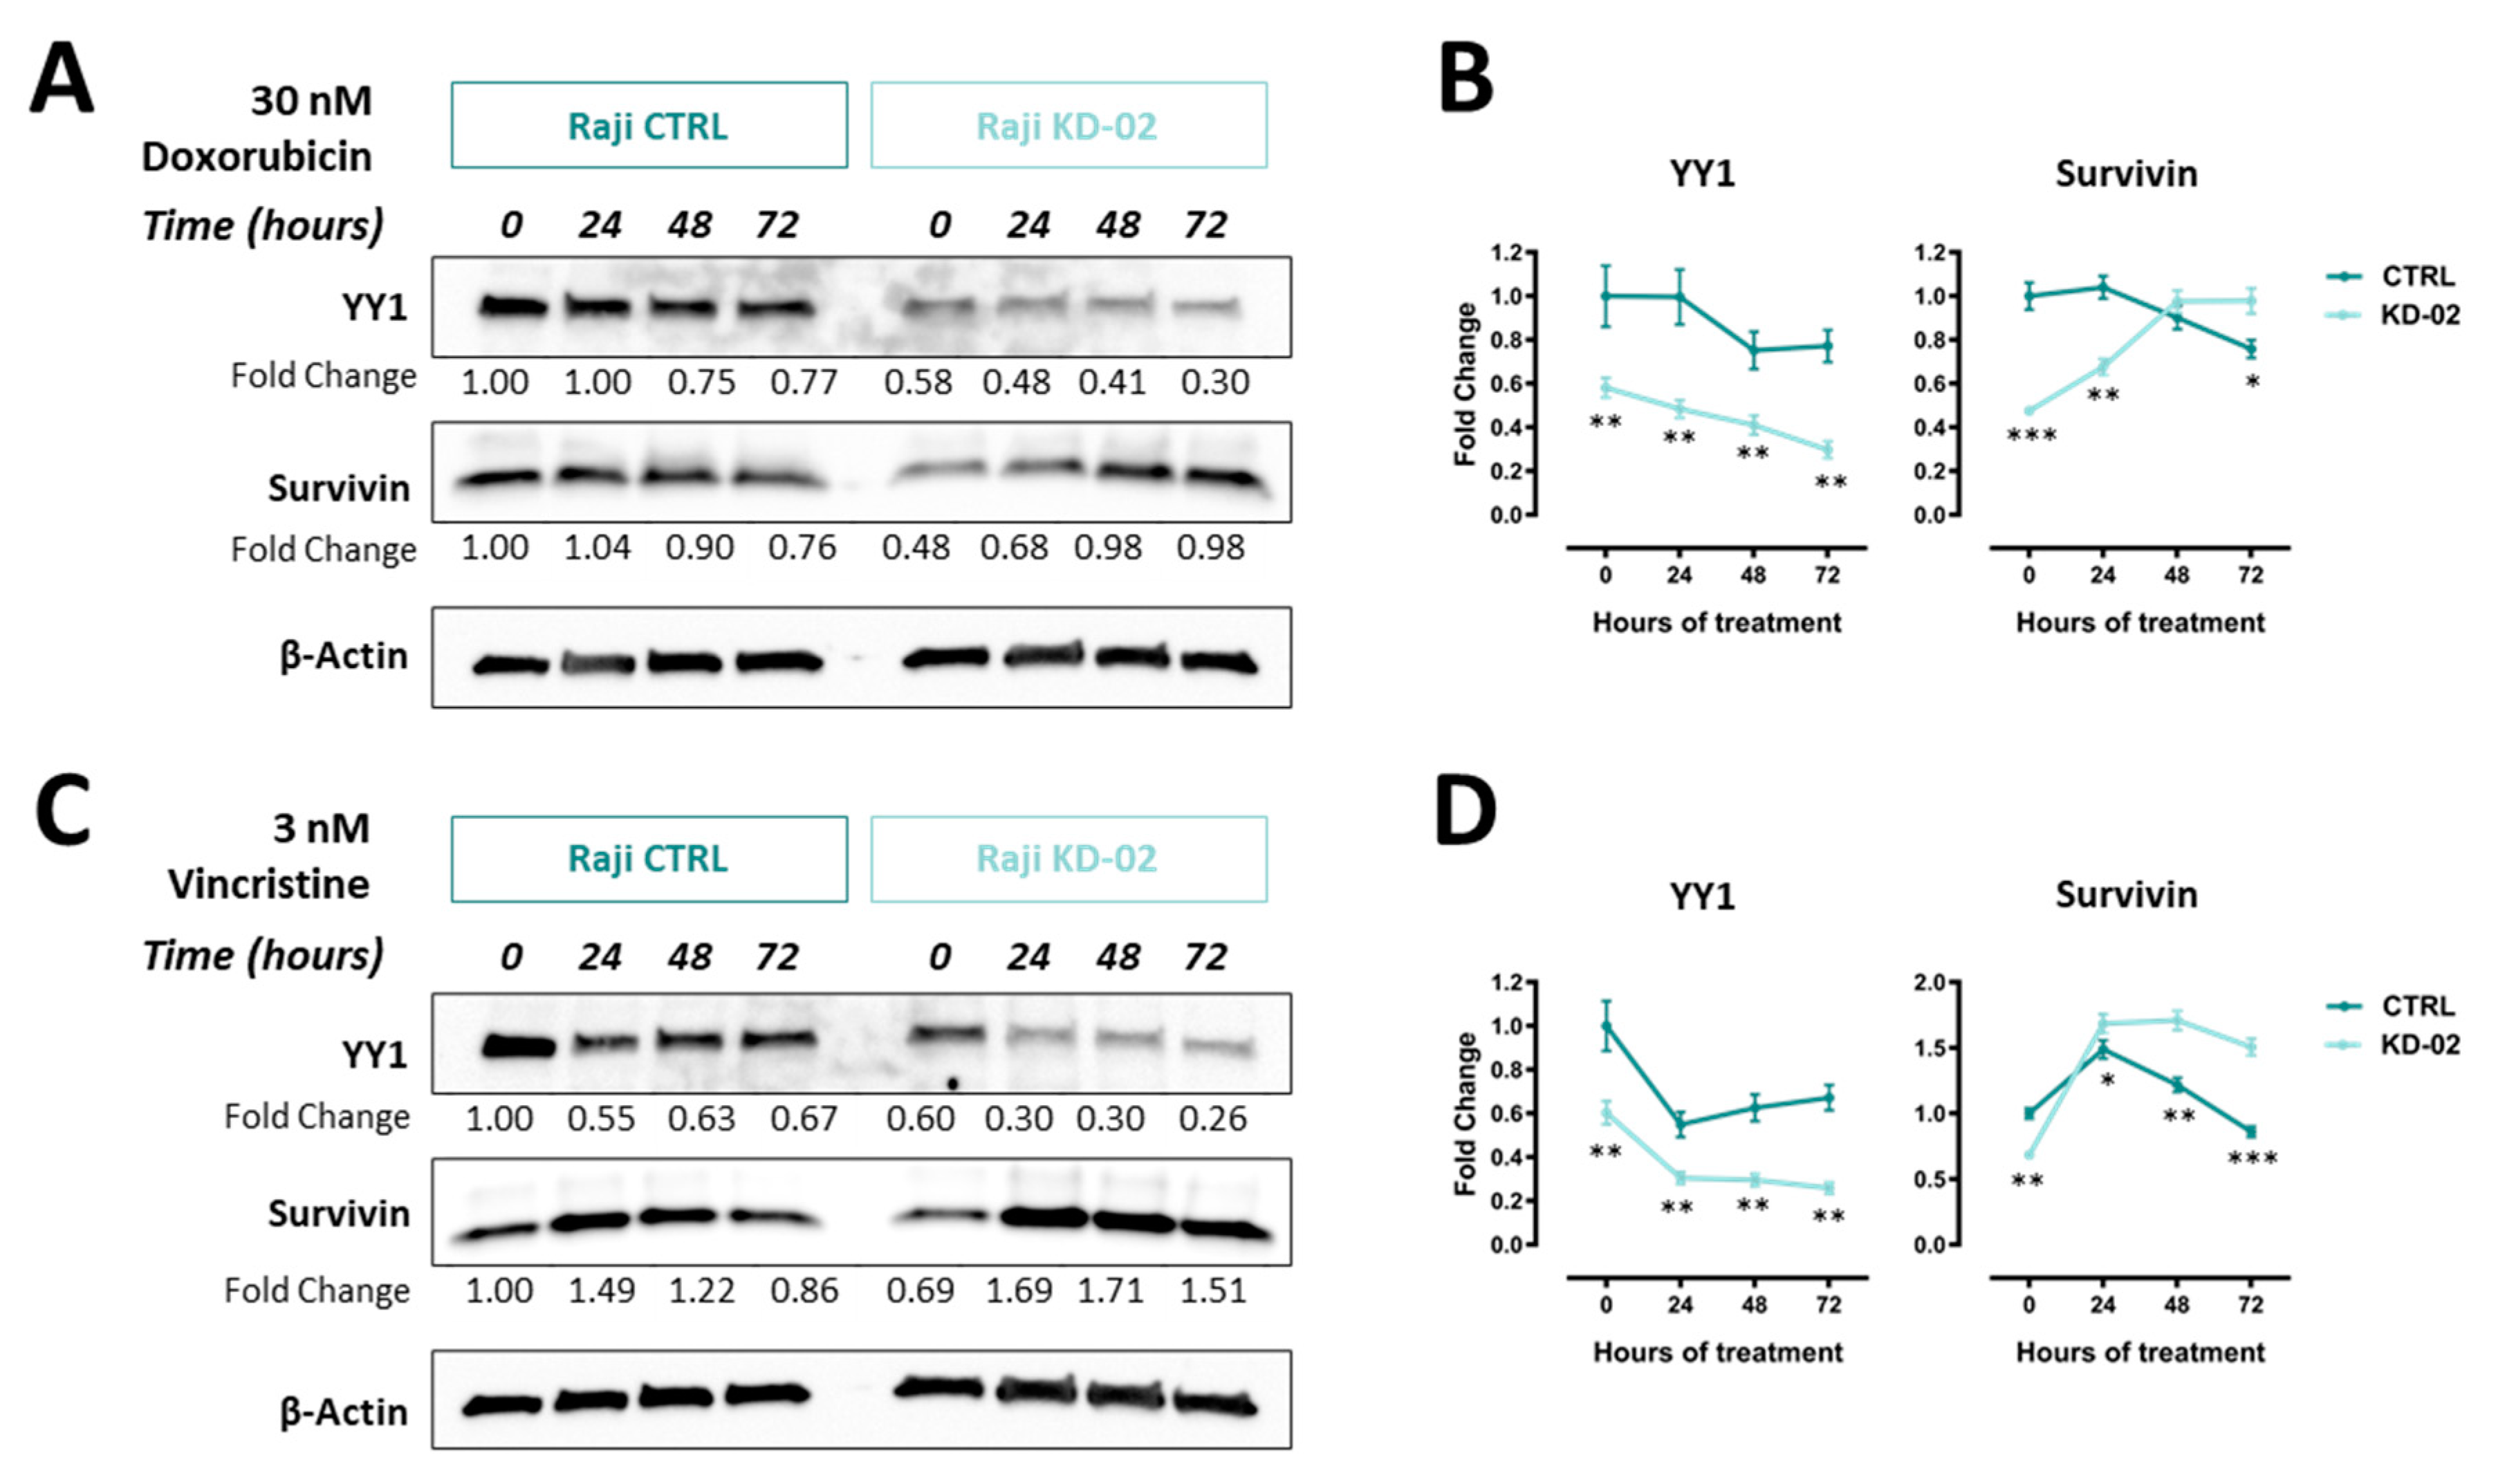
2.6. YY1 and Survivin Association Is Reverted upon Doxorubicin and Vincristine Treatment Only in BL Raji Cells Which are Efficiently Silenced for YY1

To analyze YY1 and survivin protein expression variations upon cytotoxic treatments, immunoblotting analyses of both YY1 and survivin protein levels, following both doxorubicin and vincristine time-course treatments, were performed.
Figure 7A shows the results obtained by treating Raji cells with 30 nM doxorubicin, from 0 to 72 h. In particular, for YY1 it is possible to assess a time-dependent downregulation in terms of total protein, both in CTRL and KD-02 cells. Such levels are significantly lower at 72 h treated samples, when compared with the 0 h samples, both for CTRL and KD-02 cells (Figure S5A). Moreover, this downregulation affects both CTRL and KD-02 Raji cells, therefore, the relative levels of YY1 were significantly lower in KD-02 vs. CTRL cells, for each time-point analyzed (Figure 7B).
For survivin, in agreement with the result reported in Figure 5, the protein basal levels are lower in YY1 knock-down untreated Raji cells (KD-02) when compared to non-silenced control ones (CTRL), thus confirming a positive association between YY1 and survivin expression at 0 h (Figure 7A). However, upon doxorubicin treatment, for survivin a different kinetic of expression between CTRL and KD-02 cells is observed. In particular, in CTRL cells the survivin levels slightly increased following 24 h of treatment, while at 48 and 72 h decreased, being significantly reduced at 72 h compared with the 0 h time point (Figure S5B). In contrast, in YY1-KD-02 Raji cells the survivin levels increased over time, thus being significantly augmented when comparing 0 h vs. 72 h samples (Figure 7B and Figure S5B).
Figure 7C shows the data for 3 nM vincristine treatment, from 0 to 72 h. Likewise, for vincristine, for YY1 protein it is possible to measure a time-dependent downregulation, both in CTRL and KD-02 cells. YY1 protein expression is significantly lower at 72 h treated samples, when compared with the 0 h samples, both for CTRL and KD-02 cells (Figure S5C). Moreover, this downregulation affects both CTRL and KD-02 Raji cells; therefore, the relative levels of YY1 were significantly lower in KD-02 vs. CTRL cells, for each time-point analyzed (Figure 7D).
Accordingly, for vincristine, in Figure 7C it is possible to observe that the survivin basal levels are lower in YY1 knock-down untreated Raji cells (KD-02) when compared to non-silenced control ones (CTRL), thus confirming a positive association between YY1 and survivin expression at 0 h. However, upon vincristine treatment, for survivin a different kinetic of expression within CTRL and KD-02 cells was observed. In particular, in CTRL cells the survivin levels increased following 24 h of treatment, while at 48 and 72 h decreased strongly, being significantly reduced at 72 h compared with the 0 h time point (Figure S5D). In contrast, in YY1-KD-02 Raji cells the survivin levels increased over time up to 48 h, being modestly lower at 72 h compared with 48 h of treatment. Importantly, also for vincristine treatment, it is shown a significant increase of survivin protein level when comparing 0 h vs. 72 h samples (Figure 7D and Figure S5D).
Altogether the results reported in Figure 7 and Figure S5 demonstrate that, while there is a positive correlation between YY1 and survivin protein levels in untreated cells CTRL vs. KD for YY1; when the cells undergo apoptosis, such a correlation becomes negative, consistently and selectively in doxorubicin- and vincristine-treated KD-02 Raji cells, following 72 h of treatment. In summary, YY1 is downregulated in a time-dependent manner in both CTRL and KD-02 Raji cells upon cytotoxic stimuli. However, while survivin is significantly downregulated in CTRL samples, it is significantly upregulated in YY1-KD samples, at the latest time point, for both treatments. Therefore, the positive correlation of survivin and YY1 is selectively reverted only within cells which are knocked-down for YY1, thus expressing relative lower levels of YY1 protein.

3. Discussion

YY1 is a pleiotropic transcription factor, able to modulate more than one pathway within multiple tissues and organs, including the regulation of the apoptosis. YY1 plays a key role in mouse embryogenesis and tissue development, as its absence in not compatible with life [29]. Moreover, YY1 haploinsufficiency in humans leads to a severe intellectual disability disorder [30]. Regarding the immune system, YY1 is known to be essential at all stages of B-cell differentiation [10,31].
Additionally, YY1 mutation or dysregulation may bring to either its downregulation or overexpression, and the alteration in YY1 intracellular levels may be linked with a wide range of conditions, including cancer [9,32,33]. The final outcome is strictly context-dependent [9].
Among the tumors in which YY1 has been seen to be a fundamental factor, are included B-NHLs. When dysregulated, YY1 may be linked with lymphomagenesis and several reports describe YY1 as negative prognostic marker in the vast majority of hematological malignancies [12]. Although some studies showed that YY1 silencing or inhibition might sensitize B-NHL cells to chemotherapy or immunotherapy, the functional role played by such transcription factor at molecular levels still remains elusive [34].
In this work, by using an in-silico promoter regions screening approach (JASPAR) coupled with an in vitro RT-PCR-based validation method, a potential YY1 target gene, called BIRC5, or survivin, has been identified. Survivin belongs to the IAPs family of apoptosis modulators, it is able to promote both apoptosis inhibition and cell cycle progression, and it is highly expressed during G2-M phase of the cell cycle [35]. Although YY1 has been demonstrated to regulate survivin expression in other models, the mechanism is not totally clarified, as it seems to rely on the specific cancer nature [36].
Firstly, to support the association existing between YY1 and BIRC5 gene expression, thus elucidating the potential clinical role played by both factors in B-NHL patients, bioinformatics data obtained from publicly available databases have been analyzed. The analysis of YY1-ChIP-Seq experiments deposited on ENCODE corroborates the strong interaction occurring between YY1 factor and BIRC5 promoter within different cellular models, including lymphoid cells, thus suggesting a direct binding of YY1 transcription factor on the survivin promoter.
Importantly, through the use of the R2 platform, YY1 and BIRC5 expression levels were further compared in 12 independent B-NHL GEO datasets vs. normal control ones and found significantly higher in tumor specimens. Additionally, the calculated Pearson and Spearman correlations between YY1 and BIRC5 expression in all the 12 B-NHL GEO datasets were significantly positive, therefore suggesting a pro-tumorigenic role for both YY1 and survivin in B-NHL patients. Strikingly, the analyses of mixed B-NHL datasets evidenced that both YY1 and BIRC5 were significantly and highly overexpressed in BLs and high-grade B-NHLs, compared to their expression in other milder forms of B-cells lymphomas. Moreover, once the datasets with multiple B-NHL samples were stratified to perform contingency Fisher’s exact tests and ROC analyses, both YY1 and BIRC5 were significantly highly expressed in the BL and aggressive B-NHL subgroups. This latter observation clearly suggests that the assessment of YY1 and BIRC5/survivin levels might be used as biomarker of specific aggressive B-NHLs subtypes, especially the widely diffused BLs.
These observations were further validated in Raji cells, which are a widely used BL cellular model. The approach used was a shRNA-mediated silencing strategy, in order to constitutively downregulate the level of YY1 in Raji cells, which express higher levels of YY1 compared with normal lymphoid tissues, as previously reported by our group [12]. In this study it was demonstrated that YY1 silencing does not affect cellular growth and viability. Hence, YY1 role upon cytotoxic stimuli was further verified.
YY1 plays an oncogenic role in various hematological tumors. For instance, anti-CD20-mediated YY1 inhibition sensitizes NHL cells to TRAIL-induced and Fas-induced apoptosis [37,38]. Moreover, YY1-RelA complex is able to repress the transcription of the pro-apoptotic factor Bim in MM cells therefore promoting tumorigenesis [39]. Also, YY1 suppresses miR-let-7a thus driving chemoresistance in AML cells [40]. Coherently, YY1 is a transcriptional activator of the multidrug resistance gene MDR1, which plays an important role in chemoresistance, in ALL cells [41]. Moreover, it has also been demonstrated that pRb-YY1 interaction prevents YY1 binding to the c-Myc promoter in normal B cells, but not in BL cells [13]. Finally, YY1 may positively regulate the expression of another transcription factor KLF4, showing a dual role in cancer, with a possible prognostic value [42]. Altogether, these findings suggest that the molecular context and the molecular players available (including surrounding co-activators and co-repressors) may highly influence the final outcome of YY1 transcriptional activity, which can be very heterogeneous.
Importantly, BIRC5/survivin has been found to be significantly downregulated, at both transcript and protein levels, in Raji cells which are efficiently silenced for YY1. This result validates the positive correlation observed in B-NHL patients. Overall, our findings suggest that survivin might be a potential transcriptional target of YY1 in Raji BL cells. In light of the JASPAR analysis, as well as the YY1-ChIP-seq deposited results, it can be hypothesized that YY1 might directly promote survivin transcription, also in Raji BL cells. This regulation can be direct, following survivin promoter binding. Alternatively, YY1 might interact with other transcription factors and co-factors, such as specificity protein 1 (Sp1) transcription factor, and therefore indirectly induce survivin expression [43,44,45].
Interestingly, survivin is an inhibitor of apoptosis, known to regulate mitosis in B cell homeostasis and, importantly, it has a prognostic role in patients with NHL, where its overexpression is coupled with a poorer prognosis [46,47,48]. Correspondingly, it has been demonstrated that the overexpression of survivin initiates hematological malignancies in vivo, while its inhibition suppresses the growth of aggressive forms of NHL [49,50]. Mechanistically, the overexpression of survivin is associated with inhibition of apoptosis initiated via the extrinsic or intrinsic apoptotic pathways. Survivin may interact with effector caspases, thus disrupting the final outcome of the caspase cascade and, in turn, the programmed cell death finalization [51].
Given its overexpression in several cancers coupled with a concomitant lower (or absent) expression in normal tissues, survivin is a widely studied molecular target in oncology, and it has properly considered a golden bullet [52]. The current approaches developed to inhibit survivin in cancer cells can be divided into 5 different classes: (1) survivin-partner protein interaction inhibitors, (2) survivin dimerization inhibitors, (3) survivin gene transcription inhibitors, (4) survivin mRNA inhibitors and (5) survivin immunotherapy. Currently, over 80 studies registered in clinicaltrials.gov are studying both the safety and potential efficacy of complementing traditional anti-cancer approaches with small molecules or survivin-targeting vaccines, thus increasing the overall sensitivity of cancer cells to anti-cancer treatments [52].
The validation experiments performed in Raji BL cells, demonstrate a positive correlation between YY1 knock-down and survivin downregulation, which is in line with the functional effects observed in terms of viability and apoptosis. In fact, Raji cells silenced for YY1, and hence downregulated for survivin, show an increased susceptibility to both doxorubicin and vincristine coupled with an increased overall apoptosis, as shown by the augmented cleavage of the effector Caspase 3 and PARP detected by immunoblotting. Importantly, this result is in further agreement with a previous study from Gu et al., which demonstrated that the direct knock-down of survivin induces apoptosis and growth inhibition in Raji cells [53].
Regarding survivin transcriptional regulation by YY1, contradictory results have been reported by others. In fact, it has been shown that YY1 may inhibit or promote survivin transcription, depending on the molecular milieu of YY1-interacting co-activator/co-repressors [36]. While, Galloway et al. [54] found that YY1 transcriptionally represses survivin gene in an in vitro model of osteosarcoma, Affar et al. [29] showed that survivin levels were decreased in a mouse YY1-knock-down model. Consistently with the latter, in a model of colorectal cancer, Zhang and colleagues evidenced that YY1 expression is positively correlated with survivin expression, as YY1 knock-down was associated with a downregulation of survivin [55]. The explanation for these opposite findings could lie in the different cellular contexts, which, in general, profoundly change the final effects on the transcriptional modulation of a given gene. An alternative explanation could be the presence of mutated transcription factors’ binding sites along the BIRC5 promoter in cancer cells, which might affect the overall binding of the various transcriptional regulators, including YY1 [56].
Our in vitro observations are in agreement with the positive modulation of YY1 on survivin expression. However, as shown in Figure 7, the time-course experiments performed with both doxorubicin and vincristine, further demonstrated that, following 72 h of cytotoxic stimuli, this positive correlation is significantly inverted, only within cells which are silenced for YY1 and, hence, expressing relative lower YY1, and survivin, basal levels. In particular, we found that YY1 levels are decreased upon doxorubicin and vincristine treatments, in both CTRL and YY1-KD cells. This observation is in line with the results obtained previously by Vega et al., in B-NHL 2F7 cells, where the authors observed a downregulation of YY1 protein levels following Rituximab (anti-CD20) treatment, and presumably due to NF-kB downregulation [38].
Regarding survivin, while its protein level decreased in Raji CTRL cells following 72 h of either doxorubicin or vincristine treatment, in contrast, within cells effectively knocked-down for YY1, survivin protein levels significantly increased upon 72 h of both cytotoxic treatments, thereby reverting the positive association existing between YY1 and survivin expression in basal conditions. This upregulation of survivin levels following apoptosis, may depend on the long-term effects of the apoptotic response, which have been reported to affect the overall subcellular distribution of survivin. In particular, it has been observed that during apoptosis survivin accumulates in the nucleus, thus being unable to perform its anti-apoptotic function (which is exerted in the cytoplasm). In cells that express less YY1, and therefore less survivin, this nuclear accumulation may be relatively more effective, thus justifying the more powerful apoptotic response detected in YY1-KD Raji cells (as demonstrated by cleaved Caspase 3 and cleaved PARP immunoblotting results reported in Figure 6) [57,58].
In conclusion, the results reported in this work overall suggest the oncogenic role played by both YY1 and survivin in aggressive B-NHLs, in particular in BLs, as suggested by the validations studies conducted in Raji cells. These observations might open up to novel research directions, to further explore a potential use of both YY1 and survivin as markers for diagnosis of aggressive types of B-cells lymphomas. Finally, both YY1 and survivin may be additionally analyzed in the future as pharmacological targets in the search for new therapeutic approaches for the effective cure of resistant/relapsing B-cells lymphomas.

4. Materials and Methods

4.1. Determination of YY1 Binding Sites Localized within the Promoters of Apoptosis Regulator Genes by Ensembl Search and JASPAR Analysis

The Ensembl database [59] was used to search for the transcriptional regulatory regions sequences of the main genes involved in apoptosis regulation, including the ones belonging to the B-cell lymphoma 2 (BCL2) family and to the inhibitors of apoptosis proteins (IAPs) family. Subsequently, the analysis for the presence of YY1 putative binding sites located within the identified transcriptional regulatory regions was performed using JASPAR open-access database, by using the deposited YY1 binding site matrix profile MA0095.2 [60]. In particular, for each candidate gene, 3000 nucleotides (according to the Ensembl deposited gene sequence) have been analyzed: from 2000 upstream to 1000 downstream the Transcription Starting Site (TSS). As outcome of the analysis, with the selected apoptotic genes, their regulatory elements were analyzed and the promoters’ analysis results are reported in Table S1.

4.2. Bioinformatics Analyses

Computational analyses of bioinformatics data contained in three of the biggest bioinformatic portals, the UCSC Genome Browser, ENCODE and Gene Expression Omnibus (GEO) repository, were performed in order to support the in vitro data here obtained [61,62].
First, the “Transcription Factor ChIP-seq” experiments deposited on ENCODE 3, and publicly available on UCSC Genome Browser, were computationally analyzed in order to identify the transcription factors able to bind BIRC5 promoter and to establish the interaction levels of YY1 within BIRC5 promoter in both normal and cancer cell lines [63].
Subsequently the GEO datasets, 12 from B-NHL patients and five from normal heathy subjects, reported in Table 2, were analyzed by using the R2 Genomics Analysis and Visualization Platform to establish the expression levels of YY1 and BIRC5 in B-NHL patients compared to normal controls and to study the correlation between YY1 and BIRC5 in B-NHL patients datasets [64].

4.3. Cell Lines and Culture

The Raji cell line was purchased from the American Type Culture Collection (ATCC, Manassas, VA, USA) and the cells were grown in RPMI 1640 (Sigma-Aldrich, St. Louis, MO, USA). The 293-LinX-A packaging cell line (kind gift from Dr Roberta Maestro, Aviano, Italy) was cultured in DMEM (Sigma-Aldrich, St. Louis, MO, USA). All culture media were supplemented with 2 mmol/lLL-glutamine, 100 IU penicillin, 100 μg/mL streptomycin and 10% heat-inactivated Fetal Bovine Serum (Sigma-Aldrich, St. Louis, MO, USA). All cells were maintained in a constantly humidified, 37 °C and 5% CO2 incubator. Mycoplasma absence was assessed by a PCR Assay. All cells investigated in this study were used within 15 passages after thawing.

4.4. Generation of Raji Cells Constitutively Silenced for YY1

In order to characterize the functional role played by the YY1 transcription factor in Raji cells, a shRNA-mediated approach has been used. Three retroviral plasmid vectors have been used. The specific 21 bases-long targeting sequences are: 5′-GCTCTGTAATCTCGTTTCAAA-3′ for KD-01, directed against the 3′ untranslated region (UTR) of YY1 mRNA, and 5′-CCTCCTGATTATTCAGA ATAT-3′ for KD-02, directed against the coding sequence (CDS) of YY1 mRNA. Additionally, a retroviral plasmid vector, carrying a non-targeting shRNA sequence, 5′-CCGCCTGAAGTCT CTGATTAA-3′, directed against an unrelated mRNA from firefly luciferase, has been used as non-targeting control (CTRL). In particular, the three selected shRNA sequences, within the plasmid vector, are inserted inside the 3′ and 5′ flanking regions of human miR30 microRNA, to form a shRNA-mir, under the transcriptional control of the constitutive MSCV-LTR promoter (Figure S6).
YY1 silencing retroviral vectors, pSMP-YY1_1 and pSMP-YY1_2 and non-silencing control pSMP-Luc were generated by George Daley and deposited in the Addgene plasmid bank (respectively addgene-36357, addgene-36358; addgene-36394, Addgene, Watertown, MA, USA) [65]. pSMP-YY1_1, pSMP-YY1_2 and pSMP-Luc retroviral particles were prepared using the amphotropic packaging cell line 293-LinX-A, according with the published protocol [66,67,68]. Retroviral supernatants were collected 48 h post-transfection, filtered and stored at −80 °C, until further usage. Retroviral transduction was performed on Raji target cells, following the published protocol [66,67,68]. Transduced cells were selected with Puromycin (1 µg/mL final, Sigma-Aldrich, St. Louis, MO, USA) added to the culture medium until positive selection was accomplished (7 days). Puromycin-selected cellular populations were harvested for expansion and further analyses were performed (total RNA extraction, total protein extraction, viability assays and dose-response assays). Three stably pooled transduced cell lines were established, one per each construct, and called respectively: Raji KD-01 and Raji KD-02 the two cell lines carrying the shRNA targeting YY1 transcript, and Raji CTRL, the cell line carrying the non-targeting shRNA. Each resulting cellular pool was composed of cells with a random and stable genomic integration of the retroviral construct.

4.5. Cell Viability Assay

The 3-(4,5-dimethylthiazol-2-yl)-2,5-diphenyl tetrazolium bromide (MTT, Sigma-Aldrich, St. Louis, MO, USA) viability assay was used to assess cellular viability for Raji parental, Raji YY1-silenced and Raji non-silencing control cells. For the growth curve, cells were seeded in triplicate samples into a 96-well plate at different seeding densities (from 1000 to 8000 cells per well), plates were stamped in 5 replicates, and cellular viability was assessed every day for 5 days. For anti-cancer treatments, cells were seeded in triplicate samples into a 96-well plate at 5000 cells per well. 24 h after seeding, cells were treated with doxorubicin and vincristine, two components of the first-line used protocols for the treatment of NHL were used (Sigma-Aldrich, St. Louis, MO, USA). Dose-response curves were setup for each drug, with MTT assay as readout. Doxorubicin from 1.00 × 10⁻⁵ to 1.53 × 10⁻¹⁰ M (9 serial dilutions 1:4) and vincristine from 1.00 × 10⁻⁷ to 1.52 × 10⁻¹¹ M (9 serial dilutions 1:3). 72 h after the treatments, cells were assessed for their viability. Viability assessment was done by adding MTT 0.5 µg/mL final to each well. Cells were incubated for 4 h at 37 °C. The insoluble formazan crystals were dissolved by adding acid-isopropanol stop solution (Isopropanol with 0.04 N HCl final) and then by pipetting up and down vigorously. The absorbance was measured at 620 nm, using a Sunrise microplate reader (Tecan, Männedorf, Switzerland). Cell viability was expressed as a percentage compared to control cells, assumed to be 100% viable.

4.6. Trypan Blue Cell Count

Cellular samples were mixed 1:1 with 0.4% Trypan Blue (Thermo Fisher Scientific, Waltham, MA, USA) by gently pipetting, and then 20 μL of the mix were loaded into a chamber of the hemocytometer (Bürker chamber). Counts were performed in triplicate using the Eclipse Ts2 inverted microscope (Nikon, Melville, NY, USA). Cells permeable to Trypan Blue were counted as death. Cells perfectly rounded and not permeable to Trypan Blue were considered viable.

4.7. Total RNA Extraction, cDNA Synthesis and Semiquantitative and Quantitative RT-PCR Analysis

For total RNA extraction, up to 3 million of cells were harvested and total RNA was isolated using GeneJET RNA Purification Kit (Thermo Fisher Scientific, Waltham, MA, USA), according to manufacturer’s instructions. For cDNA synthesis, 3 µg of the total RNA was reverse-transcribed with Super-Script IV Reverse Transcriptase (Thermo Fisher Scientific, Waltham, MA, USA), using 50 μM random hexamers (Thermo Fisher Scientific, Waltham, MA, USA).
For RT-qPCR the Luminaris Color HiGreen qPCR Master Mix, high ROX (Thermo Fisher Scientific, Waltham, MA, USA) was used. Amplified cDNA levels were quantitatively determined with a 7300 Real-Time PCR System (Applied Biosystems, part of Thermo Fisher Scientific, Waltham, MA, USA). The template cDNA was amplified using the primer pairs reported in Table 4, all designed by using Primer-Blast priming designing tool from NCBI [69].
The real-time PCR program for quantitative RT-PCR (q-RT-PCR) was the following: UDG pre-treatment at 50 °C for 2 min, followed by an initial denaturation step at 95 °C for 10 min and a 3-step PCR program at 95 °C for 15 s, 60 °C for 30 s and 72 °C for 30 s, for 40 cycles. The expression levels of target genes were normalized to the averaged expression levels of human GAPDH, used as the housekeeping gene.
For semi-quantitative RT-PCR (sq-RT-PCR), DreamTaq Green PCR Master Mix, Thermo Fisher Scientific, Waltham, MA, USA) was used. The template cDNA was amplified using the primer pairs reported in Table 4 (same as in q-RT-PCR). The PCR program was: initial denaturation step at 95 °C for 2 min and a 3-step PCR program at 95 °C for 30 s, 60 °C for 30 s and 72 °C for 1 min, final elongation at 72 °C for 5 min. PCR products were analyzed through gel electrophoresis and the expression levels of target genes in each sample was normalized to the expression levels of human GAPDH in the same sample, used as the housekeeping gene.

4.8. Protein Lysates Preparation, Quantification and Immunoblotting Analysis

For protein extraction, up to 5 million of cells were harvested. The collected cells were lysed using nonidet-P40 (NP40) buffer (150 mM NaCl, 1.0% NP-40, pH 8.0 50 mM Tris, Thermo Fisher Scientific, Waltham, MA, USA) supplemented with protease inhibitors and phosphatase inhibitors (Roche Diagnostics, Indianapolis, IN, USA). Protein concentration was determined using the Bradford assay (Bio-Rad Laboratories, Hercules, CA, USA), according to manufacturer’s instructions. Protein samples (30 µg of total protein extract per sample) were separated using Mini-PROTEAN TGX Precast Gels and Mini-PROTEAN gel-electrophoresis system (Bio-Rad Laboratories, Hercules, CA, USA). Protein gels were then transferred onto a nitrocellulose membrane using the TransBlot Turbo transfer system (Bio-Rad Laboratories, Hercules, CA, USA). The membranes were blocked for 1 h at room temperature (RT) with 5% of non-fat dry milk diluted in TBS-T buffer (0.1% Tween 20, 20 mM Tris–HCl pH 7.6, 137 mM NaCl). Immunoblotting analysis was performed using the following antibodies, according to manufacturer’s instructions: anti-YY1 (Rabbit, Cell Signaling Technology, Danvers, MA, USA, CST-2185); anti-β-Actin (Mouse, Sigma-Aldrich, St. Louis, MO, USA, a-1978); anti-PARP (Rabbit, Cell Signaling Technology, Danvers, MA, USA, CST-9532); anti-cleaved-Caspase-3 (Rabbit, Cell Signaling Technology, Danvers, MA, USA, CST-9664), anti-GAPDH (Mouse, Santa Cruz Biotech, Dallas, TX, USA, sc-137179), anti-H3-Histone (Rabbit, Abcam, Cambridge, UK, ab1791), anti-Survivin (Rabbit, Cell Signaling Technology, Danvers, MA, USA, CST-2808); Goat Anti-Rabbit IgG Antibody, Fc, HRP conjugate (Chemicon International, Fisher Scientific, Waltham, MA, USA, AP156P), Goat Anti-Mouse IgG Antibody, Fc, HRP conjugate (Chemicon International, Fisher Scientific, Waltham, MA, USA, AP127P). Membrane signal was detected incubating the stained membrane with the enhanced chemiluminescence (ECL) kit (Bio-Rad Laboratories, Hercules, CA, USA), following manufacturer’s instructions. ECL developed membranes were acquired using the ChemiDoc Touch Imaging System (Bio-Rad Laboratories, Hercules, CA, USA).

4.9. Statistical Analyses

The experiments were performed in triplicates. Statistical analyses were performed using GraphPad Prism version 7.0 for Windows (GraphPad Software, La Jolla, CA, USA). The results were presented as average ± standard deviation (SD) or as median ± SD, as indicated in each figure accordingly. Comparisons between three groups has been performed using one-way analysis of variance (ANOVA) with Tukey’s post-hoc test. Multiple comparisons between two groups were performed using the two-tailed unpaired t-test with Holm-Sidak post-hoc test. Comparisons between two groups on a single parameter were conducted using the two-tailed unpaired t-test.
The normalized expression value distribution of both YY1 and BIRC5 (respectively from YY1 200047_s_at and BIRC5 202095_s_at probes normalized reads) in the 12 Tumor GEO Datasets has been evaluated with a D’Agostino and Pearson normality test.
The contingency analysis of the relevant GEO datasets including several different B-NHL subgroups has been performed by using the Fisher’s exact test (odds ratio calculation with Baptista-Pike posttest). While the ROC curve analysis and AUC calculation has been used to further predict the YY1 and BIRC5 diagnostic relevance in such datasets, comparing per each obtained contingency table the YY1 or BIRC5 gene expression within the two diagnostic subgroups. The statistical significance in figures and tables has been indicated by asterisks, being * = p < 0.05; ** = p < 0.01; *** = p < 0.001; **** = p < 0.0001, while n.s. stands for not significant where p > 0.05.

Supplementary Materials

Author Contributions

Conceptualization, S.V. and M.L.; methodology, S.V. and G.L.; validation, S.V. and L.F.; formal analysis, S.V.; L.F. and S.C.; investigation, S.V. and L.F.; data curation, S.V.; L.F.; A.G. and G.G.M.; writing—original draft preparation, S.V.; L.F. and M.L.; writing—review and editing, S.V.; L.F.; G.L.; S.C.; A.G.; G.G.M.; B.B. and M.L.; visualization, S.V. and B.B.; supervision, M.L.; All authors have read and agreed to the published version of the manuscript.

Funding

This work was supported by: Intramural grant University of Catania Linea di Intervento 2 2016-2018, Project: “Identification of cancer driver genes for novel diagnostic and therapeutic strategies”.

Acknowledgments

The authors would like to acknowledge the Italian League against Cancer (LILT) for its support.

Conflicts of Interest

The authors declare no conflict of interest.

Abbreviations

B-NHLs B-cell non-Hodgkin lymphomas
YY1 Yin Yang 1
GEO Gene Expression Omnibus
BLs Burkitt’s lymphomas
WHO World Health Organization
DLBCL Diffuse large B-cell lymphoma
FL Follicular lymphoma
MCL Mantle Cells lymphoma
MZL Marginal Zone lymphoma
PcG Polycomb Group
TSS Transcription Starting Site

References

  1. Miranda-Filho, A.; Piñeros, M.; Znaor, A.; Marcos-Gragera, R.; Steliarova-Foucher, E.; Bray, F. Global patterns and trends in the incidence of non-Hodgkin lymphoma. Cancer Causes Control 2019, 30, 489–499. [Google Scholar] [CrossRef] [PubMed]
  2. Said, J.W. Aggressive B-cell lymphomas: How many categories do we need? Mod. Pathol. 2013, 26, S42–S56. [Google Scholar] [CrossRef] [PubMed]
  3. Rapozzi, V.; Zorzet, S.; Comelli, M.; Mavelli, I.; Perissin, L.; Giraldi, T. Melatonin decreases bone marrow and lymphatic toxicity of adriamycin in mice bearing TLX5 lymphoma. Life Sci. 1998, 63, 1701–1713. [Google Scholar] [CrossRef]
  4. Juskevicius, D.; Dirnhofer, S.; Tzankov, A. Genetic background and evolution of relapses in aggressive B-cell lymphomas. Haematologica 2017, 102, 1139–1149. [Google Scholar] [CrossRef]
  5. Gordon, S.; Akopyan, G.; Garban, H.; Bonavida, B. Transcription factor YY1: Structure, function, and therapeutic implications in cancer biology. Oncogene 2006, 25, 1125–1142. [Google Scholar] [CrossRef]
  6. Meliala, I.T.S.; Hosea, R.; Kasim, V.; Wu, S. The biological implications of Yin Yang 1 in the hallmarks of cancer. Theranostics 2020, 10, 4183–4200. [Google Scholar] [CrossRef]
  7. De Nigris, F.; Botti, C.; Rossiello, R.; Crimi, E.; Sica, V.; Napoli, C. Cooperation between Myc and YY1 provides novel silencing transcriptional targets of α3β1-integrin in tumour cells. Oncogene 2007, 26, 382–394. [Google Scholar] [CrossRef]
  8. De Nigris, F.; Crudele, V.; Giovane, A.; Casamassimi, A.; Giordano, A.; Garban, H.J.; Cacciatore, F.; Pentimalli, F.; Marquez-Garban, D.C.; Petrillo, A.; et al. CXCR4/YY1 inhibition impairs VEGF network and angiogenesis during malignancy. Proc. Natl. Acad. Sci. USA 2010, 107, 14484–14489. [Google Scholar] [CrossRef]
  9. Sarvagalla, S.; Kolapalli, S.P.; Vallabhapurapu, S. The Two Sides of YY1 in Cancer: A Friend and a Foe. Front. Oncol. 2019, 9, 1230. [Google Scholar] [CrossRef]
  10. Kleiman, E.; Jia, H.; Loguercio, S.; Su, A.I.; Feeney, A.J. YY1 plays an essential role at all stages of B-cell differentiation. Proc. Natl. Acad. Sci. USA 2016, 113, E3911–E3920. [Google Scholar] [CrossRef]
  11. Castellano, G.; Torrisi, E.; Ligresti, G.; Malaponte, G.; Militello, L.; Russo, A.E.; McCubrey, J.A.; Canevari, S.; Libra, M. The involvement of the transcription factor Yin Yang 1 in cancer development and progression. Cell Cycle 2009, 8, 1367–1372. [Google Scholar] [CrossRef] [PubMed]
  12. Castellano, G.; Torrisi, E.; Ligresti, G.; Nicoletti, F.; Malaponte, G.; Traval, S.; McCubrey, J.A.; Canevari, S.; Libra, M. Yin Yang 1 overexpression in diffuse large B-cell lymphoma is associated with B-cell transformation and tumor progression. Cell Cycle 2010, 9, 557–563. [Google Scholar] [CrossRef] [PubMed]
  13. Hu, H.M.; Kanda, K.; Zhang, L.; Boxer, L.M. Activation of the c-myc p1 promoter in Burkitt’s lymphoma by the hs3 immunoglobulin heavy-chain gene enhancer. Leukemia 2007, 21, 747–753. [Google Scholar] [CrossRef]
  14. Vega, M.I.; Jazirehi, A.R.; Huerta-Yepez, S.; Bonavida, B. Rituximab-Induced Inhibition of YY1 and Bcl-x L Expression in Ramos Non-Hodgkin’s Lymphoma Cell Line via Inhibition of NF-κB Activity: Role of YY1 and Bcl-x L in Fas Resistance and Chemoresistance, Respectively. J. Immunol. 2005, 175, 2174–2183. [Google Scholar] [CrossRef] [PubMed]
  15. Piccaluga, P.P.; De Falco, G.; Kustagi, M.; Gazzola, A.; Agostinelli, C.; Tripodo, C.; Leucci, E.; Onnis, A.; Astolfi, A.; Sapienza, M.R.; et al. Gene expression analysis uncovers similarity and differences among Burkitt lymphoma subtypes. Blood 2011, 117, 3596–3608. [Google Scholar] [CrossRef]
  16. Cardesa-Salzmann, T.M.; Colomo, L.; Gutierrez, G.; Chan, W.C.; Weisenburger, D.; Climent, F.; Gonzalez-Barca, E.; Mercadal, S.; Arenillas, L.; Serrano, S.; et al. High microvessel density determines a poor outcome in patients with diffuse large B-cell lymphoma treated with rituximab plus chemotherapy. Haematologica 2011, 96, 996–1001. [Google Scholar] [CrossRef]
  17. Dybkær, K.; Bøgsted, M.; Falgreen, S.; Bødker, J.S.; Kjeldsen, M.K.; Schmitz, A.; Bilgrau, A.E.; Xu-Monette, Z.Y.; Li, L.; Bergkvist, K.S.; et al. Diffuse Large B-Cell Lymphoma Classification System That Associates Normal B-Cell Subset Phenotypes With Prognosis. J. Clin. Oncol. 2015, 33, 1379–1388. [Google Scholar] [CrossRef]
  18. Dubois, S.; Viailly, P.-J.; Bohers, E.; Bertrand, P.; Ruminy, P.; Marchand, V.; Maingonnat, C.; Mareschal, S.; Picquenot, J.-M.; Penther, D.; et al. Biological and Clinical Relevance of Associated Genomic Alterations in MYD88 L265P and non-L265P–Mutated Diffuse Large B-Cell Lymphoma: Analysis of 361 Cases. Clin. Cancer Res. 2017, 23, 2232–2244. [Google Scholar] [CrossRef]
  19. Bouska, A.; McKeithan, T.W.; Deffenbacher, K.E.; Lachel, C.; Wright, G.W.; Iqbal, J.; Smith, L.M.; Zhang, W.; Kucuk, C.; Rinaldi, A.; et al. Genome-wide copy-number analyses reveal genomic abnormalities involved in transformation of follicular lymphoma. Blood 2014, 123, 1681–1690. [Google Scholar] [CrossRef]
  20. Huet, S.; Tesson, B.; Jais, J.-P.; Feldman, A.L.; Magnano, L.; Thomas, E.; Traverse-Glehen, A.; Albaud, B.; Carrère, M.; Xerri, L.; et al. A gene-expression profiling score for prediction of outcome in patients with follicular lymphoma: A retrospective training and validation analysis in three international cohorts. Lancet Oncol. 2018, 19, 549–561. [Google Scholar] [CrossRef]
  21. Scott, D.W.; Abrisqueta, P.; Wright, G.W.; Slack, G.W.; Mottok, A.; Villa, D.; Jares, P.; Rauert-Wunderlich, H.; Royo, C.; Clot, G.; et al. New Molecular Assay for the Proliferation Signature in Mantle Cell Lymphoma Applicable to Formalin-Fixed Paraffin-Embedded Biopsies. J. Clin. Oncol. 2017, 35, 1668–1677. [Google Scholar] [CrossRef] [PubMed]
  22. Roth, R.B.; Hevezi, P.; Lee, J.; Willhite, D.; Lechner, S.M.; Foster, A.C.; Zlotnik, A. Gene expression analyses reveal molecular relationships among 20 regions of the human CNS. Neurogenetics 2006, 7, 67–80. [Google Scholar] [CrossRef] [PubMed]
  23. Heng, Y.J.; Pennell, C.E.; Chua, H.N.; Perkins, J.E.; Lye, S.J. Whole Blood Gene Expression Profile Associated with Spontaneous Preterm Birth in Women with Threatened Preterm Labor. PLoS ONE 2014, 9, e96901. [Google Scholar] [CrossRef] [PubMed]
  24. Hummel, M.; Bentink, S.; Berger, H.; Klapper, W.; Wessendorf, S.; Barth, T.F.E.; Bernd, H.-W.; Cogliatti, S.B.; Dierlamm, J.; Feller, A.C.; et al. A Biologic Definition of Burkitt’s Lymphoma from Transcriptional and Genomic Profiling. N. Engl. J. Med. 2006, 354, 2419–2430. [Google Scholar] [CrossRef] [PubMed]
  25. Recurrent mutation of the ID3 gene in Burkitt lymphoma identified by integrated genome, exome and transcriptome sequencing. Nat. Genet. 2012, 44, 1316–1320. [CrossRef] [PubMed]
  26. Scholtysik, R.; Kreuz, M.; Hummel, M.; Rosolowski, M.; Szczepanowski, M.; Klapper, W.; Loeffler, M.; Trümper, L.; Siebert, R.; Küppers, R. Characterization of genomic imbalances in diffuse large B-cell lymphoma by detailed SNP-chip analysis. Int. J. Cancer 2015, 136, 1033–1042. [Google Scholar] [CrossRef]
  27. Su, A.I.; Wiltshire, T.; Batalov, S.; Lapp, H.; Ching, K.A.; Block, D.; Zhang, J.; Soden, R.; Hayakawa, M.; Kreiman, G.; et al. A gene atlas of the mouse and human protein-encoding transcriptomes. Proc. Natl. Acad. Sci. USA 2004, 101, 6062–6067. [Google Scholar] [CrossRef] [PubMed]
  28. Baty, F.; Facompré, M.; Wiegand, J.; Schwager, J.; Brutsche, M.H. Analysis with respect to instrumental variables for the exploration of microarray data structures. BMC Bioinform. 2006, 7, 422. [Google Scholar] [CrossRef]
  29. el Affar, B.; Gay, F.; Shi, Y.; Liu, H.; Huarte, M.; Wu, S.; Collins, T.; Li, E. Essential dosage-dependent functions of the transcription factor yin yang 1 in late embryonic development and cell cycle progression. Mol. Cell. Biol. 2006, 26, 3565–3581. [Google Scholar] [CrossRef]
  30. Nabais Sá, M.J.; Gabriele, M.; Testa, G.; de Vries, B.B. Gabriele-de Vries Syndrome; University of Washington: Seattle, WA, USA, 1993. [Google Scholar]
  31. Banerjee, A.; Sindhava, V.; Vuyyuru, R.; Jha, V.; Hodewadekar, S.; Manser, T.; Atchison, M.L. YY1 Is Required for Germinal Center B Cell Development. PLoS ONE 2016, 11, e0155311. [Google Scholar] [CrossRef]
  32. Chattopadhyay, M.; Kodela, R.; Santiago, G.; Le, T.T.C.; Nath, N.; Kashfi, K. NOSH-aspirin (NBS-1120) inhibits pancreatic cancer cell growth in a xenograft mouse model: Modulation of FoxM1, p53, NF-κB, iNOS, caspase-3 and ROS. Biochem. Pharmacol. 2020, 176, 113857. [Google Scholar] [CrossRef] [PubMed]
  33. Chen, Z.S.; Chan, H.Y.E. Transcriptional dysregulation in neurodegenerative diseases: Who tipped the balance of Yin Yang 1 in the brain. Neural Regen. Res. 2019, 14, 1148–1151. [Google Scholar] [CrossRef] [PubMed]
  34. Arribas Arranz, J.; Winter, D.N.; Drexler, H.G.; Eberth, S. Suitability of Yin Yang 1 transcript and protein levels for biomarker studies in B cell non-Hodgkin lymphoma. Biomark. Res. 2018, 6, 11. [Google Scholar] [CrossRef] [PubMed]
  35. Colnaghi, R.; Connell, C.M.; Barrett, R.M.; Wheatley, S.P. Separating the anti-apoptotic and mitotic roles of survivin. J. Biol. Chem. 2006, 281, 33450–33456. [Google Scholar] [CrossRef]
  36. Galloway, N.R.; Ball, K.F.; Stiff, T.; Wall, N.R. Yin Yang 1 (YY1): Regulation of Survivin and Its Role In Invasion and Metastasis. Crit. Rev. Oncog. 2017, 22, 23–36. [Google Scholar] [CrossRef]
  37. Vega, M.I.; Baritaki, S.; Huerta-Yepez, S.; Martinez-Paniagua, M.A.; Bonavida, B. A potential mechanism of rituximab-induced inhibition of tumor growth through its sensitization to tumor necrosis factor-related apoptosis-inducing ligand-expressing host cytotoxic cells. Leuk. Lymphoma 2011, 52, 108–121. [Google Scholar] [CrossRef]
  38. Vega, M.I.; Huerta-Yepez, S.; Jazirehi, A.R.; Garban, H.; Bonavida, B. Rituximab (chimeric anti-CD20) sensitizes B-NHL cell lines to Fas-induced apoptosis. Oncogene 2005, 24, 8114–8127. [Google Scholar] [CrossRef]
  39. Potluri, V.; Noothi, S.K.; Vallabhapurapu, S.D.; Yoon, S.O.; Driscoll, J.J.; Lawrie, C.H.; Vallabhapurapu, S. Transcriptional repression of Bim by a novel YY1-RelA complex is essential for the survival and growth of Multiple Myeloma. PLoS ONE 2013, 8, e66121. [Google Scholar] [CrossRef]
  40. Chen, Y.; Jacamo, R.; Konopleva, M.; Garzon, R.; Croce, C.; Andreeff, M. CXCR4 downregulation of let-7a drives chemoresistance in acute myeloid leukemia. J. Clin. Invest. 2013, 123, 2395–2407. [Google Scholar] [CrossRef]
  41. Antonio-Andrés, G.; Rangel-Santiago, J.; Tirado-Rodríguez, B.; Martinez-Ruiz, G.U.; Klunder-Klunder, M.; Vega, M.I.; Lopez-Martinez, B.; Jiménez-Hernández, E.; Torres Nava, J.; Medina-Sanson, A.; et al. Role of Yin Yang-1 (YY1) in the transcription regulation of the multi-drug resistance. Leuk. Lymphoma 2018, 59, 2628–2638. [Google Scholar] [CrossRef]
  42. Morales-Martinez, M.; Valencia-Hipolito, A.; Vega, G.G.; Neri, N.; Nambo, M.J.; Alvarado, I.; Cuadra, I.; Duran-Padilla, M.A.; Martinez-Maza, O.; Huerta-Yepez, S.; et al. Regulation of Krüppel-Like Factor 4 (KLF4) expression through the transcription factor Yin-Yang 1 (YY1) in non-Hodgkin B-cell lymphoma. Oncotarget 2019, 10, 2173–2188. [Google Scholar] [CrossRef] [PubMed]
  43. Chen, Y.; Wang, X.; Li, W.; Zhang, H.; Zhao, C.; Li, Y.; Wang, Z.; Chen, C. Sp1 Upregulates Survivin Expression in Adenocarcinoma of Lung Cell Line A549. Anat. Rec. Adv. Integr. Anat. Evol. Biol. 2011, 294, 774–780. [Google Scholar] [CrossRef]
  44. Lee, J.S.; Galvin, K.M.; Shi, Y. Evidence for physical interaction between the zinc-finger transcription factors YY1 and Sp1. Proc. Natl. Acad. Sci. USA 1993, 90, 6145–6149. [Google Scholar] [CrossRef] [PubMed]
  45. Zhang, Y.; Chen, H.; Zhou, S.; Wang, S.; Zheng, K.; Xu, D.; Liu, Y.; Wang, X.; Wang, X.; Yan, H.; et al. Sp1 and c-Myc modulate drug resistance of leukemia stem cells by regulating survivin expression through the ERK-MSK MAPK signaling pathway. Mol. Cancer 2015, 14, 56. [Google Scholar] [CrossRef] [PubMed]
  46. Miletic, A.V.; Jellusova, J.; Cato, M.H.; Lee, C.R.; Baracho, G.V.; Conway, E.M.; Rickert, R.C. Essential Role for Survivin in the Proliferative Expansion of Progenitor and Mature B Cells. J. Immunol. 2016, 196, 2195–2204. [Google Scholar] [CrossRef]
  47. He, C.; Liu, Z.; Ji, J.; Zhu, H. Prognostic value of survivin in patients with non-Hodgkin’s lymphoma: A meta-analysis. Int. J. Clin. Exp. Med. 2015, 8, 5847–5854. [Google Scholar]
  48. Ambrosini, G.; Adida, C.; Altieri, D.C. A novel anti-apoptosis gene, survivin, expressed in cancer and lymphoma. Nat. Med. 1997, 3, 917–921. [Google Scholar] [CrossRef]
  49. Ansell, S.M.; Arendt, B.K.; Grote, D.M.; Jelinek, D.F.; Novak, A.J.; Wellik, L.E.; Remstein, E.D.; Bennett, C.F.; Fielding, A. Inhibition of survivin expression suppresses the growth of aggressive non-Hodgkin’s lymphoma. Leukemia 2004, 18, 616–623. [Google Scholar] [CrossRef]
  50. Small, S.; Keerthivasan, G.; Huang, Z.; Gurbuxani, S.; Crispino, J.D. Overexpression of survivin initiates hematologic malignancies in vivo. Leukemia 2010, 24, 1920–1926. [Google Scholar] [CrossRef]
  51. Chen, X.; Duan, N.; Zhang, C.; Zhang, W. Survivin and Tumorigenesis: Molecular Mechanisms and Therapeutic Strategies. J. Cancer 2016, 7, 314–323. [Google Scholar] [CrossRef]
  52. Li, F.; Aljahdali, I.; Ling, X. Cancer therapeutics using survivin BIRC5 as a target: What can we do after over two decades of study? J. Exp. Clin. Cancer Res. 2019, 38, 368. [Google Scholar] [CrossRef] [PubMed]
  53. Gu, C.M.; Zhu, Y.K.; Ma, Y.H.; Zhang, M.E.N.G.; Liao, B.; Wu, H.Y.; Lin, H.L. Knockdown of Survivin Gene by Vector-Based Short Hairpin RNA Technique Induces Apoptosis and Growth Inhibition in Burkitt’s Lymphoma Raji Cell Line. Neoplasma 2006, 53, 206–212. [Google Scholar] [PubMed]
  54. Galloway, N.R.; Diaz Osterman, C.J.; Reiber, K.; Jutzy, J.M.; Li, F.; Sui, G.; Soto, U.; Wall, N.R. Yin Yang 1 regulates the transcriptional repression of Survivin. Biochem. Biophys. Res. Commun. 2014, 445, 208–213. [Google Scholar] [CrossRef] [PubMed]
  55. Zhang, N.; Li, X.; Wu, C.W.; Dong, Y.; Cai, M.; Mok, M.T.S.; Wang, H.; Chen, J.; Ng, S.S.M.; Chen, M.; et al. microRNA-7 is a novel inhibitor of YY1 contributing to colorectal tumorigenesis. Oncogene 2013, 32, 5078–5088. [Google Scholar] [CrossRef] [PubMed]
  56. Zhang, Q.; Stovall, D.B.; Inoue, K.; Sui, G. The oncogenic role of Yin Yang 1. Crit. Rev. Oncog. 2011, 16, 163–197. [Google Scholar] [CrossRef] [PubMed]
  57. Chan, K.-S.; Wong, C.-H.; Huang, Y.-F.; Li, H.-Y. Survivin withdrawal by nuclear export failure as a physiological switch to commit cells to apoptosis. Cell Death Dis. 2010, 1, e57. [Google Scholar] [CrossRef] [PubMed]
  58. Connell, C.M.; Colnaghi, R.; Wheatley, S.P. Nuclear Survivin Has Reduced Stability and Is Not Cytoprotective. J. Biol. Chem. 2008, 283, 3289–3296. [Google Scholar] [CrossRef]
  59. Cunningham, F.; Achuthan, P.; Akanni, W.; Allen, J.; Amode, M.R.; Armean, I.M.; Bennett, R.; Bhai, J.; Billis, K.; Boddu, S.; et al. Ensembl 2019. Nucleic Acids Res. 2019, 47, D745–D751. [Google Scholar] [CrossRef]
  60. Fornes, O.; Castro-Mondragon, J.A.; Khan, A.; van der Lee, R.; Zhang, X.; Richmond, P.A.; Modi, B.P.; Correard, S.; Gheorghe, M.; Baranašić, D.; et al. JASPAR 2020: Update of the open-access database of transcription factor binding profiles. Nucleic Acids Res. 2020, 48, D87–D92. [Google Scholar] [CrossRef]
  61. Bailey, M.H.; Tokheim, C.; Porta-Pardo, E.; Sengupta, S.; Bertrand, D.; Weerasinghe, A.; Colaprico, A.; Wendl, M.C.; Kim, J.; Reardon, B.; et al. Comprehensive Characterization of Cancer Driver Genes and Mutations. Cell 2018, 173, 371–385. [Google Scholar] [CrossRef]
  62. Davis, C.A.; Hitz, B.C.; Sloan, C.A.; Chan, E.T.; Davidson, J.M.; Gabdank, I.; Hilton, J.A.; Jain, K.; Baymuradov, U.K.; Narayanan, A.K.; et al. The Encyclopedia of DNA elements (ENCODE): Data portal update. Nucleic Acids Res. 2018, 46, D794–D801. [Google Scholar] [CrossRef] [PubMed]
  63. Kent, W.J.; Sugnet, C.W.; Furey, T.S.; Roskin, K.M.; Pringle, T.H.; Zahler, A.M.; Haussler, A.D. The Human Genome Browser at UCSC. Genome Res. 2002, 12, 996–1006. [Google Scholar] [CrossRef] [PubMed]
  64. Koster, J. R2: Genomics Analysis and Visualization Platform. Available online: http://r2.amc.nl (accessed on 30 June 2020).
  65. Onder, T.T.; Kara, N.; Cherry, A.; Sinha, A.U.; Zhu, N.; Bernt, K.M.; Cahan, P.; Marcarci, B.O.; Unternaehrer, J.; Gupta, P.B.; et al. Chromatin-modifying enzymes as modulators of reprogramming. Nature 2012, 483, 598–602. [Google Scholar] [CrossRef] [PubMed]
  66. Maestro, R.; Dei Tos, A.P.; Hamamori, Y.; Krasnokutsky, S.; Sartorelli, V.; Kedes, L.; Doglioni, C.; Beach, D.H.; Hannon, G.J. Twist is a potential oncogene that inhibits apoptosis. Genes Dev. 1999, 13, 2207–2217. [Google Scholar] [CrossRef]
  67. Seger, Y.R.; García-Cao, M.; Piccinin, S.; Cunsolo, C.L.; Doglioni, C.; Blasco, M.A.; Hannon, G.J.; Maestro, R. Transformation of normal human cells in the absence of telomerase activation. Cancer Cell 2002, 2, 401–413. [Google Scholar] [CrossRef]
  68. Hannon, G.J.; Sun, P.; Carnero, A.; Xie, L.Y.; Maestro, R.; Conklin, D.S.; Beach, D. MaRX: An approach to genetics in mammalian cells. Science 1999, 283, 1129–1130. [Google Scholar] [CrossRef]
  69. Ye, J.; Coulouris, G.; Zaretskaya, I.; Cutcutache, I.; Rozen, S.; Madden, T.L. Primer-BLAST: A tool to design target-specific primers for polymerase chain reaction. BMC Bioinform. 2012, 13, 134. [Google Scholar] [CrossRef]
Figure 1. YY1 Transcription Factor ChIP-seq binding-peaks within BIRC5 promoter, according to public results available in ENCODE. (A). Black and grey boxes identify peaks of YY1 occupancy within the BIRC5 promoter (from −2000 to +1000 bp around the TSS). The length of each box indicates the region of binding within the promoter, while the gray-scale of the boxes is proportional to the strength of the binding of YY1 transcription factor to BIRC5 promoter. (B). Bar plot summarizing the binding strength of YY1 binding to BIRC5 promoter found in each positive experiment (signal strength score ranges from 0 to 1000). T = tumor samples (green); N = normal samples (grey).
Ijms 21 06446 g001
Figure 2. R2 analysis of YY1 and BIRC5 expression levels in B-NHL patients vs. healthy controls. Comparisons have been performed between datasets generated with same array and same normalization method (MAS5.0). (A). YY1 relative expression levels are significantly higher in nine different B-NHL patients GEO datasets (T, tumor) compared to each of three different normal samples GEO datasets (N, Normal; u133p2 array); (B). YY1 relative expression levels are significantly higher in three different B-NHL patients GEO datasets (T) compared to each of two different normal samples GEO datasets (N; u133a array); (C). BIRC5 relative expression levels are significantly higher in nine different B-NHL patients GEO datasets (T) compared to each of three different normal samples GEO datasets (N; u133p2 array); (D). BIRC5 relative expression levels are significantly higher in three different B-NHL patients GEO datasets (T) compared to each of two different normal samples GEO datasets (N; u133a array). The relative gene expression levels are expressed as log2 (base 2 logarithmic values). The number of samples per each dataset is indicated along with the GSE dataset ID. The results are presented as Median ± SD. One-way ANOVA with Tukey’s post-hoc test analysis has been performed (**** p < 0.0001).
Ijms 21 06446 g002
Figure 3. Correlation between YY1 and BIRC5 expression and relative YY1 and BIRC5 expression levels in different B-NHL subgroups, within 4 different B-NHL GEO Datasets. (A). GSE26673, Burkitt’s Lymphoma (BL), Pearson and Spearman correlation between YY1 and BIRC5 expression, patients stratified according to age (children, green; adult, blue). (B). GSE26673, dot plots of YY1 (left) and BIRC5 (right) expression with patients stratified by age (children, green; adult, blue). (C). GSE4475, B-NHL patients stratified based on molecular BL features (MBL green, intermediate-MBL blue, non-MBL red), Pearson and Spearman correlation between YY1 and BIRC5 expression. (D). GSE4475, dot plots of YY1 (left) and BIRC5 (right) expression with patients stratified based on molecular BL features (MBL green, intermediate-MBL blue, non-MBL red). (E). GSE10172, B-NHL patients stratified based on cancer type (BL green, BL-like blue, aggressive-B-NHL red, DLBCL purple, FL orange), Pearson and Spearman correlation between YY1 and BIRC5 expression. (F). GSE10172, dot plots of YY1 (left) and BIRC5 (right) expression with patients based on cancer type (BL green, BL-like blue, aggressive-B-NHL red, DLBCL purple, FL orange). (G). GSE132929, B-NHL patients stratified based on cancer type (BL green, HG-B-NHL blue, DLBCL red, FL purple, MCL orange, MZL grey), Pearson and Spearman correlation between YY1 and BIRC5 expression. (H). GSE132929, dot plots of YY1 (left) and BIRC5 (right) expression with patients based on cancer type (BL green, HG-B-NHL blue, DLBCL red, FL purple, MCL orange, MZL grey). Data in B, D, F, H are presented as dotted plots with Median ± SD. Significance was evaluated using one-way ANOVA with Tukey’s post-hoc comparison test (* p < 0.05; ** p < 0.01; *** p < 0.001; **** p < 0.0001; ns, not significant).
Ijms 21 06446 g003aIjms 21 06446 g003b
Figure 4. Fisher’s exact test and receiver operating characteristics (ROC) analysis of relevant B-NHL GEO datasets. (A). Hummel (GSE4475) GEO dataset Fisher’s exact test for YY1 and BIRC5 in MBL and non-MBL subgroups. (B). Hummel (GSE4475) GEO dataset ROC analysis of YY1 (blue) and BIRC5 (red). (C). Siebert (GSE10172) GEO dataset Fisher’s exact test for YY1 and BIRC5 in BL and non-BL subgroups. (D). Siebert (GSE10172) GEO dataset ROC analysis of YY1 (blue) and BIRC5 (red). (E). Green (GSE132929) GEO dataset Fisher’s exact test for YY1 and BIRC5 in aggressive and indolent B-NHL subgroups. (F). Green (GSE132929) GEO dataset ROC analysis of YY1 (blue) and BIRC5 (red). The significance in each analysis is presented with asterisks, with * p < 0.05; ** p < 0.01; *** p < 0.001; **** p < 0.0001.
Ijms 21 06446 g004
Figure 5. (A). MTT-based growth curve of the CTRL, KD-01 and KD-02 Raji cells (OD at 620 nm in function of the days in culture). (B). Doubling times of the CTRL, KD-01 and KD-02 Raji cells. (C). Viable vs. dead count of Raji CTRL, KD-01 and KD-02, after 96 h in culture (Trypan Blue exclusion method). (D). Quantitative-RT-PCR study of YY1 expression and potential transcriptional YY1-target genes in CTRL, KD-01 and KD-02 Raji cells. Each Ct is normalized for the relative Ct of GAPDH (housekeeping control) and then plotted values are expressed as fold change, 2−ddCt, compared to CTRL. (E). Western blot of CTRL, KD-01 and KD-02 Raji cells for YY1 (60 KDa), survivin (17 KDa), and β-Actin (42 KDa, normalization control). (F). Western blot densitometry analysis for YY1. (G). Western blot densitometry analysis for survivin. For each sample, the protein signal is normalized to the relative β-Actin signal, and then each value is expressed as percentage compared to CTRL, considered 100%. The results in A, B, C, D, F, G are presented as Mean ± SD; one-way ANOVA with Tukey’s post-hoc test have been performed (* p < 0.05; ** p < 0.001; *** p < 0.001; **** p < 0.0001; ns, not significant).
Ijms 21 06446 g005aIjms 21 06446 g005b
Figure 6. (A). Doxorubicin concentration-response treatment in Raji CTRL and KD-02 (knock-down for YY1). (B). Viability of Raji CTRL and KD-02 at Doxorubicin 10, 40 and 160 nM (doses around the CTRL and KD-02 IC50s). (C). Vincristine concentration-response treatment in Raji CTRL and KD-02. (D). Viability of Raji CTRL and KD-02 at vincristine 1.2, 3.7 and 11 nM (doses around the CTRL and KD-02 IC50s). (E). Western blot analysis of Raji cells non-silenced (CTRL) and silenced for YY1 (KD-02), treated with 30 nM doxorubicin, from 0 to 72 h. The signals are detected for YY1 protein (band at 60 KDa), total PARP (t-PARP) and cleaved PARP (c-PARP) proteins (bands respectively at 89 and 116 KDa), cleaved Caspase 3 (c-Casp-3) protein (two bands at 17 and 19 KDa) and β-Actin protein (used as normalization control, band at 42 KDa). (F). Densitometry analysis for c-PARP and c-Casp-3 from the immunoblot reported in A; the data are expressed as fold change of the normalized signals, referred to the 0 h CTRL value. (G). Western blot analysis of Raji cells non-silenced (CTRL) and silenced for YY1 (KD-02), treated with 3 nM vincristine, from 0 to 72 h. The signals are detected for YY1, t-PARP and c-PARP, c-Casp-3 and β-Actin proteins. (H). Densitometry analysis for c-PARP and c-Casp-3 from the immunoblot reported in C, data expressed as fold change of the normalized signals, referred to the 0 h CTRL value. The results are presented as Mean ± SD, In A and C, the comparison between IC50s obtained in CTRL vs. KD-02 cells was performed using the two-tailed unpaired t-test (*** p < 0.001); in B, D, F, H the comparison between values obtained in CTRL vs. KD-02 cells was performed using the two-tailed unpaired t-test with Holm-Sidak correction for multiple comparisons (* p < 0.05; ** p < 0.01; *** p < 0.001; **** p < 0.0001).
Ijms 21 06446 g006aIjms 21 06446 g006b
Figure 7. (A). Western blot analysis of Raji cells non-silenced (CTRL) and silenced for YY1 (KD-02), treated with 30 nM doxorubicin, from 0 to 72 h. Signal detected for YY1 protein (band at 60 KDa), survivin (band at 17 KDa) and β-actin protein (used as normalization control, band at 42KDa). (B). Densitometry analysis for YY1 and survivin from the immunoblot reported in A, data expressed as fold change of the normalized signals, referred to the 0 h CTRL value. (C). Western blot analysis of Raji cells non-silenced (CTRL) and silenced for YY1 (KD-02), treated with 3 nM vincristine, from 0 to 72 h. Signals detected for YY1, survivin and β-actin proteins. (D). Densitometry analysis for YY1 and survivin from the immunoblot reported in C, data expressed as fold change of the normalized signals, referred to the 0 h CTRL value. The results reported in B and D are presented as Mean ± SD and the comparison between the values obtained in CTRL vs. KD-02 protein samples was performed using the two-tailed unpaired t-test with Holm-Sidak correction for multiple comparisons (* p < 0.05; ** p < 0.01; *** p < 0.001).
Ijms 21 06446 g007
Table 1. JASPAR analysis results for YY1 binding sites located within the promoter of BIRC5 gene (Sequence ID: GRCh38:17:78212186:78226236:1).
Relative ScoreStartEndStrandPredicted Sequence
0.845770781+AAACATGGTGAA
0.845155166CACCATGGCCTC
0.80724912502+GCAGATGGCCGA
0.80428192830+TAAGATGCCTGA
0.80410021013+AAGAATGGGGGC
Table 2. Features of the GEO Datasets (Data normalization used: MAS5.0).
GEO IDMethodSamples TypeSamplesContributorReference
GSE26673u133p2T-BL16Piccaluga PP[15]
GSE132929u133p2T-B-NHL (BL-59; DLBCL-95; FL-65; HGBCL-4; MCL-43; MZL-23)290Green MRna
GSE10846u133p2T-DLBCL420Xiao W[16]
GSE56315u133p2T-DLBCL122Boedker JS[17]
GSE87371u133p2T-DLBCL223Jardin F[18]
GSE81183u133p2T-FL42McKeithan TW[19]
GSE93261u133p2T-FL149Salles G[20]
GSE16024u133p2T-B-NHL (7-MCL; 7-FL)14Du MQna
GSE93291u133p2T-MCL122Staudt LM[21]
GSE7307u133p2N-Various tissues504Roth RBna
GSE3526u133p2N-Various tissues353Roth RB[22]
GSE46510u133p2N-PBC154Lye SJ[23]
GSE4475u133aT-BL215Hummel M[24]
GSE10172u133aT-Pediatric ma-B-NHL (8-BL; 5- BL like; 14-DLBCL; 2-FL; 7-AU B-NHL)36Siebert R[25]
GSE57611u133aT-DLBCL148Kreuz M[26]
GSE1133u133aN-Various tissues158Su AI[27]
GSE3846u133aN-PBC108Baty F[28]
Abbreviations: u133p2, Affymetrix HU133 plus 2.0 microarray; u133a, Affymetrix HU133a microarray; T, Tumor; N, Normal; BL, Burkitt’s Lymphoma; B-NHL, B-cells non-Hodgkin’s Lymphoma; DLBCL, Diffused Large B-cells Lymphoma; FL, Follicular Lymphoma; HGBCL, High-grade B-cell Lymphoma; MCL, Mantle Cells Lymphoma; MZL, Marginal Zone Lymphoma; PBC, Peripheral Blood Cells; maB-NHL, Mature Aggressive B-NHL; AU, Aggressive Unclassified; na, not associated.
Table 3. YY1 and BIRC5 Normality test, Pearson and Spearman correlation (R-Value) results.
GEO IDAnalyzed SamplesYY1 Normality TestBIRC5 Normality TestPearson RPearson PSpearman RSpearman P
GSE932611490.3874 (Y)0.0013 (N)0.26580.0011 (**)0.25230.0019 (**)
GSE81183420.0001 (N)0.4082 (Y)0.42930.0046 (**)0.39480.0097 (**)
GSE16024140.0049 (N)0.0042 (N)0.78820.0008 (***)0.54130.0481 (*)
GSE932911220.0843 (Y)0.0001 (N)0.3638<0.0001 (****)0.3926<0.0001 (****)
GSE873712230.3301 (Y)0.2087 (Y)0.572<0.0001 (****)0.5937<0.0001 (****)
GSE576111160.2843 (Y)0.8101 (Y)0.23790.0101 (*)0.2260.0147 (*)
GSE56315890.2221 (Y)0.3798 (Y)0.4523<0.0001 (****)0.4365<0.0001 (****)
GSE108464140.7196 (Y)0.0414 (N)0.5321<0.0001 (****)0.5524<0.0001 (****)
GSE26673160.4792 (Y)0.4778 (Y)0.77470.0004 (***)0.74910.0012 (**)
GSE44752150.0001 (N)0.3127 (Y)0.22040.0011 (**)0.2781<0.0001 (****)
GSE10172360.3155 (Y)0.9022 (Y)0.4980.002 (**)0.6044<0.0001 (****)
GSE1329292900.0001 (N)0.0001 (N)0.6306<0.0001 (****)0.5355<0.0001 (****)
Abbreviations: Y, Yes; N, No. * p < 0.05; ** p < 0.01; *** p < 0.001; **** p < 0.0001.
Table 4. Primers used for RT-PCR analyses of genes regulators within the apoptotic pathway.
GENE IDPrimer FPrimer Rbp
BCL2TGAACTGGGGGAGGATTGTGCGTACAGTTCCACAAAGGCA183
BCL2L1 02AGCTTTGAACAGGATACTTTTGTGGGGTGGGAGGGTAGAGTGGAT183
BCL2L1 01CTGTGCGTGGAAAGCGTAGAGCTGCTGCATTGTTCCCATAG155
BCL2L2CACCCAGGTCTCCGATGAACGCTGTGAACTCCGCCCAG210
BCL2L3TTTTCAGCGACGGCGTAACACAAACCCATCCCAGCCTCTTT189
BCL2L4CCCCGAGAGGTCTTTTTCCGTGGTTCTGATCAGTTCCGGC145
BCL2L7GATCCCGGCAGGCTGATCCGTAGCTGCGGAAAACCTCCT156
BCL2L8CTTTAAGAAGGGACTTCCTCGCGTGGAGTTTCGGGATGTGGA163
BCL2L15ACCTGGTGTGCTCAGGATTCTCCAGATTTTCCCAACCTCCC194
BIRC1TCAAGCCGTCCCATTTGTTGTGCTGACACTGCTGGATGAT204
BIRC2AAGTGGTTTCCAAGGTGTGAGTAAGCCCATTTCCAAGGCAGATT230
BIRC3TCTGGGCAGCAGGTTTACAAGCATTCTTTGGATAGTAAAACACCA191
BIRC4TGTCCTGGCGCGAAAAGGTCGTGCCAGTGTTGATGCTGA190
BIRC5CAAGGACCACCGCATCTCTATGTTCCTCTATGGGGTCGTCA189
BIRC7GGCTCTGAGGAGTTGCGTCTCTGATGGCCTGTGTGGAAGAAG105
BIKCCGCCAGAGGAGAAATGTCTGATCCTCCATAGGGTCCAGGTC145
TP53CCCCTCCTCAGCATCTTATCCGTACAGTCAGAGCCAACCTCAG124
YY1GAGAGAACTCACCTCCTGATGGCTTCTCTCCAGTATGAAC325
GAPDHAGAAGGCTGGGGCTCATTTGAGGGGCCATCCACAGTCTTC258

