Stearoyl-CoA Desaturase 1 Activity Determines the Maintenance of DNMT1-Mediated DNA Methylation Patterns in Pancreatic β-Cells

 , and
, and 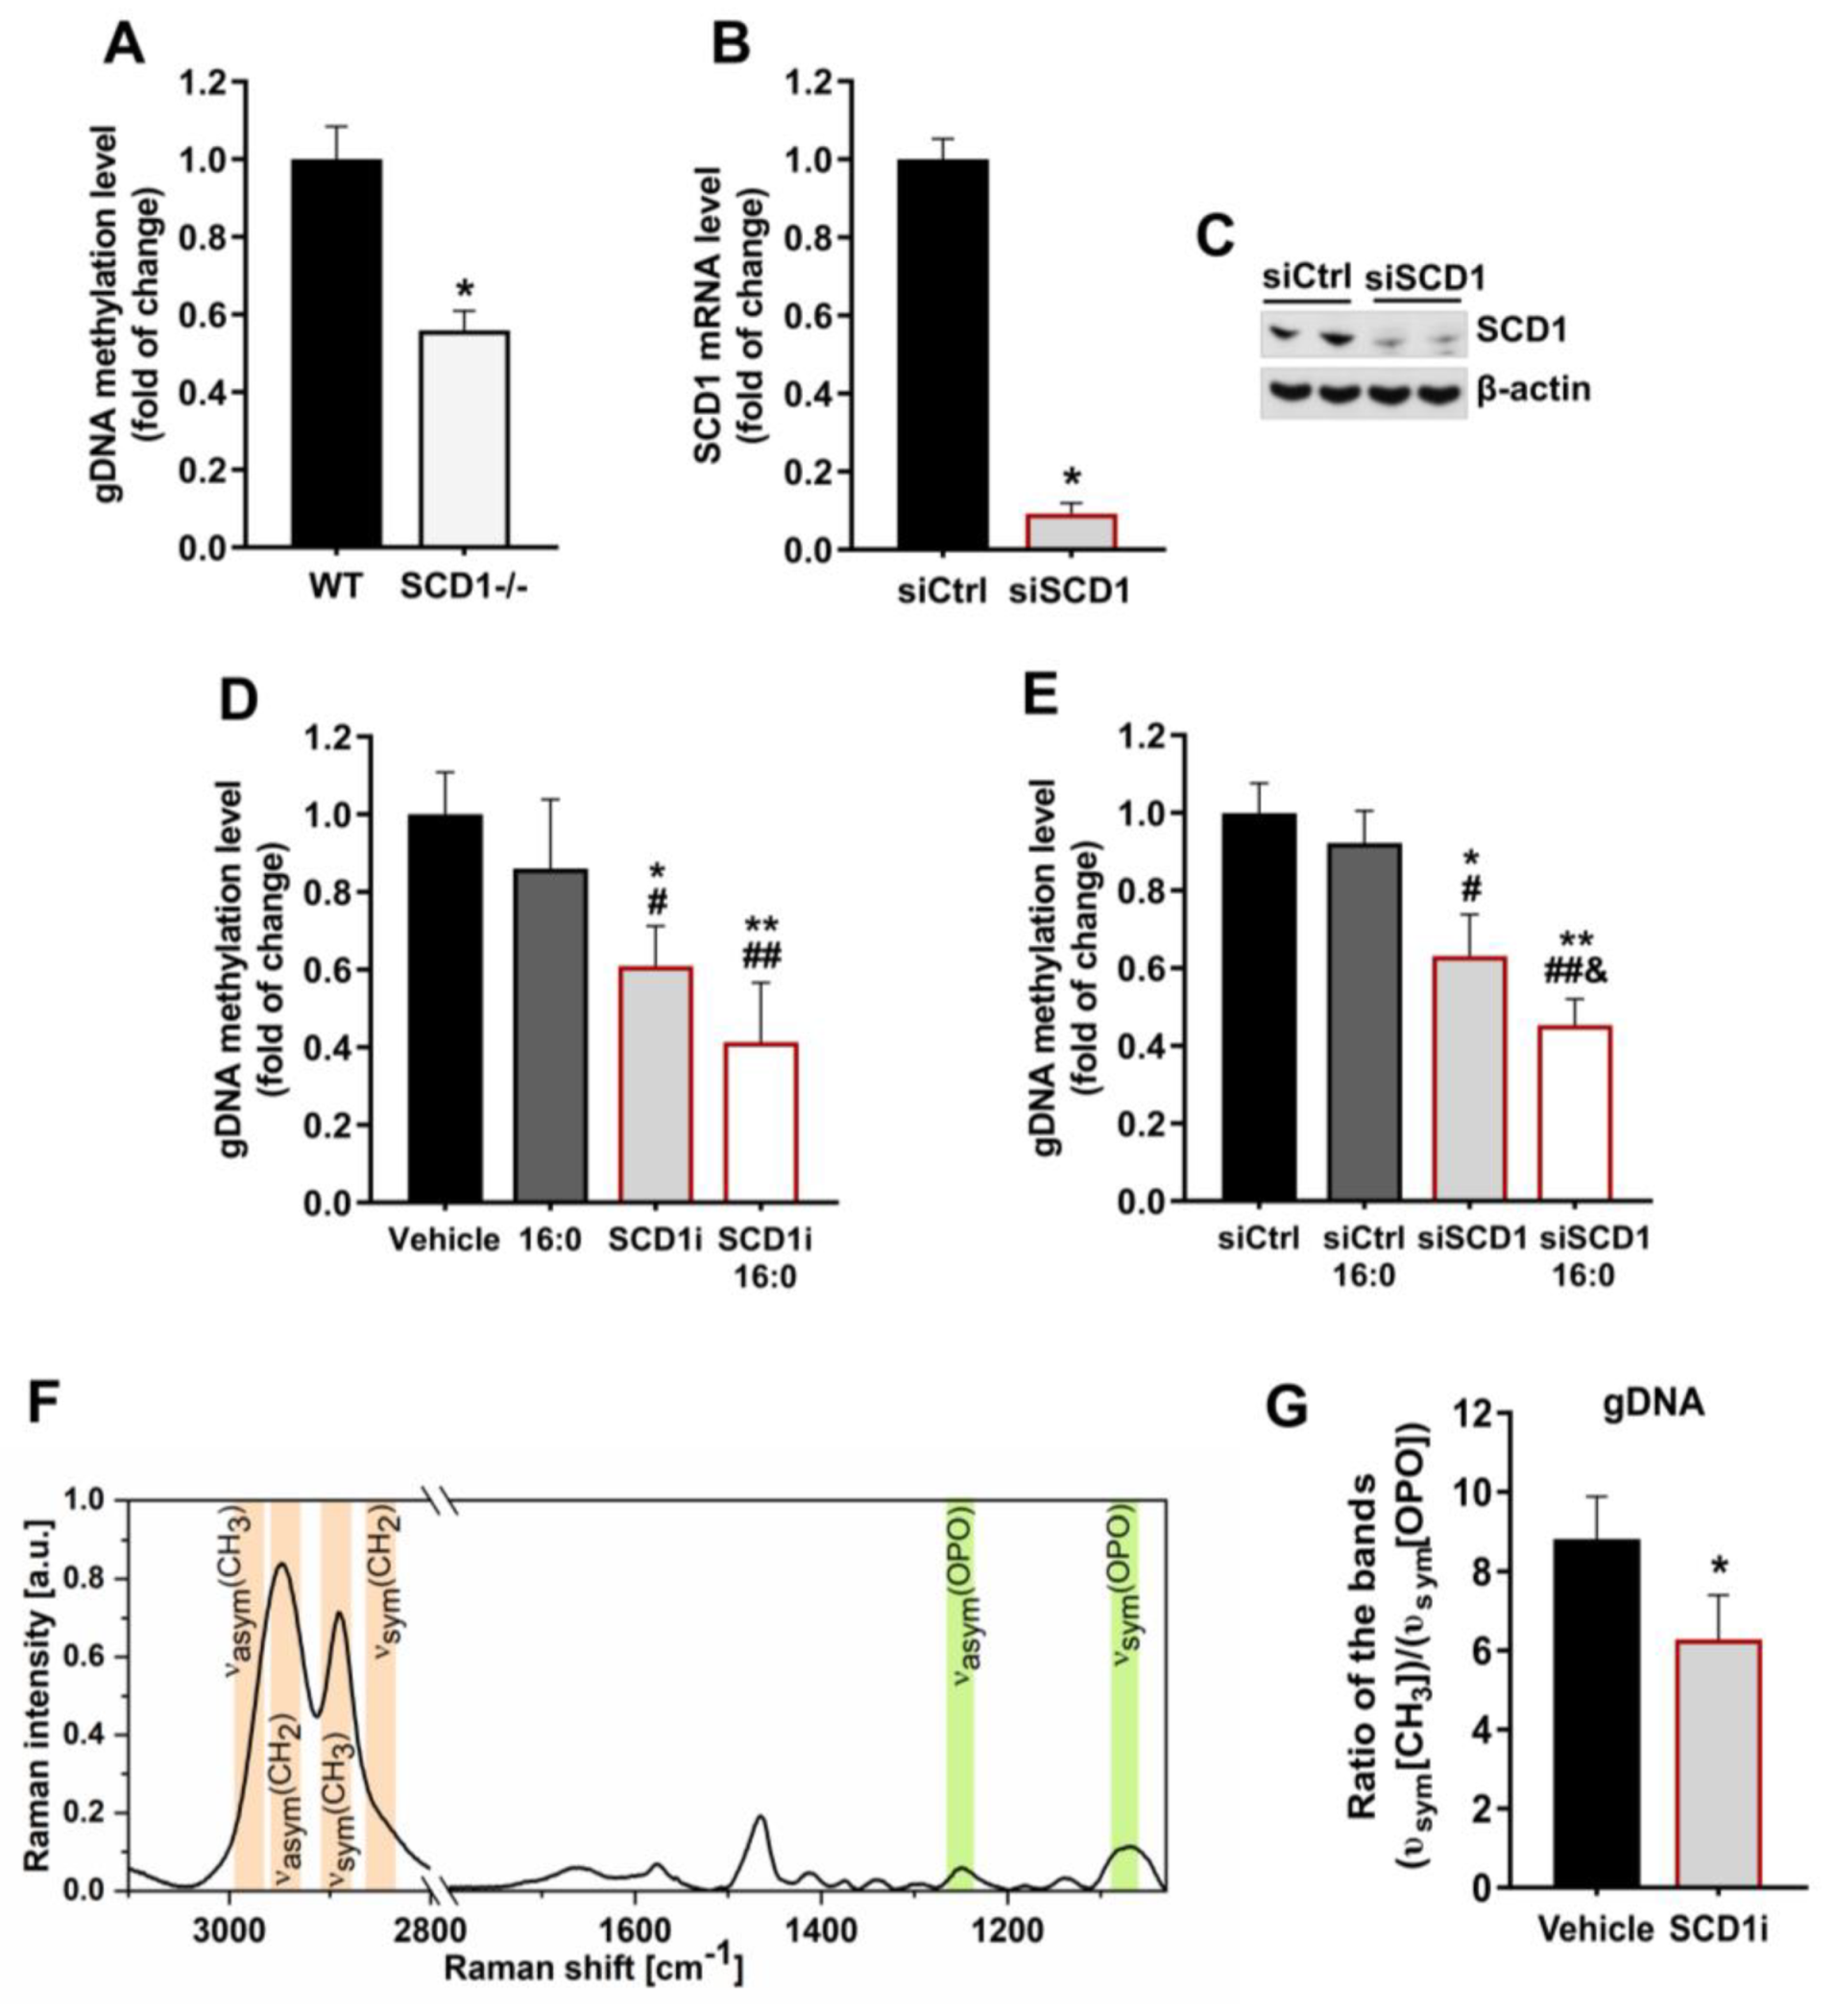
Abstract
:1. Introduction
2. Results
2.1. SCD1 Deficiency Is Associated with a Decrease in gDNA Methylation Levels in Pancreatic β-Cells
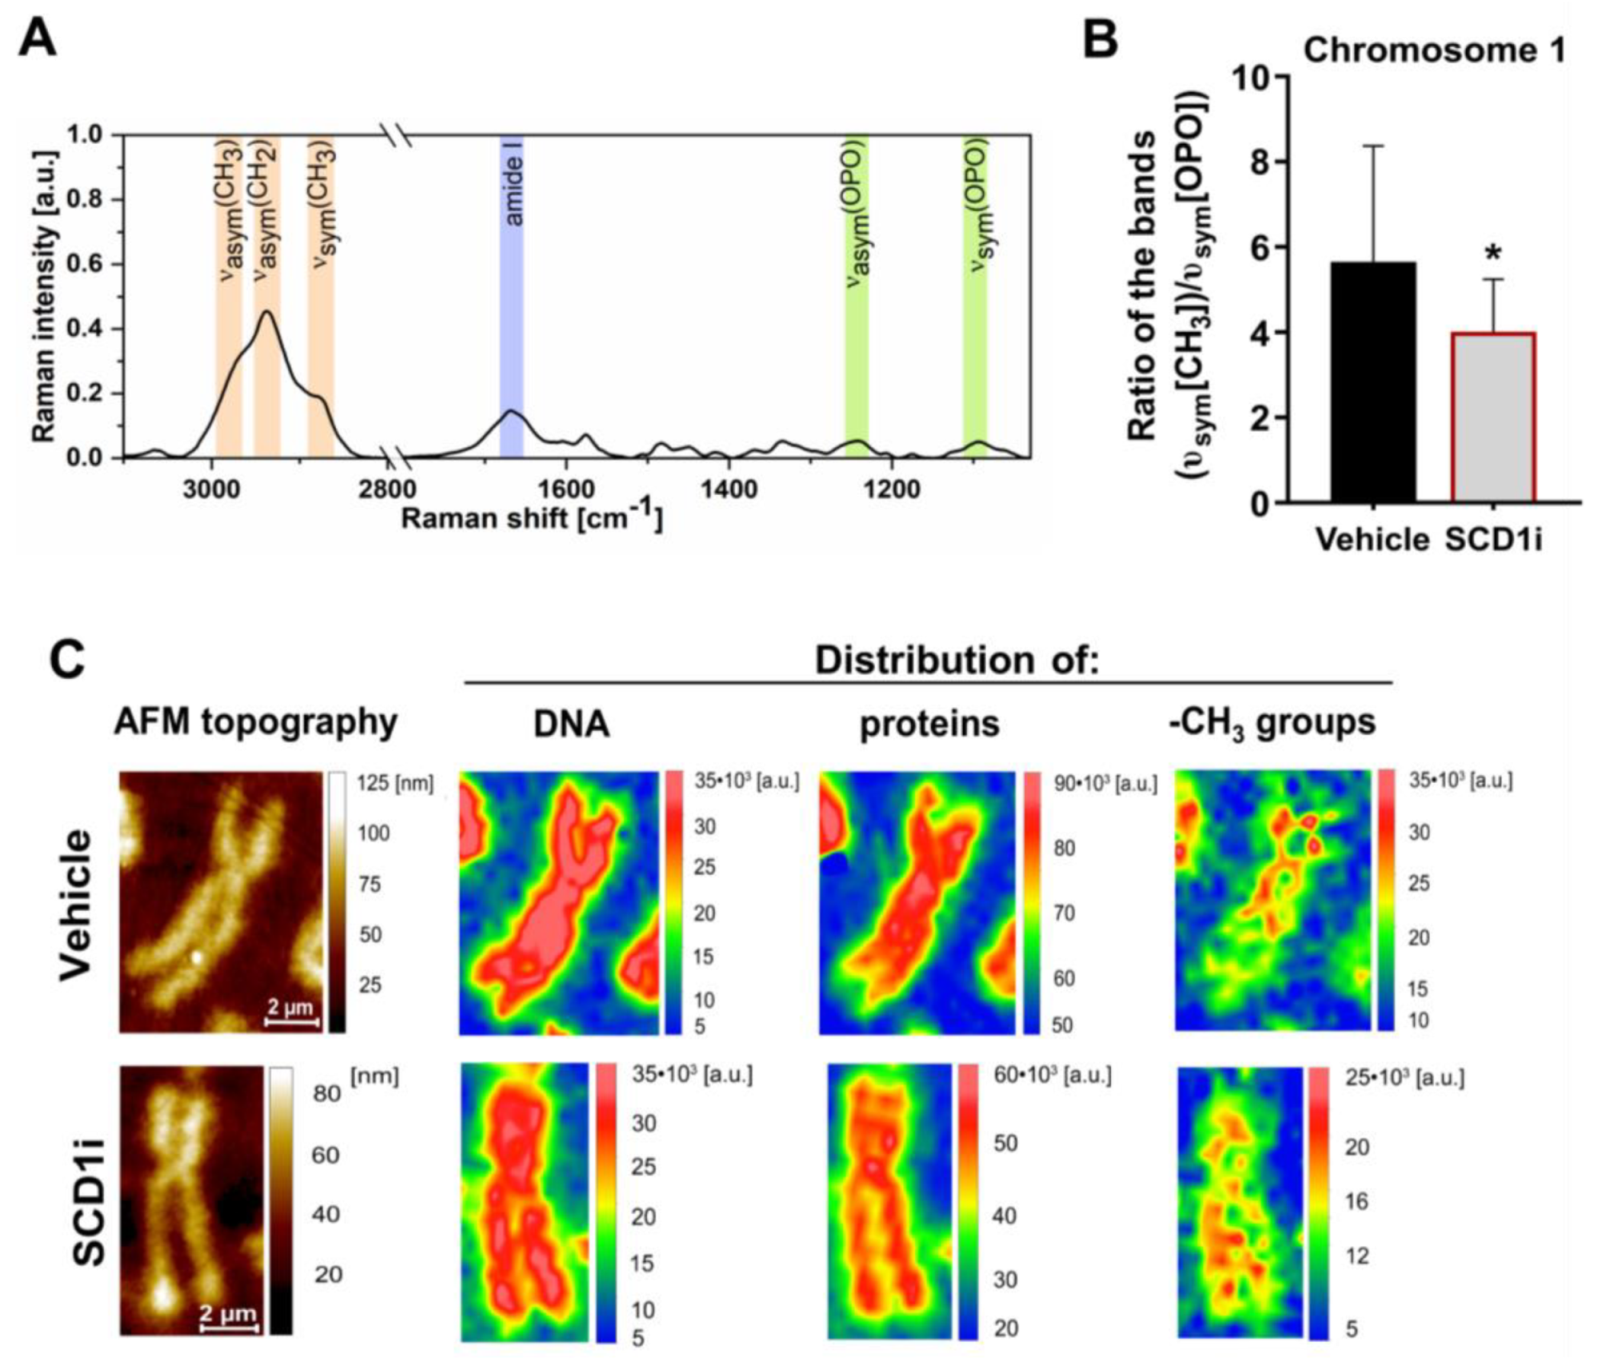
2.2. Inhibition of SCD1 Activity Leads to Changes in Methyl Group Distribution within Chromosomes in Pancreatic β-Cells
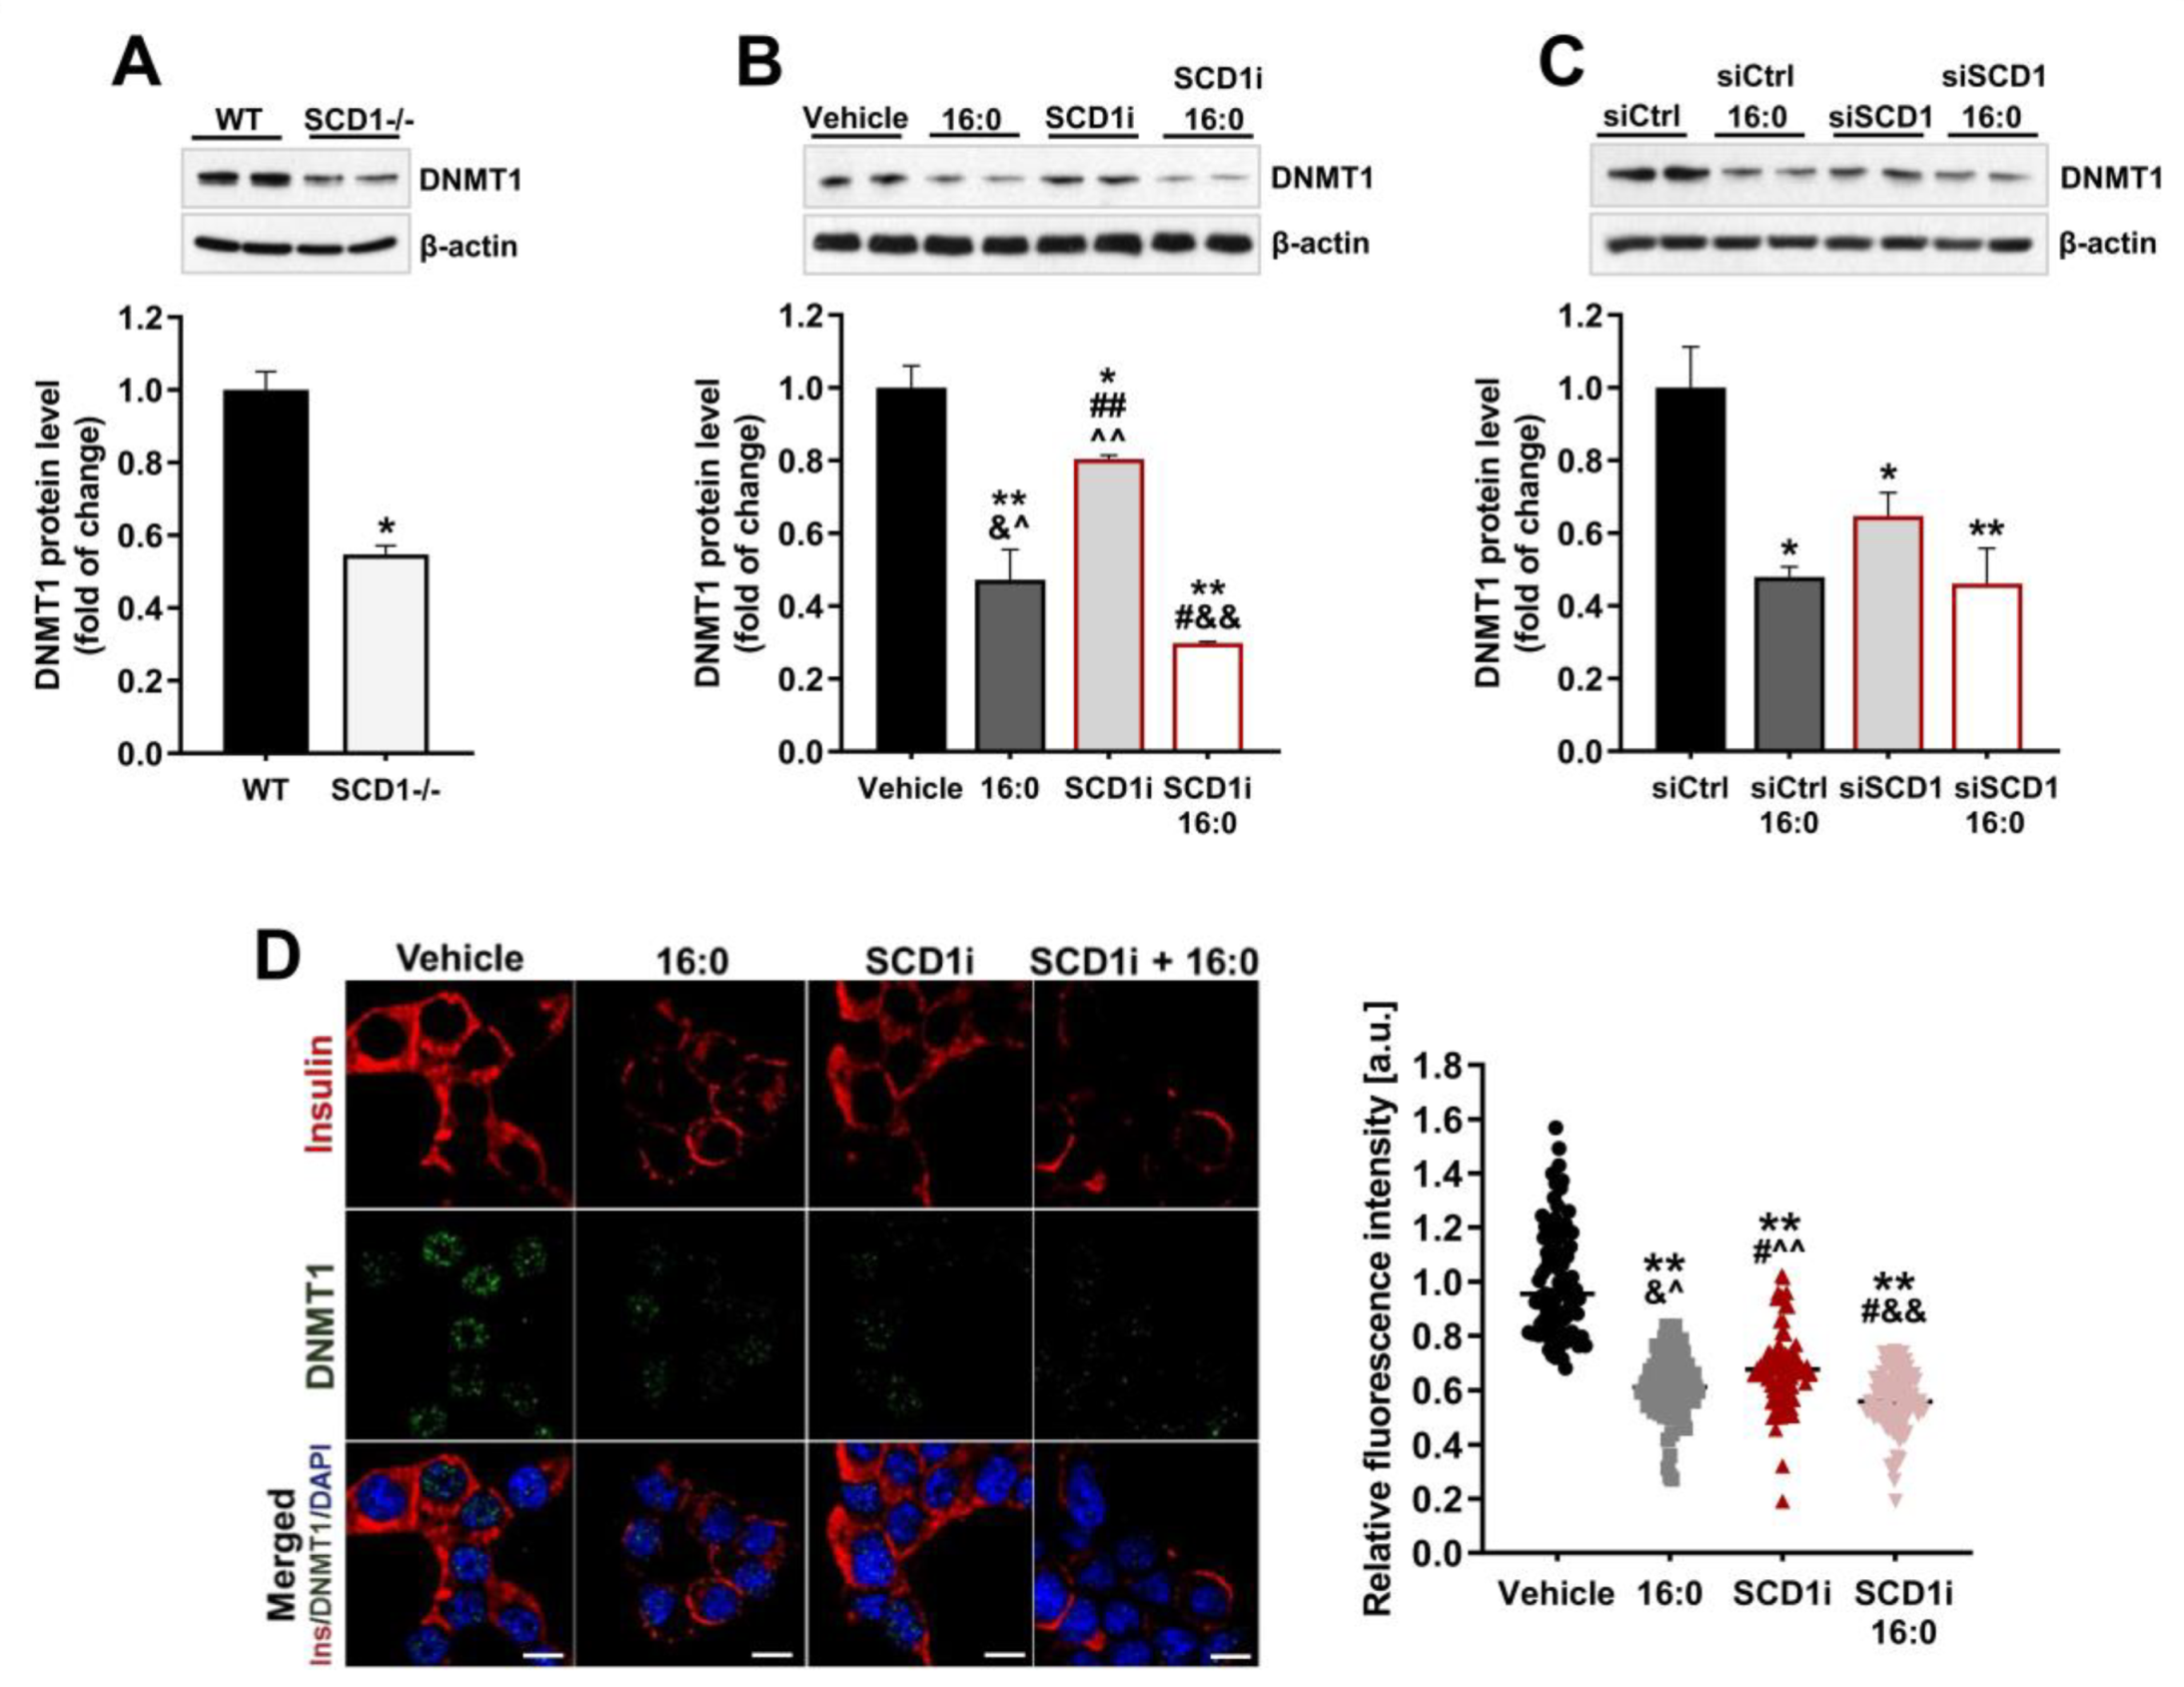
2.3. Ablation of SCD1 Activity and Expression Decreases DNMT1 Protein Levels in Pancreatic β-Cells
2.4. Reduction in SCD1 Activity/Expression Leads to the Activation of AMPK and Increases SIRT1 Protein Expression in Pancreatic β-Cells
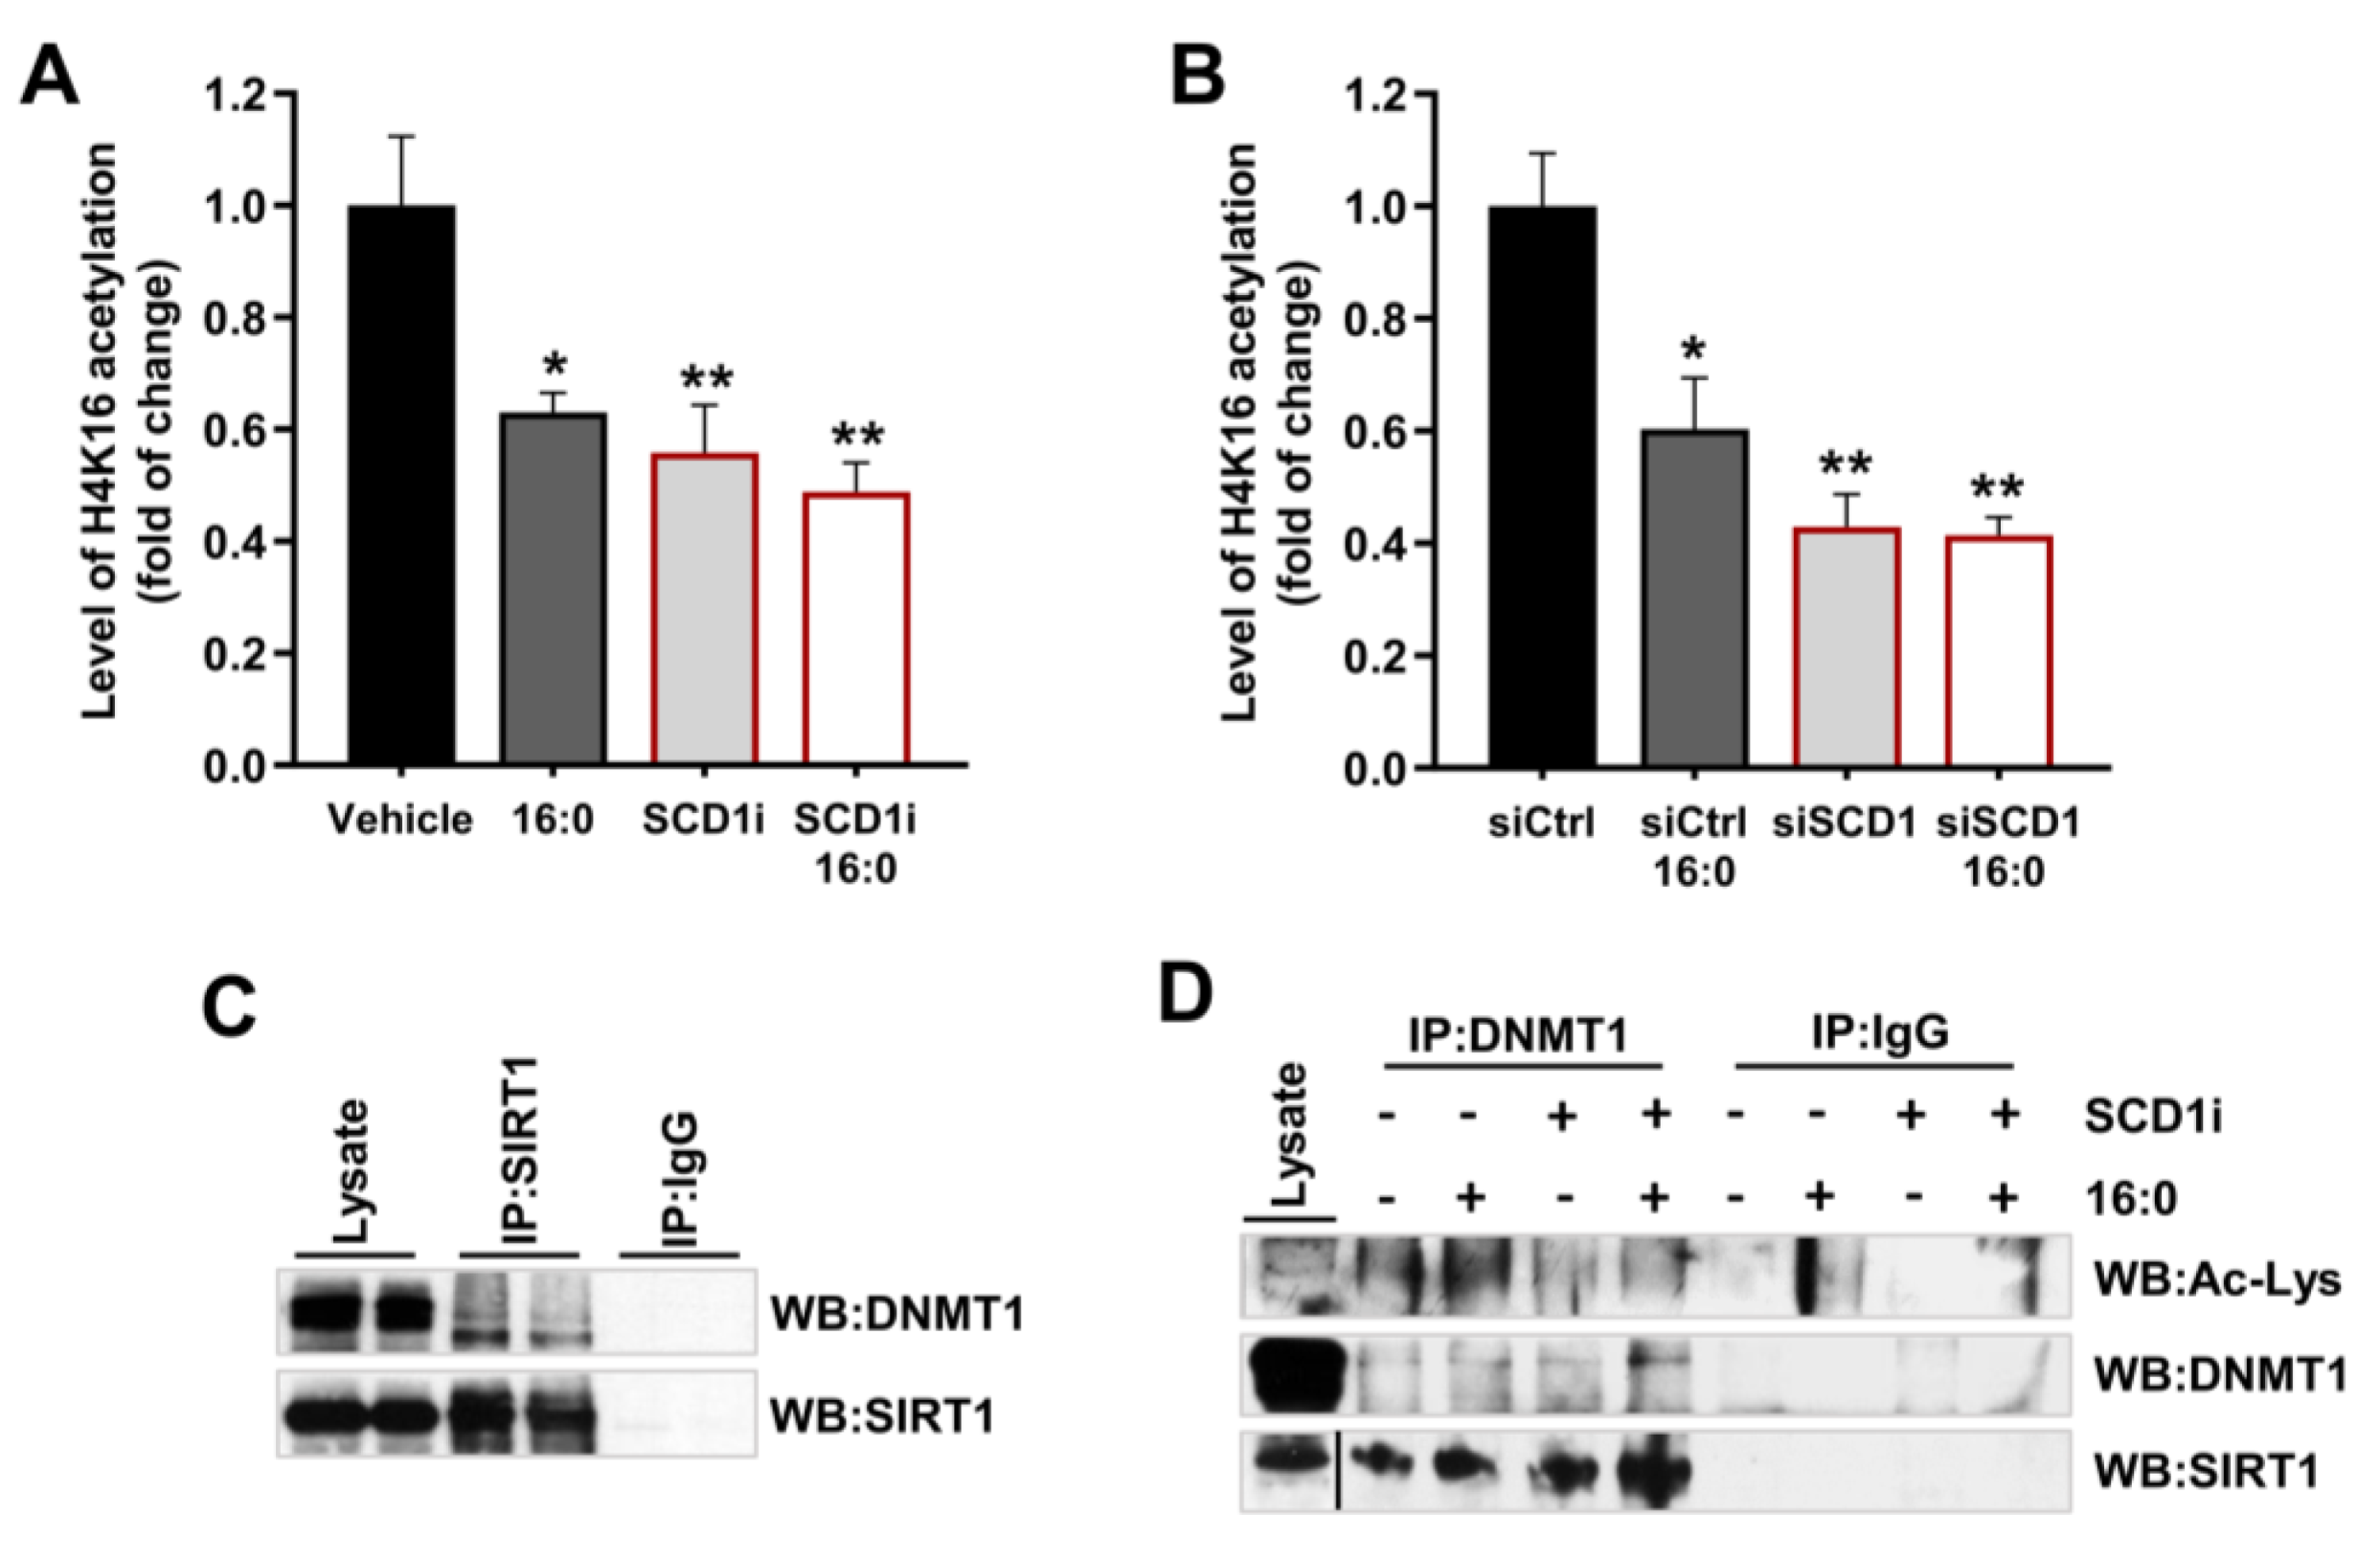
2.5. SCD1 Inhibition/Downregulation Is Related to an Increase in the Deacetylation of DNMT1 by SIRT1
2.6. Inhibition of AMPK Upregulates DNMT1 in β-Cells and Partially Restores the Level of gDNA Methylation under Conditions of SCD1 Depletion
3. Discussion
4. Materials and Methods
4.1. Animals and Pancreatic Islet Isolation
4.2. Materials
4.3. INS-1E Cell Culture and Chronic Treatments
4.4. DNA Extraction and Global DNA Methylation Assessment
4.5. Isolation of Metaphase Chromosomes
4.6. Raman Spectroscopic Measurements of Chromosomes and DNA Methylation
4.7. INS-1E Immunostaining
4.8. Co-Immunoprecipitation Assay
4.9. Quantification of Global Acetylation of Histone H4K16
4.10. Gene Expression Analysis
4.11. Western Blot Analysis
4.12. Statistical Analysis
Author Contributions
Funding
Acknowledgments
Conflicts of Interest
Abbreviations
| AFM | Atomic force microscopy |
| AMPK | AMP-activated protein kinase |
| DNMT1 | DNA methyltransferase 1 |
| FA | Fatty acids |
| MUFA | Monounsaturated fatty acids |
| SAM | S-adenosyl methionine |
| SCD1 | Stearoyl-CoA desaturase 1 |
| SFA | Saturated fatty acids |
| SIRT1 | NAD-dependent deacetylase sirtuin-1 |
| T2D | Type 2 diabetes mellitus |
| TET | Ten-eleven translocation dioxygenase |
References
- Oh, Y.S.; Bae, G.D.; Baek, D.J.; Park, E.Y.; Jun, H.S. Fatty Acid-Induced Lipotoxicity in Pancreatic Beta-Cells during Development of Type 2 Diabetes. Front. Endocrinol. 2018, 9, 384. [Google Scholar] [CrossRef] [PubMed]
- Kahn, S.E.; Cooper, M.E.; Del Prato, S. Pathophysiology and treatment of type 2 diabetes: Perspectives on the past, present, and future. Lancet 2013, 383, 1068–1083. [Google Scholar] [CrossRef] [Green Version]
- Cerf, M.E. Beta Cell Dysfunction and Insulin Resistance. Front. Endocrinol. 2013, 4, 37. [Google Scholar] [CrossRef] [PubMed] [Green Version]
- Singal, R.; Ginder, G.D. DNA methylation. Blood 1999, 93, 4059–4070. [Google Scholar] [CrossRef]
- Attwood, J.; Yung, R.; Richardson, B. DNA methylation and the regulation of gene transcription. Cell. Mol. Life Sci. 2002, 59, 241–257. [Google Scholar] [CrossRef] [Green Version]
- Van den Veyver, I.B. Genetic effects of methylation diets. Annu. Rev. Nutr. 2002, 22, 255–282. [Google Scholar] [CrossRef]
- Bostick, M.; Kim, J.K.; Estève, P.O.; Clark, A.; Pradhan, S.; Jacobsen, S.E. UHRF1 Plays a Role in Maintaining DNA Methylation in Mammalian Cells. Science 2007, 317, 1760–1764. [Google Scholar] [CrossRef] [Green Version]
- Okano, M.; Xie, S.; Li, E. Cloning and characterization of a family of novel mammalian DNA (cytosine-5) methyltransferases. Nat. Genet. 1998, 19, 219–220. [Google Scholar] [CrossRef]
- Scott, A.; Song, J.; Ewing, R.; Wang, Z. Regulation of protein stability of DNA methyltransferase 1 by post-translational modifications. Acta Biochim. Biophys. Sin. 2014, 46, 199–203. [Google Scholar] [CrossRef] [Green Version]
- Peng, L.; Yuan, Z.; Ling, H.; Fukasawa, K.; Robertson, K.; Olashaw, N.; Koomen, J.; Chen, J.; Lane, W.S.; Seto, E. SIRT1 deacetylates the DNA methyltransferase 1 (DNMT1) protein and alters its activities. Mol. Cell Biol. 2011, 31, 4720–4734. [Google Scholar] [CrossRef] [Green Version]
- Dhawan, S.; Georgia, S.; Tschen, S.I.; Fan, G.; Bhushan, A. Pancreatic β Cell Identity is Maintained by DNA Methylation-Mediated Repression of Arx. Dev. Cell 2011, 20, 419–429. [Google Scholar] [CrossRef] [PubMed] [Green Version]
- Anderson, R.M.; Bosch, J.A.; Goll, M.G.; Hesselson, D.; Dong, P.D.S.; Shin, D.; Chi, N.C.; Shin, C.H.; Schlegel, A.; Halpern, M.; et al. Loss of Dnmt1 catalytic activity reveals multiple roles for DNA methylation during pancreas development and regeneration. Dev. Biol. 2009, 334, 213–223. [Google Scholar] [CrossRef] [PubMed] [Green Version]
- Volkov, P.; Bacos, K.; Ofori, J.K.; Esguerra, J.L.S.; Eliasson, L.; Rönn, T.; Ling, C. Whole-Genome Bisulfite Sequencing of Human Pancreatic Islets Reveals Novel Differentially Methylated Regions in Type 2 Diabetes Pathogenesis. Diabetes 2017, 66, 1074–1085. [Google Scholar] [CrossRef] [PubMed] [Green Version]
- Hall, E.; Volkov, P.; Dayeh, T.; Bacos, K.; Rönn, T.; Nitert, M.D.; Ling, C. Effects of palmitate on genome-wide mRNA expression and DNA methylation patterns in human pancreatic islets. BMC Med. 2014, 12, 103. [Google Scholar] [CrossRef] [Green Version]
- Flowers, J.B.; Rabaglia, M.E.; Schueler, K.L.; Flowers, M.T.; Lan, H.; Keller, M.P.; Ntambi, J.M.; Attie, A.D. Loss of Stearoyl-CoA Desaturase-1 Improves Insulin Sensitivity in Lean Mice but Worsens Diabetes in Leptin-Deficient Obese Mice. Diabetes 2007, 56, 1228–1239. [Google Scholar] [CrossRef] [Green Version]
- Ntambi, J.M. Regulation of stearoyl-CoA desaturases and role in metabolism. Prog. Lipid Res. 2004, 43, 91–104. [Google Scholar] [CrossRef]
- Morgan, N.G. Fatty acids and β-cell toxicity. Curr. Opin. Clin. Nutr. Metab. Care 2009, 12, 117–122. [Google Scholar] [CrossRef]
- Cnop, M.; Hannaert, J.C.; Hoorens, A.; Eizirik, D.L.; Pipeleers, D. Inverse relationship between cytotoxicity of free fatty acids in pancreatic islet cells and cellular triglyceride accumulation. Diabetes 2001, 50, 1771–1777. [Google Scholar] [CrossRef] [Green Version]
- Janikiewicz, J.; Hanzelka, K.; Dziewulska, A.; Kozinski, K.; Dobrzyń, P.; Bernaś, T.; Dobrzyn, A. Inhibition of SCD1 impairs palmitate-derived autophagy at the step of autophagosome-lysosome fusion in pancreatic β-cells. J. Lipid Res. 2015, 56, 1901–1911. [Google Scholar] [CrossRef] [Green Version]
- Dziewulska, A.; Dobosz, A.M.; Dobrzyn, A.; Smolinska, A.; Kolczynska, K.; Ntambi, J.M.; Dobrzyń, P. SCD1 regulates the AMPK/SIRT1 pathway and histone acetylation through changes in adenine nucleotide metabolism in skeletal muscle. J. Cell. Physiol. 2019, 235, 1129–1140. [Google Scholar] [CrossRef]
- Małodobra, M.; Dziewulska, A.; Kozinski, K.; Dobrzyń, P.; Kolczyńska, K.; Janikiewicz, J.; Dobrzyn, A. Stearoyl-CoA desaturase regulates inflammatory gene expression by changing DNA methylation level in 3T3 adipocytes. Int. J. Biochem. Cell Biol. 2014, 55, 40–50. [Google Scholar] [CrossRef] [PubMed]
- Thörn, K.; Hovsepyan, M.; Bergsten, P. Reduced levels of SCD1 accentuate palmitate-induced stress in insulin-producing β-cells. Lipids Health Dis. 2010, 9, 108. [Google Scholar] [CrossRef] [PubMed] [Green Version]
- Lipiec, E.; Ruggeri, F.S.; Benadiba, C.; Borkowska, A.M.; Kobierski, J.D.; Miszczyk, J.; Wood, B.R.; Deacon, G.B.; Kulik, A.; Dietler, G.; et al. Infrared nanospectroscopic mapping of a single metaphase chromosome. Nucleic Acids Res. 2019, 47, e108. [Google Scholar] [CrossRef] [PubMed]
- Dovbeshko, G. FTIR spectroscopy studies of nucleic acid damage. Talanta 2000, 53, 233–246. [Google Scholar] [CrossRef]
- Stein, S.C.; Woods, A.; Jones, N.A.; Davison, M.D.; Carling, D. The regulation of AMP-activated protein kinase by phosphorylation. Biochem. J. 2000, 345, 437–443. [Google Scholar] [CrossRef] [PubMed]
- Ryall, J.G.; Dell’Orso, S.; Derfoul, A.; Juan, A.; Zare, H.; Feng, X.; Clermont, D.; Koulnis, M.; Gutierrez-Cruz, G.; Fulco, M.; et al. The NAD(+)-dependent SIRT1 deacetylase translates a metabolic switch into regulatory epigenetics in skeletal muscle stem cells. Cell Stem Cell 2015, 16, 171–183. [Google Scholar] [CrossRef] [PubMed] [Green Version]
- Vaquero, A.; Scher, M.; Lee, D.; Erdjument-Bromage, H.; Tempst, P.; Reinberg, D. Human SirT1 Interacts with Histone H1 and Promotes Formation of Facultative Heterochromatin. Mol. Cell 2004, 16, 93–105. [Google Scholar] [CrossRef]
- Yang, B.T.; Dayeh, T.A.; Kirkpatrick, C.L.; Taneera, J.; Kumar, R.; Groop, L.; Wollheim, C.B.; Nitert, M.D.; Ling, C. Insulin promoter DNA methylation correlates negatively with insulin gene expression and positively with HbA1c levels in human pancreatic islets. Diabetologia 2010, 54, 360–367. [Google Scholar] [CrossRef] [Green Version]
- Dayeh, T.; Volkov, P.; Salö, S.; Hall, E.; Nilsson, E.; Olsson, A.H.; Kirkpatrick, C.L.; Wollheim, C.B.; Eliasson, L.; Rönn, T.; et al. Genome-Wide DNA Methylation Analysis of Human Pancreatic Islets from Type 2 Diabetic and Non-Diabetic Donors Identifies Candidate Genes that Influence Insulin Secretion. PLoS Genet. 2014, 10, e1004160. [Google Scholar] [CrossRef]
- Volkmar, M.; Dedeurwaerder, S.; A Cunha, D.; Ndlovu, M.N.; Defrance, M.; Deplus, R.; Calonne, E.; Volkmar, U.; Igoillo-Esteve, M.; Naamane, N.; et al. DNA methylation profiling identifies epigenetic dysregulation in pancreatic islets from type 2 diabetic patients. EMBO J. 2012, 31, 1405–1426. [Google Scholar] [CrossRef] [Green Version]
- Liu, X.; Strable, M.S.; Ntambi, J.M. Stearoyl CoA Desaturase 1: Role in Cellular Inflammation and Stress12. Adv. Nutr. 2011, 2, 15–22. [Google Scholar] [CrossRef] [PubMed] [Green Version]
- Oshima, M.; Pechberty, S.; Bellini, L.; Göpel, S.O.; Campana, M.; Rouch, C.; Dairou, J.; Cosentino, C.; Fantuzzi, F.; Toivonen, S.; et al. Stearoyl CoA desaturase is a gatekeeper that protects human beta cells against lipotoxicity and maintains their identity. Diabetology 2019, 63, 395–409. [Google Scholar] [CrossRef] [PubMed] [Green Version]
- Lytrivi, M.; Castell, A.-L.; Poitout, V.; Cnop, M.; Anne-Laure, C. Recent Insights Into Mechanisms of β-Cell Lipo- and Glucolipotoxicity in Type 2 Diabetes. J. Mol. Biol. 2020, 432, 1514–1534. [Google Scholar] [CrossRef] [PubMed]
- Green, C.D.; Olson, L.K. Modulation of palmitate-induced endoplasmic reticulum stress and apoptosis in pancreatic β-cells by stearoyl-CoA desaturase and Elovl6. Am. J. Physiol. Metab. 2011, 300, E640–E649. [Google Scholar] [CrossRef] [PubMed] [Green Version]
- Busch, A.K.; Gurisik, E.; Cordery, D.V.; Sudlow, M.; Denyer, G.S.; Laybutt, D.R.; Hughes, W.E.; Biden, T.J. Increased fatty acid desaturation and enhanced expression of stearoyl coenzyme A desaturase protects pancreatic β-Cells from lipoapoptosis. Diabetes 2005, 54, 2917–2924. [Google Scholar] [CrossRef] [PubMed] [Green Version]
- Hellemans, K.; Kerckhofs, K.; Hannaert, J.C.; Martens, G.; Van Veldhoven, P.; Pipeleers, D. Peroxisome proliferator-activated receptor α-retinoid X receptor agonists induce β-cell protection against palmitate toxicity. FEBS J. 2007, 274, 6094–6105. [Google Scholar] [CrossRef]
- Hellemans, K.; Hannaert, J.C.; Denys, B.; Steffensen, K.R.; Raemdonck, C.; Martens, G.A.; van Veldhoven, P.P.; Gustafsson, J.Å.; Pipeleers, D. Susceptibility of Pancreatic Beta Cells to Fatty Acids is Regulated by LXR/PPARα-Dependent Stearoyl-Coenzyme A Desaturase. PLoS ONE 2009, 4, e7266. [Google Scholar] [CrossRef] [Green Version]
- Lounis, M.A.; Bergeron, K.F.; Burhans, M.S.; Ntambi, J.M.; Mounier, C. Oleate activates SREBP-1 signaling activity in SCD1-deficient hepatocytes. Am. J. Physiol. Metab. 2017, 313, E710–E720. [Google Scholar] [CrossRef]
- Jazurek-Ciesiolka, M.; Janikiewicz, J.; Dobrzyń, P.; Dziewulska, A.; Kozinski, K.; Dobrzyn, A. Oleic acid increases the transcriptional activity of FoxO1 by promoting its nuclear translocation and β-catenin binding in pancreatic β-cells. Biochim. Biophys. Acta Mol. Basis Dis. 2019, 1865, 2753–2764. [Google Scholar] [CrossRef]
- Daum, R.; Brauchle, E.M.; Berrio, D.A.C.; Jurkowski, T.P.; Schenke-Layland, K. Non-invasive detection of DNA methylation states in carcinoma and pluripotent stem cells using Raman microspectroscopy and imaging. Sci. Rep. 2019, 9, 7014. [Google Scholar] [CrossRef]
- Kim, J.; Park, H.J.; Kim, J.H.; Chang, B.; Park, H.K. Label-free Detection for a DNA Methylation Assay using Raman Spectroscopy. Chin. Med. J. 2017, 130, 1961–1967. [Google Scholar] [CrossRef] [PubMed]
- Hong, Z.; Asher, S.A. Dependence of Raman and Resonance Raman Intensities on Sample Self-Absorption. Appl. Spectrosc. 2015, 69, 75–83. [Google Scholar] [CrossRef] [PubMed]
- Yuan, Z.; Gardiner, J.C.; Maggi, E.C.; Adem, A.; Zhang, G.; Lee, S.; Romanienko, P.; Du, Y.C.N.; Libutti, S.K. Tissue-specific induced DNA methyltransferase 1 (Dnmt1) in endocrine pancreas by RCAS-TVA-based somatic gene transfer system promotes β-cell proliferation. Cancer Gene Ther. 2018, 26, 94–102. [Google Scholar] [CrossRef] [PubMed]
- Chen, T.; Hevi, S.; Gay, F.; Tsujimoto, N.; He, T.; Zhang, B.; Ueda, Y.; Li, E. Complete inactivation of DNMT1 leads to mitotic catastrophe in human cancer cells. Nat. Genet. 2007, 39, 391–396. [Google Scholar] [CrossRef]
- Brown, J.M.; Rudel, L.L. Stearoyl-coenzyme A desaturase 1 inhibition and the metabolic syndrome: Considerations for future drug discovery. Curr. Opin. Lipidol. 2010, 21, 192–197. [Google Scholar] [CrossRef]
- Sampath, H.; Ntambi, J.M. The role of stearoyl-CoA desaturase in obesity, insulin resistance, and inflammation. Ann. N. Y. Acad. Sci. 2011, 1243, 47–53. [Google Scholar] [CrossRef]
- Dobrzyn, A.; Ntambi, J.M. The role of stearoyl-CoA desaturase in the control of metabolism. Prostaglandins Leukot. Essent. Fat. Acids 2005, 73, 35–41. [Google Scholar] [CrossRef]
- Dobrzyń, P.; Dobrzyn, A.; Miyazaki, M.; Cohen, P.; Asilmaz, E.; Hardie, D.; Friedman, J.M.; Ntambi, J.M. Stearoyl-CoA desaturase 1 deficiency increases fatty acid oxidation by activating AMP-activated protein kinase in liver. Proc. Natl. Acad. Sci. USA 2004, 101, 6409–6414. [Google Scholar] [CrossRef] [Green Version]
- Ono, A.; Sano, O.; Kazetani, K.I.; Muraki, T.; Imamura, K.; Sumi, H.; Matsui, J.; Iwata, H. Feedback activation of AMPK-mediated autophagy acceleration is a key resistance mechanism against SCD1 inhibitor-induced cell growth inhibition. PLoS ONE 2017, 12, e0181243. [Google Scholar] [CrossRef] [Green Version]
- Huang, G.M.; Jiang, Q.H.; Cai, C.; Qu, M.; Shen, W. SCD1 negatively regulates autophagy-induced cell death in human hepatocellular carcinoma through inactivation of the AMPK signaling pathway. Cancer Lett. 2015, 358, 180–190. [Google Scholar] [CrossRef]
- Wang, X.; Zhou, L.; Li, G.; Luo, T.; Gu, Y.; Qian, L.; Fu, X.; Li, F.; Li, J.; Luo, M. Palmitate activates AMP-activated protein kinase and regulates insulin secretion from beta cells. Biochem. Biophys. Res. Commun. 2007, 352, 463–468. [Google Scholar] [CrossRef] [PubMed]
- Canto, C.; Jiang, L.Q.; Deshmukh, A.S.; Mataki, C.; Coste, A.; Lagouge, M.; Zierath, J.R.; Auwerx, J. Interdependence of AMPK and SIRT1 for metabolic adaptation to fasting and exercise in skeletal muscle. Cell Metab. 2010, 11, 213–219. [Google Scholar] [CrossRef] [PubMed] [Green Version]
- Ruderman, N.B.; Xu, X.J.; Nelson, L.; Cacicedo, J.M.; Saha, A.K.; Lan, F.; Ido, Y. AMPK and SIRT1: A long-standing partnership? Am. J. Physiol. Endocrinol. Metab. 2010, 298, E751–E760. [Google Scholar] [CrossRef] [PubMed]
- Ciregia, F.; Bugliani, M.; Ronci, M.; Giusti, L.; Boldrini, C.; Mazzoni, M.R.; Mossuto, S.; Grano, F.; Cnop, M.; Marselli, L.; et al. Palmitate-induced lipotoxicity alters acetylation of multiple proteins in clonal β cells and human pancreatic islets. Sci. Rep. 2017, 7, 13445. [Google Scholar] [CrossRef] [PubMed] [Green Version]
- Marin, T.L.; Gongol, B.; Zhang, F.; Martin, M.; Johnson, D.A.; Xiao, H.; Wang, Y.; Subramaniam, S.; Chien, S.; Shyy, J.Y.J. AMPK promotes mitochondrial biogenesis and function by phosphorylating the epigenetic factors DNMT1, RBBP7, and HAT1. Sci. Signal. 2017, 10, eaaf7478. [Google Scholar] [CrossRef] [Green Version]
- Wu, D.; Hu, D.; Chen, H.; Shi, G.; Fetahu, I.S.; Wu, F.; Rabidou, K.; Fang, R.; Tan, L.; Xu, S.; et al. Glucose-regulated phosphorylation of TET2 by AMPK reveals a pathway linking diabetes to cancer. Nature 2018, 559, 637–641. [Google Scholar] [CrossRef]
- Zhang, N. Role of methionine on epigenetic modification of DNA methylation and gene expression in animals. Anim. Nutr. 2018, 4, 11–16. [Google Scholar] [CrossRef]
- Zhao, S.; Wu, J.; Zheng, F.; Tang, Q.; Yang, L.; Li, L.; Wu, W.; Hann, S.S. β-elemene inhibited expression of DNA methyltransferase 1 through activation of ERK1/2 and AMPKα signalling pathways in human lung cancer cells: The role of Sp1. J. Cell. Mol. Med. 2015, 19, 630–641. [Google Scholar] [CrossRef]
- Miyazaki, M.; Man, W.C.; Ntambi, J.M. Targeted disruption of stearoyl-CoA desaturase1 gene in mice causes atrophy of sebaceous and meibomian glands and depletion of wax esters in the eyelid. J. Nutr. 2001, 131, 2260–2268. [Google Scholar] [CrossRef]


© 2020 by the authors. Licensee MDPI, Basel, Switzerland. This article is an open access article distributed under the terms and conditions of the Creative Commons Attribution (CC BY) license (http://creativecommons.org/licenses/by/4.0/).
Share and Cite
Dobosz, A.M.; Janikiewicz, J.; Borkowska, A.M.; Dziewulska, A.; Lipiec, E.; Dobrzyn, P.; Kwiatek, W.M.; Dobrzyn, A. Stearoyl-CoA Desaturase 1 Activity Determines the Maintenance of DNMT1-Mediated DNA Methylation Patterns in Pancreatic β-Cells. Int. J. Mol. Sci. 2020, 21, 6844. https://0-doi-org.brum.beds.ac.uk/10.3390/ijms21186844
Dobosz AM, Janikiewicz J, Borkowska AM, Dziewulska A, Lipiec E, Dobrzyn P, Kwiatek WM, Dobrzyn A. Stearoyl-CoA Desaturase 1 Activity Determines the Maintenance of DNMT1-Mediated DNA Methylation Patterns in Pancreatic β-Cells. International Journal of Molecular Sciences. 2020; 21(18):6844. https://0-doi-org.brum.beds.ac.uk/10.3390/ijms21186844
Chicago/Turabian StyleDobosz, Aneta M., Justyna Janikiewicz, Anna M. Borkowska, Anna Dziewulska, Ewelina Lipiec, Pawel Dobrzyn, Wojciech M. Kwiatek, and Agnieszka Dobrzyn. 2020. "Stearoyl-CoA Desaturase 1 Activity Determines the Maintenance of DNMT1-Mediated DNA Methylation Patterns in Pancreatic β-Cells" International Journal of Molecular Sciences 21, no. 18: 6844. https://0-doi-org.brum.beds.ac.uk/10.3390/ijms21186844