Novel Gene Rearrangement and the Complete Mitochondrial Genome of Cynoglossus monopus: Insights into the Envolution of the Family Cynoglossidae (Pleuronectiformes)


Abstract
:1. Introduction
2. Results and Discussions
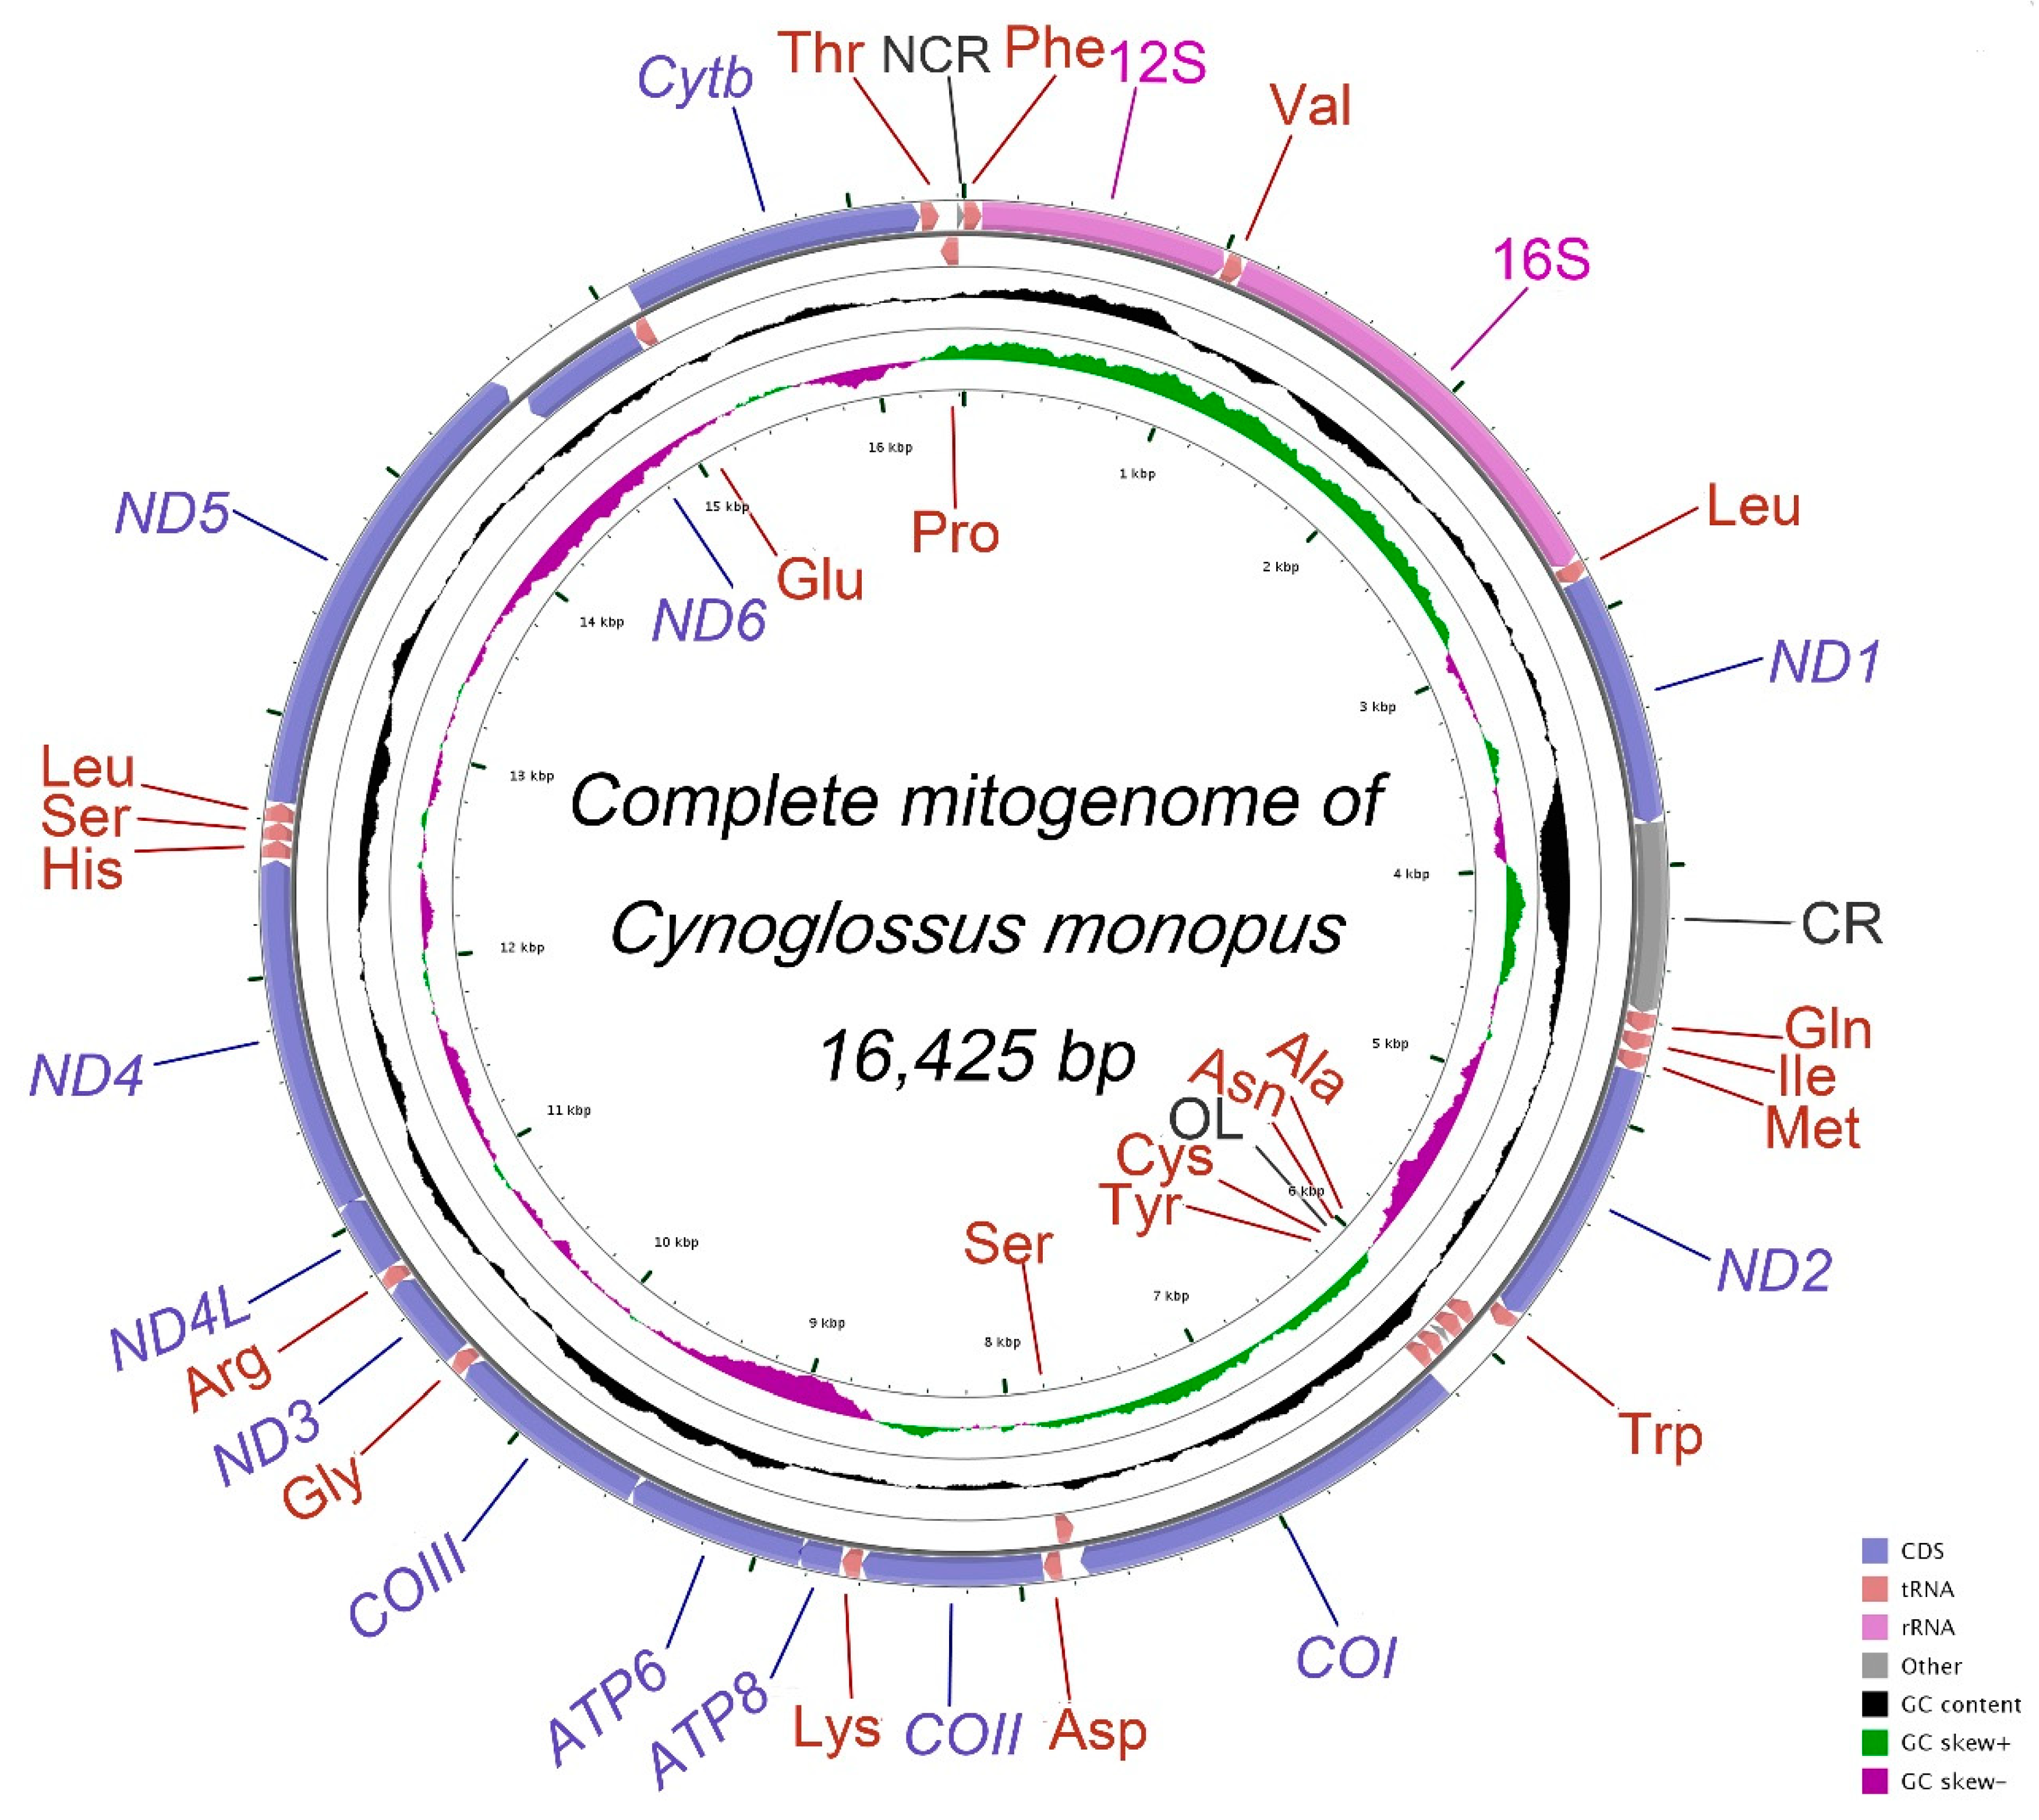
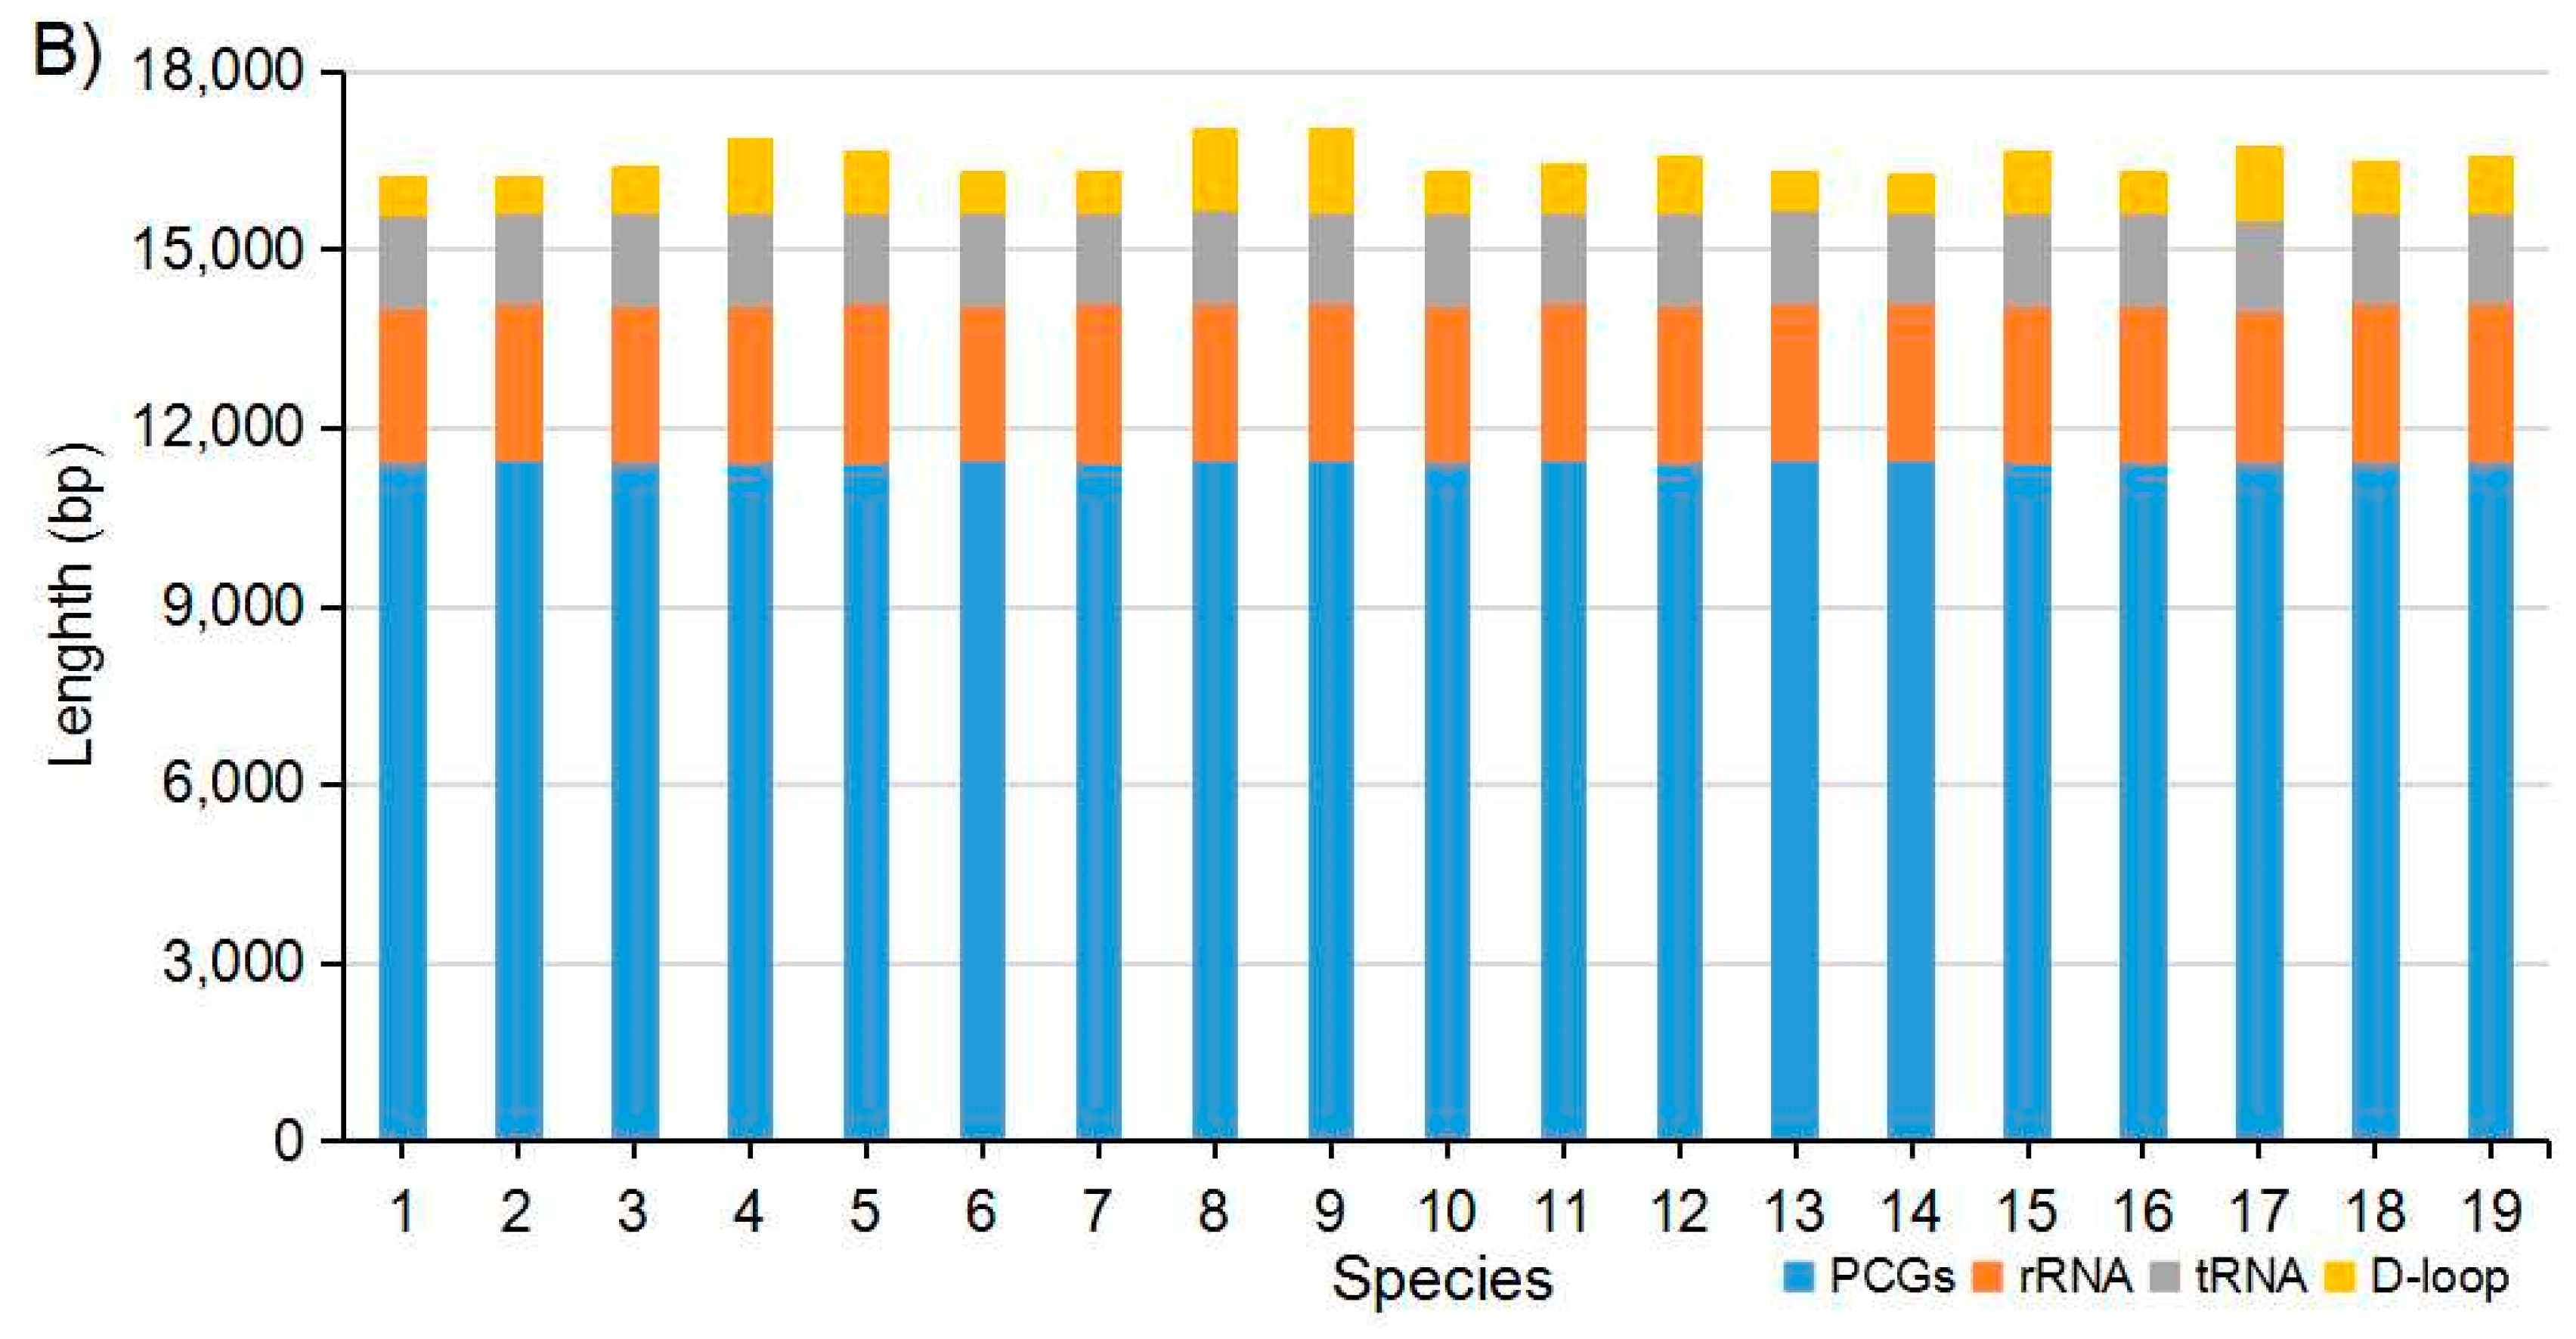
2.1. Genome Organization and Nucleotide Composition
2.2. Protein-Coding Genes (PCGs), Transfer RNAs and Ribosomal RNAs
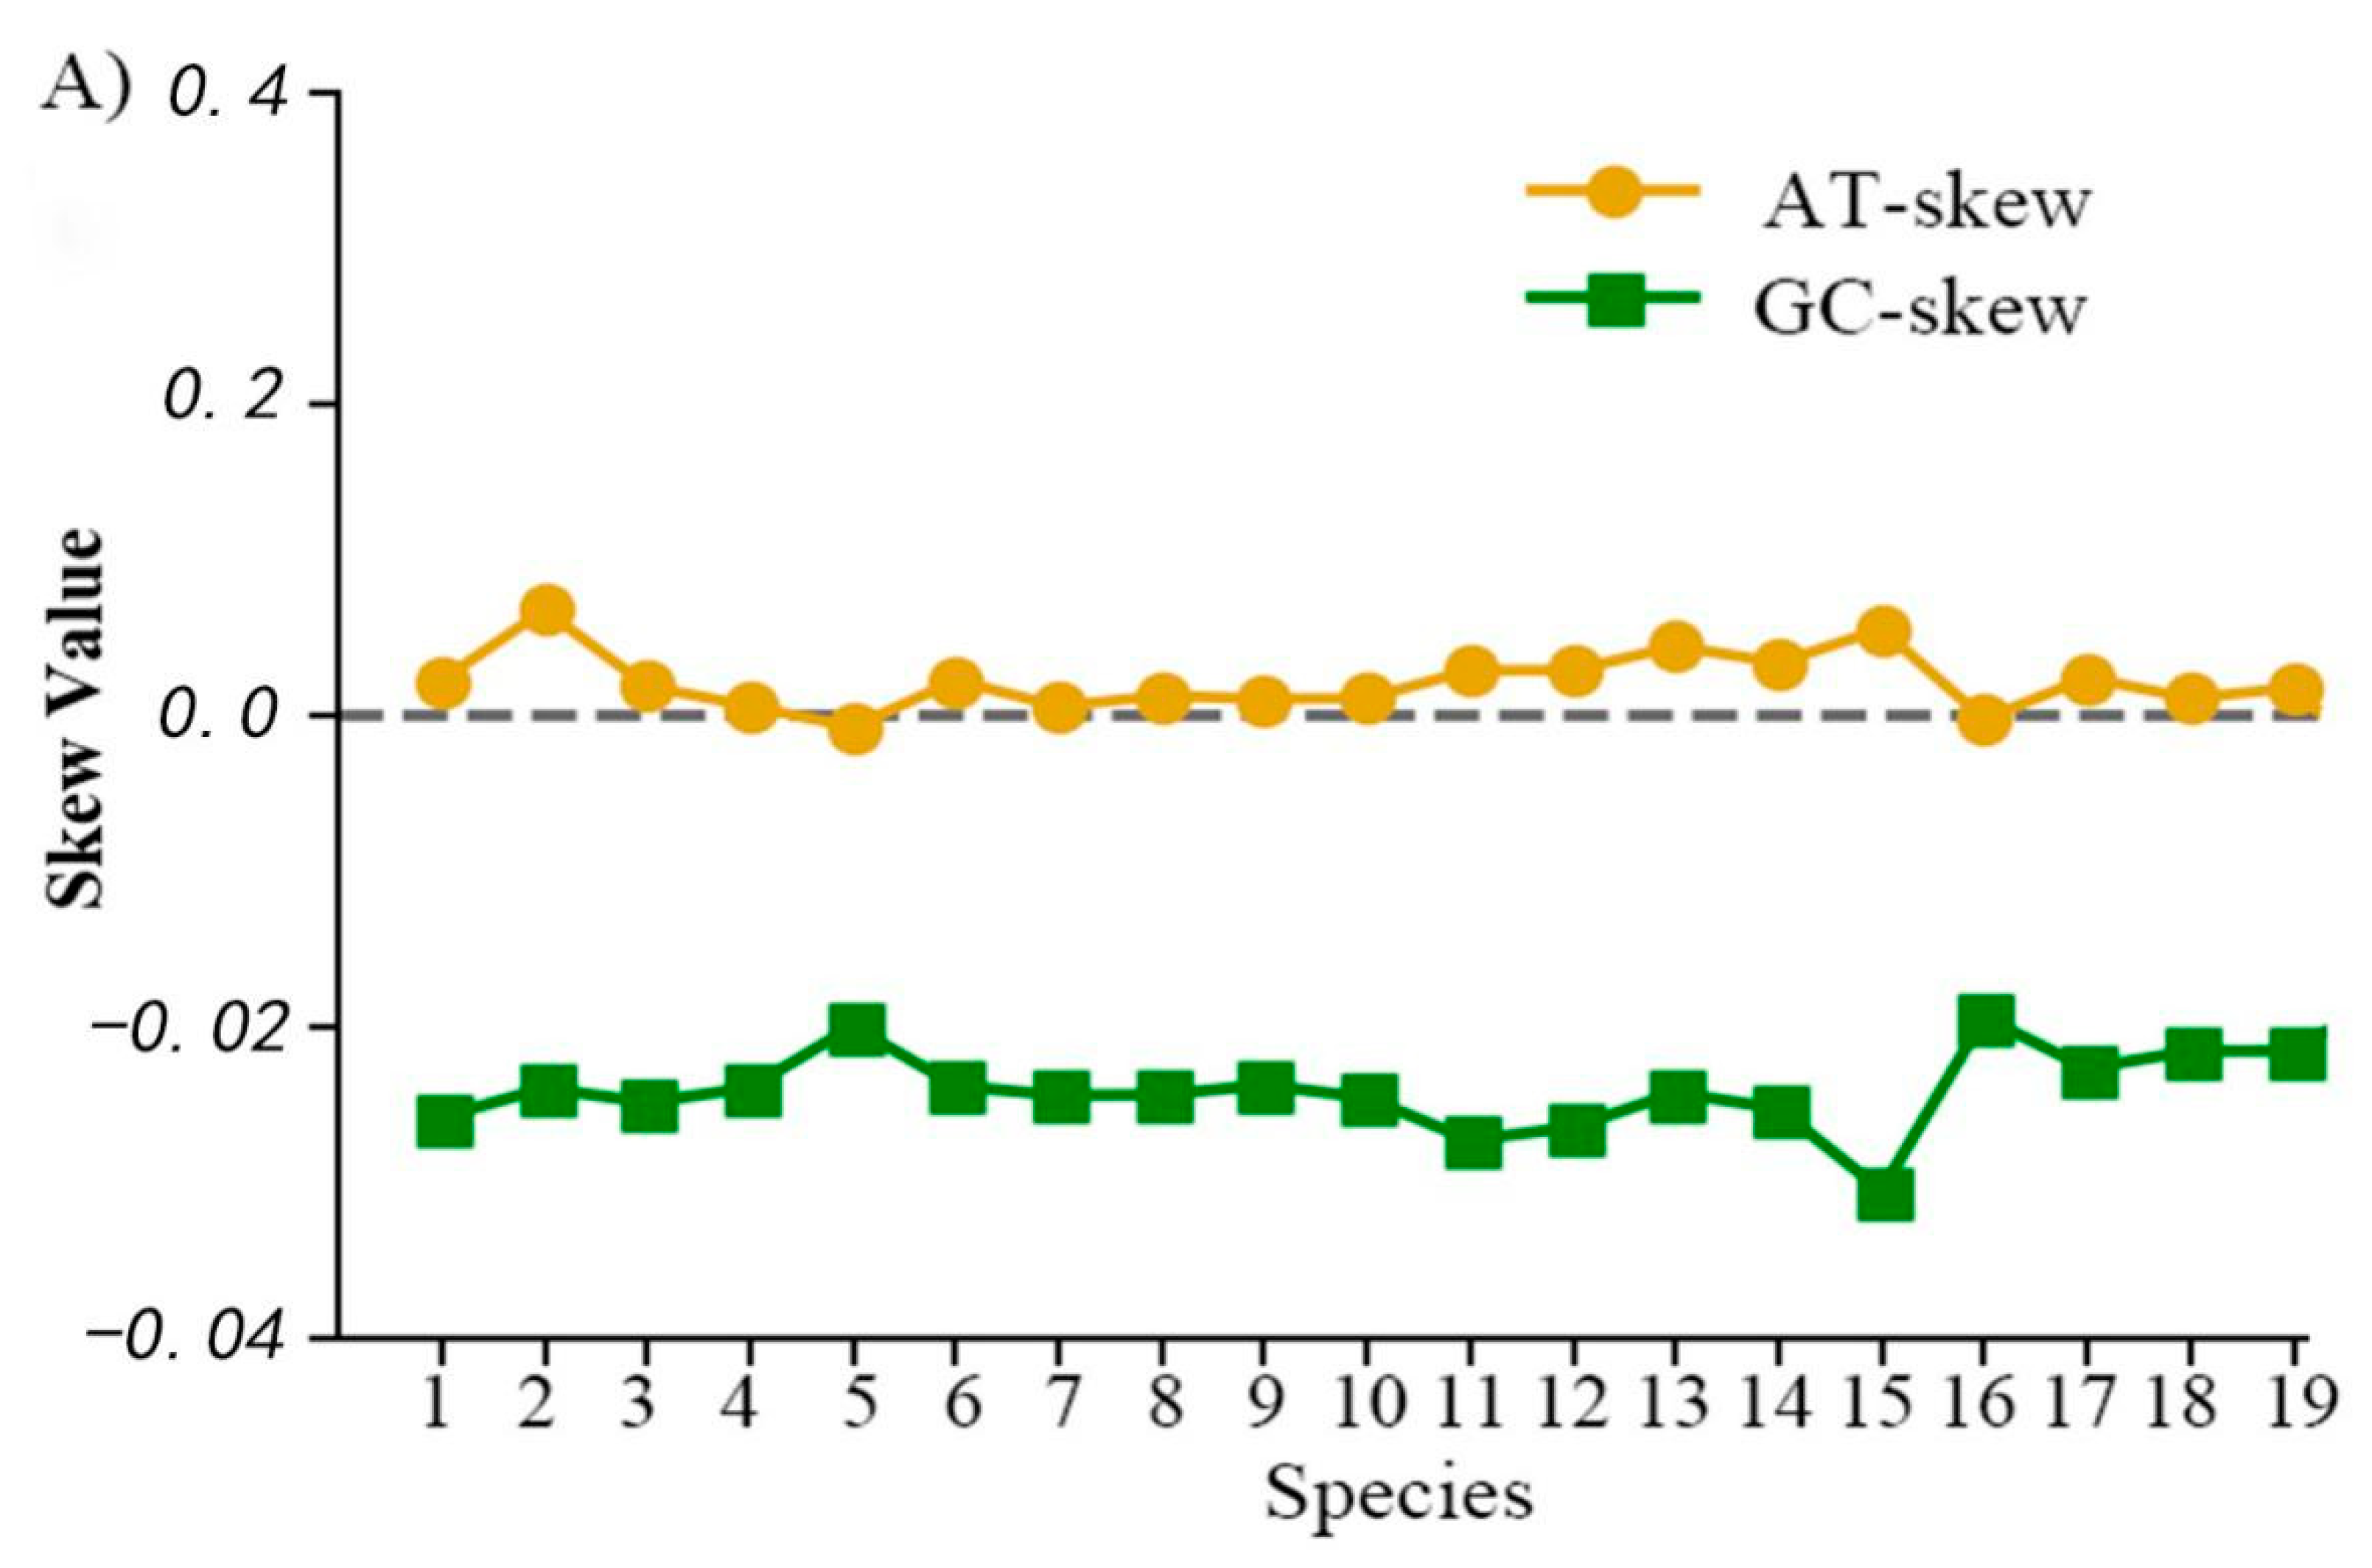
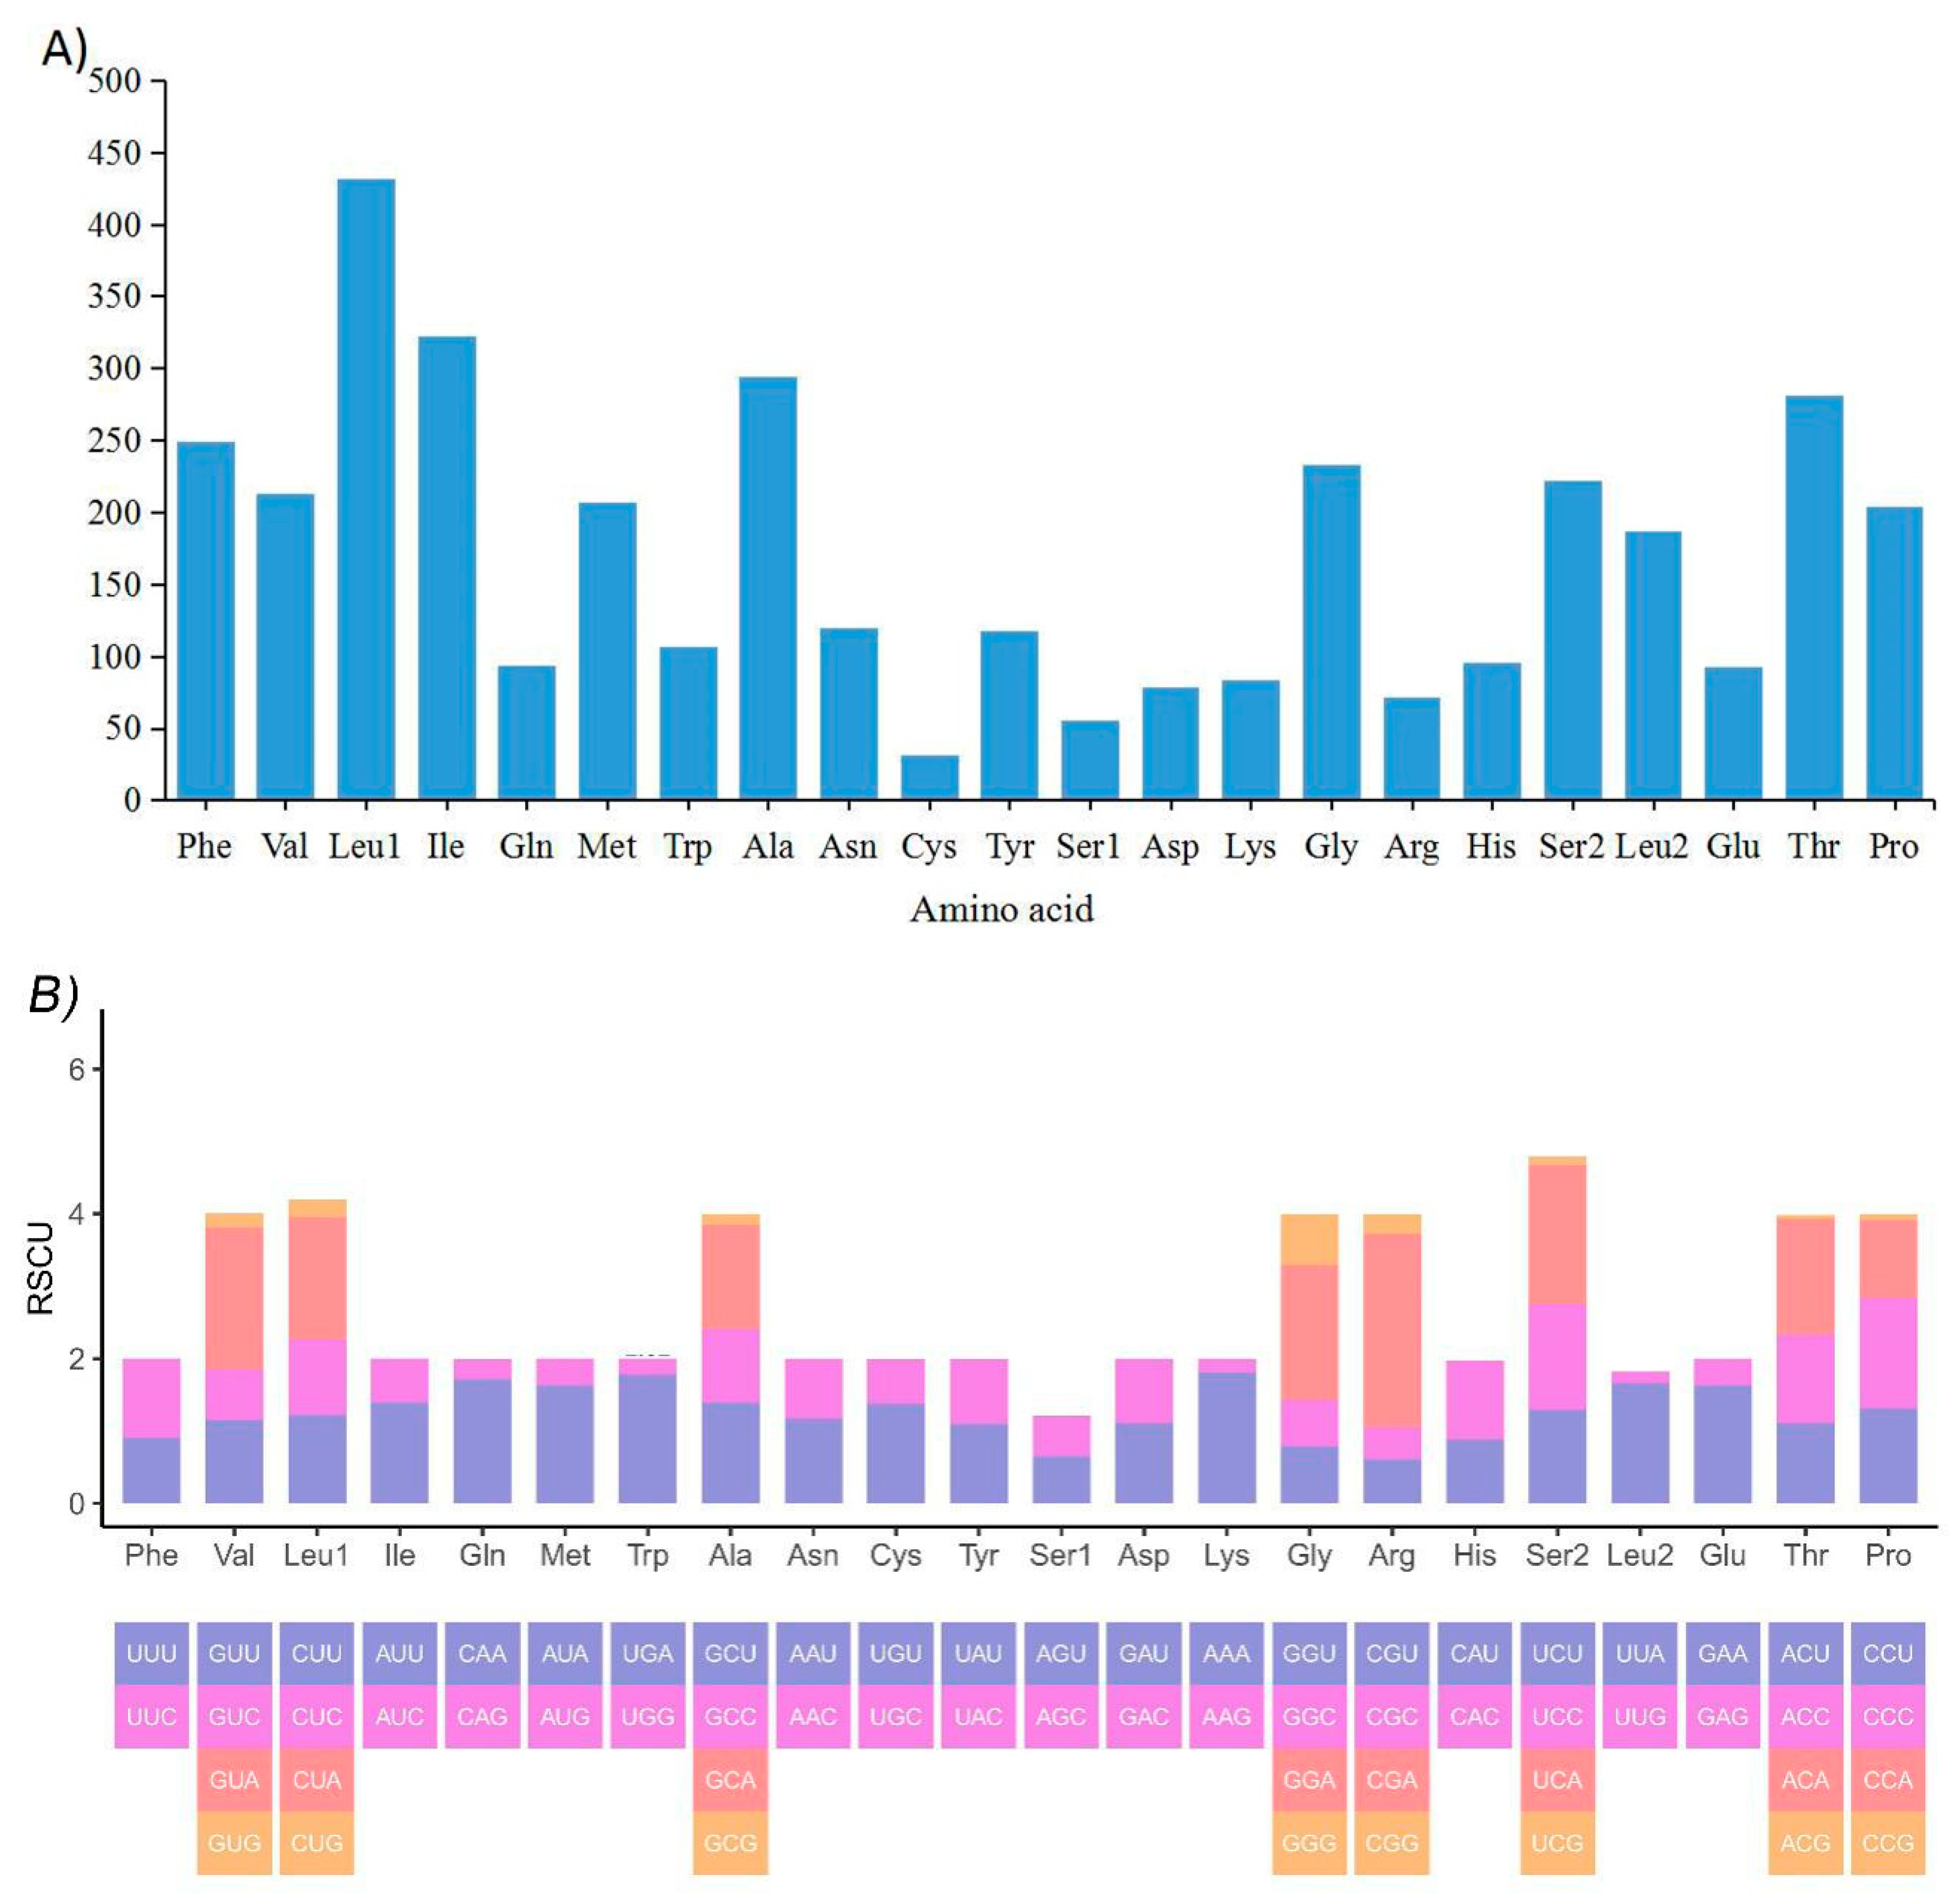
2.3. Mitochondrial Gene Codon Usage and Skewness
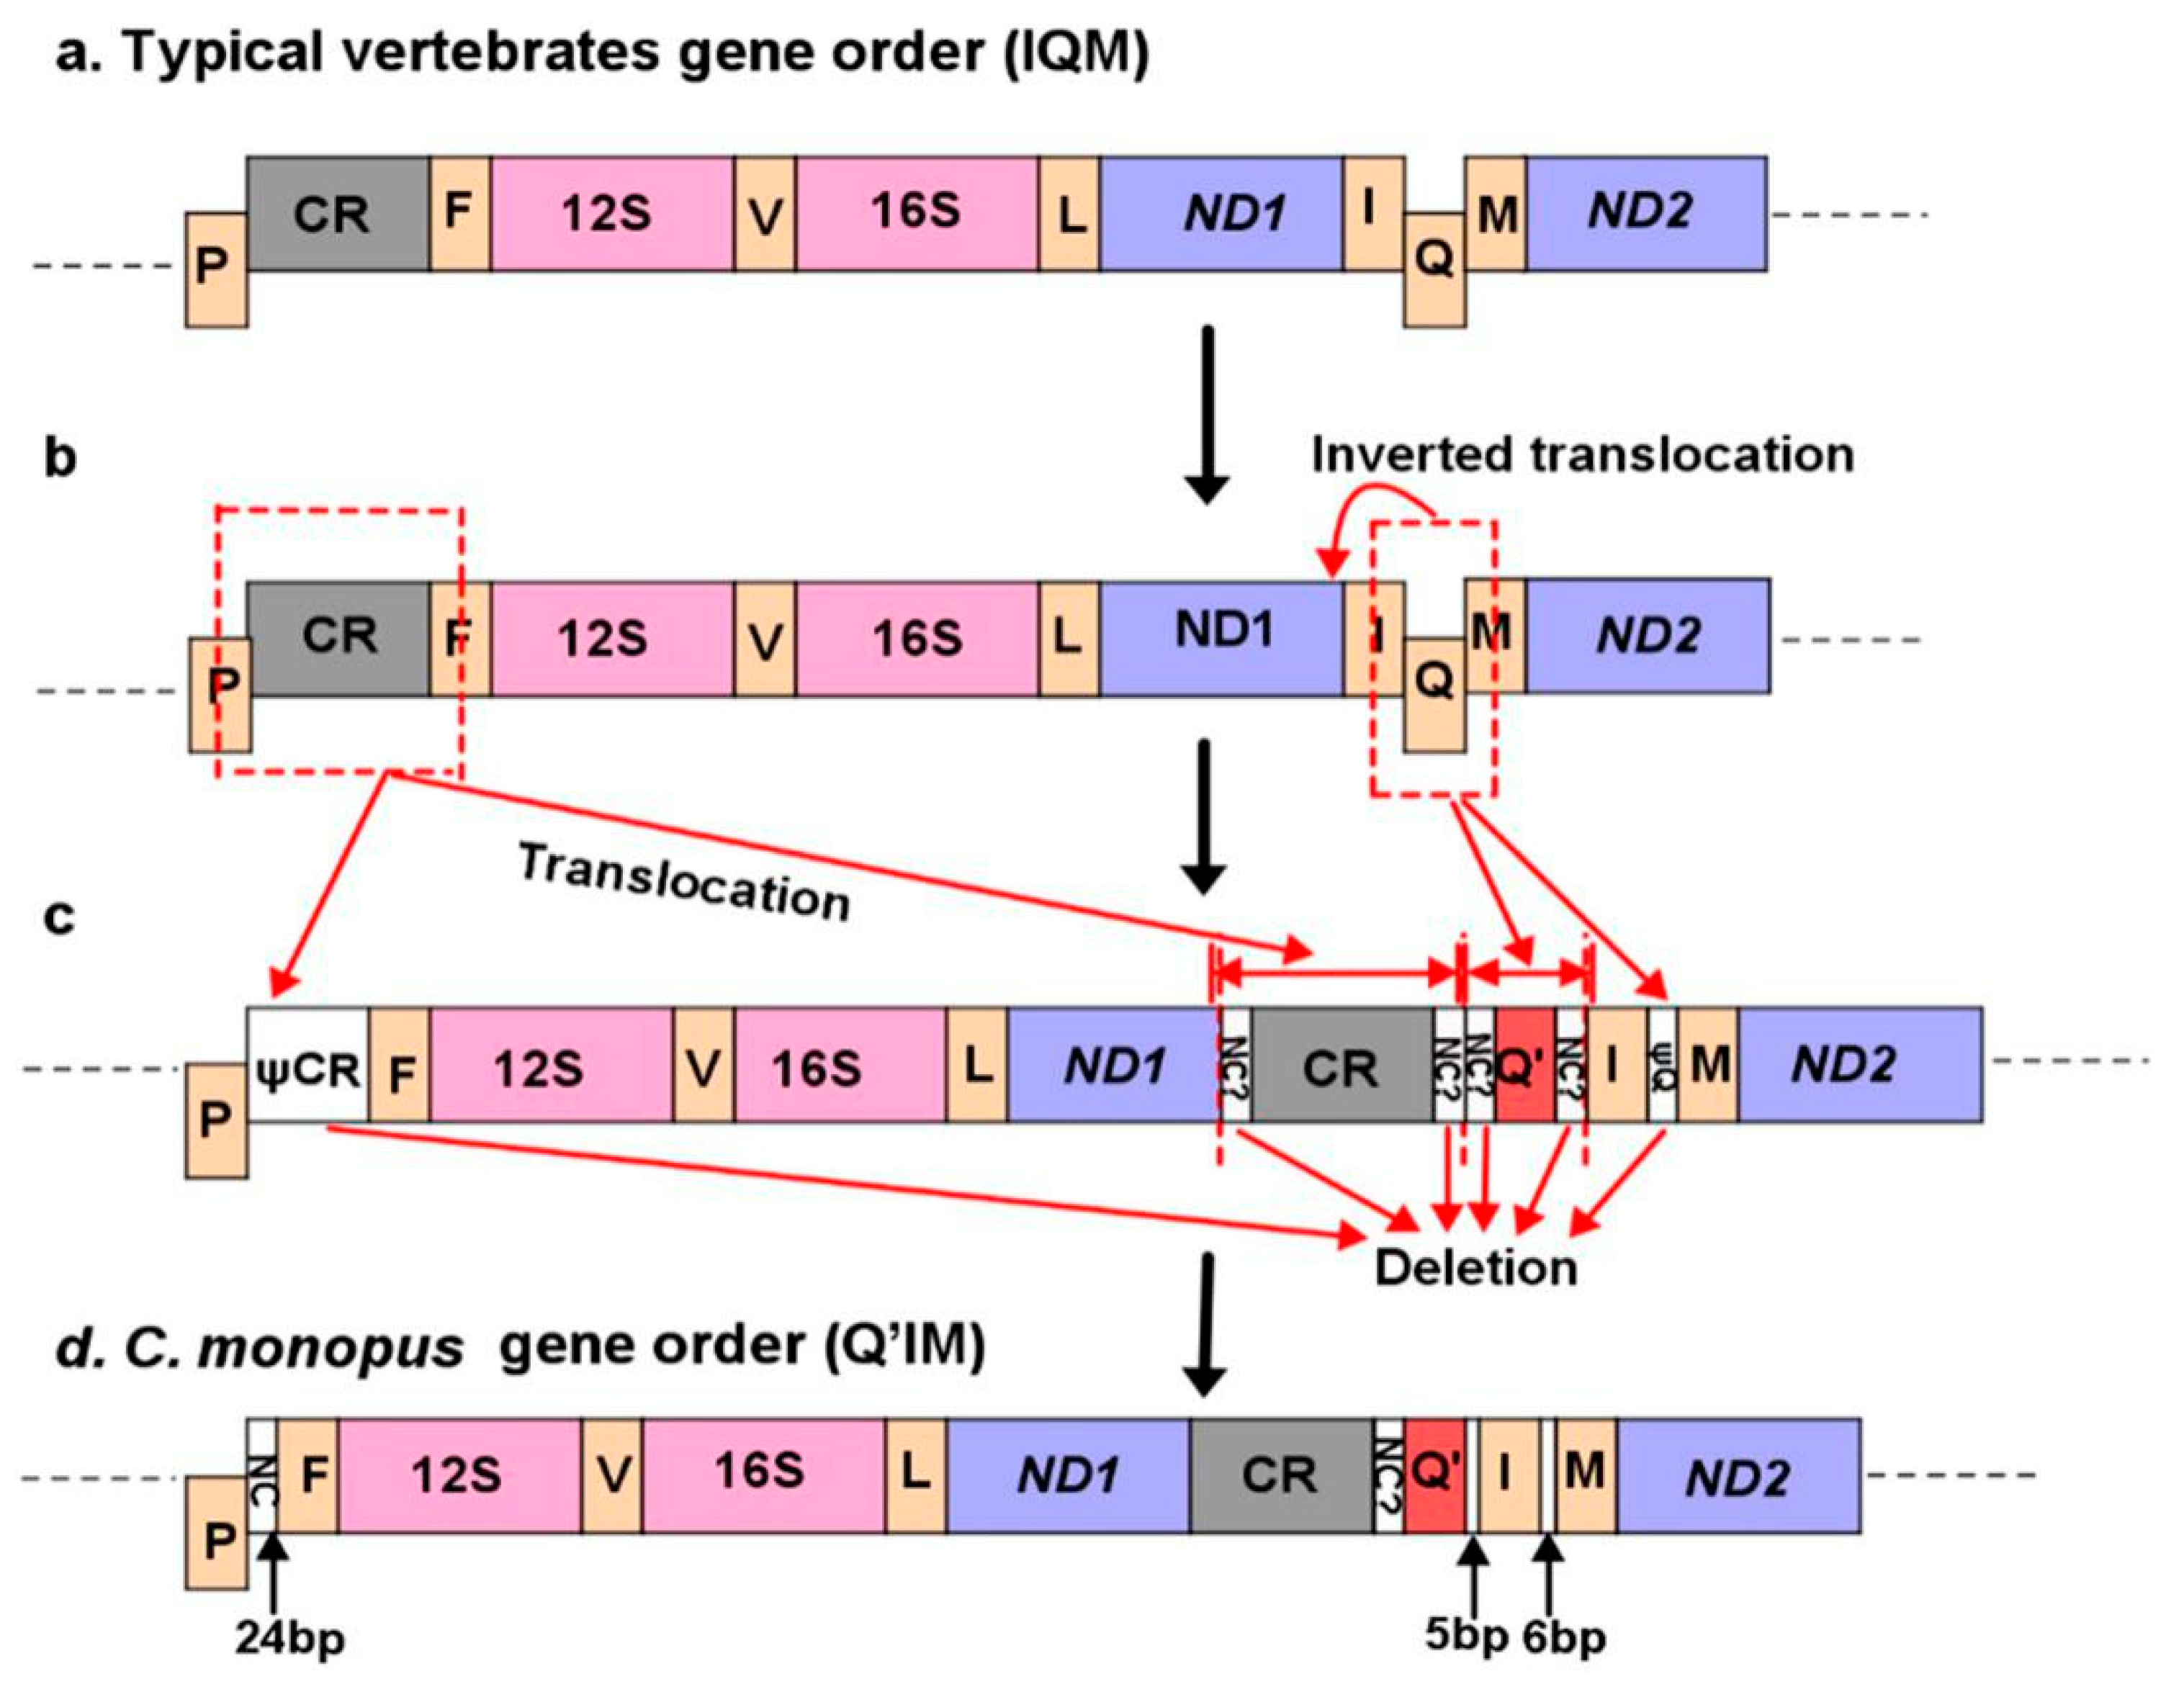
2.4. Gene Rearrangement
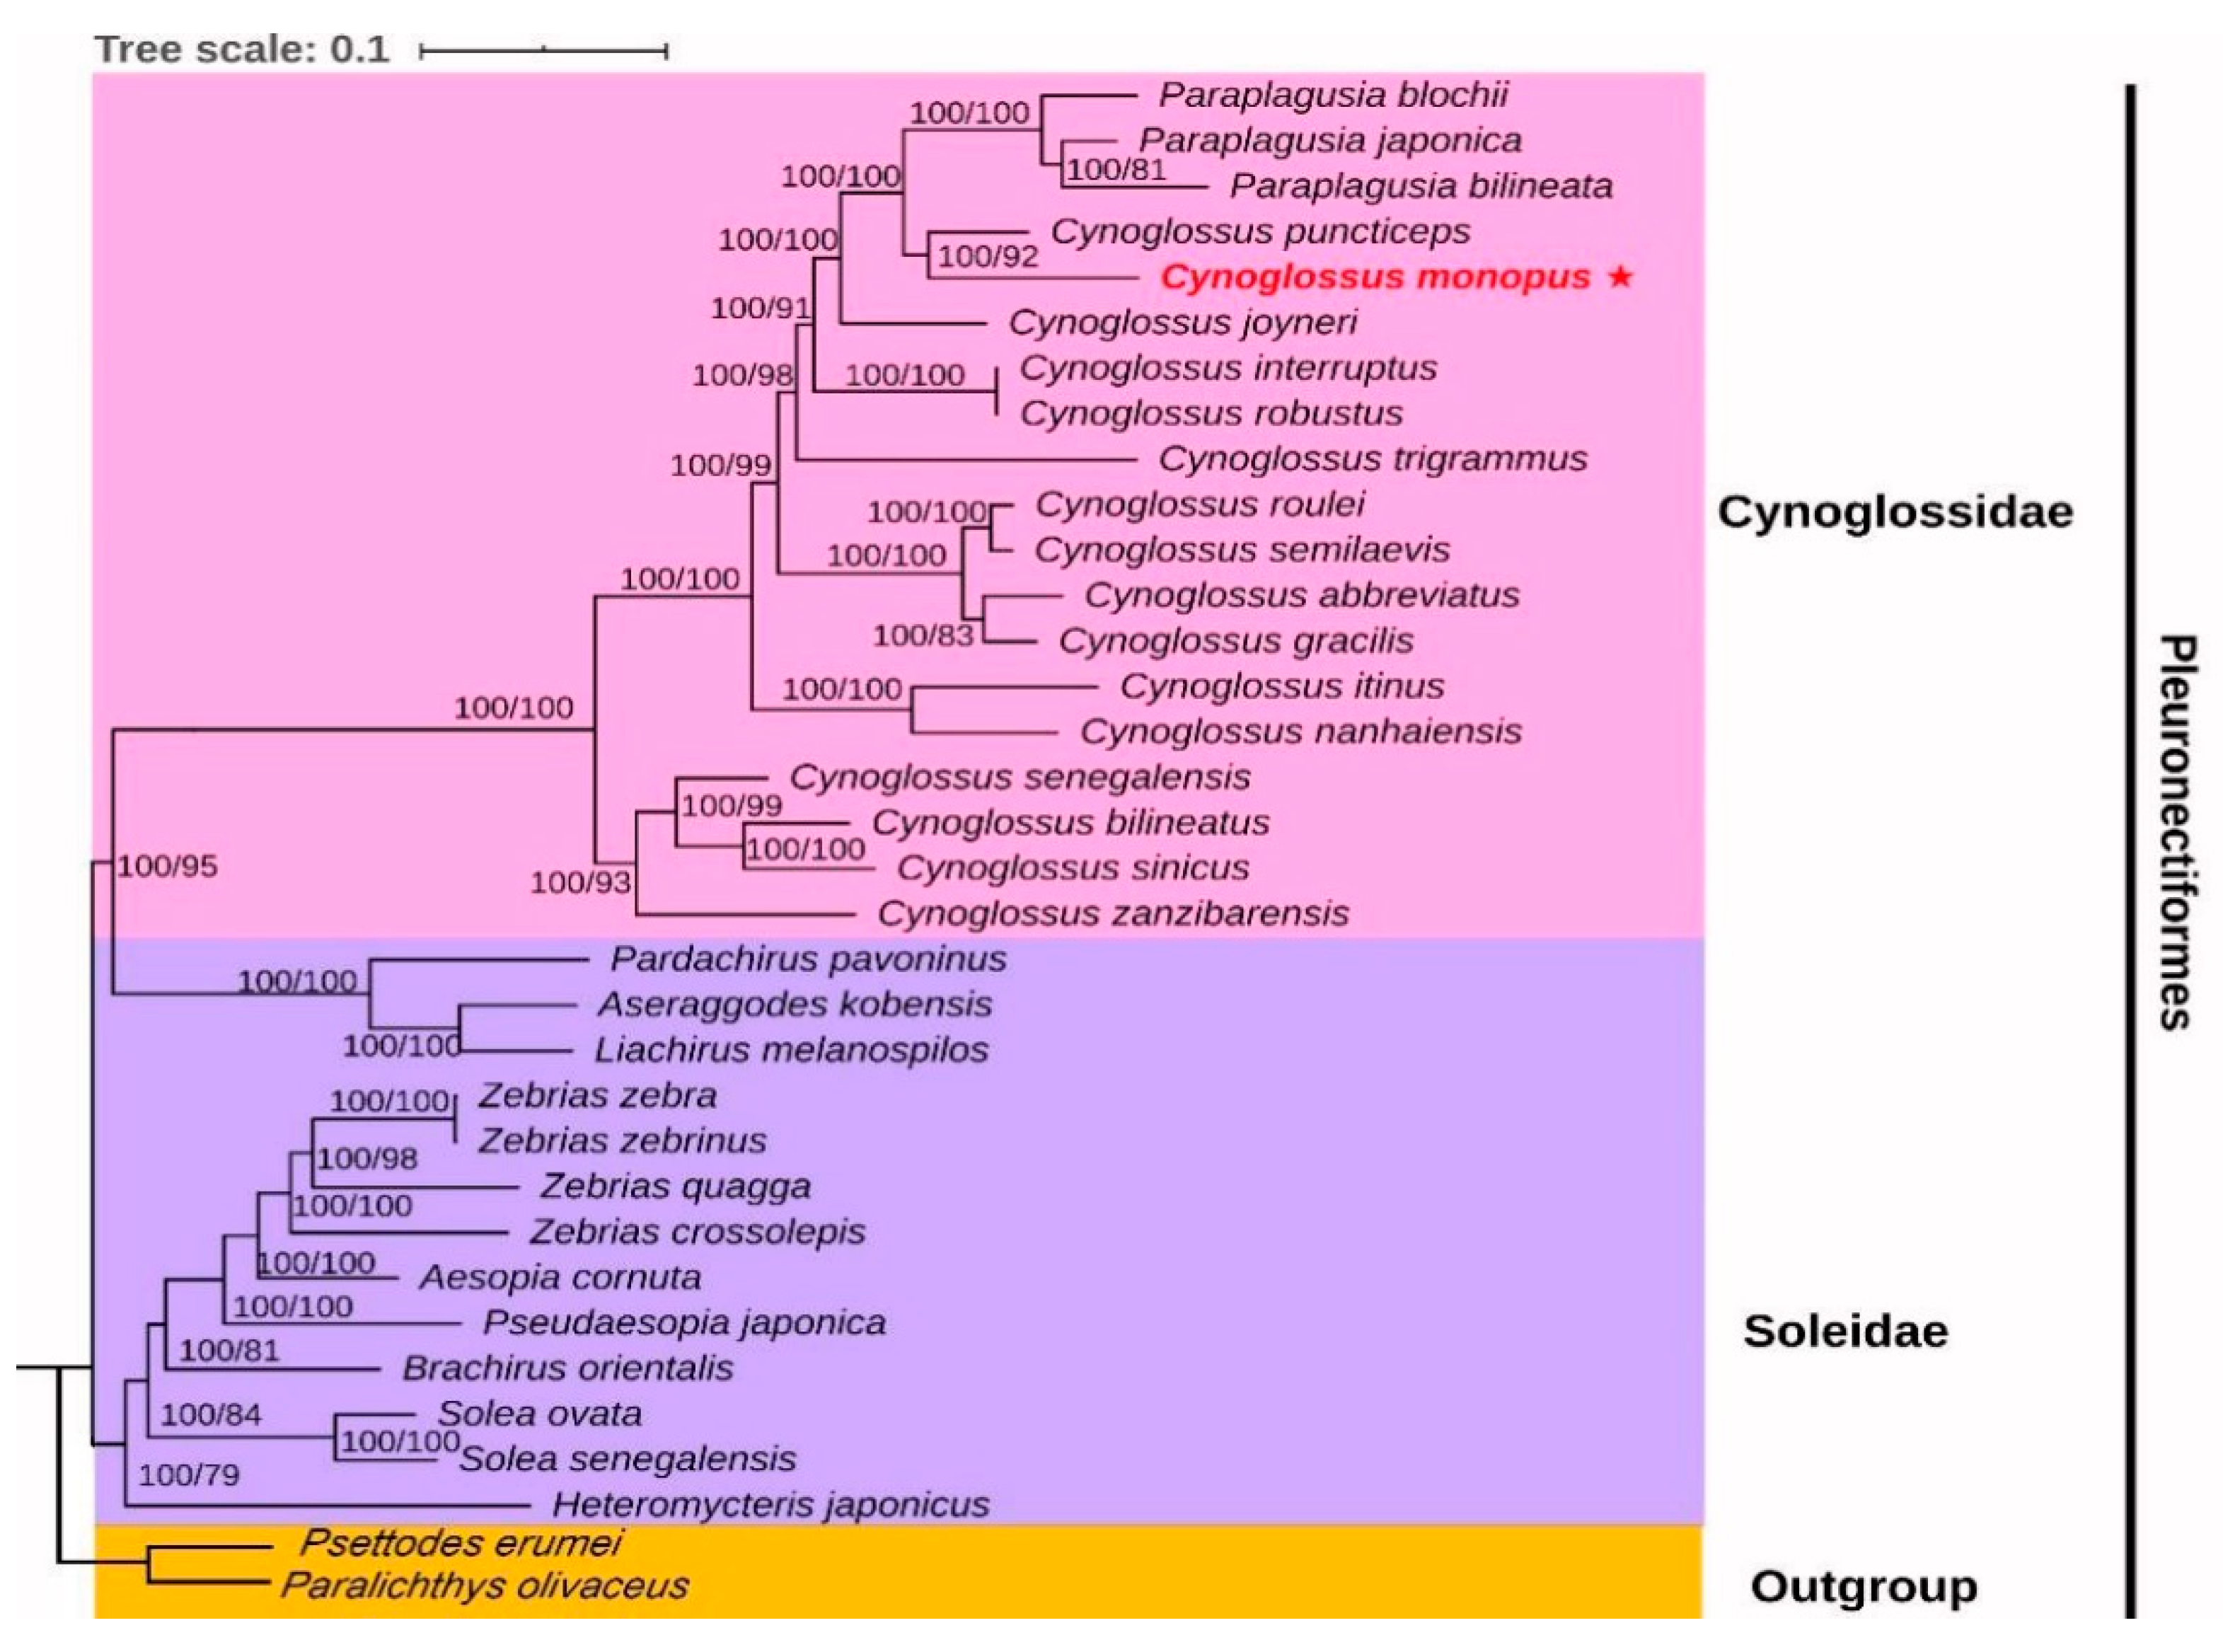
2.5. Phylogenetic Analyses
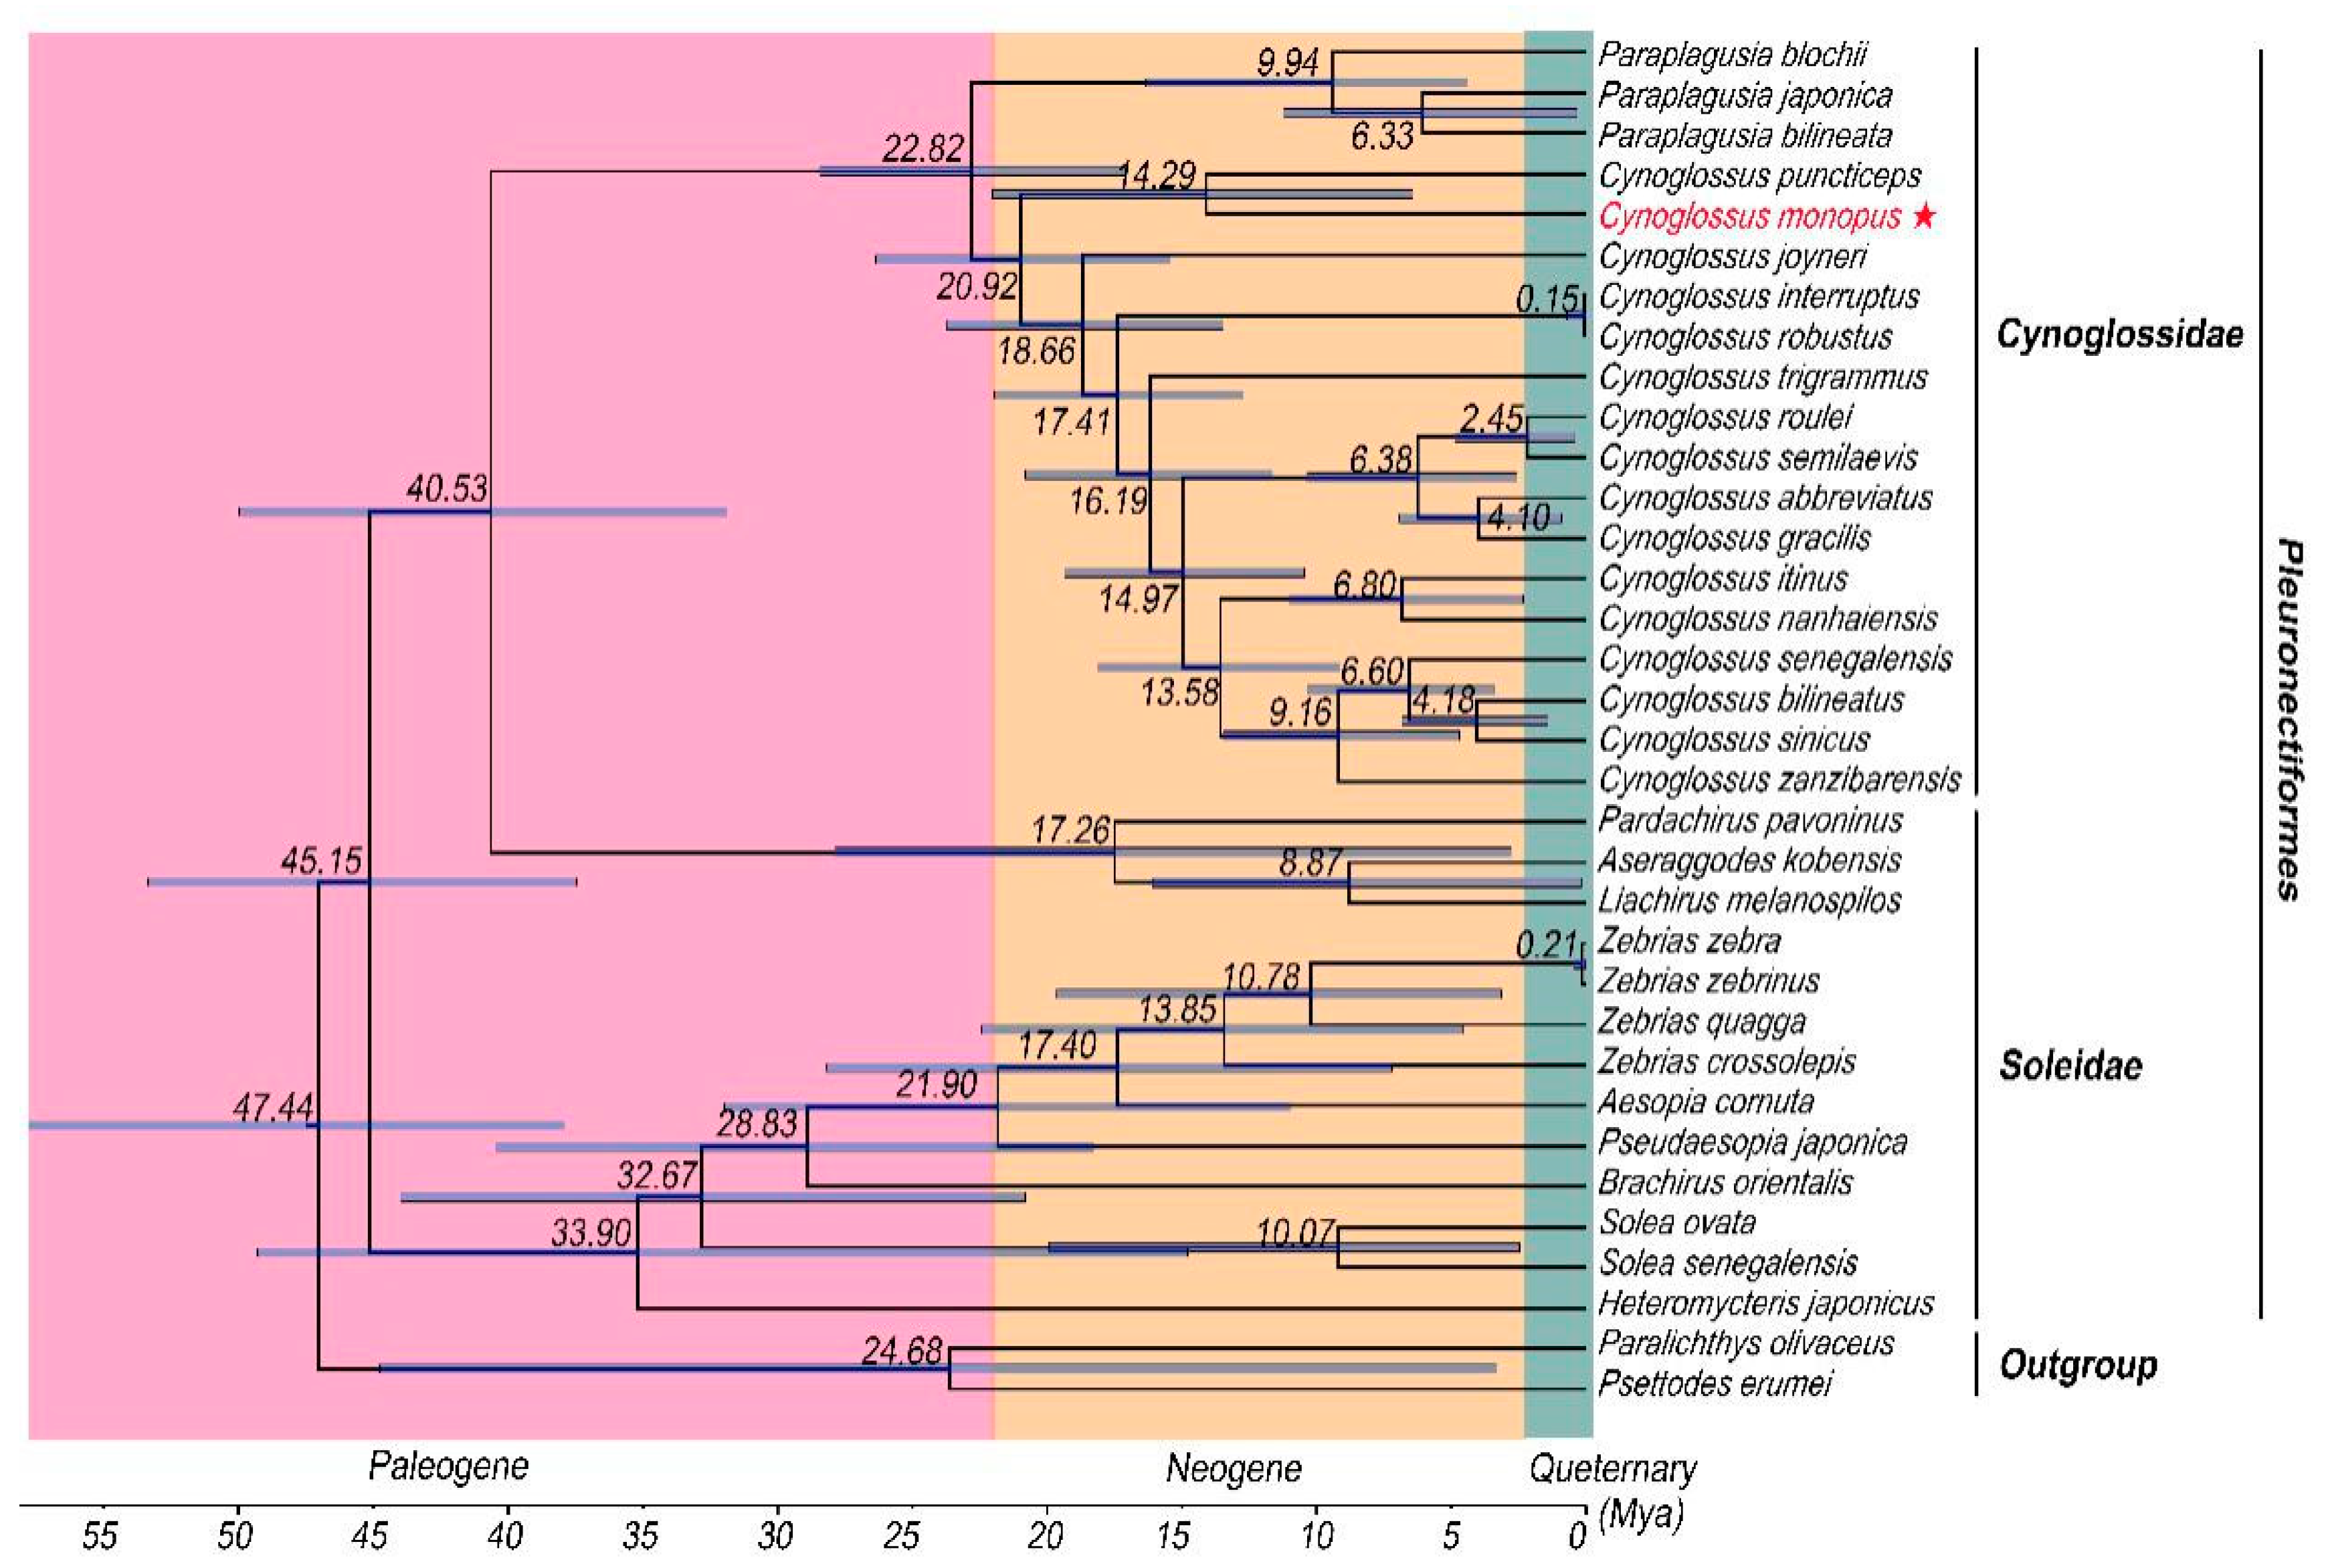
2.6. Divergence Time Analyses
3. Materials and Methods
3.1. Specimen Collection and DNA Extraction
3.2. PCR Amplification and Sequencing
3.3. Sequene Analysis
3.4. Phylogenetic and Divergence Time Analyses
4. Conclusions
Author Contributions
Funding
Conflicts of Interest
References
- Li, S.Z.; Wang, H.M. Fauna Sinica (Osteichthyes): Pleuronectiformes; Science Press: Beijing, China, 1995. [Google Scholar]
- Menon, A. A systematic monograph of the tongue soles of the genus Cynoglossus Hamilton-Buchanan (Pisces: Cynoglossidae). Smithson. Contrib. Zool. 1977, 238, 1–129. [Google Scholar] [CrossRef]
- Chapleau, F. A phylogenetic reassessment of the monophyletic status of the family Soleidae, with notes on the suborder Soleoidei. Can. J. Zool. 1988, 66, 2797–2810. [Google Scholar] [CrossRef]
- Chapleau, F. Pleuronectiform relationships: A cladistic reassessment. Bull. Mar. Sci. 1993, 52, 516–540. [Google Scholar]
- Schwarzhans, W.A. comparative morphological treatise of recent and fossil otoliths of the order Pleuronectiformes/Werner Schwarzhans. München Pfeil 1999, 2, 1–396. [Google Scholar]
- Boore, J.L. Animal mitochondrial genomes. Nucleic Acids Res. 1999, 27, 1767–1780. [Google Scholar] [CrossRef] [PubMed] [Green Version]
- Tzeng, C.S.; Hui, C.F.; Shen, S.C.; Huang, P.C. The complete nucleotide sequence of the Crossostoma lacustre mitochondrial genome: Conservation and variations among vertebrates. Nucleic Acids Res. 1992, 20, 4853–4858. [Google Scholar] [CrossRef] [PubMed] [Green Version]
- Wolstenholme, D.R. Animal Mitochondrial DNA: Structure and Evolution. Int. Rev. Cytol. 1992, 141, 173–216. [Google Scholar] [PubMed]
- Yang, Y.; Liu, H.; Qi, L.; Kong, L.; Li, Q. Complete Mitochondrial Genomes of Two Toxin-Accumulated Nassariids (Neogastropoda: Nassariidae: Nassarius) and Their Implication for Phylogeny. Int. J. Mol. Sci. 2020, 21, 10. [Google Scholar] [CrossRef]
- Han, X.; He, H.; Shen, H.; Tang, J.; Dong, W.; Shi, Y.; Wu, S.; Zhang, F.; Liang, G. Comparative mitochondrial genome analysis of Dendrolimus houi (Lepidoptera: Lasiocampidae) and phylogenetic relationship among Lasiocampidae species. PLoS ONE 2020, 15, e0232527. [Google Scholar] [CrossRef]
- Lu, C.; Huang, X.; Deng, J. The challenge of Coccidae (Hemiptera: Coccoidea) mitochondrial genomes: The case of Saissetia coffeae with novel truncated tRNAs and gene rearrangements. Int. J. Biol. Macromol. 2020, 158, 854–864. [Google Scholar] [CrossRef]
- Liu, J.; Yu, J.; Zhou, M.; Yang, J. Complete mitochondrial genome of Japalura flaviceps: Deep insights into the phylogeny and gene rearrangements of Agamidae species. Int. J. Biol. Macromol. 2019, 125, 423–431. [Google Scholar] [CrossRef] [PubMed]
- Eberhard, J.R.; Wright, T.F. Rearrangement and evolution of mitochondrial genomes in parrots. Mol. Phylogenet. Evol. 2016, 94, 34–46. [Google Scholar] [CrossRef] [PubMed] [Green Version]
- Macey, J.R.; Larson, A.; Ananjeva, N.B.; Fang, Z.; Papenfuss, T.J. Two novel gene orders and the role of light-strand replication in rearrangement of the vertebrate mitochondrial genome. Mol. Biol. Evol. 1997, 14, 91–104. [Google Scholar] [CrossRef] [PubMed]
- Yuan, M.L.; Wang, D.D.; Wang, B.J.; Dou, W.; Wang, J.J. The complete mitochondrial genome of the citrus red mite Panonychus citri (Acari: Tetranychidae): High genome rearrangement and extremely truncated tRNAs. BMC Genom. 2010, 11, 597. [Google Scholar] [CrossRef] [Green Version]
- Gong, L.; Lu, X.; Luo, H.; Zhang, Y.; Shi, W.; Liu, L.; Lu, Z.; Liu, B.; Jiang, L. Novel gene rearrangement pattern in Cynoglossus melampetalus mitochondrial genome: New gene order in genus Cynoglossus (Pleuronectiformes: Cynoglossidae). Int. J. Biol. Macromol. 2020, 149, 1232–1240. [Google Scholar] [CrossRef]
- Clayton, D.A. Transcription and Replication of Animal Mitochondrial DNAs. Int. Rev. Cytol. 1992, 141, 217–232. [Google Scholar]
- Manchado, M.; Catanese, G.; Ponce, M.; Funes, V.; Infante, C. The complete mitochondrial genome of the Senegal sole, Solea senegalensis Kaup. Comparative analysis of tandem repeats in the control region among soles. DNA Seq. 2007, 18, 169–175. [Google Scholar] [CrossRef]
- Kong, X.; Dong, X.; Zhang, Y.; Shi, W.; Wang, Z.; Yu, Z. A novel rearrangement in the mitochondrial genome of tongue sole, Cynoglossus semilaevis: Control region translocation and a tRNA gene inversion. Genome 2009, 52, 975–984. [Google Scholar] [CrossRef]
- Song, H.Y.; Kim, J.K.; Jo, S.; Jung, S.H.; Kim, B.; Choi, Y.J.; Yoo, J.S.; Lee, D.S. The complete mitochondrial genome of Cynoglossus interruptus and its novel rearrangement (Pleuronectiformes: Cynoglossidae). Mitochondrial DNA Part B 2019, 4, 2924–2925. [Google Scholar] [CrossRef] [Green Version]
- Song, H.Y.; Kim, J.K.; Jo, S.; Jung, S.H.; Lee, D.S.; Kim, B.; Choi, Y.J.; Yoo, J.S. Gene rearrangements in the mitochondrial genome of robust tonguefish, Cynoglossus robustus (Pleuronectiformes: Cynoglossidae) and a comparative analysis with other Cynoglossus fishes. Mitochondrial DNA Part B 2019, 5, 353–354. [Google Scholar] [CrossRef] [Green Version]
- Wang, C.; Liu, M.; Tian, S.; Yang, C.; Chen, X. The complete mitochondrial genome of Cynoglossus roulei (Pleuronectiformes: Cynoglossidae): Novel rearrangement and phylogenetic position analysis. Mitochondrial DNA Part B 2020, 5, 1439–1440. [Google Scholar] [CrossRef]
- Shi, W.; Gong, L.; Kong, X.Y. The complete mitochondrial genome sequence of Cynoglossus abbreviatus (Pleuronectiformes: Cynoglossidae) with control region translocation and tRNA-Gln gene inversion. Mitochondrial DNA A DNA Mapp. Seq. Anal. 2016, 27, 2157–2158. [Google Scholar] [PubMed]
- Shi, W.; Li, D.H.; Kong, X.Y. Gene rearrangements in the mitochondrial genome of Cynoglossus bilineatus (Pleuronectiformes: Cynoglossidae). Mitochondrial DNA A DNA Mapp. Seq. Anal. 2016, 27, 2161–2162. [Google Scholar] [PubMed]
- Wei, M.; Liu, Y.; Guo, H.; Zhao, F.; Chen, S. Characterization of the complete mitochondrial genome of Cynoglossus gracilis and a comparative analysis with other Cynoglossinae fishes. Gene 2016, 591, 369–375. [Google Scholar] [CrossRef]
- Yang, M.; Shi, W.; Miao, X.G.; Kong, X.Y. The complete mitochondrial genome of Cynoglossus puncticeps (Pleuronectiformes: Cynoglossidae). Mitochondrial DNA A DNA Mapp. Seq. Anal. 2016, 27, 1233–1234. [Google Scholar] [CrossRef]
- Zhang, B.; Jia, L.; Liu, K.; Sun, J. The complete mitochondrial genome of Cynoglossus joyneri and its novel rearrangenment. Mitochondrial DNA Part B 2017, 2, 581–582. [Google Scholar]
- Tian, S.L.; Wang, C.; Yan, Y.R.; Chen, X. Characterization of the complete mitochondrial genome of Cynoglossus nanhaiensis (Pleuronectiformes: Cynoglossidae). Mitochondrial DNA Part B 2020, 5, 2613–2614. [Google Scholar] [CrossRef]
- Zealous, G.F.; Kim, N.; Andriyono, S.; Kim, H.W. Characterization of the mitogenome of Cynoglossus Senegalensis (Pleuronectiformes: Cynoglossidae). Mitochondrial DNA Part B 2018, 3, 1191–1192. [Google Scholar] [CrossRef] [Green Version]
- Shi, W.; Jiang, J.X.; Miao, X.G.; Kong, X.Y. The complete mitochondrial genome sequence of Cynoglossus sinicus (Pleuronectiformes: Cynoglossidae). Mitochondrial DNA. 2015, 26, 865–866. [Google Scholar] [CrossRef]
- Mu, X.; Wang, X.; Liu, Y.; Song, H.; Liu, C.; Gu, D.; Wei, H.; Luo, J.; Hu, Y. An unusual mitochondrial genome structure of the tonguefish, Cynoglossus trigrammus: Control region translocation and a long additional non-coding region inversion. Gene 2015, 573, 216–224. [Google Scholar] [CrossRef]
- Shi, W.; Yang, M.; Si, L.; Li, D.; Kong, X.Y. The complete mitochondrial genome of Cynoglossus zanzibarensis (Pleuronectiformes: Cynoglossidae). Mitochondrial DNA A DNA Mapp. Seq. Anal. 2016, 27, 2172–2173. [Google Scholar] [PubMed]
- Li, D.H.; Shi, W.; Gong, L.; Yang, M.; Kong, X.Y. The complete mitochondrial genome of Paraplagusia blochii (Pleuronectiformes: Cynoglossidae). Mitochondrial DNA A DNA Mapp. Seq. Anal. 2016, 27, 92–93. [Google Scholar] [CrossRef] [PubMed]
- Gong, L.; Shi, W.; Wang, Z.M.; Miao, X.G.; Kong, X.Y. Control region translocation and a tRNA gene inversion in the mitogenome of Paraplagusia japonica (Pleuronectiformes: Cynoglossidae). Mitochondrial DNA 2013, 24, 671–673. [Google Scholar] [CrossRef] [PubMed]
- Wang, S.Y.; Shi, W.; Wang, Z.M.; Gong, L.; Kong, X.Y. The complete mitochondrial genome sequence of Aesopia cornuta (Pleuronectiformes: Soleidae). Mitochondrial DNA 2015, 26, 114–115. [Google Scholar] [CrossRef] [PubMed]
- Chen, X.; Ai, W.; Peng, X.; Xiang, D.; Huang, X. Complete mitochondrial genome of milk sole fish Aseraggodes kobensis (Pleuronectiformes: Soleidae). Mitochondrial DNA A DNA Mapp. Seq. Anal. 2016, 27, 626–627. [Google Scholar] [CrossRef]
- Chen, X.; Ai, W.; Shi, X.; Pan, L. Complete mitogenome of the oriental sole Brachirus orientalis. Mitochondrial DNA A DNA Mapp. Seq. Anal. 2016, 27, 527–528. [Google Scholar] [CrossRef]
- Shi, W.; Jiang, J.X.; Miao, X.G.; Kong, X.Y. The complete mitochondrial genome sequence of Heteromycteris japonicus (Pleuronectiformes: Soleidae). Mitochondrial DNA. 2014, 25, 257–258. [Google Scholar] [CrossRef]
- Gong, L.; Shi, W.; Wang, S.Y.; Kong, X.Y. The complete mitochondrial genome of Liachirus melanospilos (Pleuronectiformes: Soleidae). Mitochondrial DNA 2015, 26, 732–733. [Google Scholar] [CrossRef]
- Chen, X.; Ai, W.; Xiang, D.; Shi, X.; Pan, L. Complete mitogenome of the peacock sole Pardachirus pavoninus (Pleuronectiformes: Soleidae). Mitochondrial DNA A DNA Mapp. Seq. Anal. 2016, 27, 463–464. [Google Scholar] [CrossRef]
- Chen, X.; Ai, W.; Xiang, D.; Shi, X.; Pan, L. The complete mitochondrial genome of the wavyband sole Pseudaesopia japonica (Pleuronectiformes: Soleidae). Mitochondrial DNA A DNA Mapp. Seq. Anal. 2016, 27, 420–421. [Google Scholar] [CrossRef]
- Shi, W.; Gong, L.; Wang, S.Y.; Kong, X.Y. The complete mitochondrial genome of Solea ovata (Pleuronectiformes: Soleidae). Mitochondrial DNA 2014, 25, 454–455. [Google Scholar] [CrossRef] [PubMed]
- Gong, L.; Si, L.Z.; Wei, S.; Kong, X.Y. The complete mitochondrial genome of Zebrias crossolepis (Pleuronectiformes: Soleidae). Mitochondrial DNA A DNA Mapp. Seq. Anal. 2016, 27, 1235–1236. [Google Scholar] [CrossRef] [PubMed]
- Li, D.H.; Shi, W.; Miao, X.G.; Kong, X.Y. The complete mitochondrial genome of Zebrias quagga (Pleuronectiformes: Soleidae). Mitochondrial DNA A DNA Mapp. Seq. Anal. 2016, 27, 1125–1126. [Google Scholar] [CrossRef] [PubMed]
- Wang, Z.M.; Shi, W.; Jiang, J.X.; Wang, S.Y.; Miao, X.G.; Huang, L.M.; Kong, X.Y. The complete mitochondrial genome of a striped sole Zebrias zebrinus (Pleuronectiformes: Soleidae). Mitochondrial DNA 2013, 24, 633–635. [Google Scholar] [CrossRef] [PubMed]
- Moritz, C.; Dowling, T.E.; Brown, W.M. Evolution of animal mitochondrial DNA: Relevance for population biology and systematics. Annu. Rev. Ecol. Syst. 1987, 18, 269–292. [Google Scholar] [CrossRef]
- Lavrov, D.V.; Boore, J.L.; Brown, W.M. Complete mtDNA sequences of two millipedes suggest a new model for mitochondrial gene rearrangements: Duplication and non random loss. Mol. Biol. Evol. 2002, 19, 163–169. [Google Scholar] [CrossRef] [Green Version]
- Dowton, M.; Campbell, N.J. Intramitochondrial recombination-is it why some mitochondrial genes sleep around? Trends Ecol. Evol. 2001, 16, 269–271. [Google Scholar] [CrossRef]
- Campbell, M.A.; Chen, W.J.; Lopez, J.A. Are flatfishes (Pleuronectiformes) monophyletic? Mol. Phylogenet. Evol. 2013, 69, 664–673. [Google Scholar] [CrossRef] [Green Version]
- Van Der Laan, R.; Eschmeyer, W.N.; Fricke, R. Family-group names of Recent fishes. Zootaxa 2014, 3882, 1–230. [Google Scholar] [CrossRef] [Green Version]
- Chen, D.; Liu, Y.; Davison, G.; Li, Y.D.; Gao, S.; Hu, J.; Li, S.H.; Zhang, Z. Disentangling the evolutionary history and biogeography of hill partridges (Phasianidae, Arborophila) from low coverage shotgun sequences. Mol. Phylogenet. Evol. 2020, 151, 106895. [Google Scholar] [CrossRef]
- Sambrook, J.; Fritsch, E.F.; Maniatis, T. Molecular Cloning. A Laboratorymanual; Cold Spring Harbor Laboratory Press: New York, NY, USA, 1989. [Google Scholar]
- Chen, X.; Ai, W.; Ye, L.; Wang, X.; Lin, C.; Yang, S. The complete mitochondrial genome of the grey bamboo shark (Chiloscyllium griseum) (Orectolobiformes: Hemiscylliidae): Genomic characterization and phylogenetic application. Acta Oceanol. Sin. 2013, 32, 59–65. [Google Scholar] [CrossRef]
- Laslett, D.; Canback, B. ARWEN: A program to detect tRNA genes in metazoan mitochondrial nucleotide sequences. Bioinformatics 2008, 24, 172–175. [Google Scholar] [CrossRef] [PubMed] [Green Version]
- Lowe, T.M.; Chan, P.P. tRNAscan-SE On-line: Search and Contextual Analysis of Transfer RNA Genes. Nucl Acids Res. 2016, 44, 54–57. [Google Scholar] [CrossRef] [PubMed]
- Grant, J.R.; Stothard, P. The CGView Server: A comparative genomics tool for circular genomes. Nucleic Acids Res. 2008, 36, 181–184. [Google Scholar] [CrossRef]
- Kumar, S.; Stecher, G.; Tamura, K. MEGA7: Molecular Evolutionary Genetics Analysis Version 7.0 for Bigger Datasets. Mol. Biol. Evol. 2016, 33, 1870–1874. [Google Scholar] [CrossRef] [Green Version]
- Perna, N.T.; Kocher, T.D. Patterns of Nueleotide Composition at Fourfold Degenerate Sites of Animal Mitochondrial Genomes. J. Mol. Evol. 1995, 41, 353–358. [Google Scholar] [CrossRef]
- Katoh, K.; Standley, D.M. MAFFT multiple sequence alignment software version 7: Improvements in performance and usability. Mol. Biol. Evol. 2013, 30, 772–780. [Google Scholar] [CrossRef] [Green Version]
- Talavera, G.; Castresana, J. Improvement of phylogenies after removing divergent and ambiguously aligned blocks from protein sequence alignments. Syst. Biol. 2007, 56, 564–577. [Google Scholar] [CrossRef] [Green Version]
- Lanfear, R.; Frandsen, P.B.; Wright, A.M.; Senfeld, T.; Calcott, B. PartitionFinder 2: New methods for selecting partitioned models of evolution formolecular and morphological phylogenetic analyses. Mol. Biol. Evol. 2016, 34, 772–773. [Google Scholar] [CrossRef] [Green Version]
- Kalyaanamoorthy, S.; Minh, B.Q.; Wong, T.K.F.; von Haeseler, A.; Jermiin, L.S. ModelFinder: Fast model selection for accurate phylogenetic estimates. Nat. Methods 2017, 14, 587–589. [Google Scholar] [CrossRef] [Green Version]
- Zhang, D.; Gao, F.; Jakovlic, I.; Zhou, H.; Zhang, J.; Li, W.X.; Wang, G.T. PhyloSuite: An integrated and scalable desktop platform for streamlined molecular sequence data management and evolutionary phylogenetics studies. Mol. Ecol. Resour. 2020, 20, 348–355. [Google Scholar] [CrossRef] [PubMed]
- Anisimova, M.; Gil, M.; Dufayard, J.F.; Dessimoz, C.; Gascuel, O. Survey of branch support methods demonstrates accuracy, power, and robustness of fast likelihood-based approximation schemes. Syst. Biol. 2011, 60, 685–699. [Google Scholar] [CrossRef] [PubMed]
- Ronquist, F.; Teslenko, M.; van der Mark, P.; Ayres, D.L.; Darling, A.; Hohna, S.; Larget, B.; Liu, L.; Suchard, M.A.; Huelsenbeck, J.P. MrBayes 3.2: Efficient Bayesian phylogenetic inference and model choice across a large model space. Syst. Biol. 2012, 61, 539–542. [Google Scholar] [CrossRef] [PubMed] [Green Version]
- Nguyen, L.T.; Schmidt, H.A.; von Haeseler, A.; Minh, B.Q. IQ-TREE: A fast and effective stochastic algorithm for estimating maximum-likelihood phylogenies. Mol. Biol. Evol. 2015, 32, 268–274. [Google Scholar] [CrossRef]
- Minh, B.Q.; Nguyen, M.A.; von Haeseler, A. Ultrafast approximation for phylogenetic bootstrap. Mol. Biol. Evol. 2013, 30, 1188–1195. [Google Scholar] [CrossRef]
- Guindon, S.; Dufayard, J.F.; Lefort, V.; Anisimova, M.; Hordijk, W.; Gascuel, O. New algorithm for estimating maximum-likelihood phylogenies. Mol. Biol. Evol. 2010, 32, 268–274. [Google Scholar]
- Letunic, I.; Bork, P. Interactive tree of life (iTOL) v3: An online tool for the display and annotation of phylogenetic and other trees. Nucleic Acids Res. 2016, 44, 242–245. [Google Scholar] [CrossRef]
- Suchard, M.A.; Lemey, P.; Baele, G.; Ayres, D.L.; Drummond, A.J.; Rambaut, A. Bayesian phylogenetic and phylodynamic data integration using BEAST 1.10. Virus Evol. 2018, 4, vey016. [Google Scholar] [CrossRef] [Green Version]
- Kumar, S.; Stecher, G.; Suleski, M.; Hedges, S.B. TimeTree: A resource for timelines, timetrees, and divergence time. Mol. Biol. Evol. 2017, 34, 1812–1819. [Google Scholar] [CrossRef]
- Betancur, R.; Orti, G.; Pyron, R.A. Fossil-based comparative analyses reveal ancient marine ancestry erased by extinction in ray-finned fishes. Ecol. Lett. 2015, 18, 441–450. [Google Scholar] [CrossRef]
- Rambaut, A.; Drummond, A.J.; Xie, D.; Baele, G.; Suchard, M.A. Posterior Summarization in Bayesian Phylogenetics Using Tracer 1.7. Syst. Biol. 2018, 67, 901–904. [Google Scholar] [CrossRef] [PubMed] [Green Version]


| Family | Genus | Species | Length (bp) | Accession ID | Reference |
|---|---|---|---|---|---|
| Cynoglossidae | Cynoglossus | Cynoglossus abbreviatus | 16,417 | JQ349004 | [23] |
| Cynoglossus bilineatus | 16,454 | JQ349000 | [24] | ||
| Cynoglossus gracilis | 16,565 | KT809367 | [25] | ||
| Cynoglossus interruptus | 17,262 | LC482306 | [20] | ||
| Cynoglossus itinus | 16,915 | JQ639062 | Unpublished | ||
| Cynoglossus joyneri | 16,428 | NC030256 | [27] | ||
| Cynoglossus monopus | 16,425 | MT798589 | This study | ||
| Cynoglossus nanhaiensis | 17,130 | MT117229 | [28] | ||
| Cynoglossus puncticeps | 17,142 | JQ349003 | [26] | ||
| Cynoglossus robustus | 16,720 | LC482305 | [21] | ||
| Cynoglossus roulei | 16,565 | MN966658 | [22] | ||
| Cynoglossus semilaevis | 16,731 | EU366230 | [19] | ||
| Cynoglossus senegalensis | 16,519 | MH709122 | [29] | ||
| Cynoglossus sinicus | 16,478 | JQ348998 | [30] | ||
| Cynoglossus trigrammus | 18,369 | KP057581 | [31] | ||
| Cynoglossus zanzibarensis | 16,569 | KJ433559 | [32] | ||
| Paraplagusia | Paraplagusia bilineata | 16,985 | NC023227 | Unpublished | |
| Paraplagusia blochii | 16,611 | JQ349002 | [33] | ||
| Paraplagusia japonica | 16,694 | JQ639066 | [34] | ||
| Soleidae | Aesopia | Aesopia cornuta | 16,737 | KF000065 | [35] |
| Aseraggodes | Aseraggodes kobensis | 16,944 | KJ601760 | [36] | |
| Brachirus | Brachirus orientalis | 16,600 | KJ513134 | [37] | |
| Heteromycteris | Heteromycteris japonicus | 17,111 | JQ639060 | [38] | |
| Liachirus | Liachirus melanospilos | 17,001 | KF573188 | [39] | |
| Pardachirus | Pardachirus pavoninus | 16,573 | KJ461620 | [40] | |
| Pseudaesopia | Pseudaesopia japonica | 16,789 | KJ433482 | [41] | |
| Solea | Solea ovata | 16,782 | KF142459 | [42] | |
| Solea senegalensis | 16,659 | AB270760 | [18] | ||
| Zebrias | Zebrias crossolepis | 16,734 | KJ433564 | [43] | |
| Zebrias quagga | 17,045 | NC023225 | [44] | ||
| Zebrias zebra | 16,758 | JQ700100 | [45] | ||
| Zebrias zebrinus | 16,762 | KC491209 | Unpublished | ||
| Paralichthyidae | Paralichthys | Paralichthys olivaceus | 17,090 | NC002386 | Unpublished |
| Psettodidae | Psettodes | Psettodes erumei | 17,315 | FJ606835 | Unpublished |
| Gene | Strand | Position | Size (bp) | Amino Acids (aa) | Codon | Anti-Codon | Intergenic Nucleotides (bp) | ||
|---|---|---|---|---|---|---|---|---|---|
| From | To | Start | Stop | ||||||
| tRNA-Phe | H | 1 | 68 | 68 | GAA | 0 | |||
| 12S rRNA | H | 69 | 1014 | 946 | 0 | ||||
| tRNA-Val | H | 1015 | 1087 | 73 | TAC | 0 | |||
| 16S rRNA | H | 1088 | 2789 | 1702 | 0 | ||||
| tRNA-Leu | H | 2790 | 2859 | 70 | TAA | 0 | |||
| ND1 | H | 2860 | 3834 | 975 | 324 | ATG | TAA | 0 | |
| Control region | H | 3835 | 4570 | 736 | 0 | ||||
| tRNA-Gln | H | 4571 | 4643 | 73 | GAT | 0 | |||
| tRNA-Ile | H | 4649 | 4717 | 69 | TTG | 5 | |||
| tRNA-Met | H | 4724 | 4793 | 70 | CAT | 6 | |||
| ND2 | H | 4795 | 5838 | 1044 | 347 | ATG | TAA | 1 | |
| tRNA-Trp | H | 5838 | 5905 | 68 | TCA | −1 | |||
| tRNA-Ala | L | 5908 | 5976 | 69 | TGC | 2 | |||
| tRNA-Asn | L | 5979 | 6051 | 73 | GTT | 2 | |||
| OL | L | 6056 | 6079 | 24 | 4 | ||||
| tRNA-Cys | L | 6086 | 6150 | 65 | GCA | 6 | |||
| tRNA-Tyr | L | 6151 | 6218 | 68 | GTA | 0 | |||
| COI | H | 6220 | 7770 | 1551 | 516 | GTG | TAA | 1 | |
| tRNA-Ser | L | 7771 | 7841 | 71 | TGA | 0 | |||
| tRNA-Asp | H | 7844 | 7912 | 69 | GTC | 2 | |||
| COII | H | 7914 | 8604 | 691 | 230 | ATG | T | 1 | |
| tRNA-Lys | H | 8605 | 8680 | 76 | TTT | 0 | |||
| ATP8 | H | 8683 | 8847 | 165 | 54 | ATG | TAA | 2 | |
| ATP6 | H | 8838 | 9521 | 684 | 227 | ATG | TAA | −10 | |
| COIII | H | 9521 | 10,306 | 786 | 261 | ATG | TAA | −1 | |
| tRNA-Gly | H | 10,306 | 10,375 | 70 | TCC | −1 | |||
| ND3 | H | 10,376 | 10,726 | 351 | 116 | ATG | TAA | 0 | |
| tRNA-Arg | H | 10,725 | 10,793 | 69 | TCG | −2 | |||
| ND4L | H | 10,794 | 11,090 | 297 | 98 | ATG | TAA | 0 | |
| ND4 | H | 11,084 | 12,448 | 1365 | 454 | ATG | TAA | −7 | |
| tRNA-His | H | 12,456 | 12,524 | 69 | GTG | 9 | |||
| tRNA-Ser | H | 12,525 | 12,592 | 68 | GCT | 0 | |||
| tRNA-Leu | H | 12,595 | 12,667 | 73 | TAG | 2 | |||
| ND5 | H | 12,671 | 14,524 | 1854 | 617 | ATG | TAA | 3 | |
| ND6 | L | 14,530 | 15,051 | 522 | 183 | ATG | TAG | 5 | |
| tRNA-Glu | L | 15,052 | 15,120 | 69 | TTC | 0 | |||
| Cytb | H | 15,123 | 16,259 | 1137 | 378 | ATG | TAG | 2 | |
| tRNA-Thr | H | 16,263 | 16,331 | 69 | TGT | 3 | |||
| tRNA-Pro | L | 16,331 | 16,401 | 71 | TGG | −1 | |||
| Noncoding region | H | 16,402 | 16,425 | 24 | 0 | ||||
| Regions | Size (bp) | Nucleotides Composition (%) | AT-Skew | GC-Skew | |||||
|---|---|---|---|---|---|---|---|---|---|
| T | C | A | G | AT | GC | ||||
| Whole genome | 16,425 | 30.39 | 24.04 | 30.80 | 14.77 | 61.19 | 38.81 | 0.01 | −0.24 |
| PCGs | 11,422 | 32.38 | 25.03 | 28.38 | 14.21 | 60.76 | 39.24 | −0.07 | −0.28 |
| 1st codon position | 3808 | 24.91 | 24.52 | 27.10 | 23.46 | 52.02 | 47.98 | 0.04 | −0.02 |
| 2nd codon position | 3807 | 42.10 | 26.48 | 18.15 | 13.27 | 60.25 | 39.75 | −0.40 | −0.33 |
| 3rd codon position | 3807 | 30.94 | 24.06 | 38.92 | 6.08 | 69.86 | 30.14 | 0.11 | −0.60 |
| ATP6 | 684 | 30.85 | 31.43 | 27.49 | 10.23 | 58.33 | 41.67 | −0.06 | −0.51 |
| ATP8 | 165 | 32.73 | 25.45 | 33.94 | 7.88 | 66.67 | 33.33 | 0.02 | −0.53 |
| COI | 1551 | 31.72 | 23.86 | 26.69 | 17.73 | 58.41 | 41.59 | −0.09 | −0.15 |
| COII | 691 | 32.27 | 22.43 | 30.39 | 14.91 | 62.66 | 37.34 | −0.03 | −0.20 |
| COIII | 786 | 30.53 | 27.35 | 25.83 | 16.28 | 56.36 | 43.64 | −0.08 | −0.25 |
| Cytb | 1137 | 34.21 | 25.77 | 26.30 | 13.72 | 60.51 | 39.49 | −0.13 | −0.31 |
| ND1 | 975 | 32.51 | 24.62 | 28.41 | 14.46 | 60.92 | 39.08 | −0.07 | −0.26 |
| ND2 | 1044 | 31.90 | 26.44 | 31.32 | 10.34 | 63.22 | 36.78 | −0.01 | −0.44 |
| ND3 | 351 | 32.76 | 26.21 | 27.35 | 13.68 | 60.11 | 39.89 | −0.09 | −0.31 |
| ND4 | 1365 | 32.60 | 24.62 | 30.26 | 12.53 | 62.86 | 37.14 | −0.04 | −0.33 |
| ND4L | 297 | 29.97 | 29.29 | 24.24 | 16.50 | 54.21 | 45.79 | −0.11 | −0.28 |
| ND5 | 1854 | 31.01 | 25.57 | 30.91 | 12.51 | 61.92 | 38.08 | 0.00 | −0.34 |
| ND6 | 522 | 41.38 | 12.26 | 21.65 | 24.71 | 63.03 | 36.97 | −0.31 | 0.34 |
| tRNAs | 1540 | 30.19 | 17.92 | 30.91 | 20.97 | 61.10 | 38.90 | 0.01 | 0.08 |
| rRNAs | 2648 | 25.11 | 20.85 | 35.31 | 18.73 | 60.42 | 39.58 | 0.17 | −0.05 |
| Control region | 736 | 35.87 | 17.66 | 35.05 | 11.41 | 70.92 | 29.08 | −0.01 | −0.21 |
© 2020 by the authors. Licensee MDPI, Basel, Switzerland. This article is an open access article distributed under the terms and conditions of the Creative Commons Attribution (CC BY) license (http://creativecommons.org/licenses/by/4.0/).
Share and Cite
Wang, C.; Chen, H.; Tian, S.; Yang, C.; Chen, X. Novel Gene Rearrangement and the Complete Mitochondrial Genome of Cynoglossus monopus: Insights into the Envolution of the Family Cynoglossidae (Pleuronectiformes). Int. J. Mol. Sci. 2020, 21, 6895. https://0-doi-org.brum.beds.ac.uk/10.3390/ijms21186895
Wang C, Chen H, Tian S, Yang C, Chen X. Novel Gene Rearrangement and the Complete Mitochondrial Genome of Cynoglossus monopus: Insights into the Envolution of the Family Cynoglossidae (Pleuronectiformes). International Journal of Molecular Sciences. 2020; 21(18):6895. https://0-doi-org.brum.beds.ac.uk/10.3390/ijms21186895
Chicago/Turabian StyleWang, Chen, Hao Chen, Silin Tian, Cheng Yang, and Xiao Chen. 2020. "Novel Gene Rearrangement and the Complete Mitochondrial Genome of Cynoglossus monopus: Insights into the Envolution of the Family Cynoglossidae (Pleuronectiformes)" International Journal of Molecular Sciences 21, no. 18: 6895. https://0-doi-org.brum.beds.ac.uk/10.3390/ijms21186895