Article

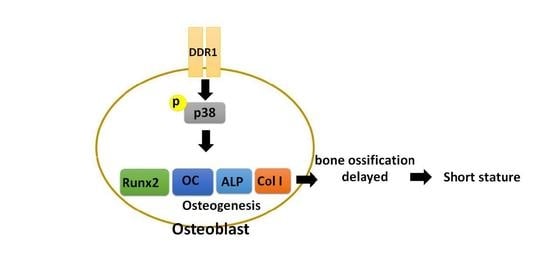
Discoidin Domain Receptor 1 Regulates Runx2 during Osteogenesis of Osteoblasts and Promotes Bone Ossification via Phosphorylation of p38

by
Liang-Yin Chou
1,2,3,
Chung-Hwan Chen
2,3,4,5,6,7,
Shu-Chun Chuang
2,3,
Tsung-Lin Cheng
2,8,9,10,
Yi-Hsiung Lin
11,12,13,
Hsin-Chiao Chou
1,2,3,
Yin-Chih Fu
1,2,3,4,
Yan-Hsiung Wang
2,14 and
Chau-Zen Wang
1,2,3,9,10,*
1
Graduate Institute of Medicine, College of Medicine, Kaohsiung Medical University, Kaohsiung 80708, Taiwan
2
Orthopaedic Research Centre, Kaohsiung Medical University, Kaohsiung 80708, Taiwan
3
Regeneration Medicine and Cell Therapy Research Center, Kaohsiung Medical University, Kaohsiung 80708, Taiwan
4
Department of Orthopedics, College of Medicine, Kaohsiung Medical University, Kaohsiung 80708, Taiwan
5
Department of Orthopedics, Kaohsiung Municipal Ta-Tung Hospital, Kaohsiung Medical University, Kaohsiung 80145, Taiwan
6
Institute of Medical Science and Technology, National Sun Yat-Sen University, Kaohsiung 80424, Taiwan
7
Division of Adult Reconstruction Surgery, Department of Orthopedics, Kaohsiung Medical University Hospital, Kaohsiung Medical University, Kaohsiung 80708, Taiwan
8
Cardiovascular Research Centre, College of Medicine, National Cheng Kung University, Tainan City 70101, Taiwan
9
Department of Physiology, College of Medicine, Kaohsiung Medical University, Kaohsiung 80708, Taiwan
10
Department of Medical Research, Kaohsiung Medical University Hospital, Kaohsiung 80708, Taiwan
11
Department of Biotechnology, Kaohsiung Medical University, Kaohsiung 80708, Taiwan
12
Division of Cardiology, Department of Internal Medicine, Kaohsiung Medical University Hospital, Kaohsiung 80756, Taiwan
13
Lipid Science and Aging Research Center, Kaohsiung Medical University, Kaohsiung 80708, Taiwan
14
School of Dentistry, Kaohsiung Medical University, Kaohsiung 80708, Taiwan
*
Author to whom correspondence should be addressed.
Int. J. Mol. Sci. 2020, 21(19), 7210; https://0-doi-org.brum.beds.ac.uk/10.3390/ijms21197210
Submission received: 14 September 2020 / Revised: 25 September 2020 / Accepted: 26 September 2020 / Published: 29 September 2020
(This article belongs to the Special Issue Bone Development and Regeneration)

Abstract

:
Discoidin domain receptor 1 (Drd1) is a collagen-binding membrane protein, but its role in osteoblasts during osteogenesis remains undefined. We generated inducible osteoblast-specific Ddr1 knockout (OKOΔDdr1) mice; their stature at birth, body weight and body length were significantly decreased compared with those of control Ddr1f/f-4OHT mice. We hypothesize that Ddr1 regulates osteogenesis of osteoblasts. Micro-CT showed that compared to 4-week-old Ddr1f/f-4OHT mice, OKOΔDdr1 mice presented significant decreases in cancellous bone volume and trabecular number and significant increases in trabecular separation. The cortical bone volume was decreased in OKOΔDdr1 mice, resulting in decreased mechanical properties of femurs compared with those of Ddr1f/f-4OHT mice. In femurs of 4-week-old OKOΔDdr1 mice, H&E staining showed fewer osteocytes and decreased cortical bone thickness than Ddr1f/f-4OHT. Osteoblast differentiation markers, including BMP2, Runx2, alkaline phosphatase (ALP), Col-I and OC, were decreased compared with those of control mice. Ddr1 knockdown in osteoblasts resulted in decreased mineralization, ALP activity, phosphorylated p38 and protein levels of BMP2, Runx2, ALP, Col-I and OC during osteogenesis. Overexpression and knockdown of Ddr1 in osteoblasts demonstrated that DDR1 mediates the expression and activity of Runx2 and the downstream osteogenesis markers during osteogenesis through regulation of p38 phosphorylation.

Graphical Abstract

1. Introduction

Bone development is a dynamic process within higher organisms. In mammals, skeletogenesis is a two-step ossification process comprising endochondral ossification and intramembranous ossification. The endochondral ossification process starts with mesenchymal stem cells (MSCs) committing to chondrocytes, in which proliferation, differentiation, hypertrophy, terminal differentiation and apoptosis result in the formation of bone; osteoblasts and osteoclasts comprise the majority of cells in mature bone [1]. By contrast, in the intramembranous ossification process, MSCs in cortical and trabecular bone are directly differentiated into osteoblasts [2] to form flat bone structures, including the skull, clavicle, jaw, sternum, ribs, and collar bone. At the periosteum, osteoprogenitor cells differentiate into osteoblasts and are responsible for mineralization of the bone matrix during bone formation. Runx2 (Runt-related transcription factor 2, also known as Cbf1) is a key regulator during osteoblast differentiation, which induces preosteoblasts to become mature osteoblasts. Specific deletion of Runx2 in osteoblasts leads to defective intramembranous ossification and postnatal bone formation [3,4]. Runx2 regulates the expression of genes at different stages of osteogenesis, such as the early stage during which preosteoblasts commit to osteoblasts by secreting alkaline phosphatase (ALP) and type I collagen (Col-I) and expressing the differentiation marker osteopontin (OPN) and the later stage during which the mature osteoblast markers osteocalcin (OC), which is a calcium binding protein, bone sialo protein (BSP) and matrix metalloproteinase-13 (MMP13) are expressed to promote mineralization [3,4,5,6,7,8,9]. The basic condition of bone growth is the dynamic balance of cartilage and cortical bone formation.
Discoidin domain receptors (DDRs) are a family of receptor tyrosine kinases that includes DDR1 and DDR2, which are transmembrane collagen-binding receptors. DDR1 is commonly expressed in a variety of mice and in humans, and DDR1 gene maps indicate 17 exons at chromosome 6 (6p21.3) in the human genome, which can be expressed as five distinct DDR1 isoforms. However, DDR2 gene maps show 19 exons at chromosome 1 (1q23.3) but only one isoform [10,11]. Fibrillar collagens are ligands for both DDRs; thus far, DDR1 and DDR2 could be activated by collagen, including types I−III, V and X [11,12,13]. In particular, DDR1 also binds type VIII collagen and basement membrane type IV collagen [11]. Global DDR1 knockout in mice causes dwarfism, and the body weight is more decreased than in wild-type mice. Micro-CT results show that the global DDR1 knockout mice are short and thinner in fibular bone but the growth plate length, chondrocyte proliferation and apoptosis are unaltered compare with wild-type mice [10]. However, the mechanism of global Ddr1 knockout that causes dwarfism in mice and whether DDR1 regulates the function of osteoblasts during development remain undefined. DDR1 is also expressed at the periosteal collar of the clavicle in embryonic and postnatal mice [10]. Global Ddr1-null mice have abnormal development in multiple organ systems, which may affect the interpretation of DDR1 function, such as loss of auditory function, lactation impairment, cochlear duct defect, reproduction defects, and proteinuria [11,12,13,14,15]. There are no reports that show the role of Ddr1 in osteoblast function during osteogenesis. Therefore, we firstly created the Ddr1f/f mice, and used the Cre-LoxP system to generate the inducible osteoblast-specific Ddr1 knockout mice (OKOΔDdr1) in this study. Our results showed that there were no other developmental abnormalities compared with global Ddr1 knockout mice. The OKOΔDdr1 mice showed a shorter stature at birth than the control Ddr1f/f-4OHT mice. Therefore, we hypothesize that Ddr1 may play a role in regulating the osteogenesis of osteoblasts. To elucidate the role of Ddr1 in regulating osteoblasts during bone development, we used micro-CT analysis, H&E staining and IHC staining to evaluate the expression of osteoblast differentiation markers in the femurs in the OKOΔDdr1 mice in vivo. We also used an in vitro model of Ddr1 knockdown in osteoblasts, which showed decreased mineralization, ALP activity, levels of phosphorylated p38 and protein levels of BMP2, Runx2, ALP, Col-I and OC during osteogenesis. In this study, by using overexpression and knockdown of Ddr1, we demonstrated that, via p38, DDR1 mediates the expression and activity of Runx2 and the downstream osteogenesis markers OC, Col-I, and ALP during osteogenesis.

2. Results

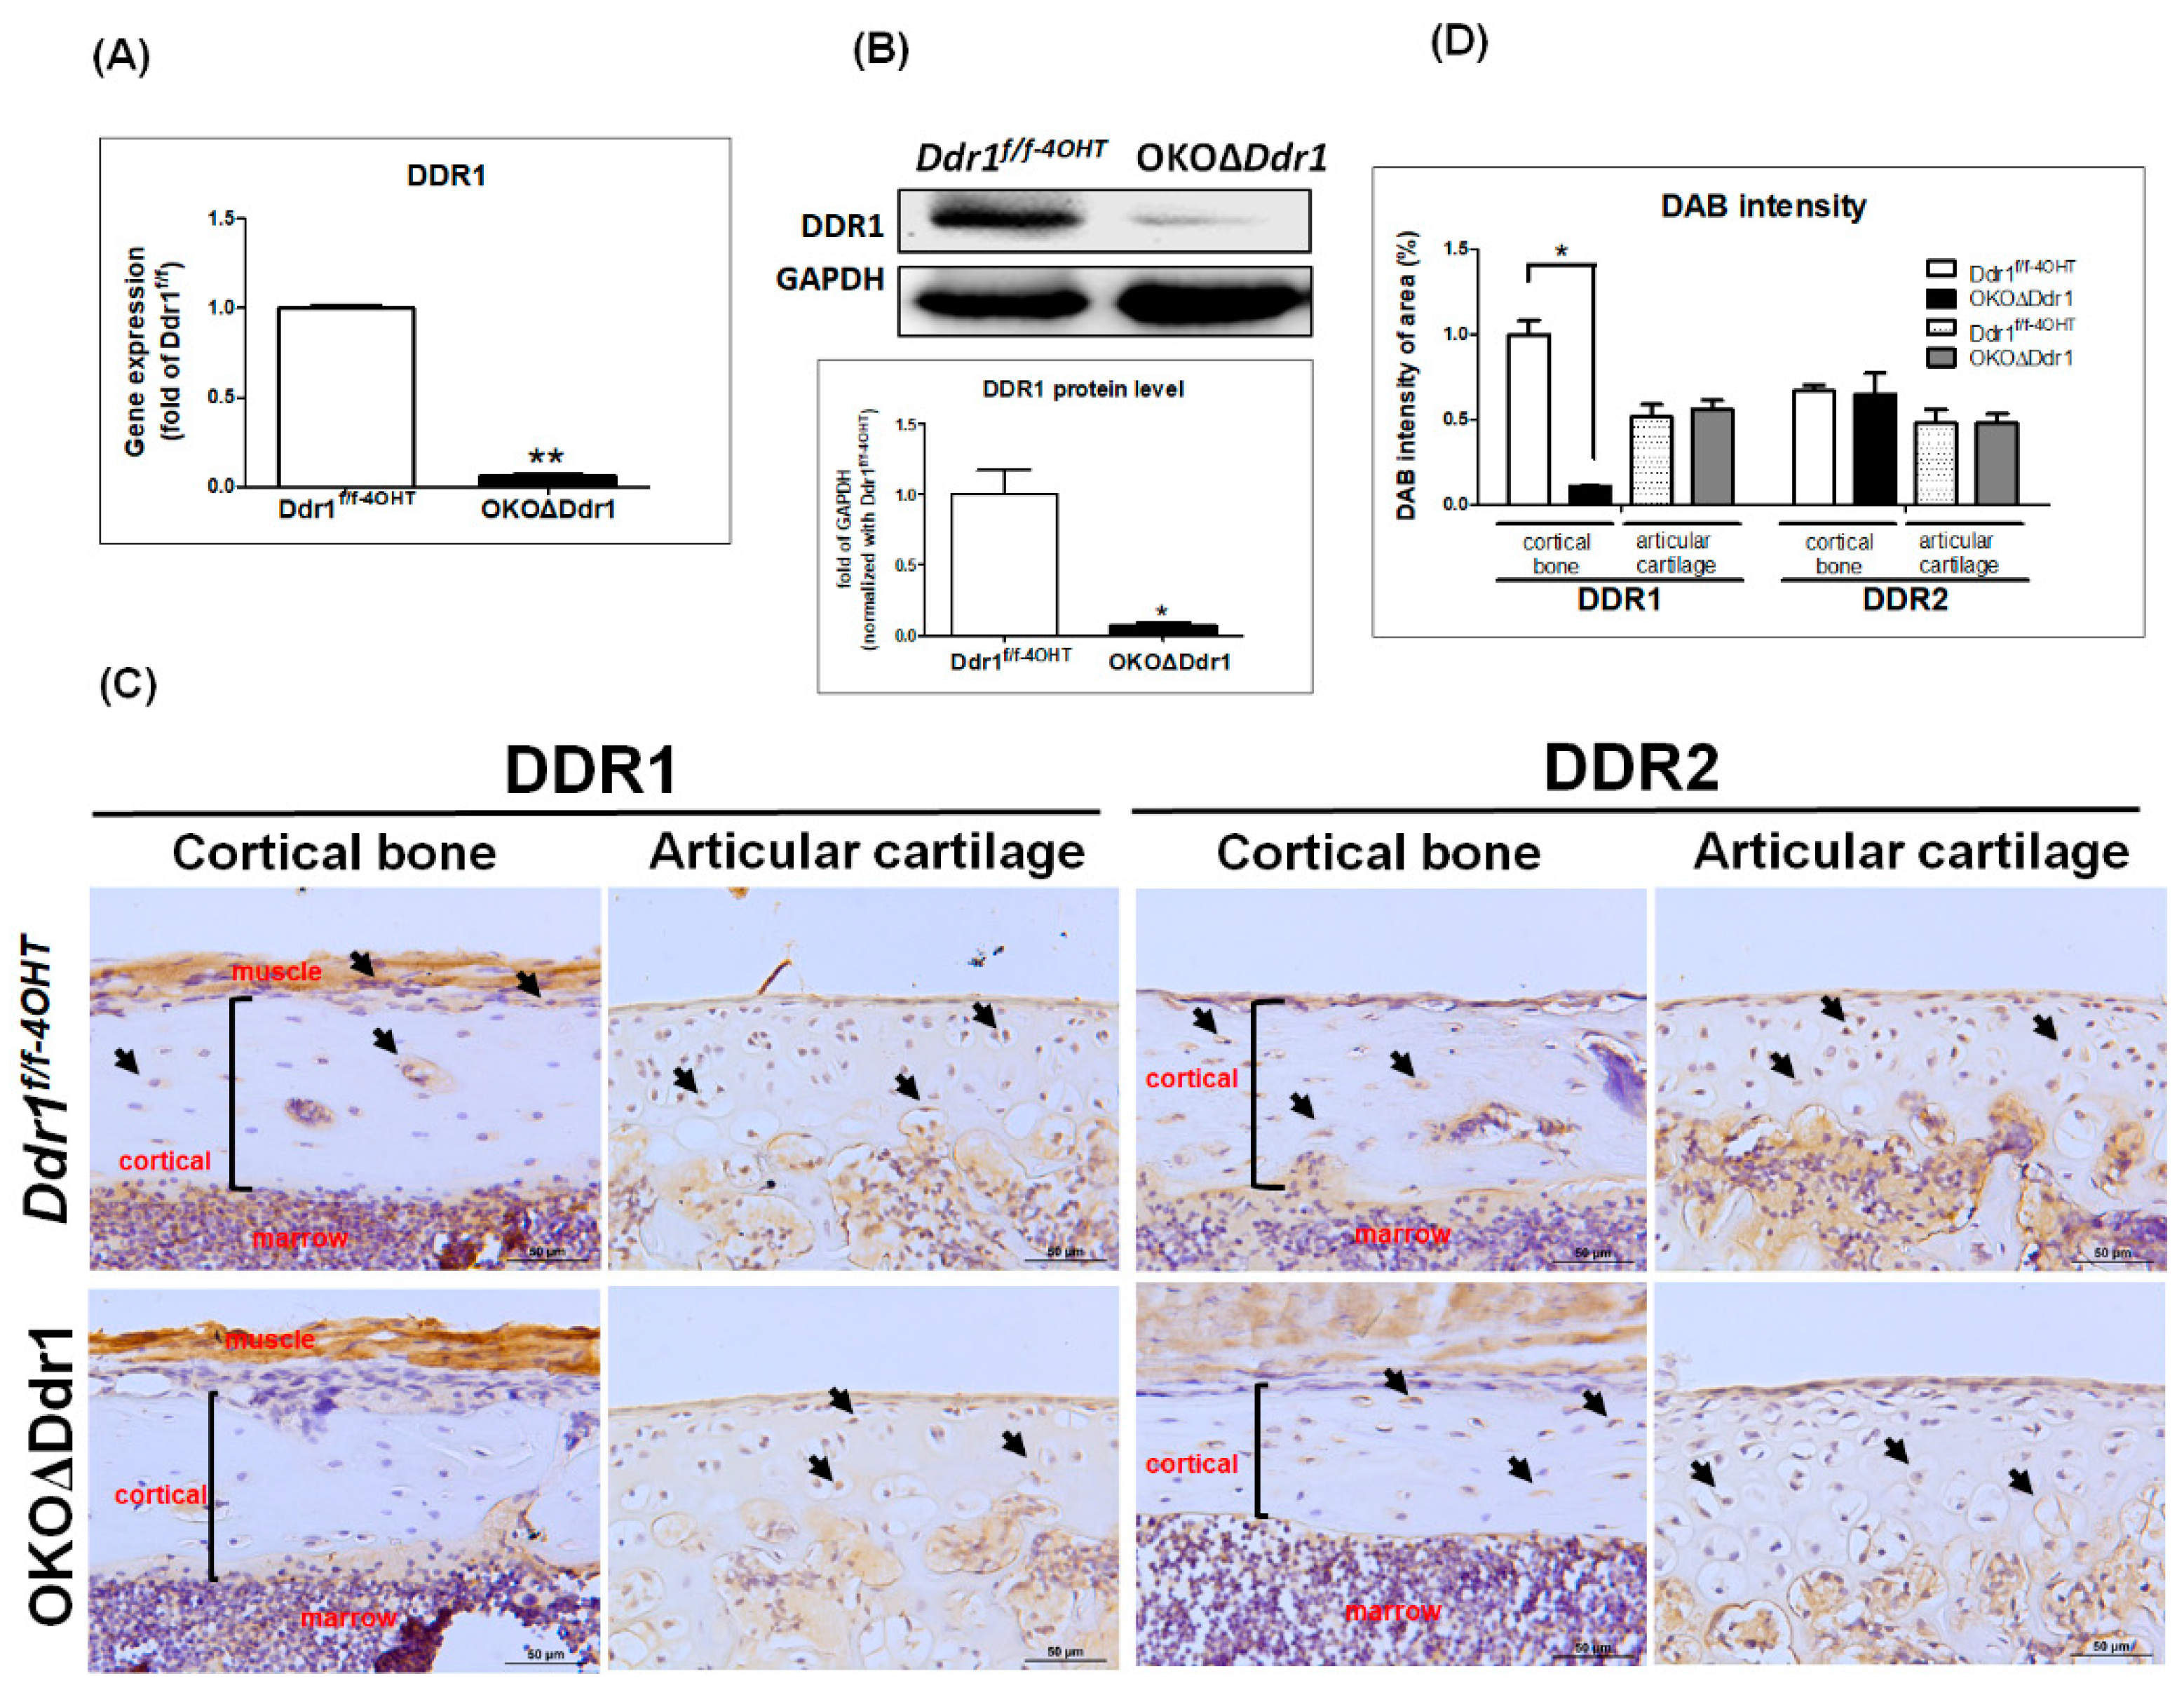
2.1. Generation of Osteoblast-Specific Knockout Mice (a1(I) Collagen-CreERT; Ddr1f/f; OKOΔDdr1 Mice)

To investigate the role of Ddr1 in osteoblasts during bone ossification, we first generated 4-OHT inducible osteoblast-specific Ddr1 knockout (a1(I)-CreERT; Ddr1f/f) mice on the OKO background. To confirm the osteoblast-specific knockout of Ddr1 in OKOΔDdr1 mice, we conducted gene expression, Western blot, and IHC staining assays in Ddr1f/f-4OHT and OKOΔDdr1 mice. The qPCR results showed that the gene expression of Ddr1 in OKOΔDdr1 mice was significantly decreased by approximately 95% compared with that in Ddr1f/f-4OHT mice (Figure 1A). Additionally, the protein level of DDR1 was decreased by approximately 90% in OKOΔDdr1 mice compared with Ddr1f/f-4OHT mice (Figure 1B). To further demonstrate that we specifically knocked out Ddr1 in osteoblasts, we performed IHC staining for DDR1 in the femurs of 4-week-old mice, the results of which showed that DDR1 staining was obvious in the cortical bone, periosteum and articular chondrocytes in Ddr1f/-4OHT mice. However, DDR1 staining was decreased by approximately 90% in cortical bone in OKOΔDdr1 mice but was still observed in articular chondrocytes (Figure 1C,D). By contrast, DDR2 staining in cortical bone and articular chondrocytes was similar in Ddr1f/f-4OHT and OKOΔDdr1 mice and showed no significant quantitative difference (Figure 1C,D). These results indicated that we had succeeded in the creation of osteoblast-specific Ddr1 knockout (OKOΔDdr1) and that this model did not affect the expression of Ddr2, suggesting that there is no compensatory effect of Ddr2 expression. We stained the osteoclasts by TRAP staining, and also immunochemistry stain of TRAcP as an osteoclast marker. The results showed that knockout Ddr1 in osteoblasts had no effect on osteoclast activity and the expression of osteoblasts (S1A, 1B). These results indicated that knockout Ddr1 in osteoblasts would not influence the osteoclast phenotype, and demonstrated the osteoblast-specific Ddr1 knockout in mice.

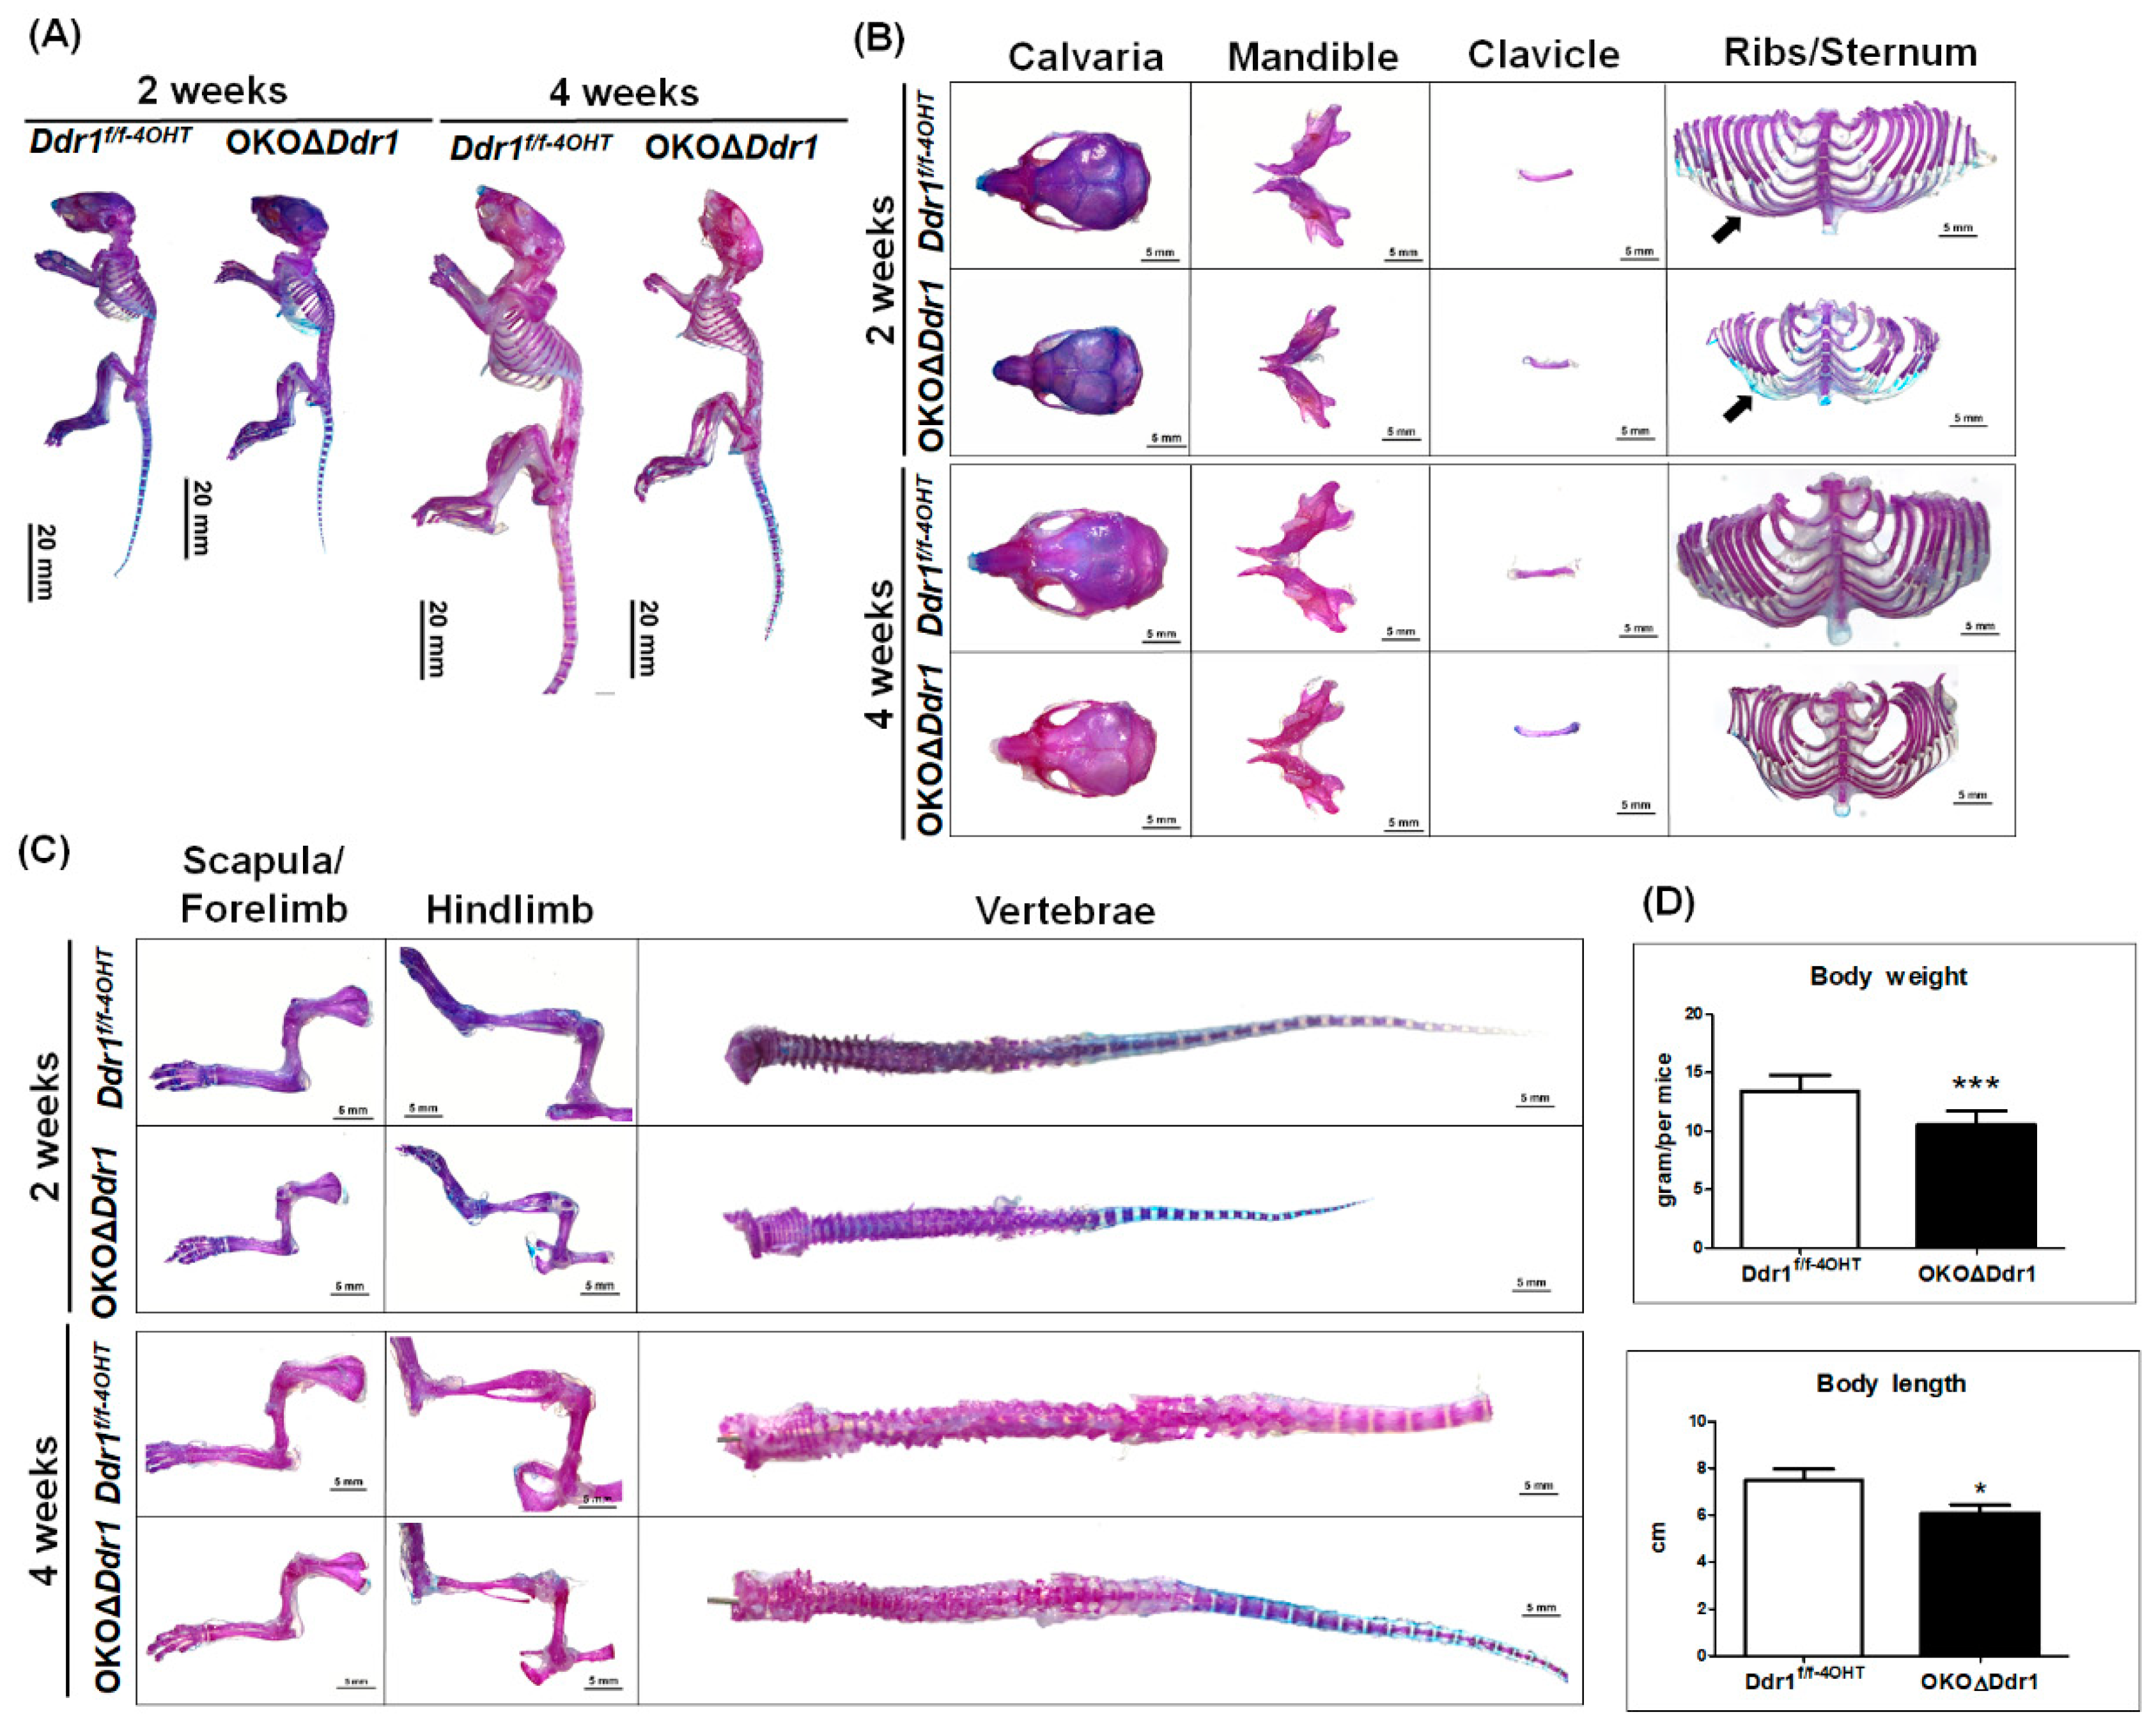
2.2. Skeletal Dysplasia in OKOΔDdr1 Mice

To study the role of Ddr1 in osteoblasts during postnatal skeletal development, we performed double staining of the skeleton with Alizarin red for mineralized matrix (red) and Alcian blue for cartilaginous matrix (blue). Although selectively knocking out Ddr1 in osteoblasts was not embryonic lethal and did not cause structurally significant abnormalities in OKOΔDdr1 mice, the long bones of OKOΔDdr1 mice were thinner than those of Ddr1f/f-4OHT mice (Figure 2A). Knocking out Ddr1 in osteoblasts caused a decrease in the mineralization of the rib/sternum, which is driven by intramembranous ossification to form bones (Figure 2B). We also observed that the length and diameter of endochondral ossification bones (such as forelimb, hindlimb, and vertebrae) were smaller in OKOΔDdr1 mice than in Ddr1f/f-4OHT mice (Figure 2C). At 4 weeks of age, OKOΔDdr1 mice exhibited significantly decreased body weight and body length compared to those of Ddr1f/f-4OHT mice (Figure 2D). These findings indicate that Ddr1 knockout in osteoblasts causes dysplasia, which suggests that DDR1 plays a critical role in osteoblast function during ossification.

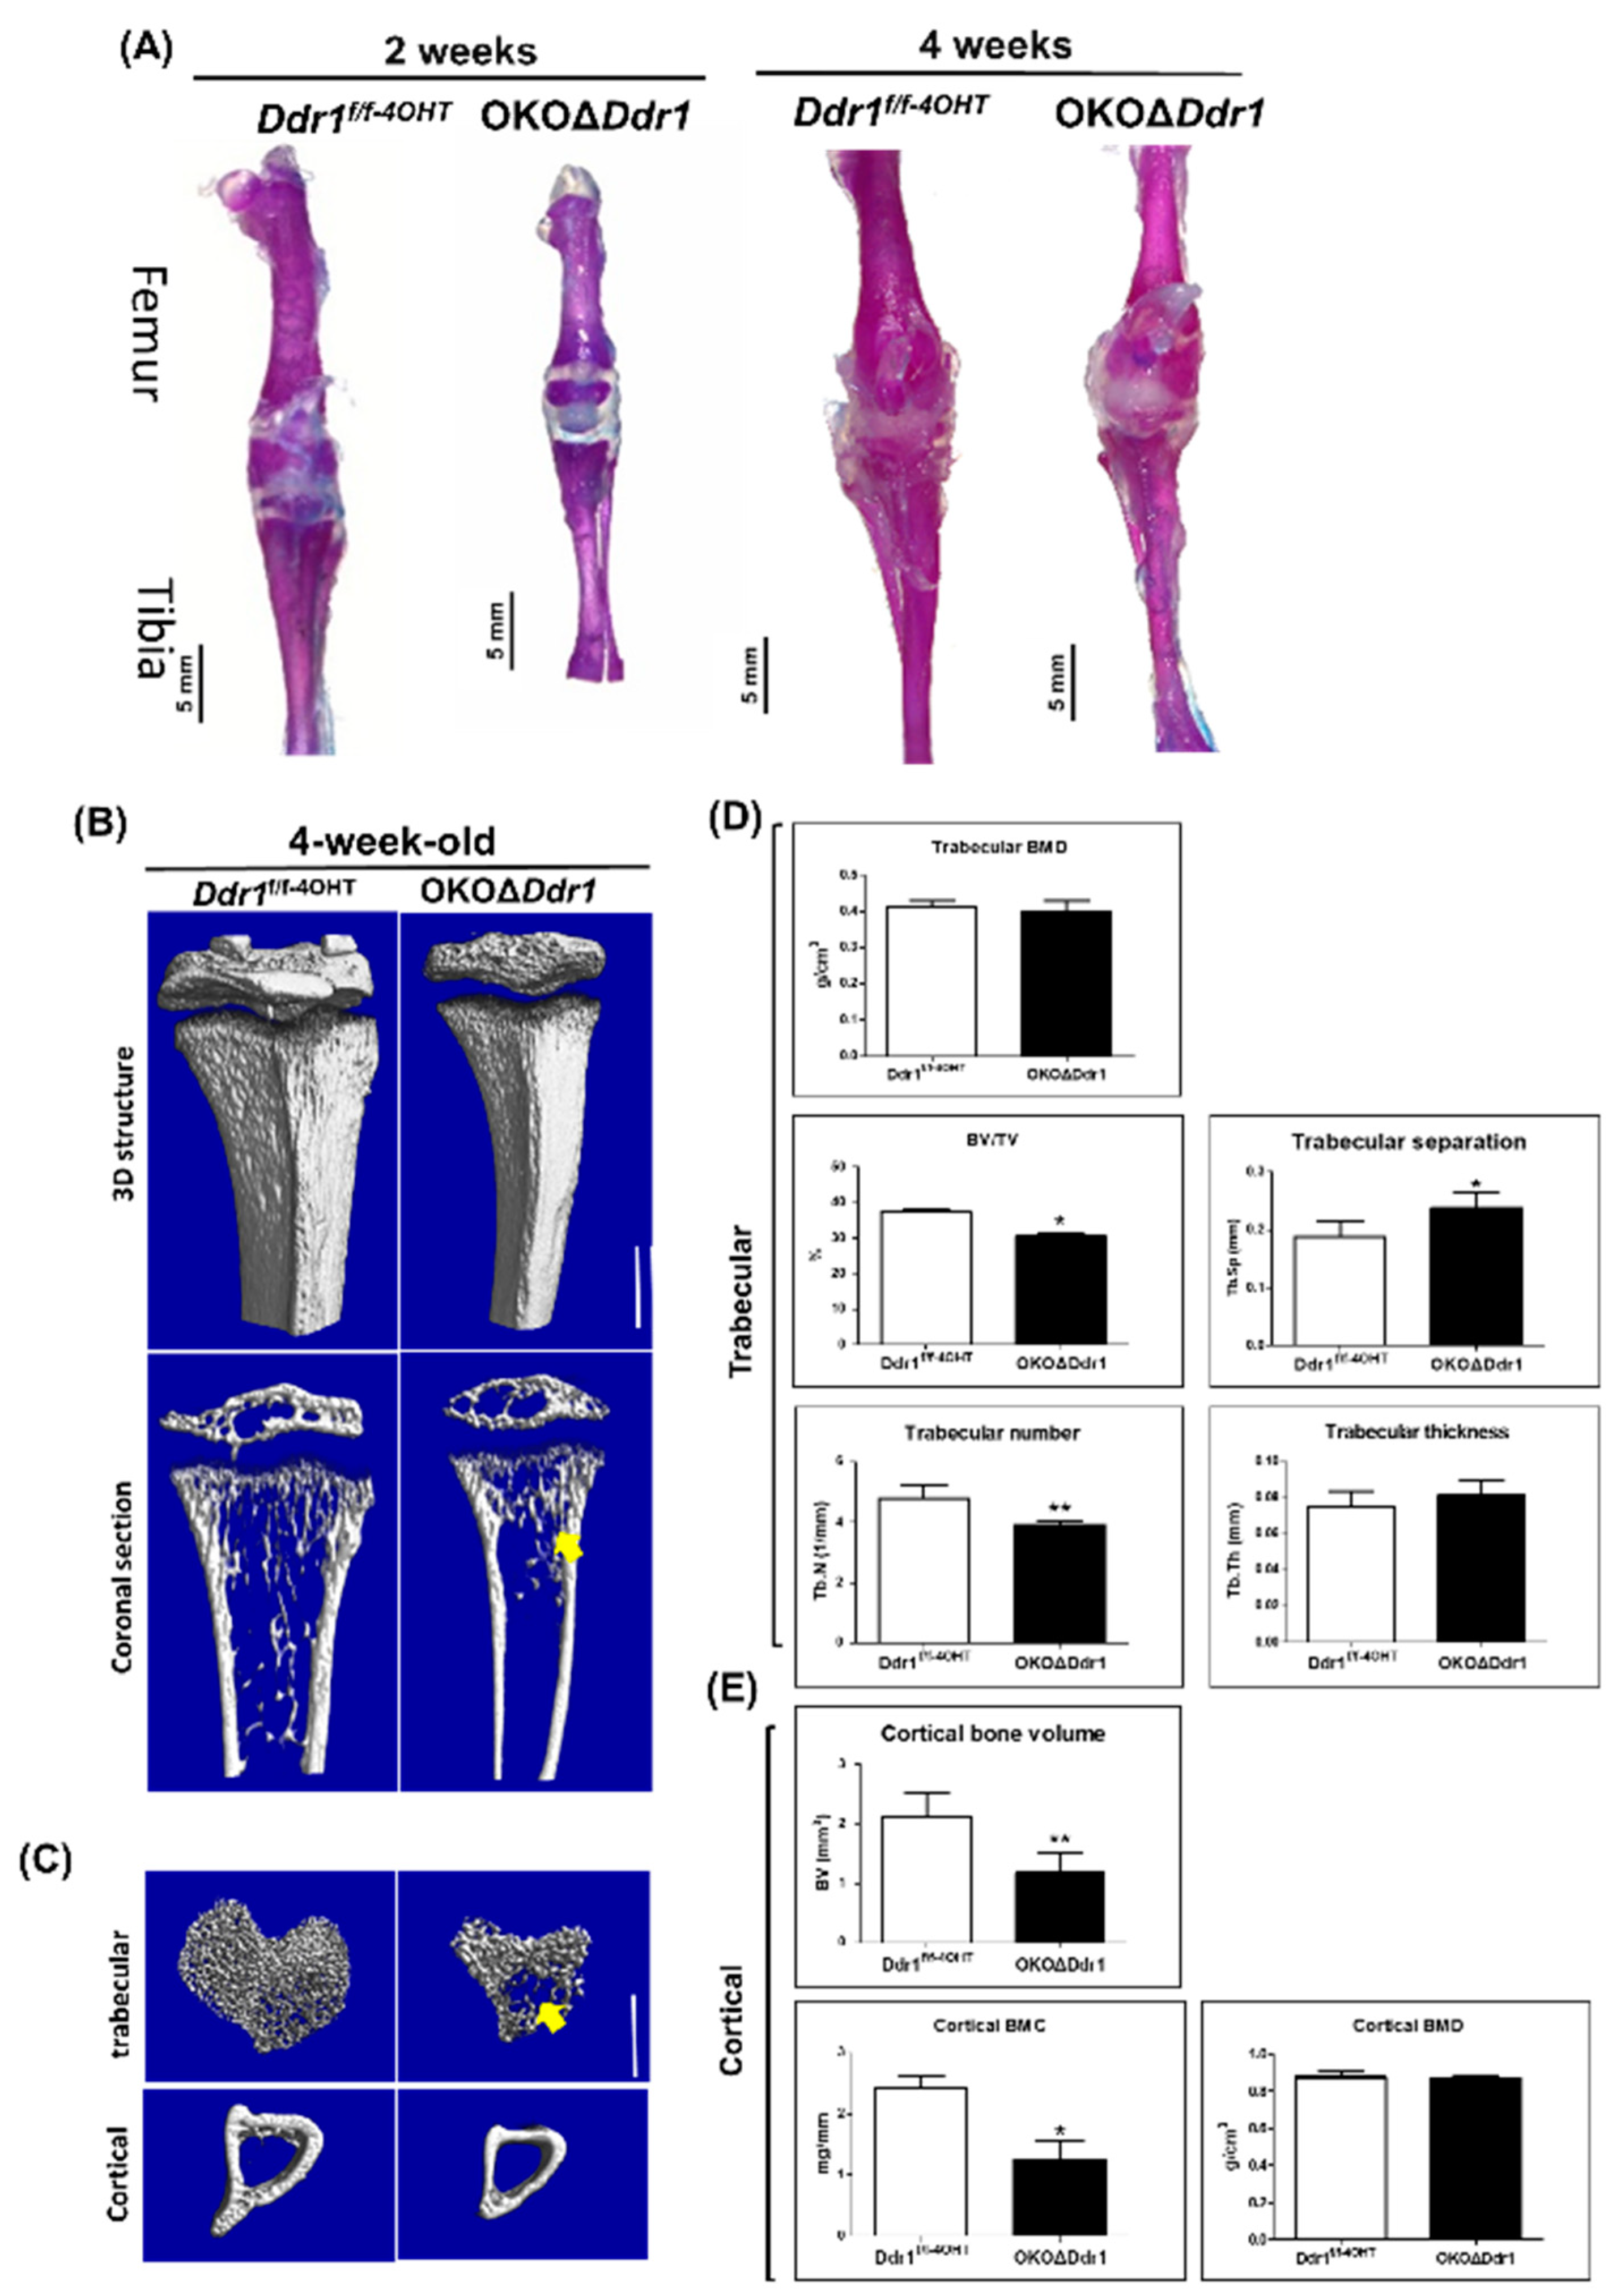
2.3. Decreased Bone Formation in the Tibia of OKOΔDdr1 Mice

At the end of endochondral ossification, hypertrophic cartilage is replaced by osteoblasts, osteoclasts, and blood vessels. At the perichondrium of cortical bone, osteoprogenitor cells differentiate into osteoblasts and form the bone collar of the cartilage anlage. In 2- and 4-week-old OKOΔDdr1 mice, we observed that the long bones of the femur and tibia were slimmer than those in Ddr1f/f-4OHT mice (Figure 3A). To characterize how Ddr1 regulates osteoblast function during skeletal development, we performed micro-CT analysis. The reconstructed 3-D images revealed that the long bones were obviously thicker in Ddr1f/f-4OHT mice than in OKOΔDdr1 mice (Figure 3B). The cross-sectional views and 3-D reconstruction of the trabecular bone (2-mm segment) showed less trabecular bone in Ddr1f/f-4OHT mice than in OKOΔDdr1 mouse tibia (Figure 3C). Moreover, the 3-D structure of tibial cortical bone was thinner and smaller in Ddr1f/f-4OHT mice than in OKOΔDdr1 mice (Figure 3C). To investigate whether Ddr1 knockout in osteoblasts affects bone mineralization in vivo, we analyzed the 3-D structure of tibias (2 mm length) in 4-week-old mice, and the inner region for trabecular bone and outer region for cortical bone were also analyzed. The trabecular bone volume (BV/TV) and trabecular number (Tb.N) were decreased and the trabecular separation (Tb.Sp) was increased in OKOΔDdr1 mice (Figure 3D). It had no significant differences on trabecular bone mineral density (Tb. BMD) and trabecular thickness (Tb.Th) (Figure 3D). The results of the cortical bone quantitation showed a significant decrease in the bone volume and bone mineral content (BMC) but no effect on the bone mineral density (BMD) in OKOΔDdr1 mice (Figure 3E). Consistent with the micro-CT data, 4-week-old OKOΔDdr1 mice showed a marked reduction in bone structure properties (mechanism loading to failure) such as max-load, break point, stiffness, area under the max curve, area under the break curve, modulus, and toughness in femur cortical bone compared to those in Ddr1f/f-4OHT mice; these properties were assessed with the three-point bending analysis (Table 1). These results indicated that osteoblasts with Ddr1 knockout caused the bone structure to be significantly weaker than that of the control mice. Taken together, these results indicate that osteoblasts with Ddr1 knockout decrease the function of osteoblasts and decrease bone formation of cortical bone and trabecular bone, leading to bone ossification delay.

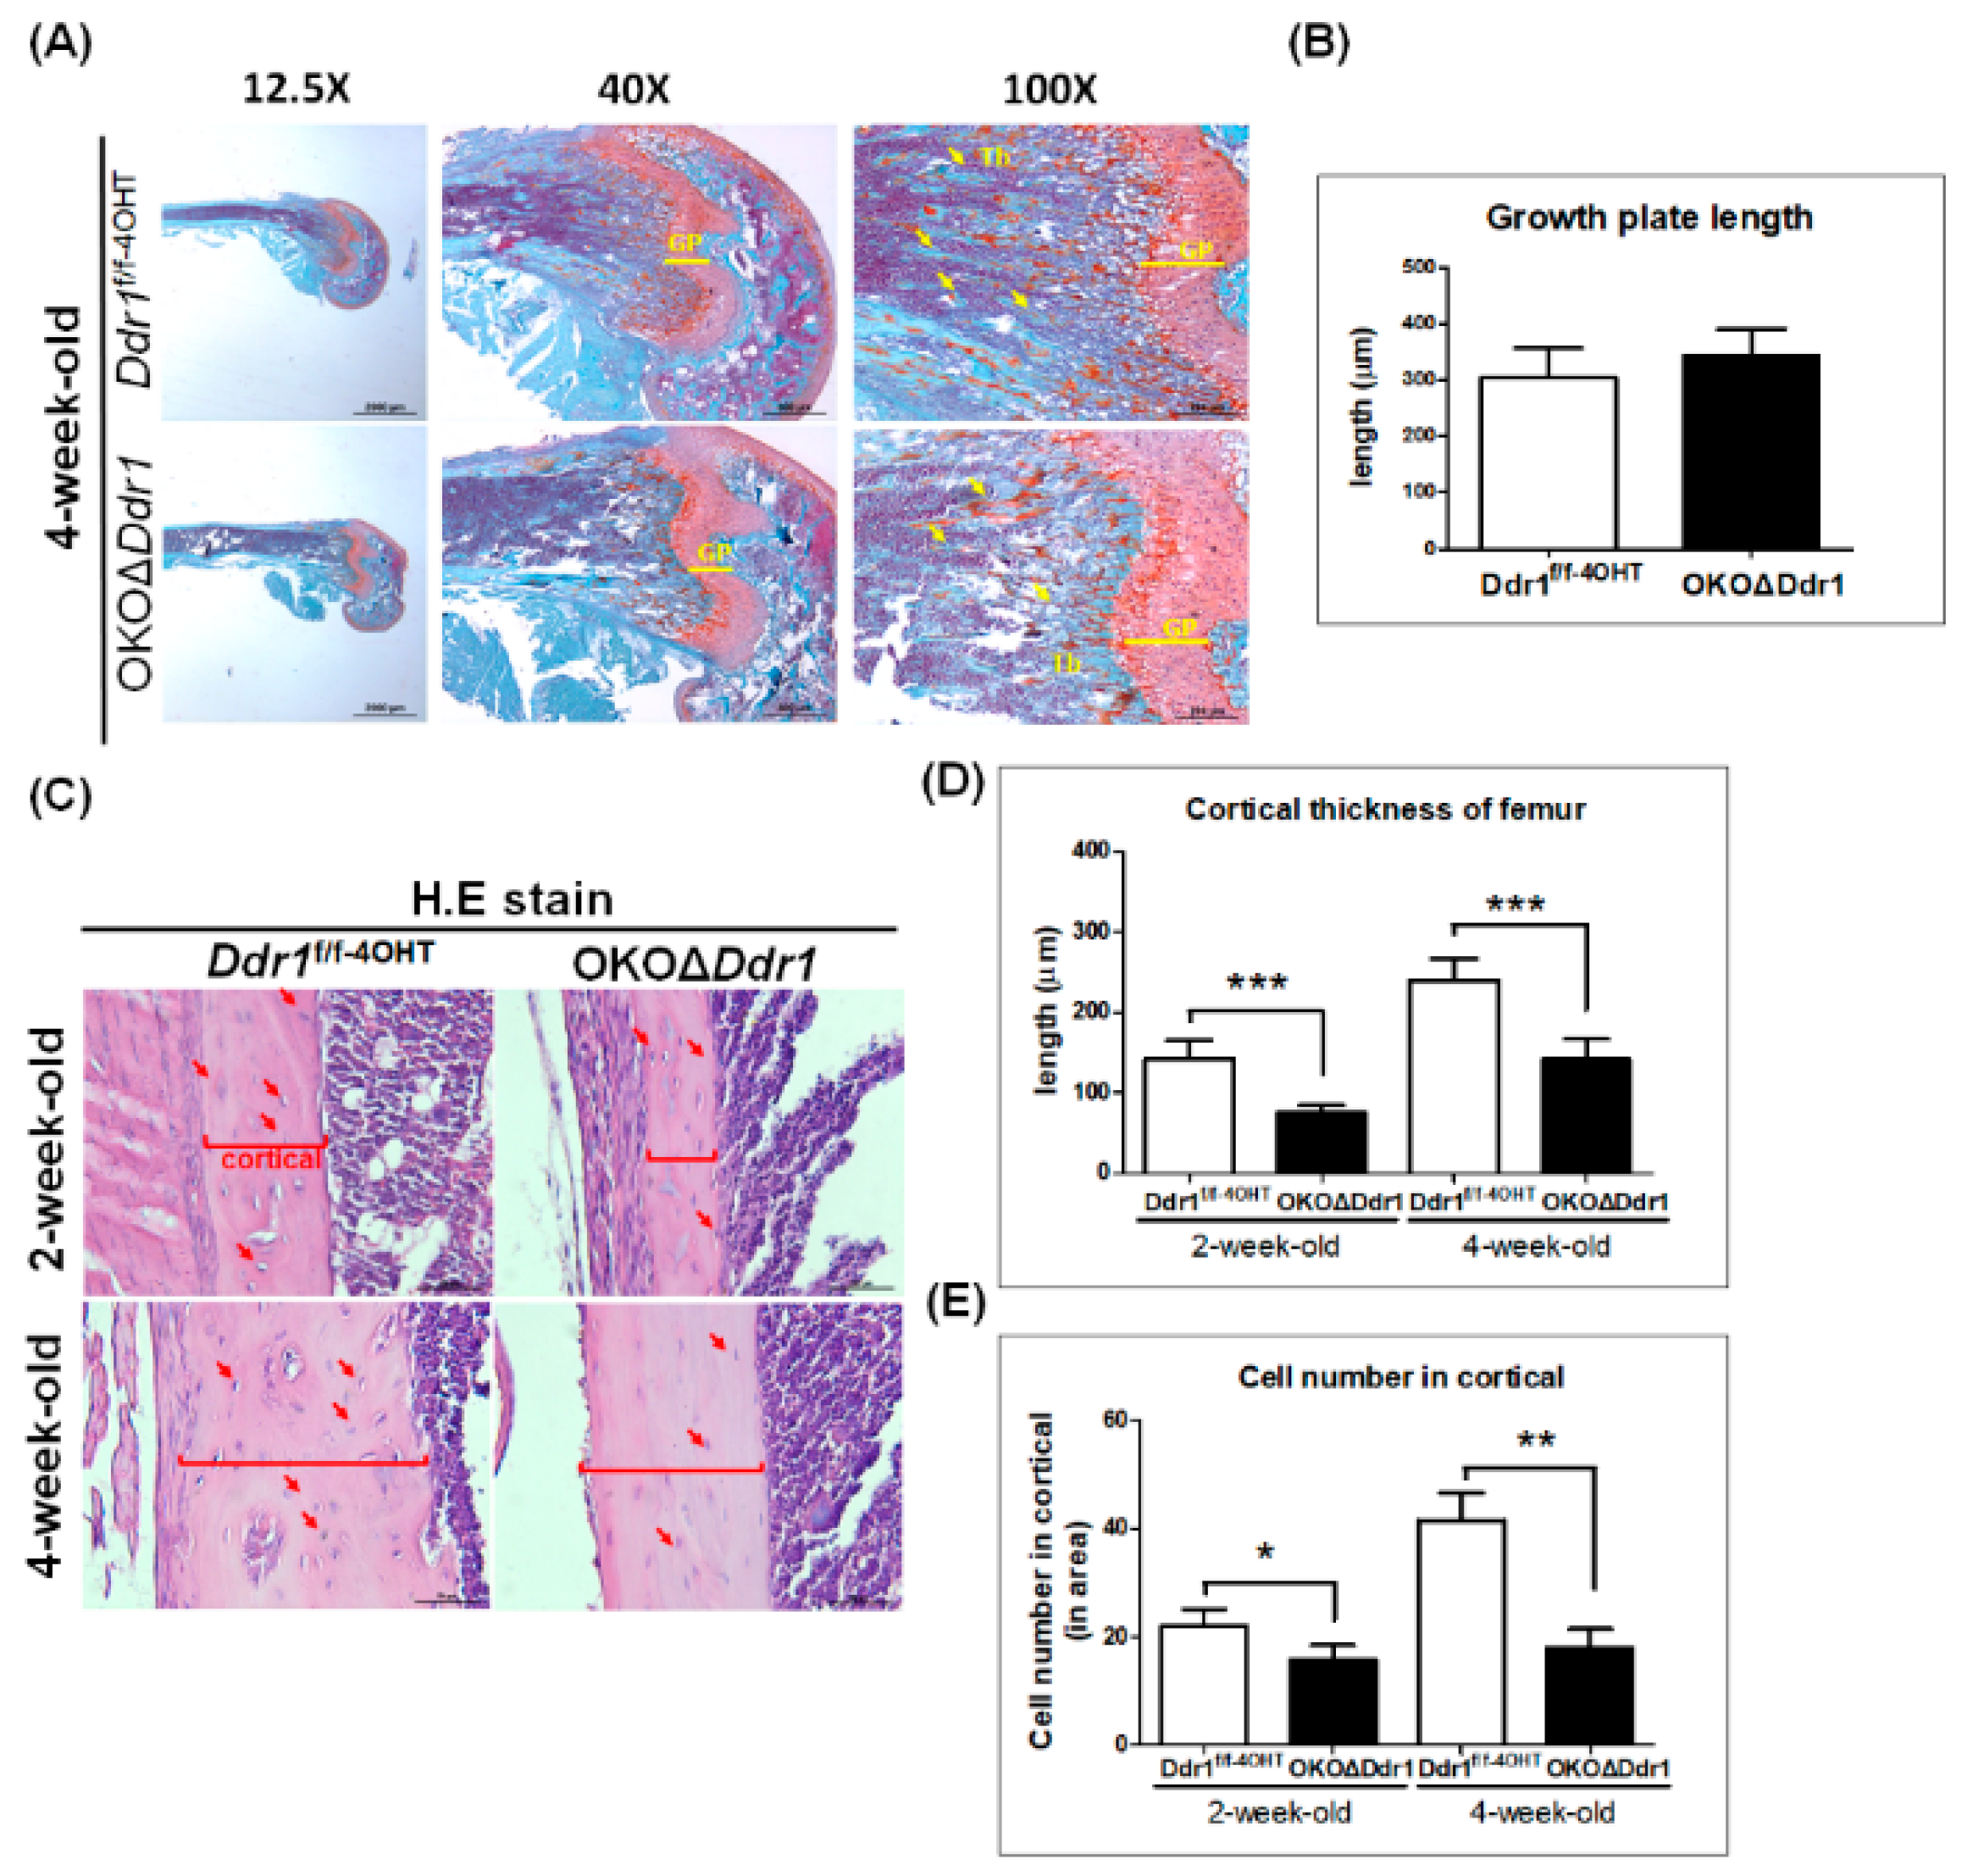
2.4. Knocking out Ddr1 in Osteoblasts Decreases Cortical Bone Thickness and Cell Number

To further understand the role of Ddr1-mediated osteoblast function and osteogenesis-related markers during bone ossification, we performed Safranin O/fast green and hematoxylin and eosin (H&E) staining. In the Safranin O/fast green staining assay, trabecular bone was less abundant in 4-week-old OKOΔDdr1 mouse femurs (Figure 4A), but quantification of the growth plate length showed no difference between Ddr1f/f-4OHT and OKOΔDdr1 mouse femurs (Figure 4B). Upon performing H&E staining of the femur (Figure 4C), we quantitated the cortical thickness and observed a decrease in 2- and 4-week-old OKOΔDdr1 mice compared with that in age-matched Ddr1f/f-4OHT mice (Figure 4D). Moreover, quantitation of the number of mature osteoblasts in cortical bone revealed fewer cells in 2- and 4-week-old OKOΔDdr1 mouse tibias than in the tibias of Ddr1f/f-4OHT mice (Figure 4C). These results indicated that osteoblasts with Ddr1 knockout exerted decreased cortical and trabecular bone formation due to a decrease in osteoblast number, which ultimately resulted in delayed bone ossification; however, osteoblasts with Ddr1 knockout had no influence on the growth plate length, which means that Ddr1 knockout in osteoblasts may not affect the function of chondrocyte.

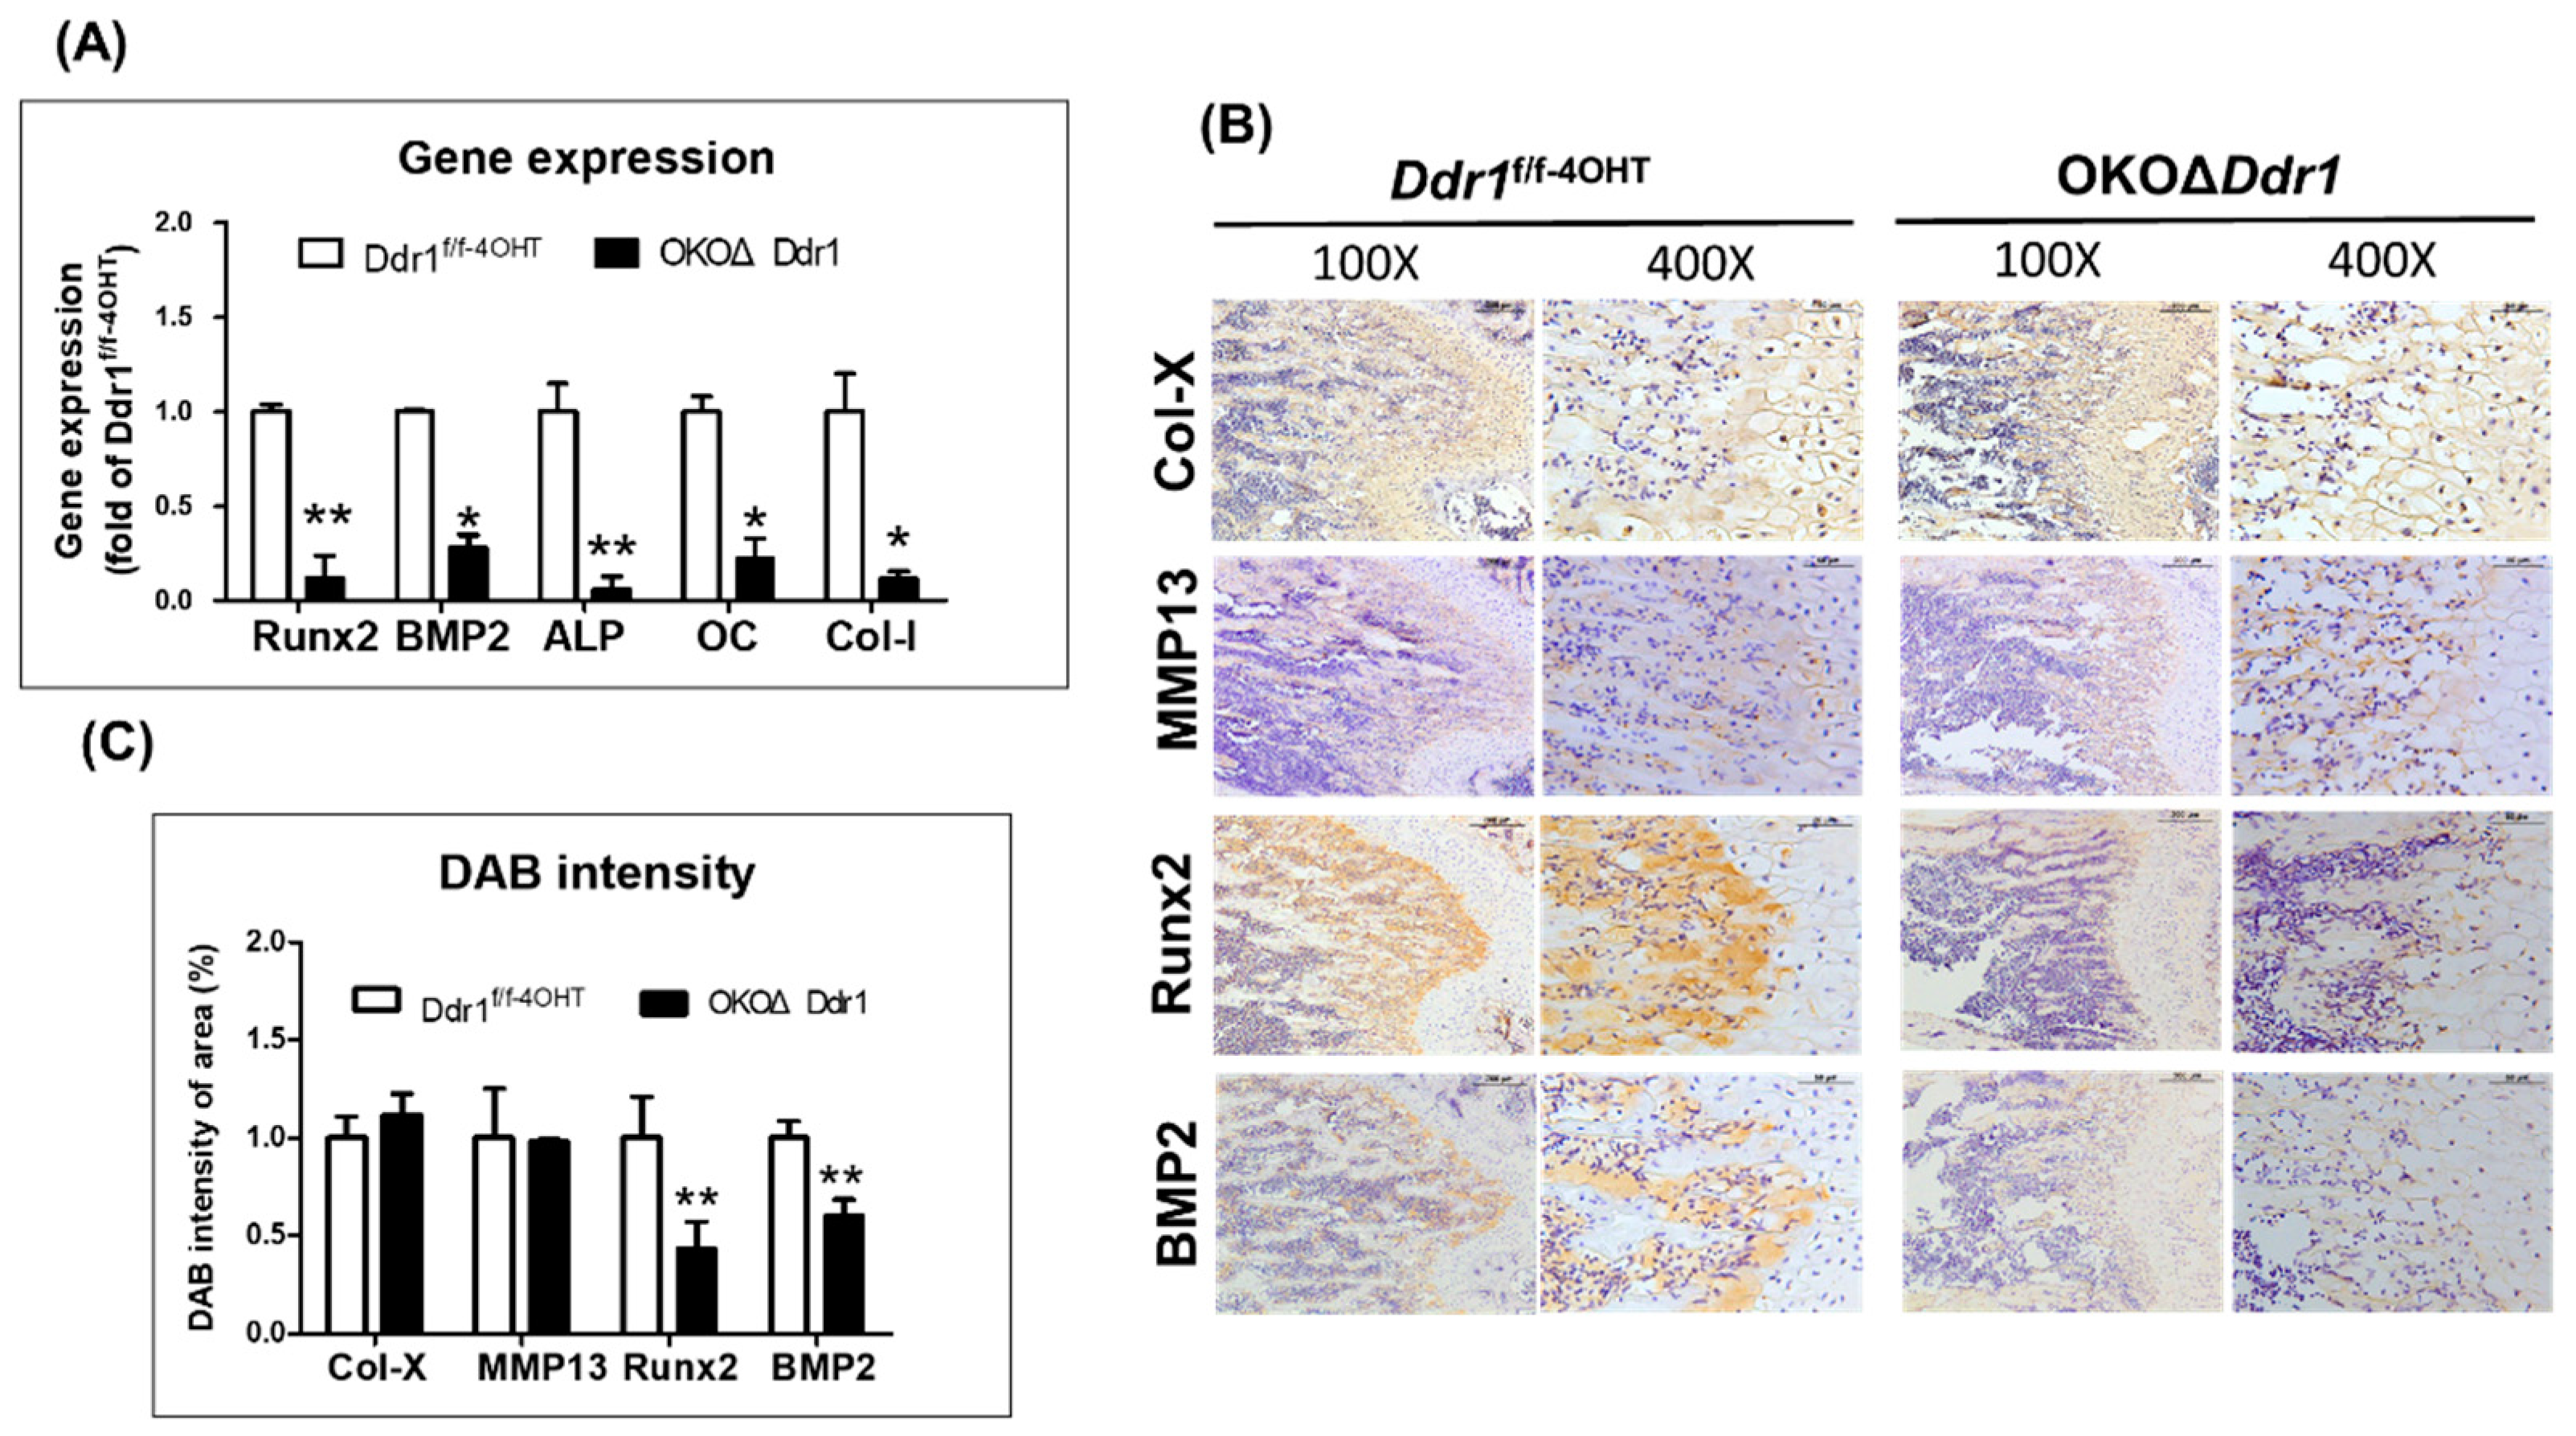
2.5. Knocking out Ddr1 in Osteoblasts Caused Downregulation of the Osteogenesis-Related Marker Gene Expression

To investigate whether Ddr1 knockout in osteoblasts influences chondrocyte function at the chondro-osseous interface, we stained for chondrocyte terminal differentiation markers, such as type X collagen (Col-X) and matrix metalloproteinase-13 (MMP13). The IHC results showed that knocking out Ddr1 in osteoblasts had no effect on either Col-X or MMP13 in the hypertrophic zone of the growth plate and the chondro-osseous interface (Figure 5B,C). We next detected that the gene expression of osteogenesis related markers, such as Runx2, and BMP2 was significantly lower in OKOΔDdr1 mice than in Ddr1f/f-4OHT mice (Figure 5A). The Runx2 protein level was significantly decreased in 4-week-old OKOΔDdr1 mouse trabeculae (Figure 5B). ALP is a hallmark of early development [16]. In OKOΔDdr1 mice, the gene expression of ALP was decreased compared with that in Ddr1f/f-4OHT mice (Figure 5A). In osteogenesis, CoI-I and OC are markers of late osteoblast differentiation [17]. The gene expression of Col-I and OC was decreased by ~80% in OKOΔDdr1 mice (Figure 5A). According to these results, we demonstrated that osteoblasts with Ddr1 knockout delayed bone formation through downregulation of osteogenesis-related markers, indicating that Ddr1 in osteoblasts plays a critical role in regulating osteoblast activity during osteogenesis.

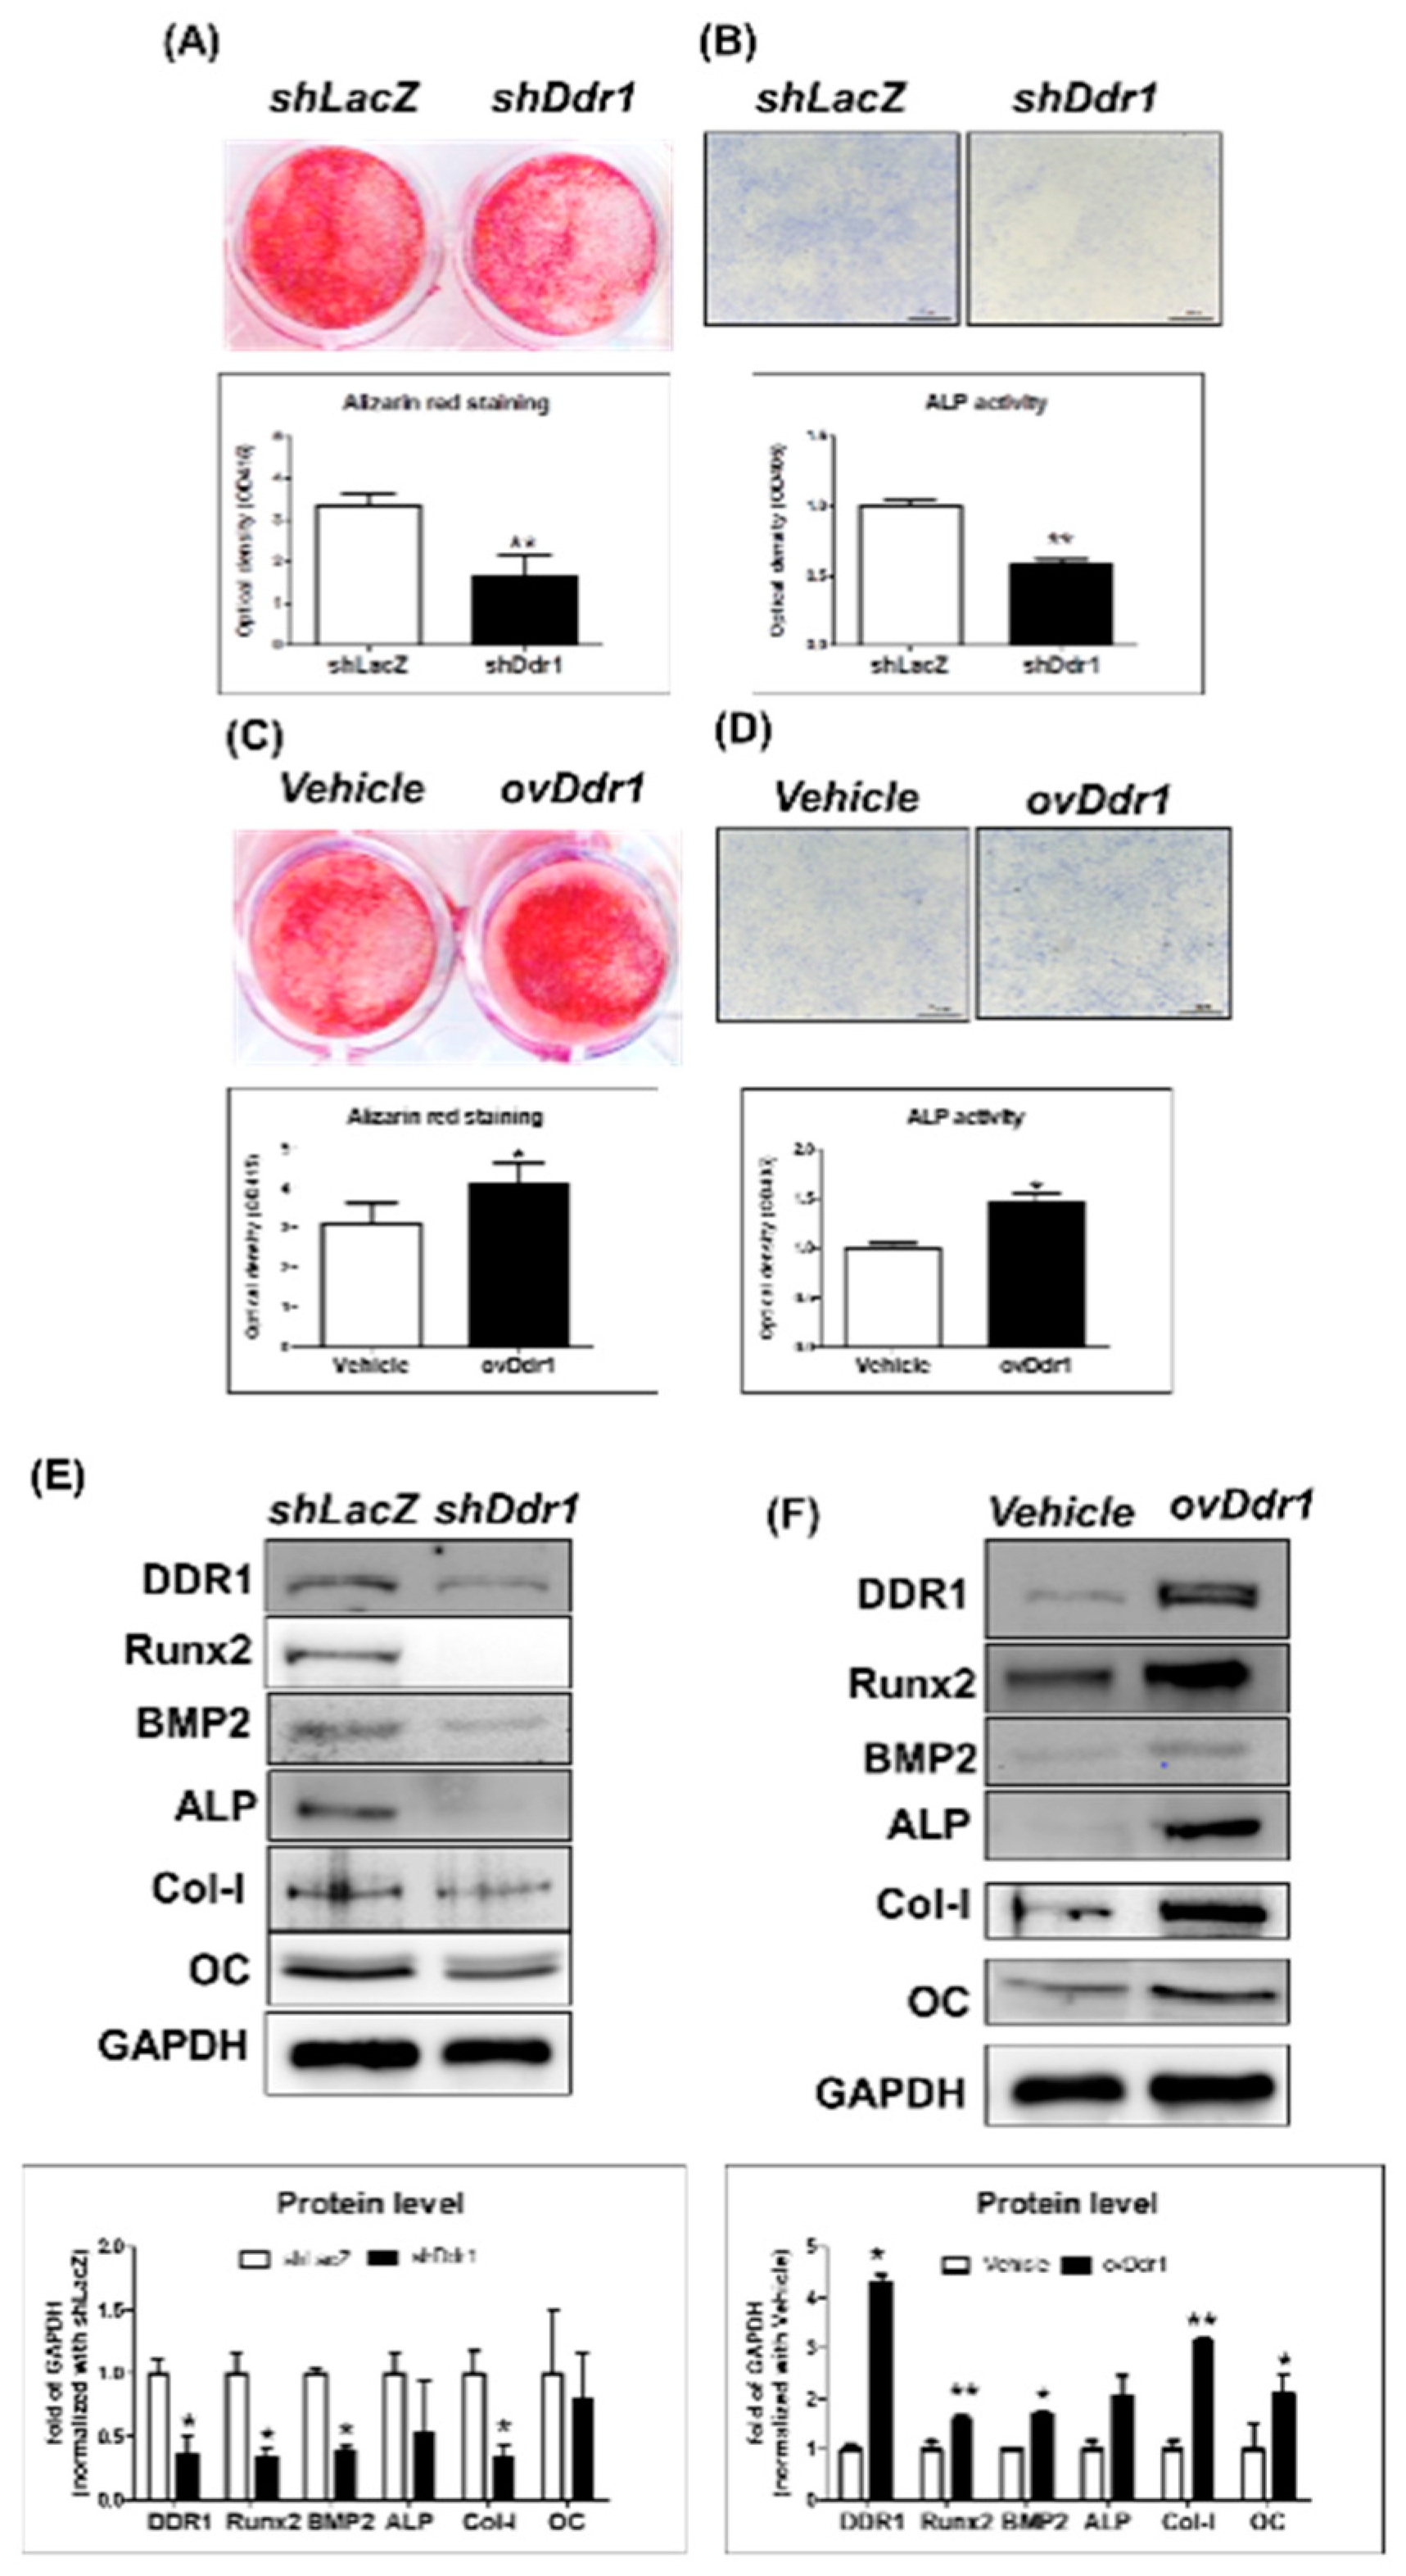
2.6. DDR1 Promoted Mineralization in MC3T3-E1 Cells

Our results showed that knocking out Ddr1 delayed the expression of osteogenesis-related markers in vivo, which ultimately resulted in delayed bone ossification. To better illustrate the role of Ddr1 in mediating osteoblast functions during development, we performed gain- and loss-of-function assays in preosteoblast MC3T3-E1 cells transduced with different Ddr1 lentiviruses. Mineralization capacity was decreased with Ddr1 knockdown in MC3T3-E1 cells as indicated by Alizarin red staining (Figure 6A), and ALP activity was decreased in MC3T3-E1 cells with Ddr1 knockdown (Figure 6B). On the other hand, overexpression of Ddr1 in MC3T3-E1 cells increased both osteoblast mineralization (Figure 6C) and ALP activity (Figure 6D). These results indicated that Ddr1 positively regulates the mineralization capacity in preosteoblast MC3T3-E1 cells. We also detected the protein levels of osteogenesis-related markers and revealed that the expression of Runx2, BMP2, ALP, Col-I, and OC was decreased in MC3T3-E1 cells with Ddr1 knockdown (Figure 6E) and increased in MC3T3-E1 cells overexpressing Ddr1 (Figure 6F). These results indicated that Ddr1 regulates Runx2, BMP2, ALP, Col-I, and OC expression to mediate osteoblast differentiation and to promote mineralization in MC3T3-E1 cells.

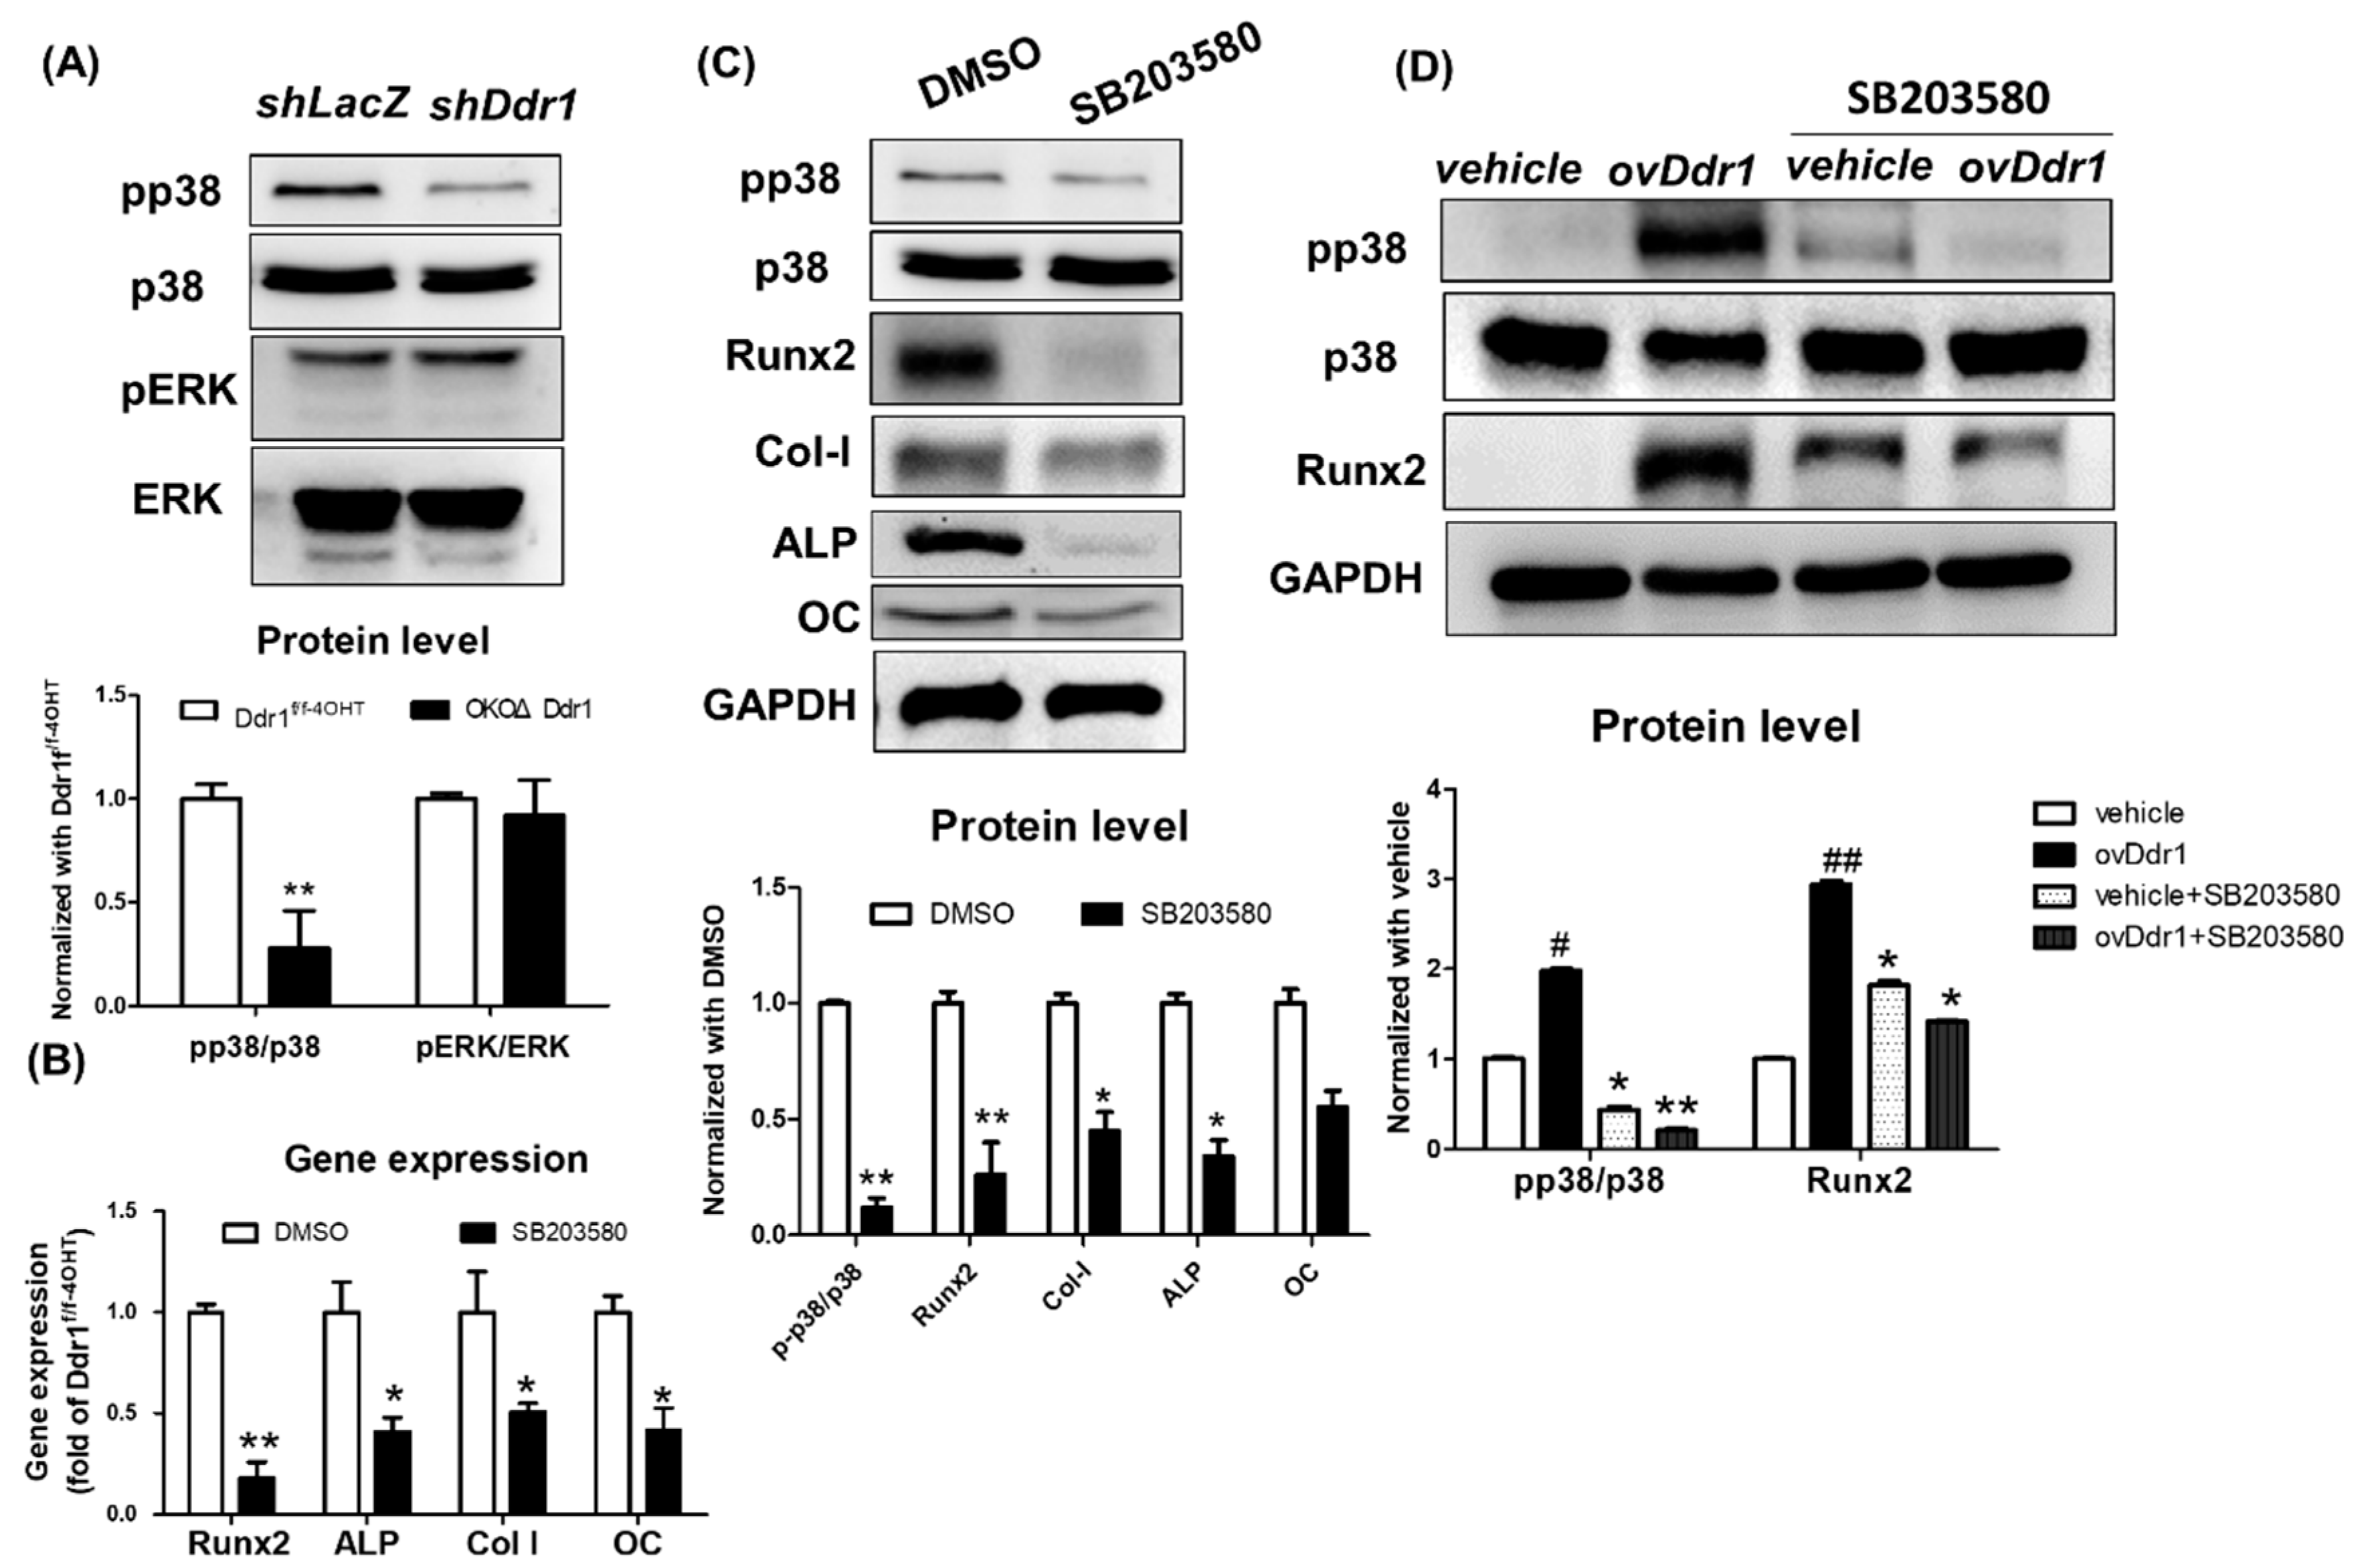
2.7. DDR1 Regulated Osteoblast Differentiation through Phosphorylation of p38

Previous reports have shown that upon induction with BMP2, Runx2 transcriptional activity is regulated by ERK1/2 rather than by p38 MAP kinase in MC3T3-E1 cells [18]. We further investigated whether DDR1 regulates osteoblast differentiation via phosphorylation of p38 or ERK1/2 activity, and we detected the levels of phosphorylated p38 in MC3T3-E1 cells. The results showed that Ddr1 knockdown decreased p38 phosphorylation but did not affect ERK1/2 phosphorylation in MC3T3-E1 cells (Figure 7A). Additionally, inhibition of p38 phosphorylation by SB203580 decreased the expression of markers related to osteoblast differentiation, such as OC, ALP, and collagen, in MC3T3-E1 cells [19]. DDR2 regulates osteoblast differentiation by regulating p38 MAPK and inducing activation of Runx2 and the extracellular matrix protein OCN [20]. To determine whether phosphorylated p38 mediated Runx2, OC, ALP, and Col-I expression, we conducted gene expression and Western blotting and showed that inhibition of p38 phosphorylation significantly decreased the gene expression of Runx2, ALP, Col-I and OC, (Figure 7B) and also the decrease in the protein levels of Runx2, ALP, Col-I and OC in MC3T3-E1 cells (Figure 7C). To confirm that Ddr1 regulated osteogenesis of osteoblasts via phosphorylation of p38, we overexpressed Ddr1 in MC3T3-E1 cells treated with the p38 inhibitor SB203580. The results showed that inhibiting p38 phosphorylation in MC3T3-E1 cells overexpressing Ddr1 decreased the protein level of Runx2 (Figure 7D). These results indicated that Ddr1 mediates Runx2 via p38 MAPK to regulate osteoblast differentiation and results in bone ossification.

3. Discussion

To investigate the role of Ddr1 in osteoblasts, we created an inducible osteoblast-specific Ddr1 knockout (OKOΔDdr1) mouse model and evaluated the roles of DDR1 during osteogenesis in vivo. Although osteoblasts with Ddr1 knockout had no effect on mouse survival, they did show markedly reduced postnatal bone formation. Bone ossification was observed to be impaired in 2- and 4-week-old OKOΔDdr1 mice. Knocking out of DDR1 in osteoblasts reduced the expression of osteogenic-related markers, including Runx2, BMP2, ALP, Col-I, and OC; these results showed reduction effects in bone mass. By using overexpression/knockdown Ddr1 in osteoblasts in vitro, we also confirmed that Ddr1 is required for the phosphorylation of p38 to regulate the expression of the osteogenesis-related markers Runx2, BMP2, ALP, Col-I, and OC in MC3T3-E1 cells. These results indicated that DDR1 is critical for the regulation of osteoblasts during postnatal bone formation in mice.
Osteoprogenitor cells that commit to osteoblasts eventually become mature osteocytes. Runx2 is an essential transcriptional regulator during osteoblast differentiation, and MSCs differentiate into osteoprogenitor cells with high Runx2 expression [3,21]. Cell proliferation was decreased in calvarial osteoblasts in Runx2ΔC/ΔC mice [22], and in Runx2-null mice, chondrocyte and osteoblast maturation is delayed, resulting in decreased bone formation [14]. The specific deletion of exon 8 of Runx2 in osteoblasts decreased bone formation and caused osteopenia in mice [23], and DDR1 deletion reduced Runx2 activity and decreased vascular calcification [24]. p38 MAP kinase has been established as a critical contributor to early osteoblast differentiation [25]. Mice with global p38alpha knockout die in utero due to defective placental development [26]. Another study reported that induction of BMP2/7 through the ERK pathway rather than the p38 pathway increased Runx2 phosphorylation and transcriptional activity in MC3T3-E1 cells [18]. The MKK3/6-p38 pathway induces phosphorylation of Runx2 to promote osteogenesis of osteoblasts [25]. DDR1-null mice showed upregulation of p42/44 ERK and p38 to increase mesangial cell proliferation [27]. However, the role of Ddr1 in osteoblasts remains undefined. In this study, we demonstrated that knocking out Ddr1 in osteoblasts in vivo and knocking down Ddr1 in MC3T3-E1 preosteoblasts in vitro decreased the expression of osteogenesis markers, such as Runx2, BMP2, ALP, Col-I, and OC. Overexpression experiments showed that DDR1 promoted osteogenesis of osteoblasts via p38 to induce Runx2 protein expression. First, we demonstrated that DDR1 regulates p38 in osteoblasts by knocking down Ddr1 in MC3T3-E1 cells and observing no effect on ERK phosphorylation but downregulation of p38 activity. These results indicated that DDR1 regulates osteogenesis through the p38 MAPK pathway but not the ERK pathway. However, the mechanism by which Ddr1 acts through p38 to regulate Runx2 protein levels in osteoblasts is still unknown. GATA4 (a zinc finger transcription factor) promotes Runx2 gene expression to stimulate bone mineralization and regulates ALP activity during osteoblast differentiation [28]. Knocking down GATA4 resulted in decreased levels of phosphorylated p38 and disruptions in osteoblast differentiation and bone remodeling [29]. Taken together, these data have led us to propose that Ddr1 may act through GATA4 via p38 to regulate Runx2 activity and induce the expression of downstream markers related to osteogenesis during osteoblast differentiation and mineralization.
In the intramembranous ossification process, the bone collar from the perichondrium becomes the periosteum, which differentiates into osteoblasts. In the calcification zone in the growth plate, osteoprogenitor cells enter the area and secrete bone matrix as a scaffold to form trabecular bone. Ddr1 is expressed at the periosteal collar of the clavicle and is especially dense in ribs in E18.5 mice [10]. In this study, the cortical and trabecular bones of OKOΔDdr1 mice were significantly smaller than those of Ddr1f/f-4OHT mice at 4 weeks of age. Additionally, the cell numbers of osteoblasts were reduced in cortical bone from OKOΔDdr1 mice. The difference in cortical bone thickness between Ddr1f/f-4OHT and OKOΔDdr1 mice was due to a decrease in osteoblast activity, which caused a delay in ossification in the cortical and trabecular bone. Although the BMD had no significant differences between control and OKO mice, the thickness of Ddr1f/f-4OHT was thicker than in OKOΔDdr1 mice, and the BMC was significantly decreased in OKOΔDdr1 mice. It showed that although BMD had not altered in OKOΔDdr1 mice, the mouse size was smaller than the wild-type which caused the BMC decrease in OKOΔDdr1 mice. Our results showed that the expression levels of chondrocyte terminal differentiation markers such as Col-X and MMP13 in the hypertrophic zone of the growth plate were not significantly different in the OKOΔDdr1 mice compared to the Ddr1f/f-4OHT mice, which indicated that knocking out Ddr1 in osteoblasts had no influence on the function of the chondrocytes.
It was reported that the osteoblasts had a specific enhancer of the Col-I gene in mice [30,31], and they generated a triple mutant with 2.3-kb. Col-I Cre promoter mice have time- and tissue-specific in osteoblasts and odontoblasts [32]. The Col-I Cre mRNA was firstly expressed at E13.5 in embryos which was the same with the expression of Col-I in the differentiation of osteoblasts and bone formation. The Cre recombinase specific was expressed at the cranial bones, facial bones, ribs, molars and limbs but not expressed at muscle, brain, chondrocyte in growth plate, skin, liver and kidney which also express Col-I. Thus Col-I cre mice have the most properties for our experiment.

4. Materials and Methods

4.1. Osteoblast-Specific (a1(I) Collagen-CreERT; Ddr1f/f) Ddr1-Deficient OKO Mice

All animal experiments were approved by the Kaohsiung Medical University Animal Care and Use Committee (IACUC105127, 1 August 2017). In our previous work, we generated conditional Ddr1 floxed/floxed mice (Ddr1f/f) [33]. The inducible a1(I)-collagen-CreERT [B6.Cg.Tg(Col1a1-Cre/ERT2)1Crm/J] cassette contains a 2.3 kb fragment of the Col1a1 promoter, Cre recombinase, ERT2, and polyA and was purchased from Jackson Laboratories. Next, a1(I)-CreERT and Ddr1f/f-4OHT mice were crossed to generate a1(I)-collagen-CreERT, -Ddr1f/f (OKO) mice. Genomic DNA from tail tips was extracted, and gene expression was confirmed by polymerase chain reaction (PCR). The presence of the 3′ loxP and Cre sites was verified by PCR using the following primers: loxP, 5′-ATAGCGGCCGCTGCTGGTCTTAGCTCTGT-3′ and 5′-ATAGTCGACACAGAGAGTTAAGCCAGA-3′; Cre, 5′-TTCAATTTACTGACCGTACACCAA-3′ and 5′-CCTGATCCTGGCAATTTCGGCTA-3′.

4.2. Induction of 4-Hydroxytamoxifen (4-OHT)

In the Cre-LoxP system, activation of Cre recombinase requires 4-hydroxytamoxifen (4-OHT). The 4-OHT was dissolved in DMSO to generate a stock solution at a concentration of 25 mg/mL, and the working concentration was 4 mg/kg diluted in corn oil (C8267, Sigma-Aldrich, St. Louis, MO, USA) at an oil:4-OHT ratio of 9:1. This 4-OHT solution was intraperitoneally injected into E14.5 mice (4 mg/kg/day) along with progesterone (2 mg/day/kg; P0130, Sigma-Aldrich). After birth, 1 mg/kg 4-OHT was injected per day for 5 consecutive days. Then, 2- and 4-week-old mice were collected. Both Ddr1 f/f-4OHT (control group) and OKOΔDdr1 (experimental group) mice were injected with 4-OHT on the abovementioned schedule.

4.3. Double Staining Analysis for Skeleton

Two- and 4-week-old Ddr1 f/f-4OHT and OKOΔDdr1 mice were harvested, and their skeletons were fixed in 4% paraformaldehyde for 24 h followed by soaking in freshly prepared 2% Alcian blue 8GX (A5268, Sigma-Aldrich) in 1% acetic acid for 2 days. Then, the skeletons were washed in 0.5% KOH (60377, Sigma-Aldrich) in 1X PBS until the muscles became transparent. Finally, the skeletons were stained with freshly prepared 1% Alizarin red S (A5533, Sigma-Aldrich) and for 10 min and washed with 0.5% KOH to removed excess dye. The skeletons were observed under a Leica-DSM1000 microscope (Leica Microsystems, Wetzlar, Germany).

4.4. Microcomputed Tomography (Micro-CT)

High-resolution microcomputed tomography (micro-CT) analysis (SkyScan 1076; SkyScan NV, Kontich, Belgium) was used to render 3-D reconstructions of 4-week-old mouse tibias with the following conditions: isotropic voxel resolution, 9 μm; 0.5 mm aluminum filter; tube voltage, 50 kV; tube current, 200 μA; and exposure time, 1100 ms. A scale of 0–0.09 (NRecon version 1.6.1.7; SkyScan NV) was used to reconstruct the 3-D morphometric parameters of 5 mm of the tibia. For the trabecular analysis, the inner circle of the ROI (2 mm circle; 120 cuts) beneath the growth plate from 0.5 mm to 2.5 mm (total length of 2 mm) was selected for analysis of the trabecular bone mineral density (BMD, g/cm3), percent bone volume (BV/TV, %), trabecular thickness (Tb.Th, µm), trabecular number (Tb.N, mm) and trabecular separation (Tb.Sp, µm). A total length 2 mm outer circle of the ROI at the middle of the tibia was selected for cortical analysis of the cortical bone volume (BV, mm3), bone mineral content (BMC, mg/mm), and bone mineral density (BMD g/cm3).

4.5. Three-Point Bending Test

The 4-week-old mouse femurs were subjected to 3-point bending and tested to failure by using a materials testing system (INSTRON 5943, Norwood, MA, USA). The femur was placed on 2 lower supports 2 mm apart. The load was placed at the middle of the femur at a displacement rate of 0.05 mm/s until failure. Quantitative analysis was performed with Bluehill software (Illinois Tool Works Inc., Glenview, IL, USA).

4.6. Histological and Immunohistochemistry (IHC) Staining

The femur was harvested, fixed in 4% PFA for 3 days, demineralized with 0.5 M EDTA, and embedded in paraffin. Sections 5 µm thick were sliced and then rehydrated for histological staining as follows: hematoxylin and eosin staining, hematoxylin (MHS1, Sigma-Aldrich, St. Louis, MO, USA) for 120 sec, a ddH2O wash, and eosin (230251, Sigma-Aldrich) for 3 sec; and Safranin O/fast green staining, hematoxylin (MHS1, Sigma-Aldrich) for 180 s, a ddH2O wash, 0.05% fast green (2353-45-9, Sigma-Aldrich) for 90 s, and 0.1% Safranin O red (HT90432, Sigma-Aldrich). For IHC staining, antigen retrieval was conducted by boiling the sections in 0.5% tris-EDTA in 1X PBS for 30 min. Next, the sections were incubated with 3% H2O2 peroxidase for 10 min at room temperature, blocked with blocking buffer (ab126587, Abcam, Cambridge, MA, USA) and incubated overnight at 4 °C with primary antibodies targeting DDR1 (PA5-29316, Thermo Fisher Scientific Inc., Waltham, MA, USA), DDR2 (GTX102526, Gene Tex Inc., Irvine, CA, USA), BMP2 (ab14933, Abcam), ALP (ab83259, Abcam), Col-I (ab34710, Abcam), Runx2 (ORB10256, Biorbyt LLC Ltd., San Francisco, CA, USA), and osteocalcin (GTX13418, Gene Tex Inc., Irvine, CA, USA). The sections were then treated with mouse- and rabbit-specific HRP/DAB detection kits (ab64264, Abcam), counterstained with hematoxylin and observed under a Leica-DM1750 microscope (Leica Microsystems, Wetzlar, Germany).

4.7. Cell Culture and Drug Treatment

The mouse preosteoblast cell line MC3T3-E1 (CRL-2593) (ATCC, Manassas, VA, USA) was grown in α-minimal essential (α-MEM) medium supplemented with 10% fetal bovine serum (FBS) and 100 units/mL penicillin and was maintained at 37 °C with 5% CO2. SB203580 (Ciliobrevin A, Selleckchem, Houston, TX, USA), an inhibitor of phosphorylated p38, was dissolved in DMSO as a stock solution, and the cells were treated with the inhibitor at a final concentration of 20 μM for 16 h, after which the cells were harvested for Western blot analysis.

4.8. Lentivirus Constructs and Transfection

Lentivirus was used to transiently knock down or overexpress Ddr1 in MC3T3-E1 cells. Purchased lentivirus particles with shLacZ (as control), shDdr1 (as knockdown Ddr1, TRCN0000010084), vehicle (as a control for Ddr1 overexpression, PLAS2W.Pp), and ovDdr1 (as overexpress Ddr1, PLAS2W.DDR1.Pp) from the RNAi Core Facility of Taiwan. MC3T3-E1 cells were cultured in 10 cm dishes at a density of 1 × 10⁶, infected lentivirus particles for 16 h (MOI of 1) and used puromycin (2 μg/mL) to select stable cell lines.

4.9. Real-Time PCR (qPCR) Analysis

MC3T3-E1 cells were treated with SB203580 for 24 hr and the in vivo calvarial bone was extracted from postnatal 4- to 5-day-old Ddr1f/f-4OHT and OKOΔDdr1 mice and placed on ice. The PureLink RNA mini kit (Thermo Fisher Scientific Inc., Waltham, MA, USA.) was used to obtain total RNA, and then cDNA was transcribed from 2 µg of total RNA with the Verso 1-Step RT-PCR Kit ReadyMix with ThermoPrime Taq. For quantitative real-time PCR, 6.25 uL of SYBR (BIO-RAD Laboratories Inc., Hercules, CA, USA), 1 uL of cDNA, 0.5 uL of specific primers (sequences available in Figure S1), and ddH2O to a total volume of 13 uL were mixed and run on a CFX connect real-time PCR detection system (BIO-RAD Laboratories Inc., Hercules, CA, USA). GAPDH was used as a housekeeping gene, and expression was normalized to that in Ddr1f/f-4OHT mice.

4.10. Western Blot Analysis

Primary cells were extracted from the flat bone of P3 Ddr1f/f-4OHT and OKOΔDdr1 mice and MC3T3-E1 cells were extracted with RIPA extraction buffer (89900, Thermo Fisher Scientific Inc., Waltham, MA, USA.) containing 1% proteinase inhibitor (78429, Thermo Fisher Scientific Inc., Waltham, MA, USA) and 1% phosphatase inhibitor (78426, Thermo Fisher Scientific Inc., Waltham, MA, USA). Western blot was performed with primary antibodies against DDR1 (ab22719, Abcam, Cambridge, MA, USA), collagen type I (ab34710, Abcam), collagen type X (ab58632, Abcam), GAPDH (MA5-15738, Thermo Fisher Scientific Inc.), ALP (ab95462, Abcam, Cambridge, MA, USA), Runx2 (ab23981, Abcam), BMP2 (ab14933, Abcam), Col-I (ab34710, Abcam), Osteocalcin (GTX13418, Gene Tex Inc., Irvine, CA, USA), phosphorylated 44/42 ERK1/2 (D11A8, Cell Signaling Inc., Danvers, MA, USA), ERK1/2 (137F5, Cell Signaling Inc.), phosphorylated p38 (Thr180/Tyr182) (ARG51580; Arigo biolaboratories, Hsinchu, TW), p38 (ARG55258; Arigo biolaboratories) and mouse and rabbit secondary antibodies (615005214 and 611005215; Jackson immune research; West Grove, PA, USA). Protein bands were detected by enhanced chemiluminescence analysis (ECL system; GE Healthcare, Piscataway, NJ, USA).

4.11. Mineralization Assay

To generate stable cell lines, cells were transduced with Ddr1 lentivirus particles, subcultured and seeded at a density of 1 × 10⁴ cell/cm2 in 48-well plates. Once cells reached 80% confluence, the medium was changed to induction medium (α-MEM with 10% FBS, 100 unit/mL penicillin/streptomycin, 50 μM ascorbic acid, and 5 mM β-glycerophosphate) containing 1 mg/mL puromycin. The selective induction medium was replaced every 2 days for 21 days. Next, the cells were washed in PBS, fixed with 10% formaldehyde for 10 min, washed with ddH2O at least 5 times and stained with 2% Alizarin red (A5533, Sigma-Aldrich) solution (pH 4.1) for 5 min. After staining, the cells were washed in ddH2O and imaged with a camera. Quantitation of the staining intensity was performed by adding 200 µL of 10% acetic acid per well and shaking the plates for 10 min, after which 100 uL of the solution was added to 96-well plates per well and the OD415 was measured with a TECAN Sunrise ELISA reader (Switzerland) (n = 6).

4.12. Alkaline Phosphatase Assay

MC3T3-E1 cells were transduced with Ddr1 lentivirus and seeded at a concentration of 1*104 in 48-well plates. Next, induction medium with 1 mg/mL puromycin was replaced every 2 days for 21 days. An ALP assay kit (86R, Sigma-Aldrich) was used according to the manufacturer’s instructions. The culture medium was removed, and the cells were washed once in PBS. Lysate buffer was added to the suspension, which was then centrifuged at 12,000 rpm. The pellet was resuspended and transferred to 96-well plates, to which ALP substrate solution (50 uL/per well) was added. The plates were incubated at 37 °C with a 5% CO2 humidified atmosphere after which the absorbance at 405 nm was detected by a TECAN Sunrise ELISA reader (Switzerland) (n = 6).

4.13. Statistical Analysis

All animal experiments are expressed as the mean (SEM) of 6 independent groups. Each condition was repeated at least three times, and the total number of mice per group was more than 6. Statistical significance was determined using Student’s t-test, and multiple comparisons were performed using Scheffé’s method. In this study, the groups were compared with the Ddr1f/f-4OHT group. For the p values, (*) indicated p < 0.05, and (**) indicated p < 0.01, and (***) indicated p < 0.001.

5. Conclusions

In conclusion, by using overexpression and knockdown of Ddr1 in osteoblasts, we demonstrated that DDR1 in osteoblasts regulates osteoblast differentiation via phosphorylation of p38 to regulate the expression of Runx2 and downstream markers related to osteogenesis, such as Runx2, BMP2, ALP, Col-I, and OC. This mechanism results in the reduction in long bone ossification and weakened mechanical properties in OKOΔDdr1 mice in vivo, which indicate that Ddr1 plays a crucial role in osteoblast function to regulate the differentiation of osteoblasts. Our findings may be applied to patients with osteoporosis or fracture as a basis for developing Ddr1-targeted therapy.

Supplementary Materials

Author Contributions

L.-Y.C., C.-H.C. and C.-Z.W. wrote the paper. L.-Y.C., C.-H.C., S.-C.C., T.-L.C., Y.-H.L., H.-C.C., Y.-C.F., Y.-H.W., C.-Z.W. performed the experiments and analyzed the data. L.-Y.C., C.-H.C. and C.-Z.W. designed the research study. All authors have read and agreed to the published version of the manuscript.

Funding

In this study, the authors acknowledge grant support by the Ministry of Science and Technology (MOST108-2320-B-037-008 and MOST109-2320-B-037-005) for Chau-Zen Wang; Kaohsiung Medical University (KMU-TP-105B10 and KMU-DK105009) and the Ministry of Science and Technology (MOST108-23214-B-037-059) for Chun-Hwan Chen; and the Orthopedic Research Center in Kaohsiung Medical University grant for the research resources and equipment. This study is supported partially by Kaohsiung Medical University Research Center (KMU-TC108A02 and KMU-TC108A02-1). This study was supported by Orthopedic Research Center in Kaohsiung Medical University for the research resource and equipment.

Conflicts of Interest

The authors declare no conflict of interest.

References

  1. Takarada, T.; Hinoi, E.; Nakazato, R.; Ochi, H.; Xu, C.; Tsuchikane, A.; Takeda, S.; Karsenty, G.; Abe, T.; Kiyonari, H.; et al. An analysis of skeletal development in osteoblast-specific and chondrocyte-specific runt-related transcription factor-2 (Runx2) knockout mice. J. Bone Miner. Res. 2013, 28, 2064–2069. [Google Scholar] [CrossRef] [PubMed]
  2. Karsenty, G. The complexities of skeletal biology. Nature 2003, 423, 316–318. [Google Scholar] [CrossRef] [PubMed]
  3. Takarada, T.; Nakazato, R.; Tsuchikane, A.; Fujikawa, K.; Iezaki, T.; Yoneda, Y.; Hinoi, E. Genetic analysis of Runx2 function during intramembranous ossification. Development 2016, 143, 211–218. [Google Scholar] [CrossRef] [PubMed] [Green Version]
  4. Adhami, M.D.; Rashid, H.; Chen, H.; Clarke, J.C.; Yang, Y.; Javed, A. Loss of Runx2 in committed osteoblasts impairs postnatal skeletogenesis. J. Bone Miner. Res. 2015, 30, 71–82. [Google Scholar] [CrossRef] [Green Version]
  5. Ducy, P.; Zhang, R.; Geoffroy, V.; Ridall, A.L.; Karsenty, G. Osf2/Cbfa1: A transcriptional activator of osteoblast differentiation. Cell 1997, 89, 747–754. [Google Scholar] [CrossRef] [Green Version]
  6. Florencio-Silva, R.; Sasso, G.R.; Sasso-Cerri, E.; Simoes, M.J.; Cerri, P.S. Biology of Bone Tissue: Structure, Function, and Factors That Influence Bone Cells. Biomed. Res. Int. 2015, 2015, 421746. [Google Scholar] [CrossRef] [Green Version]
  7. Roca, H.; Phimphilai, M.; Gopalakrishnan, R.; Xiao, G.; Franceschi, R.T. Cooperative interactions between RUNX2 and homeodomain protein-binding sites are critical for the osteoblast-specific expression of the bone sialoprotein gene. J. Biol. Chem. 2005, 280, 30845–30855. [Google Scholar] [CrossRef] [Green Version]
  8. Nishimura, R.; Wakabayashi, M.; Hata, K.; Matsubara, T.; Honma, S.; Wakisaka, S.; Kiyonari, H.; Shioi, G.; Yamaguchi, A.; Tsumaki, N.; et al. Osterix regulates calcification and degradation of chondrogenic matrices through matrix metalloproteinase 13 (MMP13) expression in association with transcription factor Runx2 during endochondral ossification. J. Biol. Chem. 2012, 287, 33179–33190. [Google Scholar] [CrossRef] [Green Version]
  9. Hauschka, P.V. Osteocalcin: The vitamin K-dependent Ca2+-binding protein of bone matrix. Haemostasis 1986, 16, 258–272. [Google Scholar] [CrossRef]
  10. Vogel, W.F.; Aszodi, A.; Alves, F.; Pawson, T. Discoidin domain receptor 1 tyrosine kinase has an essential role in mammary gland development. Mol. Cell Biol. 2001, 21, 2906–2917. [Google Scholar] [CrossRef] [Green Version]
  11. Valiathan, R.R.; Marco, M.; Leitinger, B.; Kleer, C.G.; Fridman, R. Discoidin domain receptor tyrosine kinases: New players in cancer progression. Cancer Metastasis Rev. 2012, 31, 295–321. [Google Scholar] [CrossRef] [PubMed] [Green Version]
  12. Leitinger, B.; Steplewski, A.; Fertala, A. The D2 period of collagen II contains a specific binding site for the human discoidin domain receptor, DDR2. J. Mol. Biol. 2004, 344, 993–1003. [Google Scholar] [CrossRef] [PubMed]
  13. Leitinger, B.; Kwan, A.P. The discoidin domain receptor DDR2 is a receptor for type X collagen. Matrix Biol. 2006, 25, 355–364. [Google Scholar] [CrossRef]
  14. Chen, H.; Ghori-Javed, F.Y.; Rashid, H.; Adhami, M.D.; Serra, R.; Gutierrez, S.E.; Javed, A. Runx2 regulates endochondral ossification through control of chondrocyte proliferation and differentiation. J. Bone Miner. Res. 2014, 29, 2653–2665. [Google Scholar] [CrossRef] [Green Version]
  15. Karp, S.J.; Schipani, E.; St-Jacques, B.; Hunzelman, J.; Kronenberg, H.; McMahon, A.P. Indian hedgehog coordinates endochondral bone growth and morphogenesis via parathyroid hormone related-protein-dependent and -independent pathways. Development 2000, 127, 543–548. [Google Scholar]
  16. Zernik, J.; Twarog, K.; Upholt, W.B. Regulation of alkaline phosphatase and alpha 2(I) procollagen synthesis during early intramembranous bone formation in the rat mandible. Differentiation 1990, 44, 207–215. [Google Scholar] [CrossRef] [PubMed]
  17. Boskey, A.L.; Wians, F.H., Jr.; Hauschka, P.V. The effect of osteocalcin on in vitro lipid-induced hydroxyapatite formation and seeded hydroxyapatite growth. Calcif. Tissue Int. 1985, 37, 57–62. [Google Scholar] [CrossRef]
  18. Ge, C.; Yang, Q.; Zhao, G.; Yu, H.; Kirkwood, K.L.; Franceschi, R.T. Interactions between extracellular signal-regulated kinase 1/2 and p38 MAP kinase pathways in the control of RUNX2 phosphorylation and transcriptional activity. J. Bone Miner. Res. 2012, 27, 538–551. [Google Scholar] [CrossRef] [Green Version]
  19. Suzuki, A.; Guicheux, J.; Palmer, G.; Miura, Y.; Oiso, Y.; Bonjour, J.P.; Caverzasio, J. Evidence for a role of p38 MAP kinase in expression of alkaline phosphatase during osteoblastic cell differentiation. Bone 2002, 30, 91–98. [Google Scholar] [CrossRef]
  20. Lin, K.L.; Chou, C.H.; Hsieh, S.C.; Hwa, S.Y.; Lee, M.T.; Wang, F.F. Transcriptional upregulation of DDR2 by ATF4 facilitates osteoblastic differentiation through p38 MAPK-mediated Runx2 activation. J. Bone Miner. Res. 2010, 25, 2489–2503. [Google Scholar] [CrossRef]
  21. Lian, J.B.; Stein, G.S. Runx2/Cbfa1: A multifunctional regulator of bone formation. Curr. Pharm. Des. 2003, 9, 2677–2685. [Google Scholar] [CrossRef] [PubMed]
  22. Pratap, J.; Galindo, M.; Zaidi, S.K.; Vradii, D.; Bhat, B.M.; Robinson, J.A.; Choi, J.Y.; Komori, T.; Stein, J.L.; Lian, J.B.; et al. Cell growth regulatory role of Runx2 during proliferative expansion of preosteoblasts. Cancer Res. 2003, 63, 5357–5362. [Google Scholar]
  23. Adhami, M.D.; Rashid, H.; Chen, H.; Javed, A. Runx2 activity in committed osteoblasts is not essential for embryonic skeletogenesis. Connect. Tissue Res. 2014, 55 (Suppl. 1), 102–106. [Google Scholar] [CrossRef] [Green Version]
  24. Lino, M.; Wan, M.H.; Rocca, A.S.; Ngai, D.; Shobeiri, N.; Hou, G.; Ge, C.; Franceschi, R.T.; Bendeck, M.P. Diabetic Vascular Calcification Mediated by the Collagen Receptor Discoidin Domain Receptor 1 via the Phosphoinositide 3-Kinase/Akt/Runt-Related Transcription Factor 2 Signaling Axis. Arter. Thromb Vasc Biol. 2018, 38, 1878–1889. [Google Scholar] [CrossRef] [Green Version]
  25. Greenblatt, M.B.; Shim, J.H.; Zou, W.; Sitara, D.; Schweitzer, M.; Hu, D.; Lotinun, S.; Sano, Y.; Baron, R.; Park, J.M.; et al. The p38 MAPK pathway is essential for skeletogenesis and bone homeostasis in mice. J. Clin. Investig. 2010, 120, 2457–2473. [Google Scholar] [CrossRef] [PubMed] [Green Version]
  26. Allen, M.; Svensson, L.; Roach, M.; Hambor, J.; McNeish, J.; Gabel, C.A. Deficiency of the stress kinase p38alpha results in embryonic lethality: Characterization of the kinase dependence of stress responses of enzyme-deficient embryonic stem cells. J. Exp. Med. 2000, 191, 859–870. [Google Scholar] [CrossRef] [PubMed] [Green Version]
  27. Curat, C.A.; Vogel, W.F. Discoidin domain receptor 1 controls growth and adhesion of mesangial cells. J. Am. Soc. Nephrol. 2002, 13, 2648–2656. [Google Scholar] [CrossRef] [PubMed] [Green Version]
  28. Khalid, A.B.; Slayden, A.V.; Kumpati, J.; Perry, C.D.; Osuna, M.A.L.; Arroyo, S.R.; Miranda-Carboni, G.A.; Krum, S.A. GATA4 Directly Regulates Runx2 Expression and Osteoblast Differentiation. JBMR Plus 2018, 2, 81–91. [Google Scholar] [CrossRef] [Green Version]
  29. Zhou, T.; Guo, S.; Zhang, Y.; Weng, Y.; Wang, L.; Ma, J. GATA4 regulates osteoblastic differentiation and bone remodeling via p38-mediated signaling. J. Mol. Histol. 2017, 48, 187–197. [Google Scholar] [CrossRef]
  30. Ducy, P.; Karsenty, G. Two distinct osteoblast-specific cis-acting elements control expression of a mouse osteocalcin gene. Mol. Cell Biol. 1995, 15, 1858–1869. [Google Scholar] [CrossRef] [Green Version]
  31. Rossert, J.; Eberspaecher, H.; de Crombrugghe, B. Separate cis-acting DNA elements of the mouse pro-alpha 1(I) collagen promoter direct expression of reporter genes to different type I collagen-producing cells in transgenic mice. J. Cell Biol. 1995, 129, 1421–1432. [Google Scholar] [CrossRef] [PubMed] [Green Version]
  32. Kim, J.E.; Nakashima, K.; de Crombrugghe, B. Transgenic mice expressing a ligand-inducible cre recombinase in osteoblasts and odontoblasts: A new tool to examine physiology and disease of postnatal bone and tooth. Am. J. Pathol. 2004, 165, 1875–1882. [Google Scholar] [CrossRef]
  33. Chou, L.Y.; Chen, C.H.; Lin, Y.H.; Chuang, S.C.; Chou, H.C.; Lin, S.Y.; Fu, Y.C.; Chang, J.K.; Ho, M.L.; Wang, C.Z. Discoidin domain receptor 1 regulates endochondral ossification through terminal differentiation of chondrocytes. FASEB J. 2020, 34, 5767–5781. [Google Scholar] [CrossRef] [PubMed] [Green Version]
Figure 1. Generation of osteoblast-specific (a1(I) collagen-CreERT; Ddr1f/f) OKOΔDdr1 mice. The calvarial bone was extracted from Ddr1f/f-4OHT and OKOΔDdr1 mice on postnatal days 4~5, and (A) gene expression of Ddr1 and (B) protein level of DDR1 were detected. The ratio of DDR1/GPADH is expressed relative to the Ddr1f/f-4OHT mice was quantified. Each group n ≥ 6. (C) IHC staining of DDR1 and DDR2 in cortical bone and articular cartilage of femurs from 4-week-old mice; black arrow indicates DDR1-positive cells; black frame indicates the cortical region. (D) Quantitative results by tissue faxes normalized with Ddr1f/f-4OHT. Magnifications of 400X are shown, with scale bars of 50 μm. Each group, n ≥ 6; * p ≤ 0.05, ** p ≤ 0.01.
Ijms 21 07210 g001
Figure 2. Skeletal dysplasia in OKOΔDdr1 mice. (A) Double staining of skeletons from 2- and 4-week-old Ddr1f/f-4OHT and OKOΔDdr1 mice. Anatomy microscopy image (0.75×) with scale bar 20 mm. (B) Intramembranous ossification bone, including calvaria, mandible, clavicle, and ribs/sternum. The image was obtained at 1.25× magnification with a scale bar of 5 mm. The black arrow indicates rib cartilage of ribs. (C) Endochondral ossification bone including scapula/forelimb, hindlimb, and vertebrae. The anatomy microscopy image was 1.25× with a scale bar of 5 mm. (D) Body weight and body length were assessed in 4-week-old mice. Each group, n ≥ 6; * p ≤ 0.05, *** p ≤ 0.001.
Ijms 21 07210 g002
Figure 3. Decreased bone formation in the tibias of OKOΔDdr1 mice. (A) Double staining of hindlimb bones (femur and tibia) from 2- and 4-week-old mice. Microscopy image (1.25× magnification) of the hindlimbs; scale bar 5 mm. Top is the femur, and bottom is the tibia. The micro-CT reconstructed 3D structure of (B) the total length with 5 mm of tibia, the coronal section view of the tibia, (C) and reconstructed 2 mm 3D structure of trabecular bone and cortical bone in Ddr1f/f-4OHT and OKOΔDdr1 mice with a scale bar of 1 mm. The yellow arrow indicates trabecular bone. (D) Quantitation of trabecular bone mineral density (BMD), trabecular bone volume/total volume (BV/TV), trabecular number (Tb.N), trabecular separation (Tb.Sp), and trabecular thickness (Tb.Th) (E) Quantitation of cortical bone volume, cortical bone mineral density (BMD), and cortical bone mineral content (BMC) with total 2 mm at middle of tibia. Each group n ≥ 6; * p ≤ 0.05, ** p ≤ 0.01.
Ijms 21 07210 g003
Figure 4. Knocking out Ddr1 in osteoblasts decreases cortical bone thickness and cell number. (A) Safranin O/fast green staining of femurs from 4-week-old Ddr1f/f-4OHT and OKOΔDdr1 mice. Magnifications of 12.5×, 40×, and 100× are shown, with scale bars of 2000 μm, 500 μm, and 200 μm, respectively. GP indicates growth plate; yellow arrow indicates trabecular bone. (B) Quantitation of the growth plate length. (C) H&E staining of femur with cortical bone. The red arrow indicates osteoblasts; the red frame indicates cortical bone thickness. Quantitation of the (D) cortical thickness and (E) cell number in cortical bone per 0.12 mm2 in 2- and 4-week-old mouse femurs. Each group n ≥ 6; * p ≤ 0.05, ** p ≤ 0.01, *** p ≤ 0.001.
Ijms 21 07210 g004
Figure 5. Knocking out Ddr1 in osteoblasts caused downregulation of the gene expression of markers related to osteogenesis. (A) Gene expression of Runx2, BMP2, ALP, OC, and Col-I was assessed in calvarial bone of Ddr1f/f-4OHT and OKOΔDdr1 mice. (B) IHC staining of Col-X, MMP13, Runx2, and BMP2 in femurs from 4-week-old Ddr1f/f-4OHT and OKOΔDdr1 mice. Magnifications were 100× and 400× with scale bars of 200 μm and 50 μm, respectively. (C) Quantitation of Col-X, MMP13, Runx2, and BMP2 expression in the trabecular area. Each group n ≥ 6; * p ≤ 0.05, ** p ≤ 0.01.
Ijms 21 07210 g005
Figure 6. DDR1 promoted mineralization in MC3T3-E1 cells. Knocking down Ddr1 (shDdr1) in ME3T3-E1 cells was performed with (A) mineralization assay staining by Alizarin red and (B) ALP activity. The quantitative results are shown below. (C) The protein levels of DDR1, Runx2, BMP2, ALP, Col-I, OC, and GAPDH in ME3T3-E1 cells were assessed. Quantitation of the results for shDdr1 compared with shLacZ and all other results is shown below. ME3T3-E1 cells overexpressing Ddr1 (ovDdr1) were subjected to (D) the mineralization assay staining by Alizarin red and (E) ALP activity. The quantitative results are shown below. (F) The protein levels of DDR1, Runx2, BMP2, ALP, Col-I, OC, and GAPDH were assessed in ME3T3-E1 cells. Quantitation of ovDdr1 expression compared with shLacZ overexpression is shown below. Each group included n ≥ 3 independent groups; * p ≤ 0.05, ** p ≤ 0.01.
Ijms 21 07210 g006
Figure 7. DDR1 regulated osteoblast differentiation through p38 phosphorylation. (A) The protein levels of phosphorylated p38 and ERK in ME3T3-E1 cells with Ddr1 knockdown (shDdr1). The quantitative result was presented as the pp38/p38 and pERK/ERK ratios and normalized with shLacZ. (B) Gene expression of Runx2, ALP, Col-I, OC in ME3T3-E1 cells were treated with the p38 inhibitor. (C) Western blot detected the protein level of phosphorylated p38, Runx2, Col-I, ALP, and OC Runx2 in MC3T3-E1 treated with DMSO (control) and SB203580 (p38 inhibitor). The quantitative results show the ratios of pp38/p38 and Runx2/GAPDH, Col-I/GAPDH, ALP/GAPDH, and OC/GAPDH and were normalized with DMSO. (D) The protein levels of Runx2, pp38, p38 and GAPDH in ME3T3-E1 cells overexpressing Ddr1 (ovDdr1) and treated with SB203580. Quantitation of the results of ovDdr1+DMSO compared with vehicle+DMSO and of ovDdr1+SB203580 compared with vehicle+SB203580 and normalized with those of vehicle+DMSO is shown below. Each group included n ≥ 3; * p ≤ 0.05, # p ≤ 0.05, ** p ≤ 0.01, ## p ≤ 0.01 and * means compare with shLacZ or DMSO or vehicle, and # mean compare with ovDdr1.
Ijms 21 07210 g007
Table 1. Decreased mechanical properties in the femur of OKOΔDdr1 mice.
Group Ddr1f/f-4OHT(Mean ± SE)OKO△Ddr1(Mean ± SE)p Value
MaxLoadN10.68±3.554.26±00.001**
Break pointN8.31±3.424.04±0.010.01*
stiffness(S)N/mm^270.69±31.1333.51±0.010.006**
area under the Max curve(AUC1)J0.003±0.00170.0012±0.00990.01*
area under the Break curve(AUC2)J0.0059±0.00310.0028±0.01340.013*
UStressMPa0.53±0.230.37±0.190.188
ModulusGPa3.23±0.911.83±0.140.048*
ToughnessMPa1.77±0.730.94±0.0590.04*
Used the three-point bending analysis the 4-week-old Ddr1f/f-4OHT mice and OKOΔDdr1 mice with max-load, break point, stiffness, area under the max curve, area under the break curve, ustress, modulus, and toughness in femur. Each group n ≥ 6; * p ≤ 0.05, ** p ≤ 0.01. p value: compare with Ddr1f/f-4OHT.

