The Anaerobic Product Ethanol Promotes Autophagy-Dependent Submergence Tolerance in Arabidopsis

 , , and
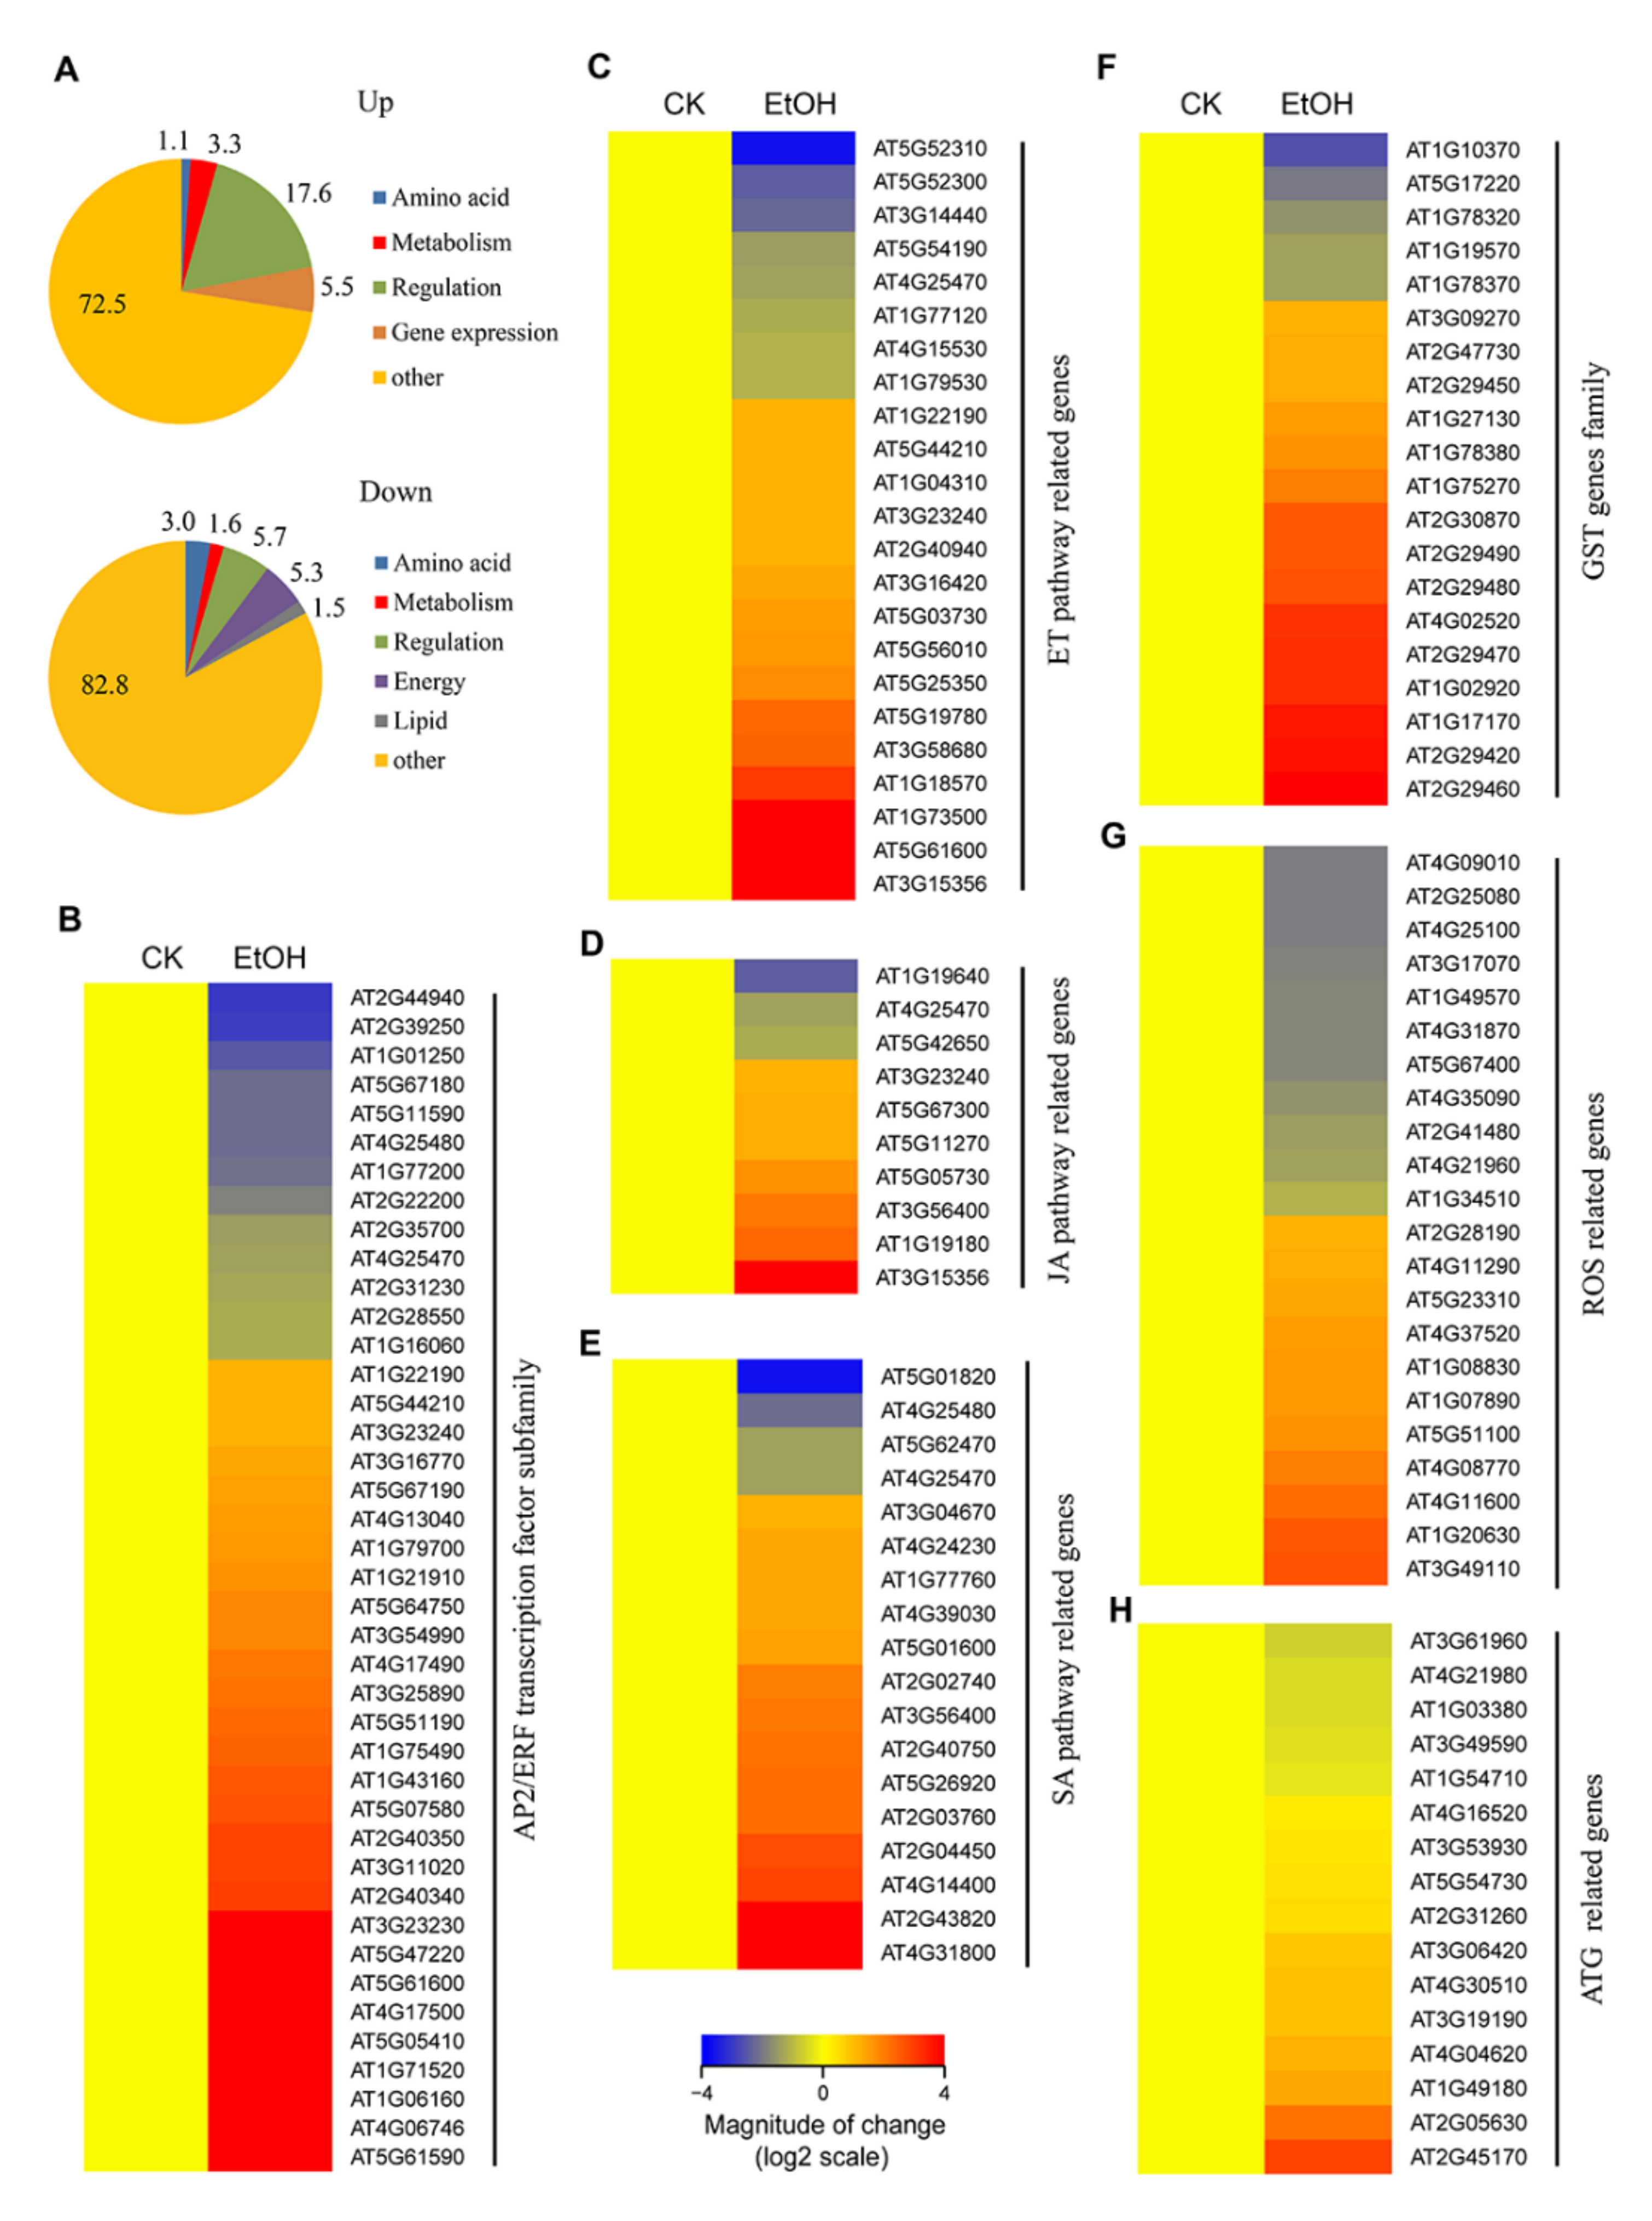
Abstract
:1. Introduction
2. Results
2.1. Ethanol Activates the Expression of Stress-Responsive Transcription Factors
2.2. Expression Patterns of Phytohormone Pathway Genes in Response to Ethanol
2.3. Ethanol Treatment Activates ROS Detoxification-Related Genes
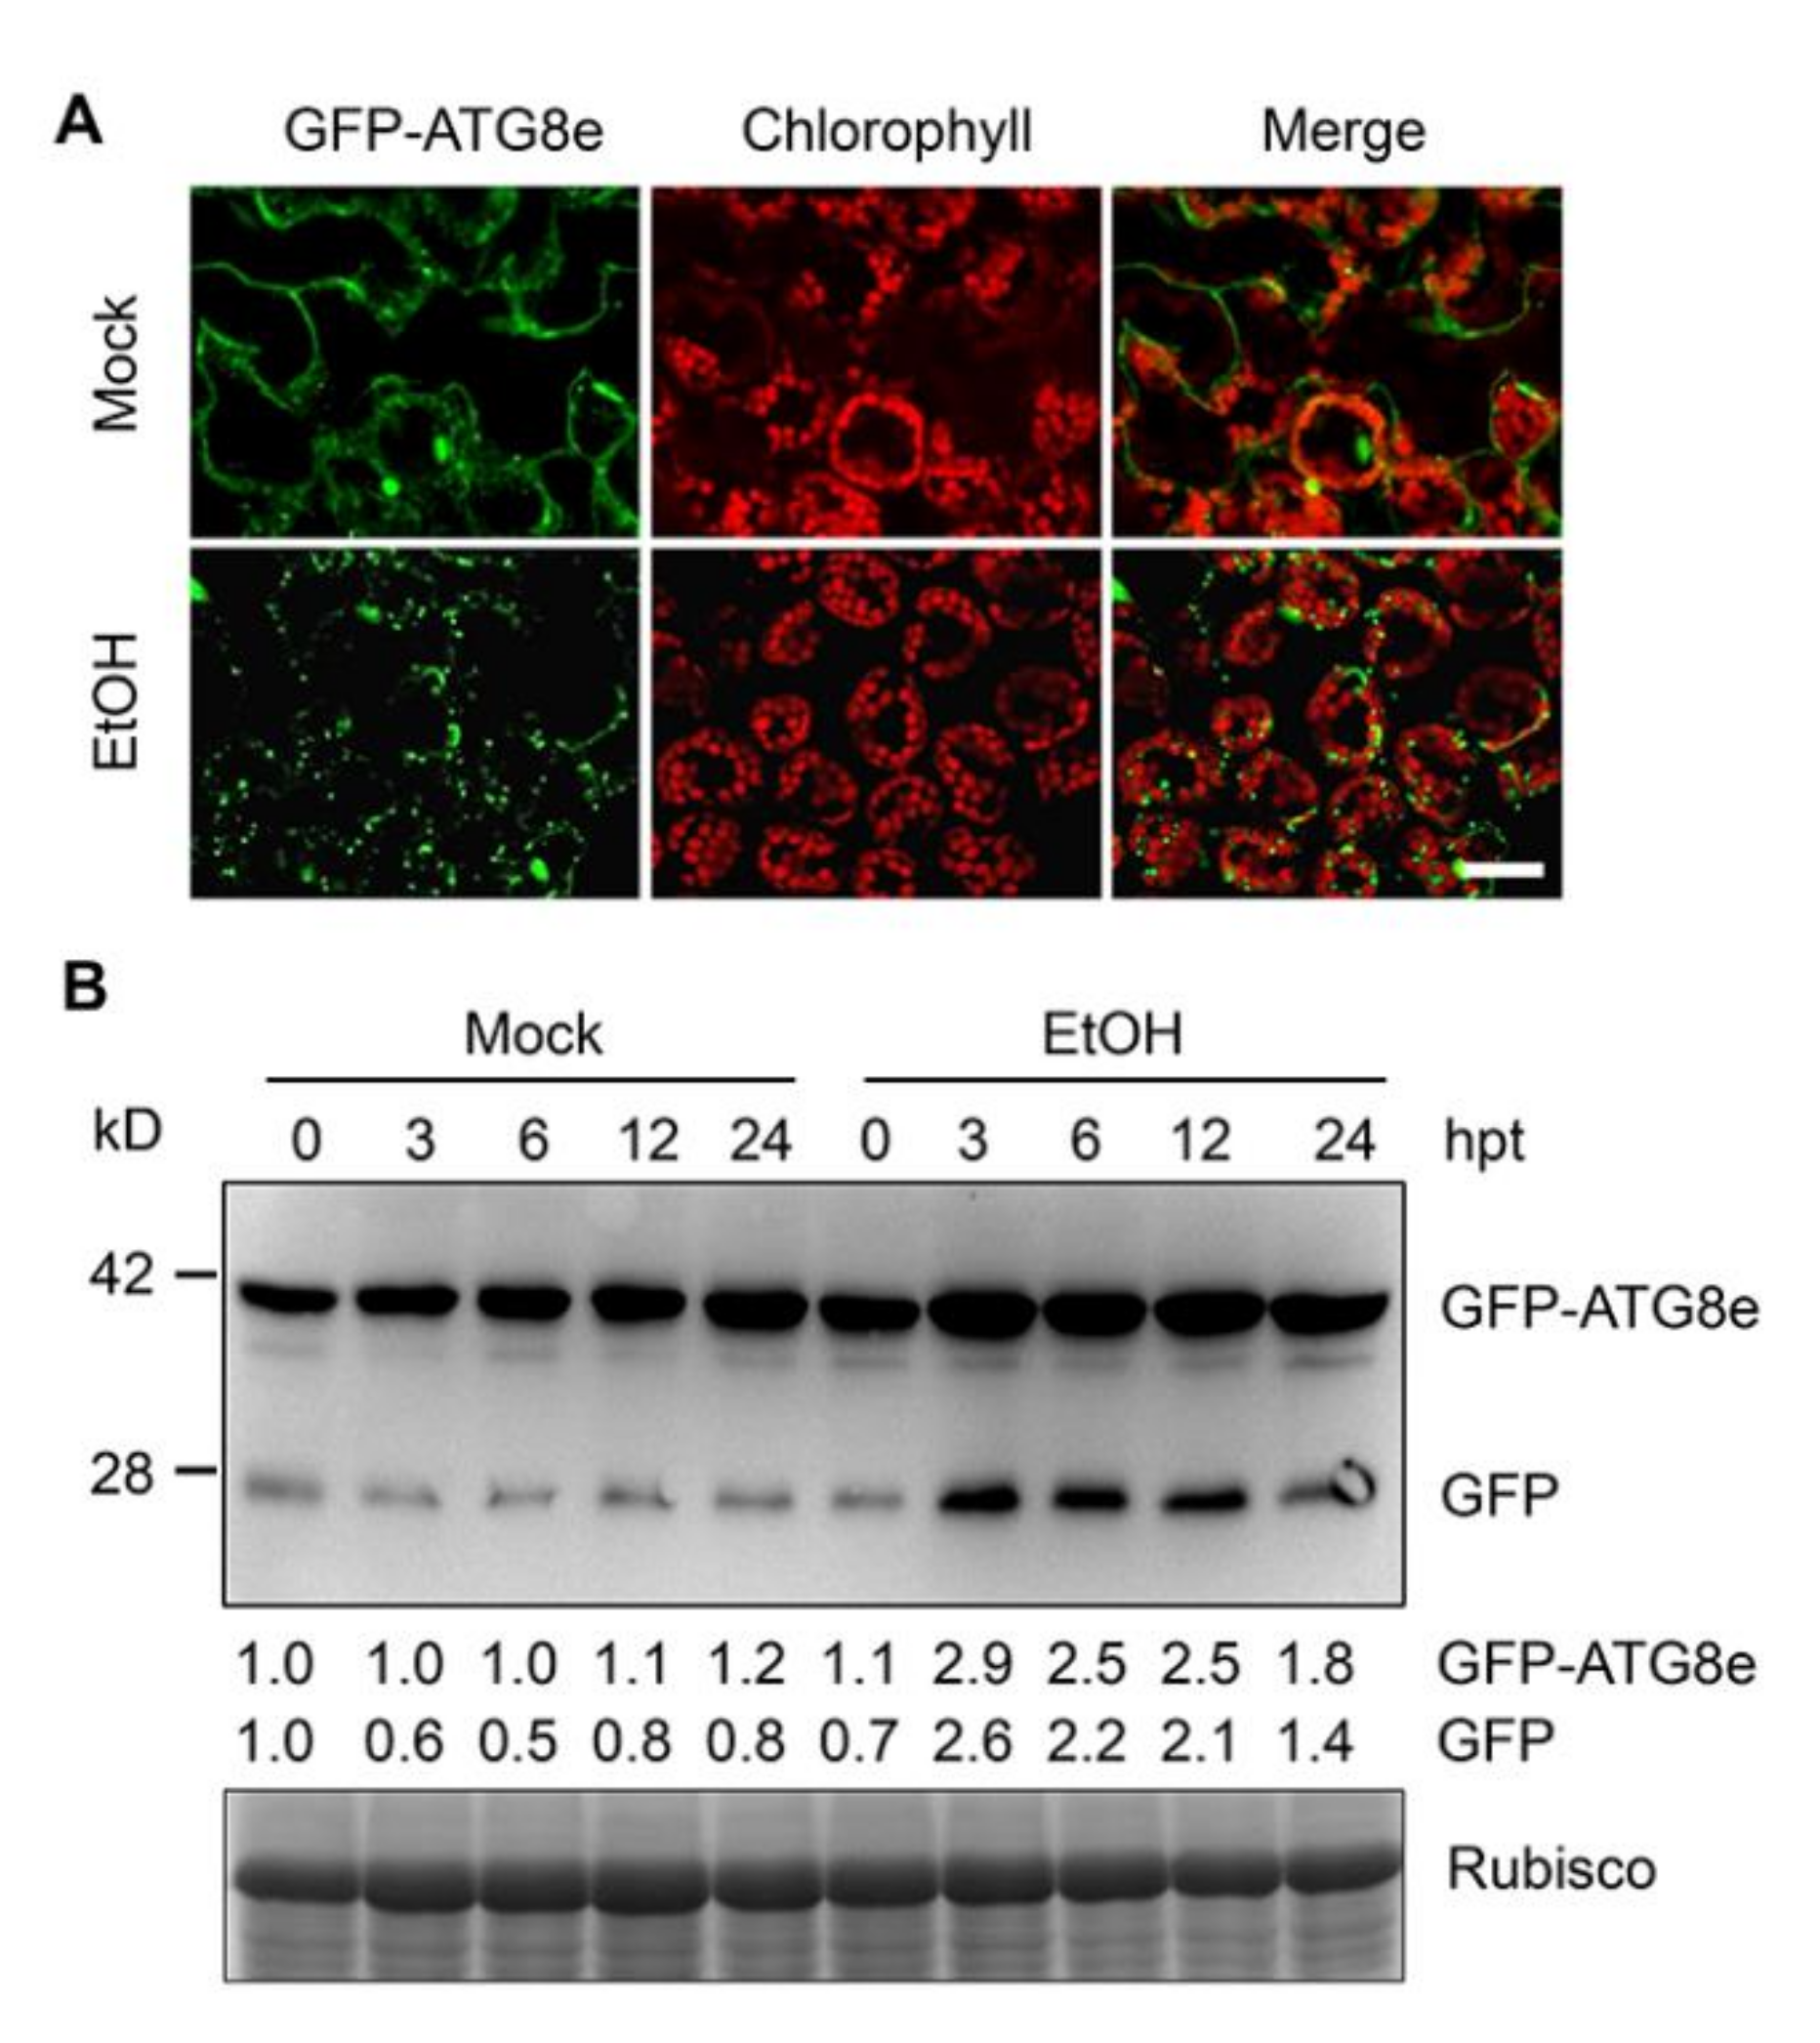
2.4. Ethanol Induces Autophagy
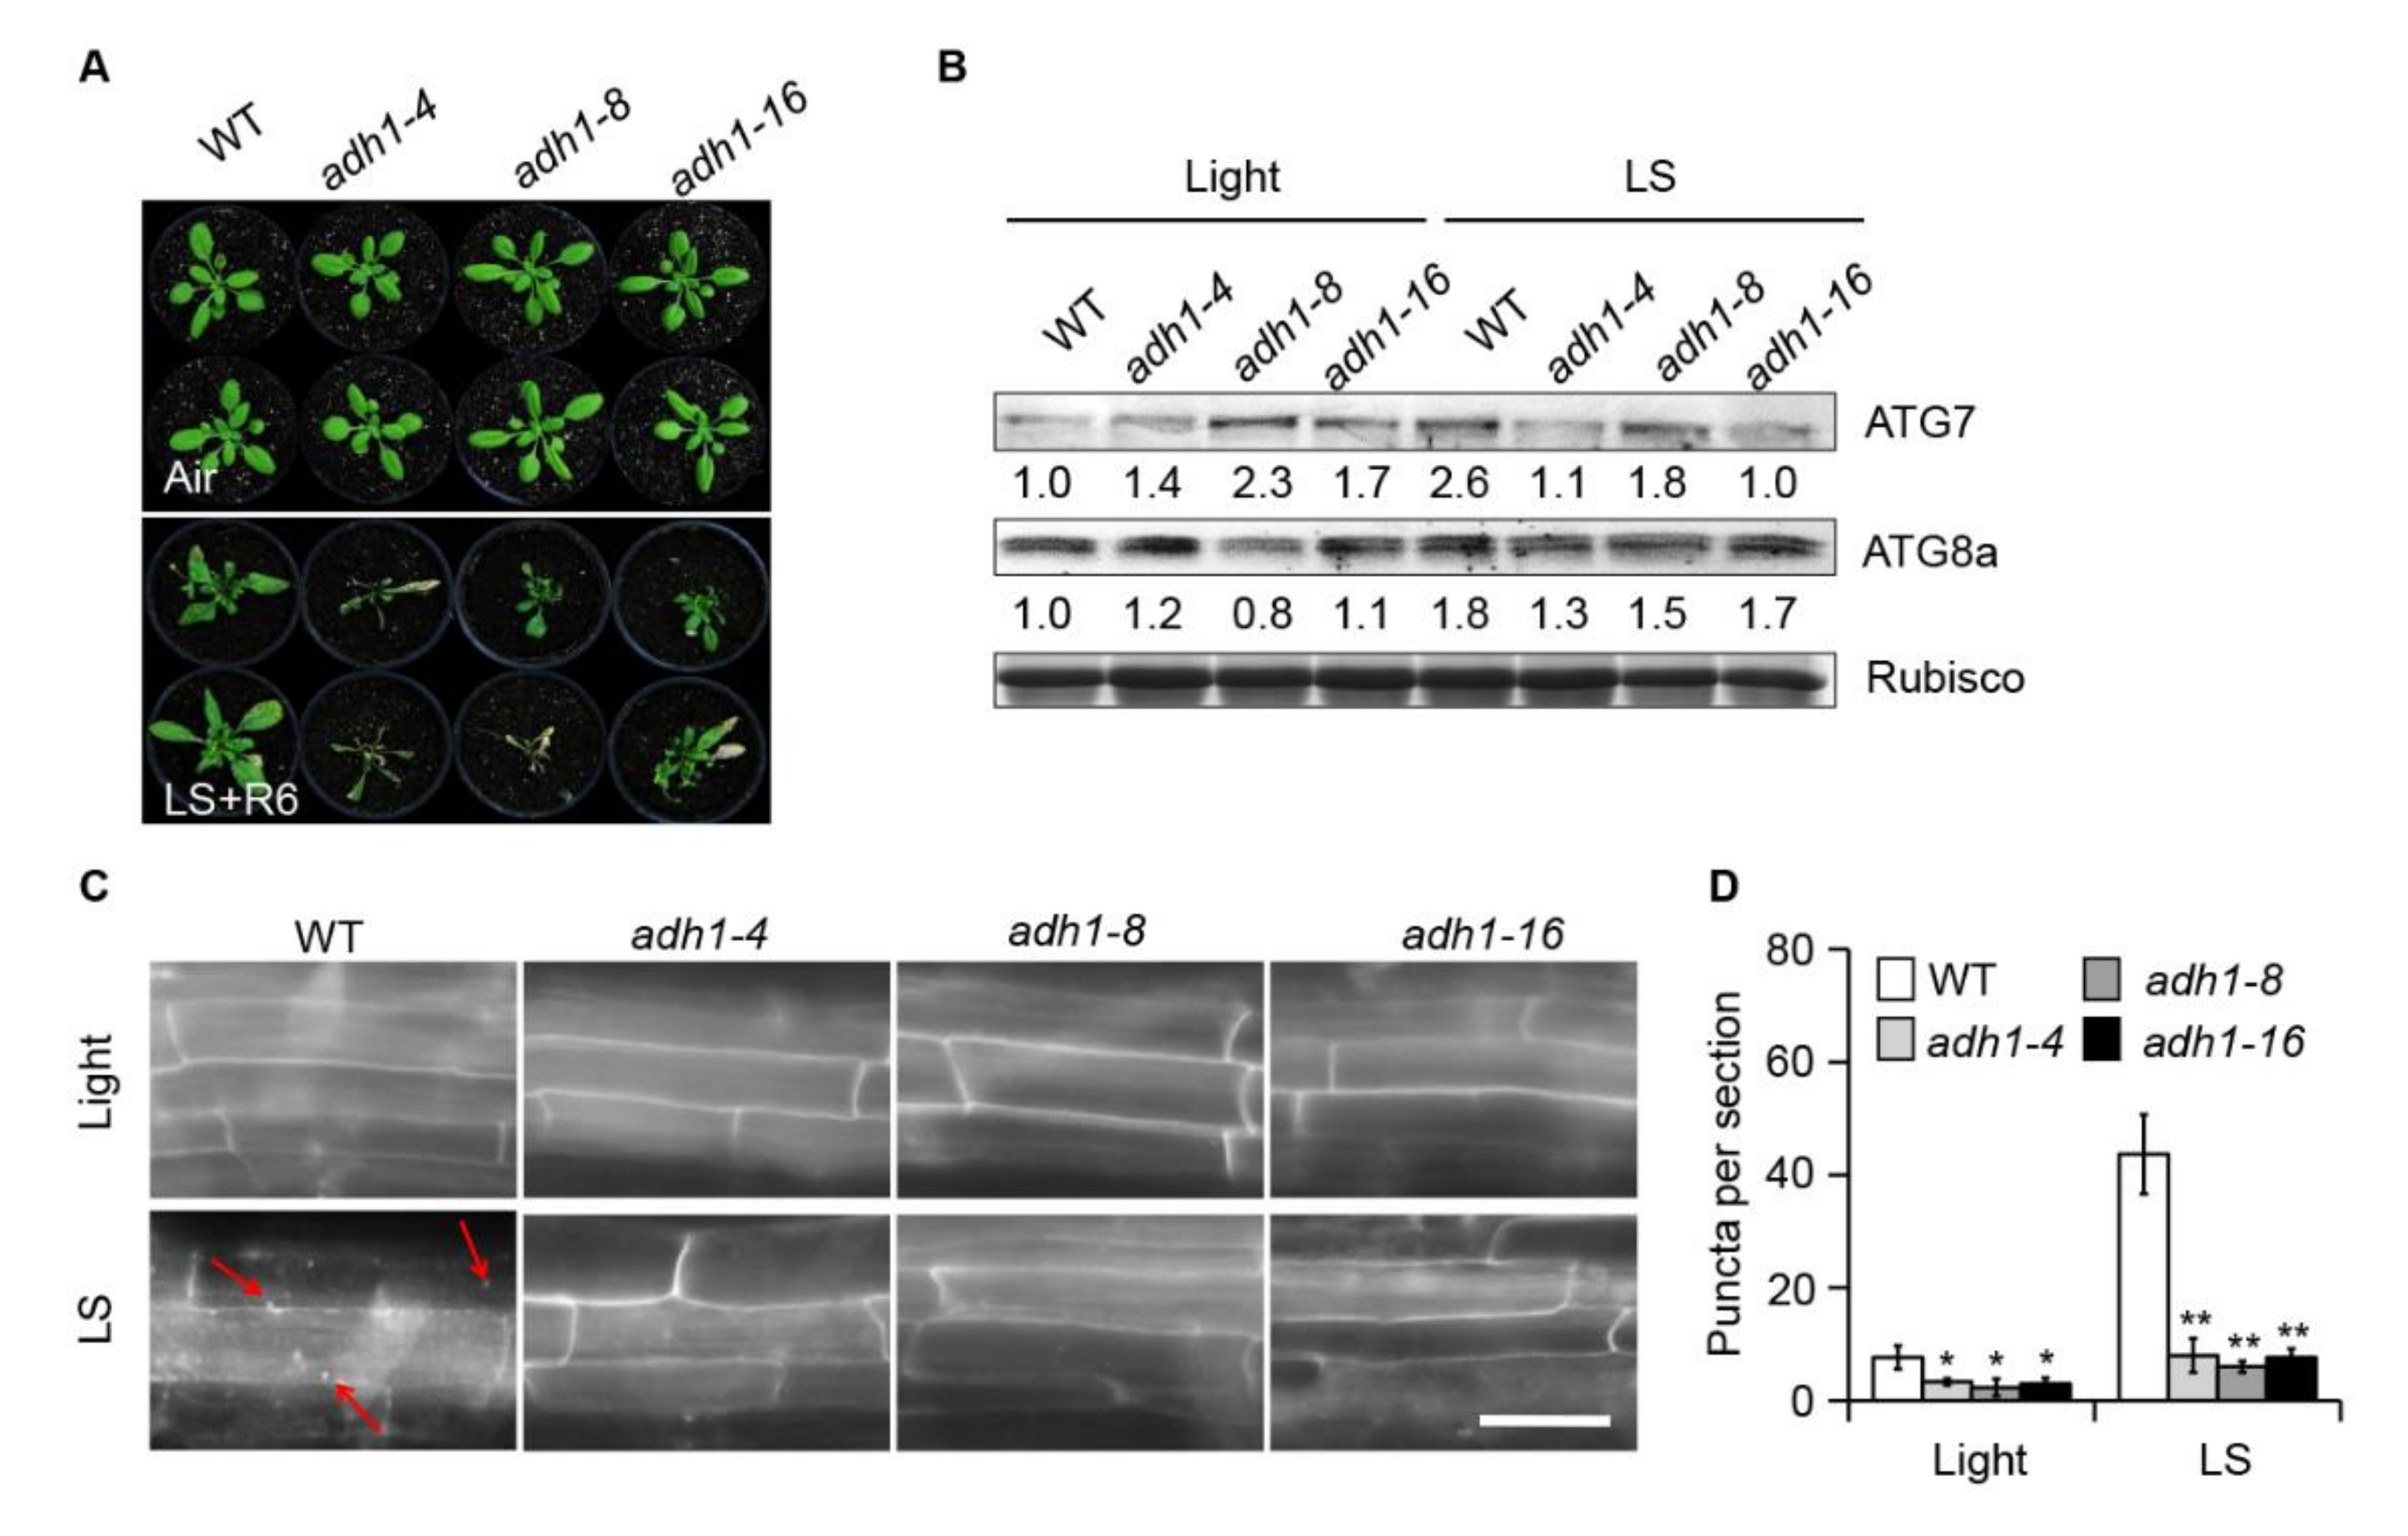
2.5. Disruption of ADH1 Attenuates Submergence-Induced Autophagy
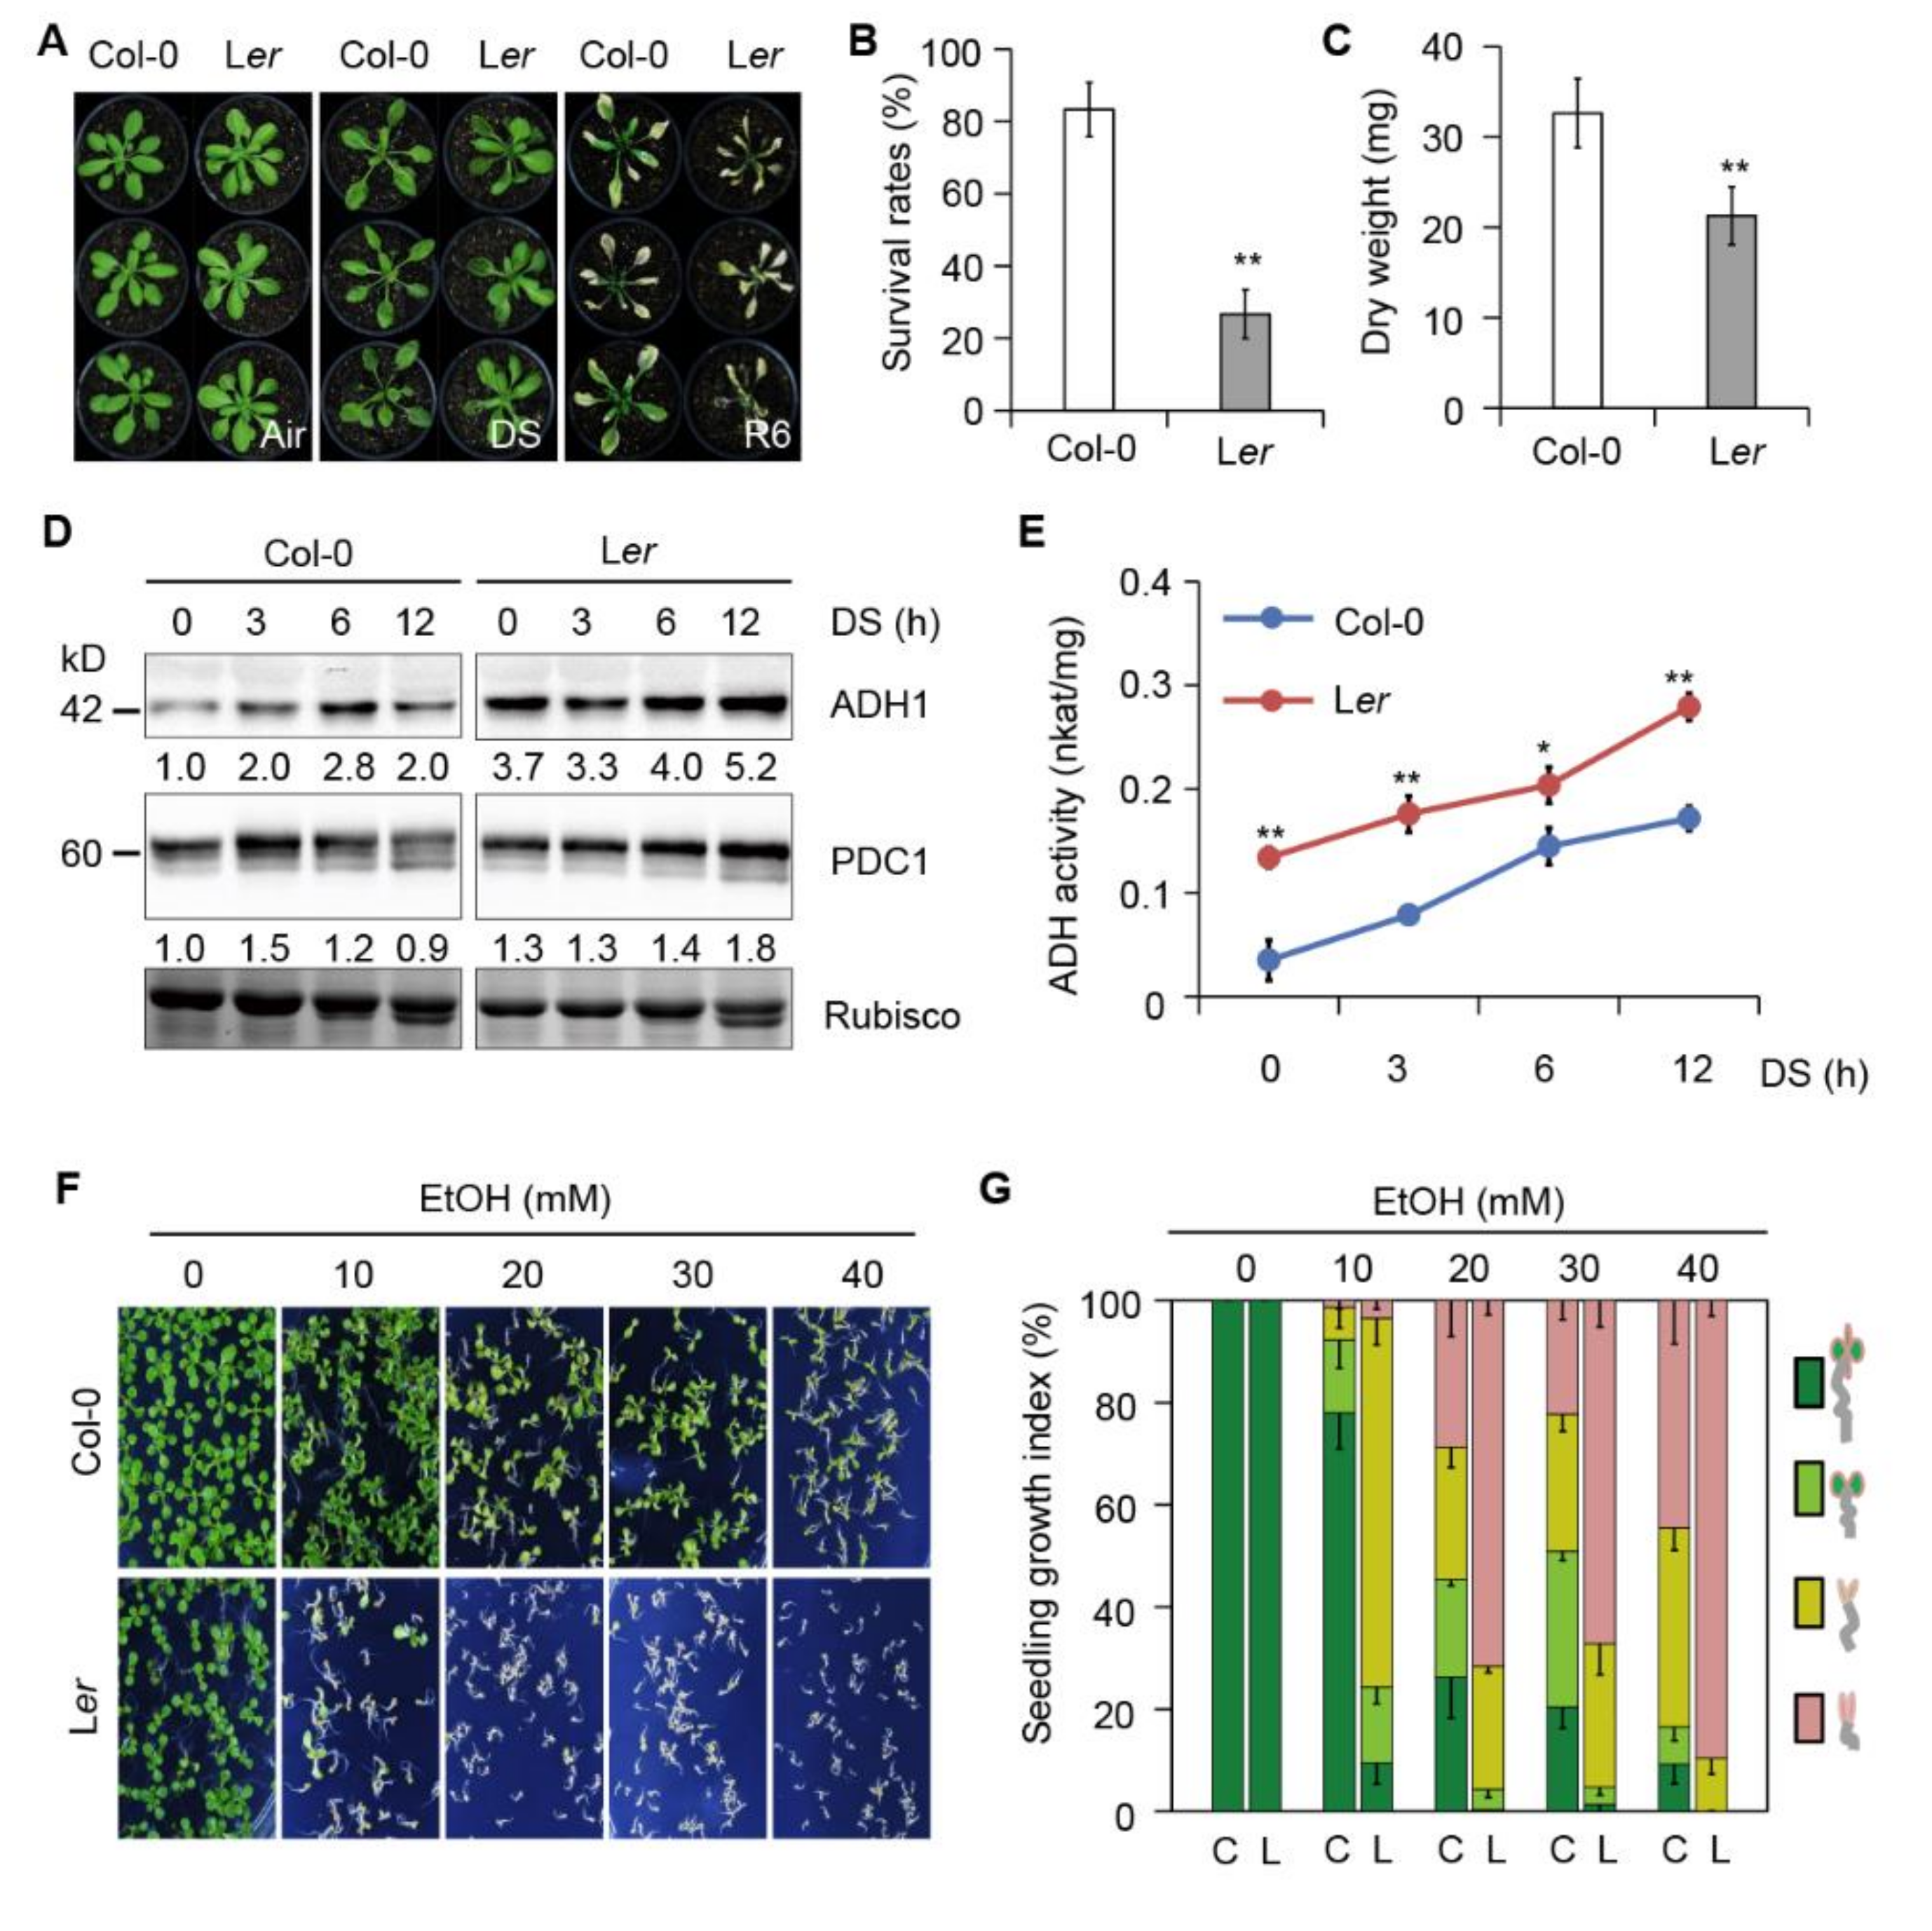
2.6. The Submergence-Intolerant Arabidopsis Accession Shows Increased Sensitivity to Ethanol
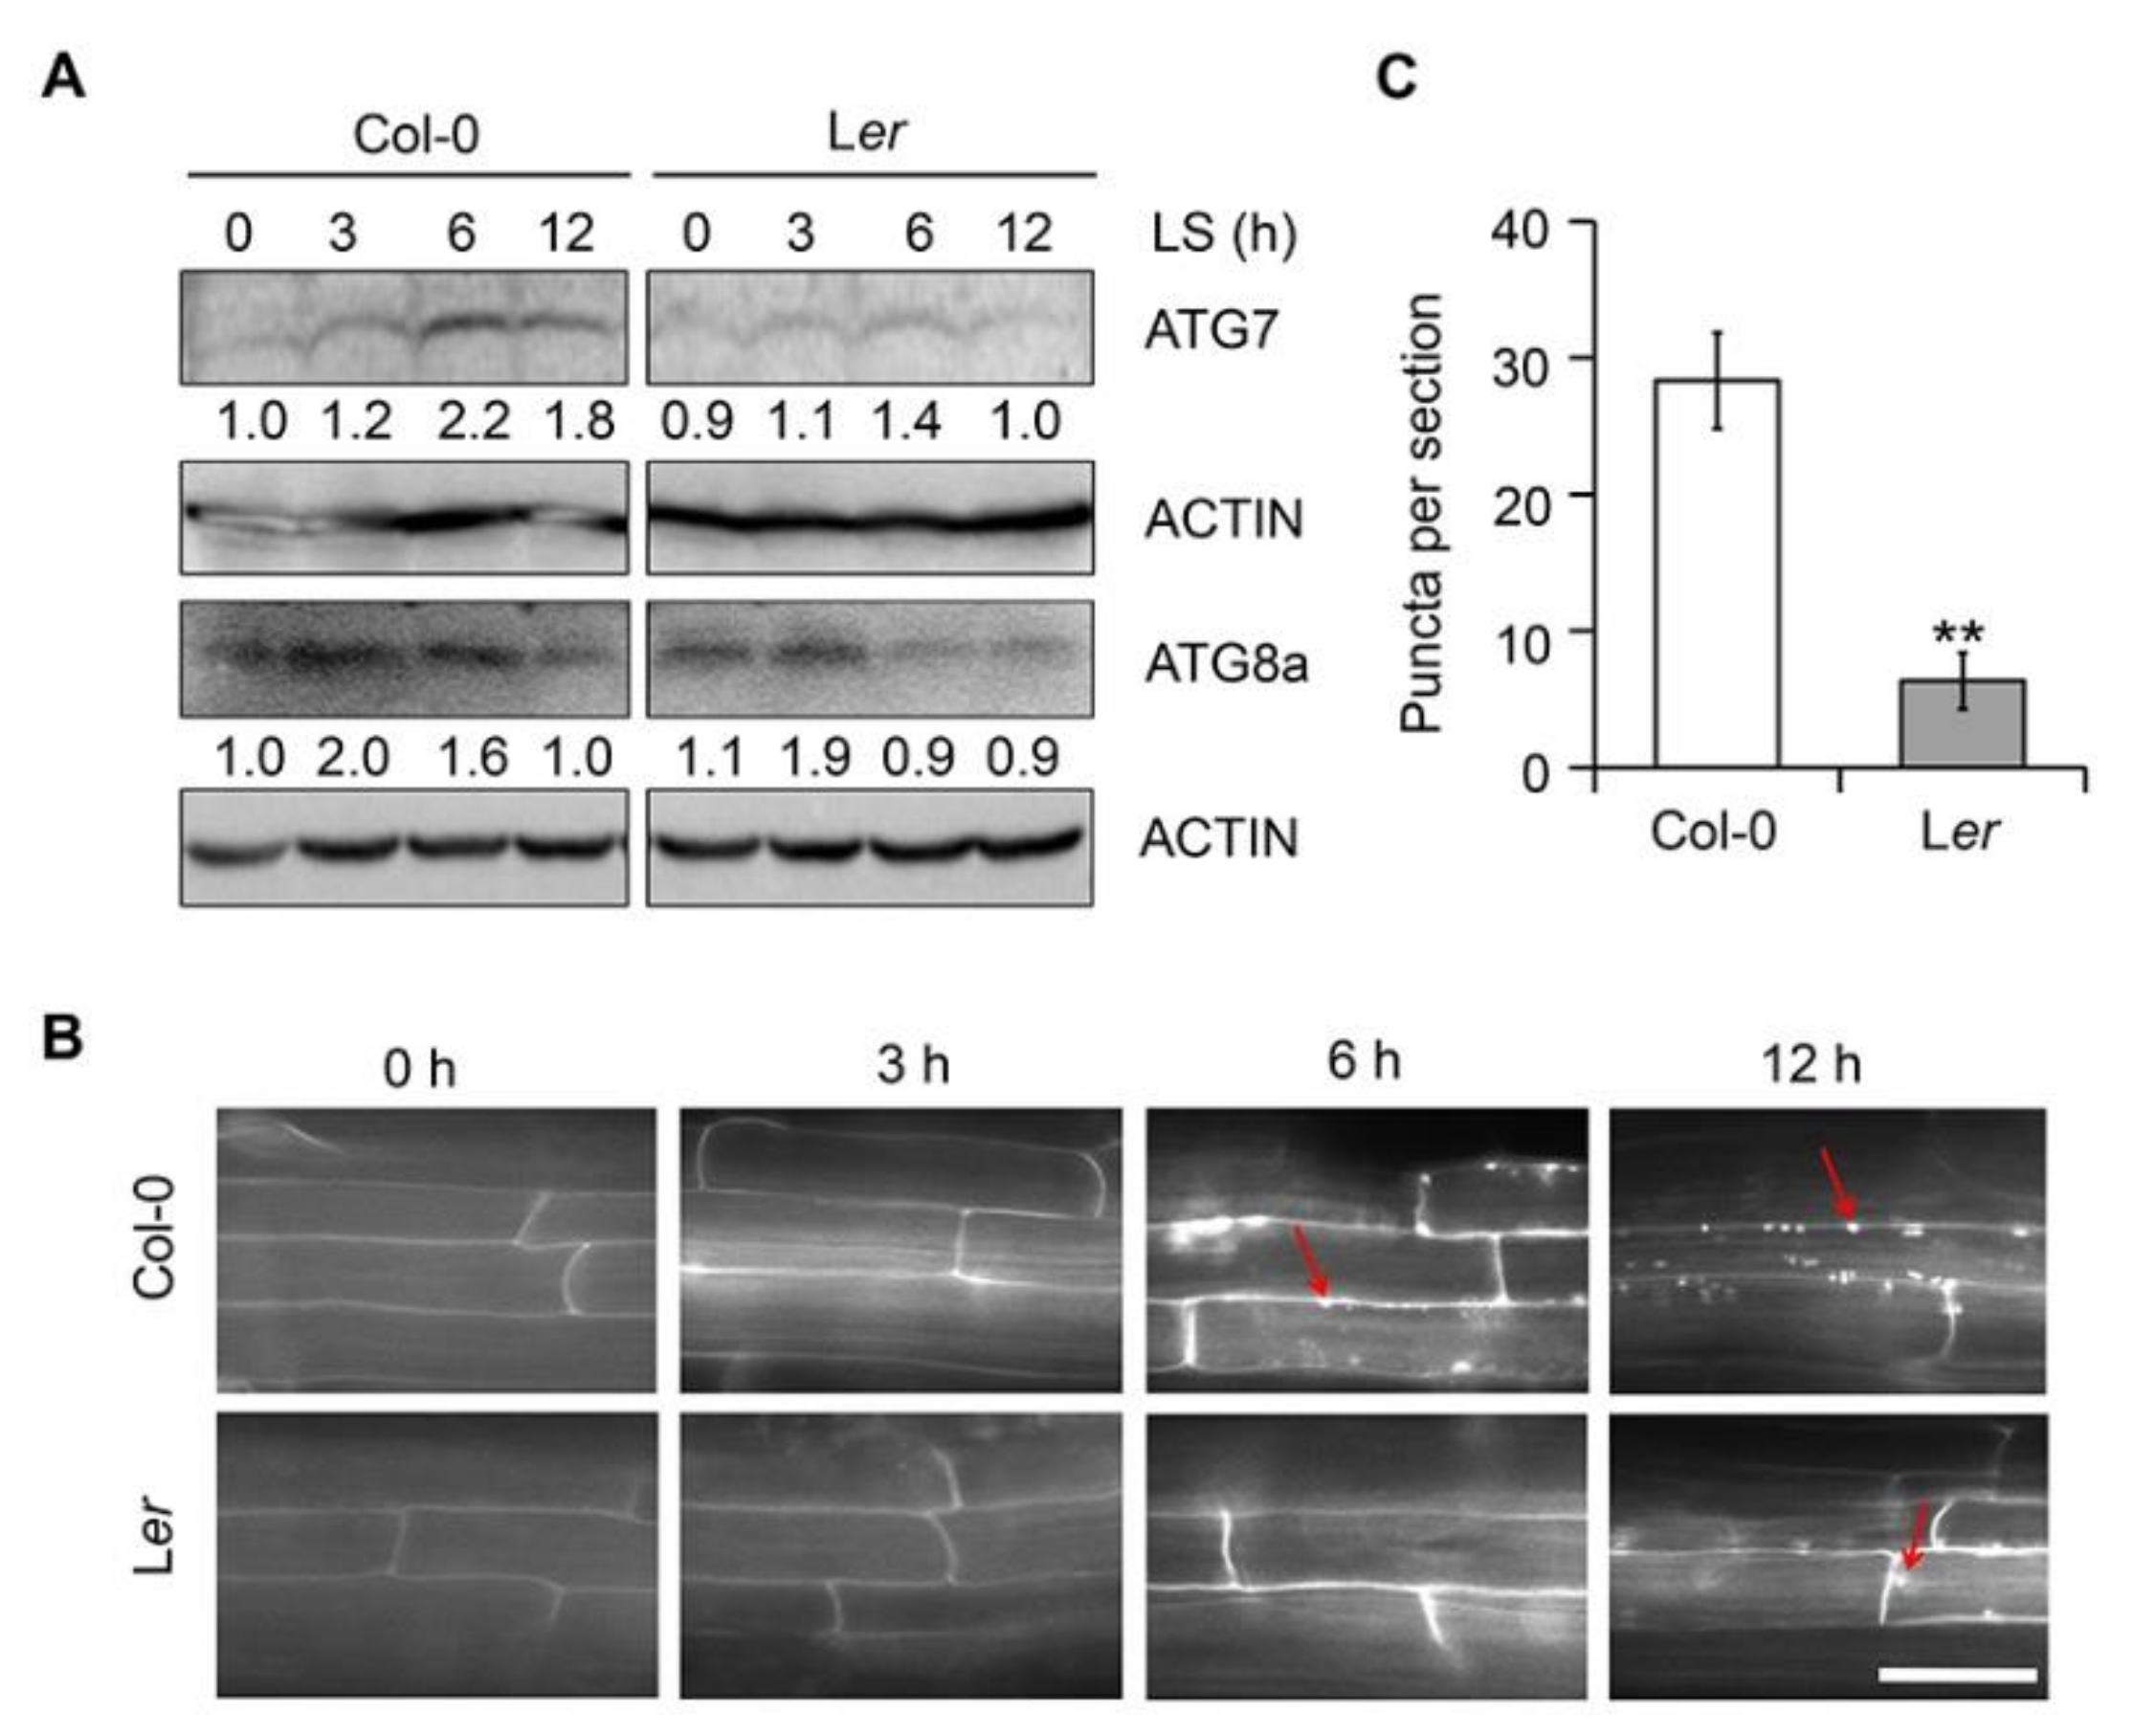
2.7. Ler Plants Show Reduced Autophagy in Response to Submergence
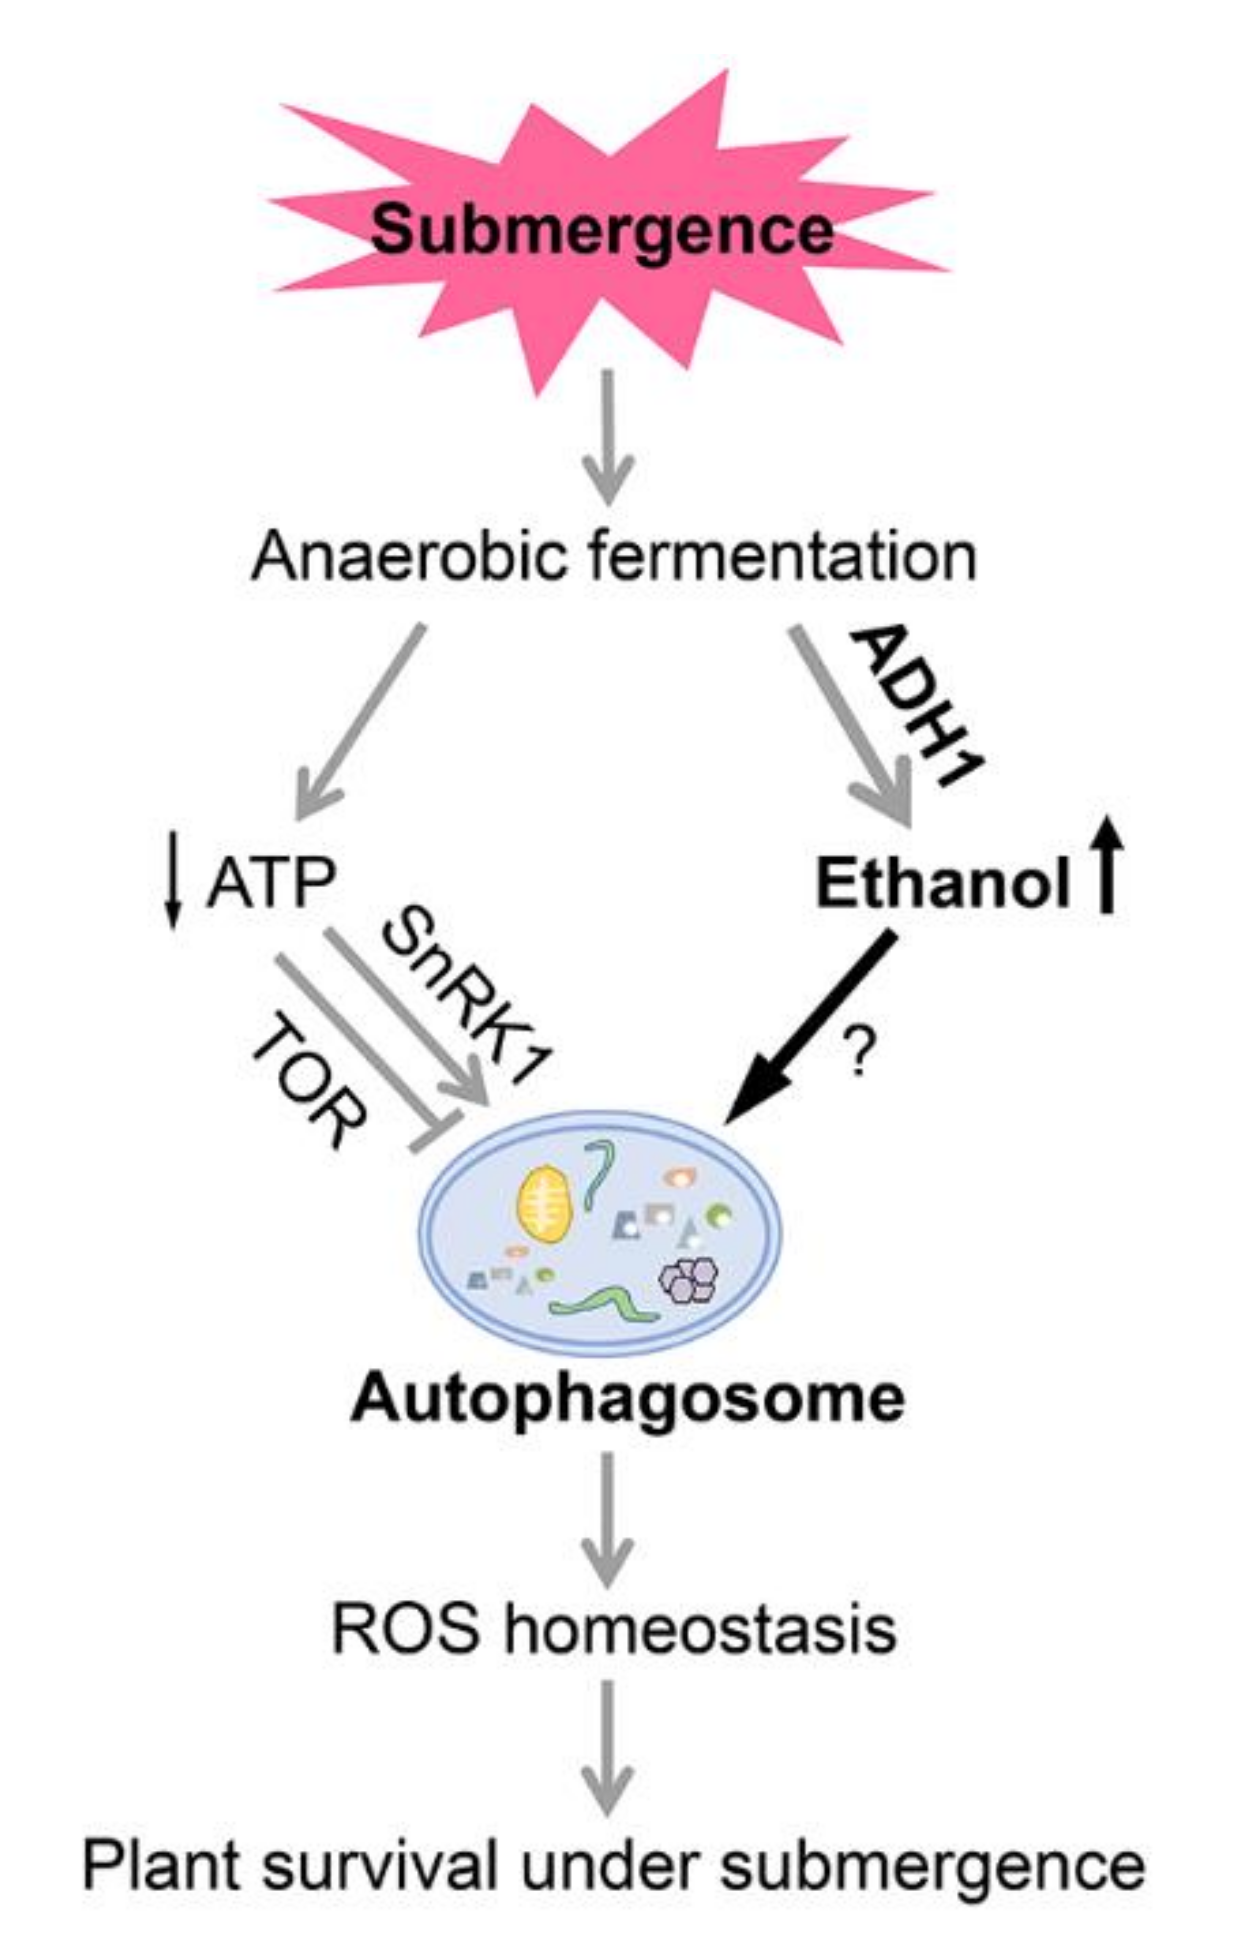
3. Discussion
4. Materials and Methods
4.1. Plant Material and Growth Conditions
4.2. Plant Treatments
4.3. RNA Extraction and Gene Expression Analysis
4.4. Protein Extraction and Immunoblot Analysis
4.5. ADH Activity Measurements
4.6. RNA Sequencing Analysis
4.7. Microscopy Analysis
Supplementary Materials
Author Contributions
Funding
Conflicts of Interest
Abbreviations
| ABA | Abscisic acid |
| ADH | Alcohol dehydrogenase |
| AlaAT | Alanine aminotransferase |
| ATG7 | AUTOPHAGY-RELATED PROTEIN 7 |
| ATG8e | AUTOPHAGY-RELATED PROTEIN 8e |
| BR | Brassinosteroid |
| CK | Control check |
| DEGs | Differentially expressed genes |
| EtOH | Ethyl alcohol |
| FC | Fold change |
| FDR | False discovery rate |
| GA | Gibberellin |
| GFP | GREEN FLUORESCENT PROTEIN |
| JA | Jasmonic acid |
| LDH | Lactate dehydrogenase |
| MDC | Monodansylcadaverine |
| MS | Murashige and Skoog |
| PDC | Pyruvate decarboxylase |
| ROS | Reactive oxygen species |
| RT-PCR | Reverse transcription-polymerase chain reaction |
| RT-qPCR | Reverse transcription quantitative PCR |
| SA | Salicylic acid |
| SnRK1 | Snf1-related protein kinase 1 |
| TF | Transcription factor |
| TOR | Target of rapamycin |
References
- Bailey-Serres, J.; Fukao, T.; Gibbs, D.J.; Holdsworth, M.J.; Lee, S.C.; Licausi, F.; Perata, P.; Voesenek, L.A.C.J.; van Dongen, J.T. Making sense of low oxygen sensing. Trends Plant Sci. 2012, 17, 129–138. [Google Scholar] [CrossRef]
- Voesenek, L.A.C.J.; Bailey-Serres, J. Flood adaptive traits and processes: An overview. New Phytol. 2015, 206, 57–73. [Google Scholar] [CrossRef]
- Bailey-Serres, J.; Lee, S.C.; Brinton, E. Waterproofing crops: Effective flooding survival strategies. Plant Physiol. 2012, 160, 1698–1709. [Google Scholar] [CrossRef] [Green Version]
- Sasidharan, R.; Bailey-Serres, J.; Ashikari, M.; Atwell, B.J.; Colmer, T.D.; Fagerstedt, K.; Fukao, T.; Geigenberger, P.; Hebelstrup, K.H.; Hill, R.D.; et al. Community recommendations on terminology and procedures used in flooding and low oxygen stress research. New Phytol. 2017, 214, 1403–1407. [Google Scholar] [CrossRef] [Green Version]
- Voesenek, L.A.C.J.; Colmer, T.D.; Pierik, R.; Millenaar, F.F.; Peeters, A.J.M. How plants cope with complete submergence. New Phytol. 2006, 170, 213–226. [Google Scholar] [CrossRef] [Green Version]
- Bailey-Serres, J.; Voesenek, L.A.C.J. Flooding stress: Acclimations and genetic diversity. Annu. Rev. Plant Biol. 2008, 59, 313–339. [Google Scholar] [CrossRef] [Green Version]
- Colmer, T.D.; Voesenek, L.A.C.J. Flooding tolerance: Suites of plant traits in variable environments. Funct. Plant Biol. 2009, 36, 665–681. [Google Scholar] [CrossRef]
- Sasidharan, R.; Voesenek, L.A.C.J. Ethylene-mediated acclimations to flooding stress. Plant Physiol. 2015, 169, 3–12. [Google Scholar] [CrossRef] [PubMed] [Green Version]
- Perata, P. Ethylene signaling controls fast oxygen sensing in plants. Trends Plant Sci. 2020, 25, 3–6. [Google Scholar] [CrossRef] [PubMed]
- Pucciariello, C.; Parlanti, S.; Banti, V.; Novi, G.; Perata, P. Reactive oxygen species-driven transcription in Arabidopsis under oxygen deprivation. Plant Physiol. 2012, 159, 184–196. [Google Scholar] [CrossRef] [PubMed] [Green Version]
- Pucciariello, C.; Perata, P. New insights into reactive oxygen species and nitric oxide signalling under low oxygen in plants. Plant Cell Environ. 2017, 40, 473–482. [Google Scholar] [CrossRef] [PubMed]
- Banti, V.; Giuntoli, B.; Gonzali, S.; Loreti, E.; Magneschi, L.; Novi, G.; Paparelli, E.; Parlanti, S.; Pucciariello, C.; Santaniello, A.; et al. Low oxygen response mechanisms in green organisms. Int. J. Mol. Sci. 2013, 14, 4734–4761. [Google Scholar] [CrossRef] [PubMed] [Green Version]
- Tadege, M.; Dupuis, I.; Kuhlemeier, C. Ethanolic fermentation: New functions for an old pathway. Trends Plant Sci. 1999, 4, 320–325. [Google Scholar] [CrossRef]
- Strommer, J. The plant ADH gene family. Plant J. 2011, 66, 128–142. [Google Scholar] [CrossRef]
- Christie, P.J.; Hahn, M.; Walbot, V. Low-temperature accumulation of alcohol dehydrogenase-1 mRNA and protein activity in maize and rice seedlings. Plant Physiol. 1991, 95, 699–706. [Google Scholar] [CrossRef] [Green Version]
- Jarillo, J.A.; Leyva, A.; Salinas, J.; Martinez-Zapater, J.M. Low temperature induces the accumulation of alcohol dehydrogenase mRNA in Arabidopsis thaliana, a chilling-tolerant plant. Plant Physiol. 1993, 101, 833–837. [Google Scholar] [CrossRef] [Green Version]
- Song, Y.; Liu, L.; Wei, Y.; Li, G.; Yue, X.; An, L. Metabolite profiling of adh1 mutant response to cold stress in Arabidopsis. Front. Plant Sci. 2017, 7, 2072. [Google Scholar] [CrossRef] [Green Version]
- Shi, H.; Liu, W.; Yao, Y.; Wei, Y.; Chan, Z. Alcohol dehydrogenase 1 (ADH1) confers both abiotic and biotic stress resistance in Arabidopsis. Plant Sci. 2017, 262, 24–31. [Google Scholar] [CrossRef]
- Dolferus, R.; Jacobs, M.; Peacock, W.J.; Dennis, E.S. Differential interactions of promoter elements in stress responses of the Arabidopsis Adh gene. Plant Physiol. 1994, 105, 1075–1087. [Google Scholar] [CrossRef] [Green Version]
- Minhas, D.; Grover, A. Transcript levels of genes encoding various glycolytic and fermentation enzymes change in response to abiotic stresses. Plant Sci. 1999, 146, 41–51. [Google Scholar] [CrossRef]
- Kato-Noguchi, H. Wounding stress induces alcohol dehydrogenase in maize and lettuce seedlings. Plant Growth Regul. 2001, 35, 285–288. [Google Scholar] [CrossRef]
- Yang, C.Y. Hydrogen peroxide controls transcriptional responses of ERF73/HRE1 and ADH1 via modulation of ethylene signaling during hypoxic stress. Planta 2014, 239, 877–885. [Google Scholar] [CrossRef] [PubMed]
- Hwang, S.; VanToai, T.T. Abscisic acid induces anaerobiosis tolerance in corn. Plant Physiol. 1991, 97, 593–597. [Google Scholar] [CrossRef]
- de Bruxelles, G.L.; Peacock, W.J.; Dennis, E.S.; Dolferus, R. Abscisic acid induces the alcohol dehydrogenase gene in Arabidopsis. Plant Physiol. 1996, 111, 381–391. [Google Scholar] [CrossRef] [PubMed] [Green Version]
- Peng, H.P.; Chan, C.S.; Shih, M.C.; Yang, S.F. Signaling events in the hypoxic induction of alcohol dehydrogenase gene in Arabidopsis. Plant Physiol. 2001, 126, 742–749. [Google Scholar] [CrossRef] [PubMed] [Green Version]
- Frenkel, C.; Erez, A. Induction of chilling tolerance in cucumber (Cucumis sativus) seedlings by endogenous and applied ethanol. Physiol. Plant. 1996, 96, 593–600. [Google Scholar] [CrossRef]
- Kato-Noguchi, H.; Yasuda, Y. Effect of low temperature on ethanolic fermentation in rice seedlings. J. Plant Physiol. 2007, 164, 1013–1018. [Google Scholar] [CrossRef]
- Nguyen, H.M.; Sako, K.; Matsui, A.; Suzuki, Y.; Mostofa, M.G.; Ha, C.V.; Tanaka, M.; Tran, L.P.; Habu, Y.; Seki, M. Ethanol enhances high-salinity stress tolerance by detoxifying reactive oxygen species in Arabidopsis thaliana and rice. Front. Plant Sci. 2017, 8, 1001. [Google Scholar] [CrossRef] [Green Version]
- Chen, L.; Liao, B.; Qi, H.; Xie, L.J.; Huang, L.; Tan, W.J.; Zhai, N.; Yuan, L.B.; Zhou, Y.; Yu, L.J.; et al. Autophagy contributes to regulation of the hypoxia response during submergence in Arabidopsis thaliana. Autophagy 2015, 11, 2233–2246. [Google Scholar] [CrossRef] [Green Version]
- Soto-Burgos, J.; Bassham, D.C. SnRK1 activates autophagy via the TOR signaling pathway in Arabidopsis thaliana. PLoS ONE 2017, 12, e0182591. [Google Scholar] [CrossRef] [Green Version]
- Chen, L.; Su, Z.Z.; Huang, L.; Xia, F.N.; Qi, H.; Xie, L.J.; Xiao, S.; Chen, Q.F. The AMP-activated protein kinase KIN10 is involved in the regulation of autophagy in Arabidopsis. Front. Plant Sci. 2017, 8, 1201. [Google Scholar] [CrossRef] [PubMed] [Green Version]
- Tian, T.; Liu, Y.; Yan, H.; You, Q.; Yi, X.; Du, Z.; Xu, W.; Su, Z. agriGO v2.0: A GO analysis toolkit for the agricultural community, 2017 update. Nucleic Acids Res. 2017, 45, W122–W129. [Google Scholar] [CrossRef] [PubMed]
- Zhou, Y.; Zhou, B.; Pache, L.; Chang, M.; Khodabakhshi, A.H.; Tanaseichuk, O.; Benner, C.; Chanda, S.K. Metascape provides a biologist-oriented resource for the analysis of systems-level datasets. Nat. Commun. 2019, 10, 1523. [Google Scholar] [CrossRef] [PubMed]
- Huang, D.W.; Sherman, B.T.; Lempicki, R.A. Systematic and integrative analysis of large gene lists using DAVID bioinformatics resources. Nat. Protoc. 2009, 4, 44–57. [Google Scholar] [CrossRef] [PubMed]
- Branco-Price, C.; Kawaguchi, R.; Ferreira, R.B.; Bailey-Serres, J. Genome-wide analysis of transcript abundance and translation in Arabidopsis seedlings subjected to oxygen deprivation. Ann. Bot. 2005, 96, 647–660. [Google Scholar] [CrossRef] [PubMed] [Green Version]
- Lee, S.C.; Mustroph, A.; Sasidharan, R.; Vashisht, D.; Pedersen, O.; Oosumi, T.; Voesenek, L.A.C.J.; Bailey-Serres, J. Molecular characterization of the submergence response of the Arabidopsis thaliana ecotype Columbia. New Phytol. 2011, 190, 457–471. [Google Scholar] [CrossRef] [PubMed]
- Liu, F.; VanToai, T.; Moy, L.P.; Bock, G.; Linford, L.D.; Quackenbush, J. Global transcription profiling reveals comprehensive insights into hypoxic response in Arabidopsis. Plant Physiol. 2005, 137, 1115–1129. [Google Scholar] [CrossRef] [Green Version]
- Jin, J.; Tian, F.; Yang, D.C.; Meng, Y.Q.; Kong, L.; Luo, J.; Gao, G. PlantTFDB 4.0: Toward a central hub for transcription factors and regulatory interactions in plants. Nucleic Acids Res. 2017, 45, D1040–D1045. [Google Scholar] [CrossRef] [Green Version]
- Giuntoli, B.; Perata, P. Group VII ethylene response factors in Arabidopsis: Regulation and physiological roles. Plant Physiol. 2018, 176, 1143–1155. [Google Scholar] [CrossRef] [Green Version]
- Jiang, Z.; Liu, X.; Peng, Z.; Wan, Y.; Ji, Y.; He, W.; Wan, W.; Luo, J.; Guo, H. AHD2.0: An update version of Arabidopsis hormone database for plant systematic studies. Nucleic Acids Res. 2011, 39, D1123–D1129. [Google Scholar] [CrossRef] [Green Version]
- Yang, C.Y.; Hong, C.P. The NADPH oxidase Rboh D is involved in primary hypoxia signalling and modulates expression of hypoxia-inducible genes under hypoxic stress. Environ. Exp. Bot. 2015, 115, 63–72. [Google Scholar] [CrossRef]
- Liu, B.; Sun, L.; Ma, L.; Hao, F. Both AtrbohD and AtrbohF are essential for mediating responses to oxygen deficiency in Arabidopsis. Plant Cell Rep. 2017, 36, 947–957. [Google Scholar] [CrossRef] [PubMed]
- Baxter-Burrell, A.; Yang, Z.; Springer, P.S.; Bailey-Serres, J. RopGAP4-dependent Rop GTPase rheostat control of Arabidopsis oxygen deprivation tolerance. Science 2002, 296, 2026–2028. [Google Scholar] [CrossRef] [PubMed] [Green Version]
- Xiao, S.; Gao, W.; Chen, Q.F.; Chan, S.W.; Zheng, S.X.; Ma, J.; Wang, M.; Welti, R.; Chye, M.L. Overexpression of Arabidopsis acyl-CoA binding protein ACBP3 promotes starvation-induced and age-dependent leaf senescence. Plant Cell 2010, 22, 1463–1482. [Google Scholar] [CrossRef] [PubMed] [Green Version]
- Zhang, F.; Maeder, M.L.; Unger-Wallace, E.; Hoshaw, J.P.; Reyon, D.; Christian, M.; Li, X.; Pierick, C.J.; Dobbs, D.; Peterson, T.; et al. High frequency targeted mutagenesis in Arabidopsis thaliana using zinc finger nucleases. Proc. Natl. Acad. Sci. USA 2010, 107, 12028–12033. [Google Scholar] [CrossRef] [Green Version]
- Hirayama, T.; Fujishige, N.; Kunii, T.; Nishimura, N.; Iuchi, S.; Shinozaki, K. A novel ethanol-hypersensitive mutant of Arabidopsis. Plant Cell Physiol. 2004, 45, 703–711. [Google Scholar] [CrossRef] [Green Version]
- Santos, D.; Rijo, J.; Jacobs, M.; Dennis, E.; Dolferus, R. Approaches for the isolation of Arabidopsis adh1 regulatory mutants using allyl alcohol selection. Russ. J. Plant Physl. 2003, 50, 762–773. [Google Scholar] [CrossRef]
- Jacobs, M.; Dolferus, R.; Bossche, D. Isolation and biochemical analysis of ethyl methanesulfonate-induced alcohol dehydrogenase null mutants of Arabidopsis thaliana (L.) Heynh. Biochem. Genet. 1988; 26, 105–122. [Google Scholar] [CrossRef]
- Ismond, K.P.; Dolferus, R.; de Pauw, M.; Dennis, E.S.; Good, A.G. Enhanced low oxygen survival in Arabidopsis through increased metabolic flux in the fermentative pathway. Plant Physiol. 2003, 132, 1292–1302. [Google Scholar] [CrossRef] [Green Version]
- Xie, L.J.; Chen, Q.F.; Chen, M.X.; Yu, L.J.; Huang, L.; Chen, L.; Wang, F.Z.; Xia, F.N.; Zhu, T.R.; Wu, J.X.; et al. Unsaturation of very-long-chain ceramides protects plant from hypoxia-induced damages by modulating ethylene signaling in Arabidopsis. PLoS Genet. 2015, 11, e1005143. [Google Scholar] [CrossRef]
- Xie, L.J.; Yu, L.J.; Chen, Q.F.; Wang, F.Z.; Huang, L.; Xia, F.N.; Zhu, T.R.; Wu, J.X.; Yin, J.; Liao, B.; et al. Arabidopsis acyl-CoA-binding protein ACBP3 participates in plant response to hypoxia by modulating very-long-chain fatty acid metabolism. Plant J. 2015, 81, 53–67. [Google Scholar] [CrossRef]
- Ellis, M.H.; Dennis, E.S.; Peacock, W.J. Arabidopsis roots and shoots have different mechanisms for hypoxic stress tolerance. Plant Physiol. 1999, 119, 57–64. [Google Scholar] [CrossRef] [PubMed] [Green Version]
- Vashisht, D.; Hesselink, A.; Pierik, R.; Ammerlaan, J.M.H.; Bailey-Serres, J.; Visser, E.J.W.; Pedersen, O.; van Zanten, M.; Vreugdenhil, D.; Jamar, D.C.L.; et al. Natural variation of submergence tolerance among Arabidopsis thaliana accessions. New Phytol. 2011, 190, 299–310. [Google Scholar] [CrossRef] [PubMed]
- van Veen, H.; Vashisht, D.; Akman, M.; Girke, T.; Mustroph, A.; Reinen, E.; Hartman, S.; Kooiker, M.; van Tienderen, P.; Schranz, M.E.; et al. Transcriptomes of eight Arabidopsis thaliana accessions reveal core conserved, genotype- and organ-specific responses to flooding stress. Plant Physiol. 2016, 172, 668–689. [Google Scholar] [CrossRef] [PubMed]
- McKenzie, J.A.; McKechnie, S.W. Ethanol tolerance and the Adh polymorphism in a natural population of Drosophila melanogaster. Nature 1978, 272, 75–76. [Google Scholar] [CrossRef] [PubMed]
- Gibson, J.B.; Wilks, A.V. The alcohol dehydrogenase polymorphism of Drosophila melanogaster in relation to environmental ethanol, ethanol tolerance and alcohol dehydrogenase activity. Heredity 1988, 60, 403–414. [Google Scholar] [CrossRef] [Green Version]
- Chenevert, S.W.; Fossett, N.G.; Chang, S.H.; Tsigelny, I.; Baker, M.E.; Lee, W.R. Amino acids important in enzyme activity and dimer stability for Drosophila alcohol dehydrogenase. Biochem. J. 1995, 308, 419–423. [Google Scholar] [CrossRef] [Green Version]
- Drew, M.C. OXYGEN DEFICIENCY AND ROOT METABOLISM: Injury and acclimation under hypoxia and anoxia. Annu. Rev. Plant Physiol. Plant Mol. Biol. 1997, 48, 223–250. [Google Scholar] [CrossRef]
- Qi, H.; Xia, F.N.; Xie, L.J.; Yu, L.J.; Chen, Q.F.; Zhuang, X.H.; Wang, Q.; Li, F.; Jiang, L.; Xie, Q.; et al. TRAF family proteins regulate autophagy dynamics by modulating AUTOPHAGY PROTEIN6 stability in Arabidopsis. Plant Cell 2017, 29, 890–911. [Google Scholar] [CrossRef] [Green Version]
- Bloomer, R.H.; Dean, C. Fine-tuning timing: Natural variation informs the mechanistic basis of the switch to flowering in Arabidopsis thaliana. J. Exp. Bot. 2017, 68, 5439–5452. [Google Scholar] [CrossRef]
- Bouchabke, O.; Chang, F.; Simon, M.; Voisin, R.; Pelletier, G.; Durand-Tardif, M. Natural variation in Arabidopsis thaliana as a tool for highlighting differential drought responses. PLoS ONE 2008, 3, e1705. [Google Scholar] [CrossRef]
- Kellermeier, F.; Chardon, F.; Amtmann, A. Natural variation of Arabidopsis root architecture reveals complementing adaptive strategies to potassium starvation. Plant Physiol. 2013, 161, 1421–1432. [Google Scholar] [CrossRef] [PubMed] [Green Version]
- Silva-Guzman, M.; Addo-Quaye, C.; Dilkes, B.P. Re-evaluation of reportedly metal tolerant Arabidopsis thaliana accessions. PLoS ONE 2016, 11, e0130679. [Google Scholar] [CrossRef] [PubMed]
- Sutka, M.; Li, G.; Boudet, J.; Boursiac, Y.; Doumas, P.; Maurel, C. Natural variation of root hydraulics in Arabidopsis grown in normal and salt-stressed conditions. Plant Physiol. 2011, 155, 1264–1276. [Google Scholar] [CrossRef] [PubMed] [Green Version]
- Alexandersson, E.; Danielson, J.Å.H.; Råde, J.; Moparthi, V.K.; Fontes, M.; Kjellbom, P.; Johanson, U. Transcriptional regulation of aquaporins in accessions of Arabidopsis in response to drought stress. Plant J. 2010, 61, 650–660. [Google Scholar] [CrossRef]
- Degenkolbe, T.; Giavalisco, P.; Zuther, E.; Seiwert, B.; Hincha, D.K.; Willmitzer, L. Differential remodeling of the lipidome during cold acclimation in natural accessions of Arabidopsis thaliana. Plant J. 2012, 72, 972–982. [Google Scholar] [CrossRef]
- Yeung, E.; van Veen, H.; Vashisht, D.; Paiva, A.L.S.; Hummel, M.; Rankenberg, T.; Steffens, B.; Steffen-Heins, A.; Sauter, M.; de Vries, M.; et al. A stress recovery signaling network for enhanced flooding tolerance in Arabidopsis thaliana. Proc. Natl. Acad. Sci. USA 2018, 115, E6085–E6094. [Google Scholar] [CrossRef] [Green Version]
- Kürsteiner, O.; Dupuis, I.; Kuhlemeier, C. The pyruvate decarboxylase1 gene of Arabidopsis is required during anoxia but not other environmental stresses. Plant Physiol. 2003, 132, 968–978. [Google Scholar] [CrossRef] [Green Version]
- Mustroph, A.; Lee, S.C.; Oosumi, T.; Zanetti, M.E.; Yang, H.; Ma, K.; Yaghoubi-Masihi, A.; Fukao, T.; Bailey-Serres, J. Cross-kingdom comparison of transcriptomic adjustments to low-oxygen stress highlights conserved and plant-specific responses. Plant Physiol. 2010, 152, 1484–1500. [Google Scholar] [CrossRef] [Green Version]
- Ding, W.X.; Li, M.; Chen, X.; Ni, H.M.; Lin, C.W.; Gao, W.; Lu, B.; Stolz, D.B.; Clemens, D.L.; Yin, X.M. Autophagy reduces acute ethanol-induced hepatotoxicity and steatosis in mice. Gastroenterology 2010, 139, 1740–1752. [Google Scholar] [CrossRef] [Green Version]
- Luo, J. Autophagy and ethanol neurotoxicity. Autophagy 2014, 10, 2099–2108. [Google Scholar] [CrossRef] [Green Version]
- Chen, G.; Ke, Z.; Xu, M.; Liao, M.; Wang, X.; Qi, Y.; Zhang, T.; Frank, J.A.; Bower, K.A.; Shi, X.; et al. Autophagy is a protective response to ethanol neurotoxicity. Autophagy 2012, 8, 1577–1589. [Google Scholar] [CrossRef] [PubMed] [Green Version]
- Thapaliya, S.; Runkana, A.; McMullen, M.R.; Nagy, L.E.; McDonald, C.; Prasad, S.V.N.; Dasarathy, S. Alcohol-induced autophagy contributes to loss in skeletal muscle mass. Autophagy 2014, 10, 677–690. [Google Scholar] [CrossRef] [PubMed]
- Dolganiuc, A.; Thomes, P.G.; Ding, W.X.; Lemasters, J.J.; Donohue, T.J. Autophagy in alcohol-induced liver diseases. Alcohol. Clin. Exp. Res. 2012, 36, 1301–1308. [Google Scholar] [CrossRef] [PubMed] [Green Version]
- Li, Y.; Wang, S.; Ni, H.M.; Huang, H.; Ding, W.X. Autophagy in alcohol-induced multiorgan injury: Mechanisms and potential therapeutic targets. Biomed. Res. Int. 2014, 2014, 498491. [Google Scholar] [CrossRef] [PubMed]
- Yuan, L.B.; Dai, Y.S.; Xie, L.J.; Yu, L.J.; Zhou, Y.; Lai, Y.X.; Yang, Y.C.; Xu, L.; Chen, Q.F.; Xiao, S. Jasmonate regulates plant responses to postsubmergence reoxygenation through transcriptional activation of antioxidant synthesis. Plant Physiol. 2017, 173, 1864–1880. [Google Scholar] [CrossRef] [PubMed] [Green Version]
- Zhou, Y.; Tan, W.J.; Xie, L.J.; Qi, H.; Yang, Y.C.; Huang, L.P.; Lai, Y.X.; Tan, Y.F.; Zhou, D.M.; Yu, L.J.; et al. Polyunsaturated linolenoyl-CoA modulates ERF-VII-mediated hypoxia signaling in Arabidopsis. J. Integr. Plant Biol. 2020, 62, 330–348. [Google Scholar] [CrossRef] [Green Version]
- Hess, N.; Klode, M.; Anders, M.; Sauter, M. The hypoxia responsive transcription factor genes ERF71/HRE2 and ERF73/HRE1 of Arabidopsis are differentially regulated by ethylene. Physiol. Plantarum 2011, 143, 41–49. [Google Scholar] [CrossRef]
- Yu, L.J.; Luo, Y.F.; Liao, B.; Xie, L.J.; Chen, L.; Xiao, S.; Li, J.T.; Hu, S.N.; Shu, W.S. Comparative transcriptome analysis of transporters, phytohormone and lipid metabolism pathways in response to arsenic stress in rice (Oryza sativa). New Phytol. 2012, 195, 97–112. [Google Scholar] [CrossRef]


© 2020 by the authors. Licensee MDPI, Basel, Switzerland. This article is an open access article distributed under the terms and conditions of the Creative Commons Attribution (CC BY) license (http://creativecommons.org/licenses/by/4.0/).
Share and Cite
Yuan, L.-B.; Chen, L.; Zhai, N.; Zhou, Y.; Zhao, S.-S.; Shi, L.-L.; Xiao, S.; Yu, L.-J.; Xie, L.-J. The Anaerobic Product Ethanol Promotes Autophagy-Dependent Submergence Tolerance in Arabidopsis. Int. J. Mol. Sci. 2020, 21, 7361. https://0-doi-org.brum.beds.ac.uk/10.3390/ijms21197361
Yuan L-B, Chen L, Zhai N, Zhou Y, Zhao S-S, Shi L-L, Xiao S, Yu L-J, Xie L-J. The Anaerobic Product Ethanol Promotes Autophagy-Dependent Submergence Tolerance in Arabidopsis. International Journal of Molecular Sciences. 2020; 21(19):7361. https://0-doi-org.brum.beds.ac.uk/10.3390/ijms21197361
Chicago/Turabian StyleYuan, Li-Bing, Liang Chen, Ning Zhai, Ying Zhou, Shan-Shan Zhao, Li-Li Shi, Shi Xiao, Lu-Jun Yu, and Li-Juan Xie. 2020. "The Anaerobic Product Ethanol Promotes Autophagy-Dependent Submergence Tolerance in Arabidopsis" International Journal of Molecular Sciences 21, no. 19: 7361. https://0-doi-org.brum.beds.ac.uk/10.3390/ijms21197361