Article

Na+-Coupled Nutrient Cotransport Induced Luminal Negative Potential and Claudin-15 Play an Important Role in Paracellular Na+ Recycling in Mouse Small Intestine

1
Laboratory of Physiology, School of Food and Nutritional Sciences, University of Shizuoka, Yada 52-1, Suruga-ku, Shizuoka 422-8526, Japan
2
Laboratory of Biochemistry, Department of Biopharmaceutical Sciences, Gifu Pharmaceutical University, Gifu 501-1196, Japan
*
Author to whom correspondence should be addressed.
These authors contributed equally to this work.
Int. J. Mol. Sci. 2020, 21(2), 376; https://0-doi-org.brum.beds.ac.uk/10.3390/ijms21020376
Submission received: 6 December 2019 / Revised: 27 December 2019 / Accepted: 30 December 2019 / Published: 7 January 2020
(This article belongs to the Special Issue Sodium Intake and Related Diseases)

Abstract

:
Many nutrients are absorbed via Na+ cotransport systems, and therefore it is predicted that nutrient absorption mechanisms require a large amount of luminal Na+. It is thought that Na+ diffuses back into the lumen via paracellular pathways to support Na+ cotransport absorption. However, direct experimental evidence in support of this mechanism has not been shown. To elucidate this, we took advantage of claudin-15 deficient (cldn15−/−) mice, which have been shown to have decreased paracellular Na+ permeability. We measured glucose-induced currents (ΔIsc) under open- and short-circuit conditions and simultaneously measured changes in unidirectional 22Na+ fluxes (ΔJNa) in Ussing chambers. Under short-circuit conditions, application of glucose resulted in an increase in ΔIsc and unidirectional mucosal to serosal 22Na+ (∆JNaMS) flux in both wild-type and cldn15−/− mice. However, under open-circuit conditions, ΔIsc was observed but ∆JNaMS was strongly inhibited in wild-type but not in cldn15−/− mice. In addition, in the duodenum of mice treated with cholera toxin, paracellular Na+ conductance was decreased and glucose-induced ∆JNaMS increment was observed under open-circuit conditions. We concluded that the Na+ which is absorbed by Na+-dependent glucose cotransport is recycled back into the lumen via paracellular Na+ conductance through claudin-15, which is driven by Na+ cotransport induced luminal negativity.

Graphical Abstract

1. Introduction

Nutrient absorption in the small intestine is essential for assimilation of nutrients required for energy and growth. To meet these requirements, nutrients are efficiently absorbed from the luminal side, which is the external milieu. In nutrient absorbing cells, many nutrients cross the luminal membrane via specific transporters which require cotransport with luminal Na+. Na+ coupling allows nutrients to be transported against their concentration gradient from a low luminal concentration to a higher intracellular concentration. The driving force for nutrient transporters is provided by the electrochemical Na+ gradient across the luminal membrane. This Na+ gradient is produced by the Na-K-ATPase on the basolateral membrane which keeps the intracellular Na+ concentration low. Therefore, it is expected that Na+ nutrient cotransport concomitantly occurs with net Na+ absorption from the luminal (extracellular) to the serosal side [1].
There are many Na+ nutrient cotransport systems in the small intestine, such as glucose, amino acids, etc. [2,3,4]. It is, therefore, envisaged that Na+-dependent nutrient absorption mechanisms require a large amount of luminal Na+, which should be theoretically predictable as follows: For a healthy adult male, daily energy intake is 2500 kcal. The percentage of energy derived from the three major macronutrients in a typical Western diet is carbohydrates (52%), fat (33%), and protein (15%) [5]. Since protein and carbohydrates yield 4 kcal/g and 9 kcal/g for fat, the total amount of daily intake of carbohydrates, fat, and protein is about 325, 92, and 93 g, respectively. The resultant products of digestion produce large amounts of monosaccharides and amino acids in the lumen. The intake of 325 g of carbohydrates will yield approximately 1.8 moles of monosaccharide, which is mostly composed of glucose. The primary transporter that mediates glucose transport in the intestinal brush border membrane has been identified as Na+-dependent glucose transporter SGLT1, which operates with a transport stoichiometry of 2 Na+:1 glucose [6,7]. Thus, it is estimated that 3.6 moles of Na+ are needed for the absorption of glucose only, which corresponds to 23 L of isotonic NaCl solution, containing 210 g NaCl. This volume of fluid is approximately two times larger than that of extracellular fluid, which is 20% of body weight. With regards to protein, assuming that the average molecular weight of an amino acid residue in protein is 110, i.e., 93 g of protein will yield approximately 0.8 moles of amino acids, which needs an equivalent amount of luminal Na+ for amino acid absorption from the luminal side. Taking into consideration all of the Na+-dependent nutrient absorption, nutrient absorption mechanisms would require a large amount of luminal Na+.
How does the small intestine meet the requirements for such a large amount of Na+ for absorption of nutrients? One possible source is digestive juices. In humans, it is thought that 9L/day of isotonic fluid enters the lumen of the proximal small intestine through diet and secretion of the upper digestive tract [8]. This fluid is composed of 2 L from diet, 1 L of saliva, 2 L of gastric juice, 1 L of bile, 2 L of pancreatic juice, and 1 L of secretions from the small intestine, which contain only 0.8 moles of Na+ in total. Another luminal Na+ providing mechanism would be via the paracellular pathway. It is well known that small intestinal epithelia are classified as leaky epithelia, which means its paracellular conductance is ~90% or more of the total tissue conductance and it is cation selective (PNa > PCl) [9]. However, the physiological relevance of cationic selectivity of the paracellular pathway remains to be fully elucidated. The properties of the paracellular pathway are dependent on tight junctions, which occur where epithelial cells are closely connected to each other. The claudin family of tight junction proteins is critical in determining the paracellular ionic permeability and selectivity. The claudin family consists of 27 integral membrane proteins [10]. The subcellular distribution of the claudins varies; while claudin-2 and -15 are exclusively in the tight junctions, other isoforms, e.g., claudin-4 and -7, are found in the basolateral membrane [11,12,13]. This diverging pattern of distribution suggests that individual claudins are engaged in different physiological functions. We previously showed that a loss of claudin-15 decreased the luminal Na+ concentration and glucose absorption is inhibited in mouse small intestine [14]. It is hypothesized that Na+ diffuses back into the lumen via the paracellular pathway to support nutrient absorption [15]. However, direct experimental evidence in support of this idea has not been shown. In this study, to investigate whether paracellular Na+ conductance through claudin-15 is involved in this Na+ recycling system and to elucidate the role of Na+-nutrient cotransport induced luminal negativity for Na+ recycling, we measured glucose-induced short-circuit currents (ΔIsc) under open- and short-circuit conditions in Ussing chambers. In addition, we simultaneously measured changes in unidirectional mucosal to serosal 22Na+ (∆JNaMS) flux in wild-type mice and compared them with those of 15 deficient (cldn15−/−) mice. Furthermore, to understand the mechanism of oral rehydration therapy, which is based on the notion that the Na+ that is absorbed by Na+-glucose cotransport enters into systemic circulation [16], we measured glucose-induced unidirectional ∆JNaMS in cholera toxin-diarrhea model mice. The results showed that under the short-circuit conditions in wild-type mice, luminal application of glucose resulted in an increase in ∆JNaMS which corresponded to the amplitude of ΔIsc. However, under open-circuit conditions, a ΔIsc increase was observed but ∆JNaMS was strongly inhibited. These results suggest that Na+ is recycled back to the lumen under physiological conditions. In cldn15−/− mice, a robust increase in ∆JNaMS was observed under open-circuit conditions, suggesting that the efficiency of Na+-recycling systems was reduced. This phenomenon was also mimicked by cholera toxin-induced diarrhea in wild-type mice.
Our study demonstrates that the Na+ which is absorbed by Na+-nutrient cotransport is recycled back into the lumen via paracellular Na+ conductance through claudin-15, which is driven by Na+ cotransport induced luminal potential.

2. Results

2.1. Baseline Na+ Absorption Mechanisms in Wild-Type Mice

Baseline Isc and 22Na+ unidirectional fluxes were measured simultaneously in the same preparations in wild-type mice (Table 1).
The unidirectional mucosal to serosal 22Na+ flux (JNaMS: 51.4 ± 2.3 µmol/cm2/h) was larger than the serosal to mucosal flux (JNaSM: 24.6 ± 1.7 µmol/cm2/h). This result suggests that Na+ absorption occurred in the baseline conditions. The magnitude of the net 22Na+ flux (JNaNet: 26.9 ± 1.5 µmol/cm2/h) was significantly greater than that of the basal short-circuit current (Isc) (2.4 ± 0.5 µmol/cm2/h) suggesting that the net Na+ absorption occurs mostly via an electroneutral Na+/H+ exchange mechanism. To determine the contribution of Na+/H+ exchanger-3 isoform (NHE3) to baseline Isc and 22Na+ unidirectional fluxes, we used the NHE3 specific inhibitor S3226. In the presence of the S3226, the basal net Na+ flux was decreased by 60% (JNaNet: 10.6 ± 3.9 µmol/cm2/h). Basal Isc and transmural tissue conductance (Gt) were not significantly changed by S3226 (p = 0.29 and 0.25, Isc and Gt, respectively), suggesting that paracellular ion permeability is not affected by S3226. However, 10 µM S3226 did not completely inhibit basal Na+ absorption. Although other NHE isoforms could be involved in basal Na+ absorption, these results suggest that the basal net Na+ absorption is mainly dependent on NHE3 transport, consistent with what has been previously reported [17].

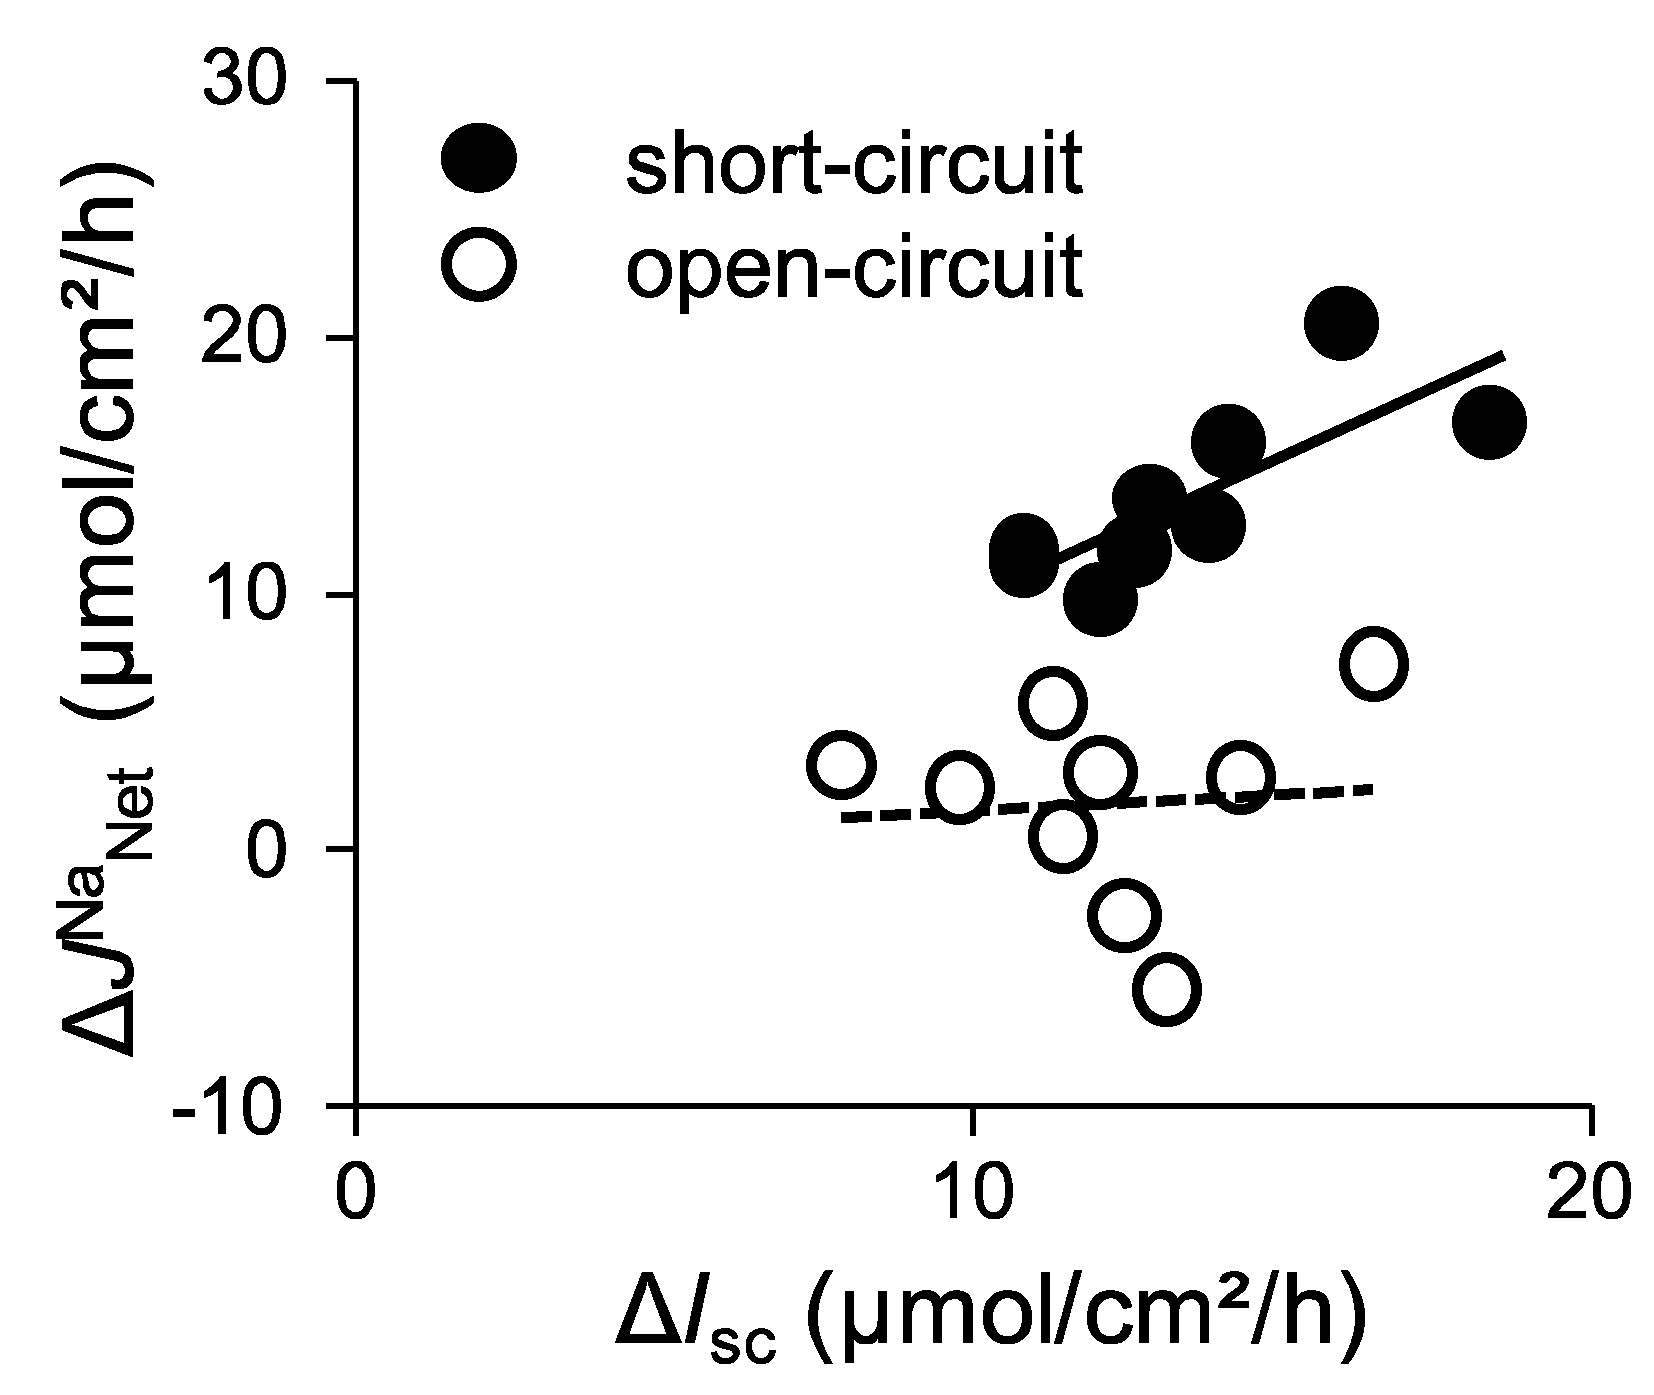
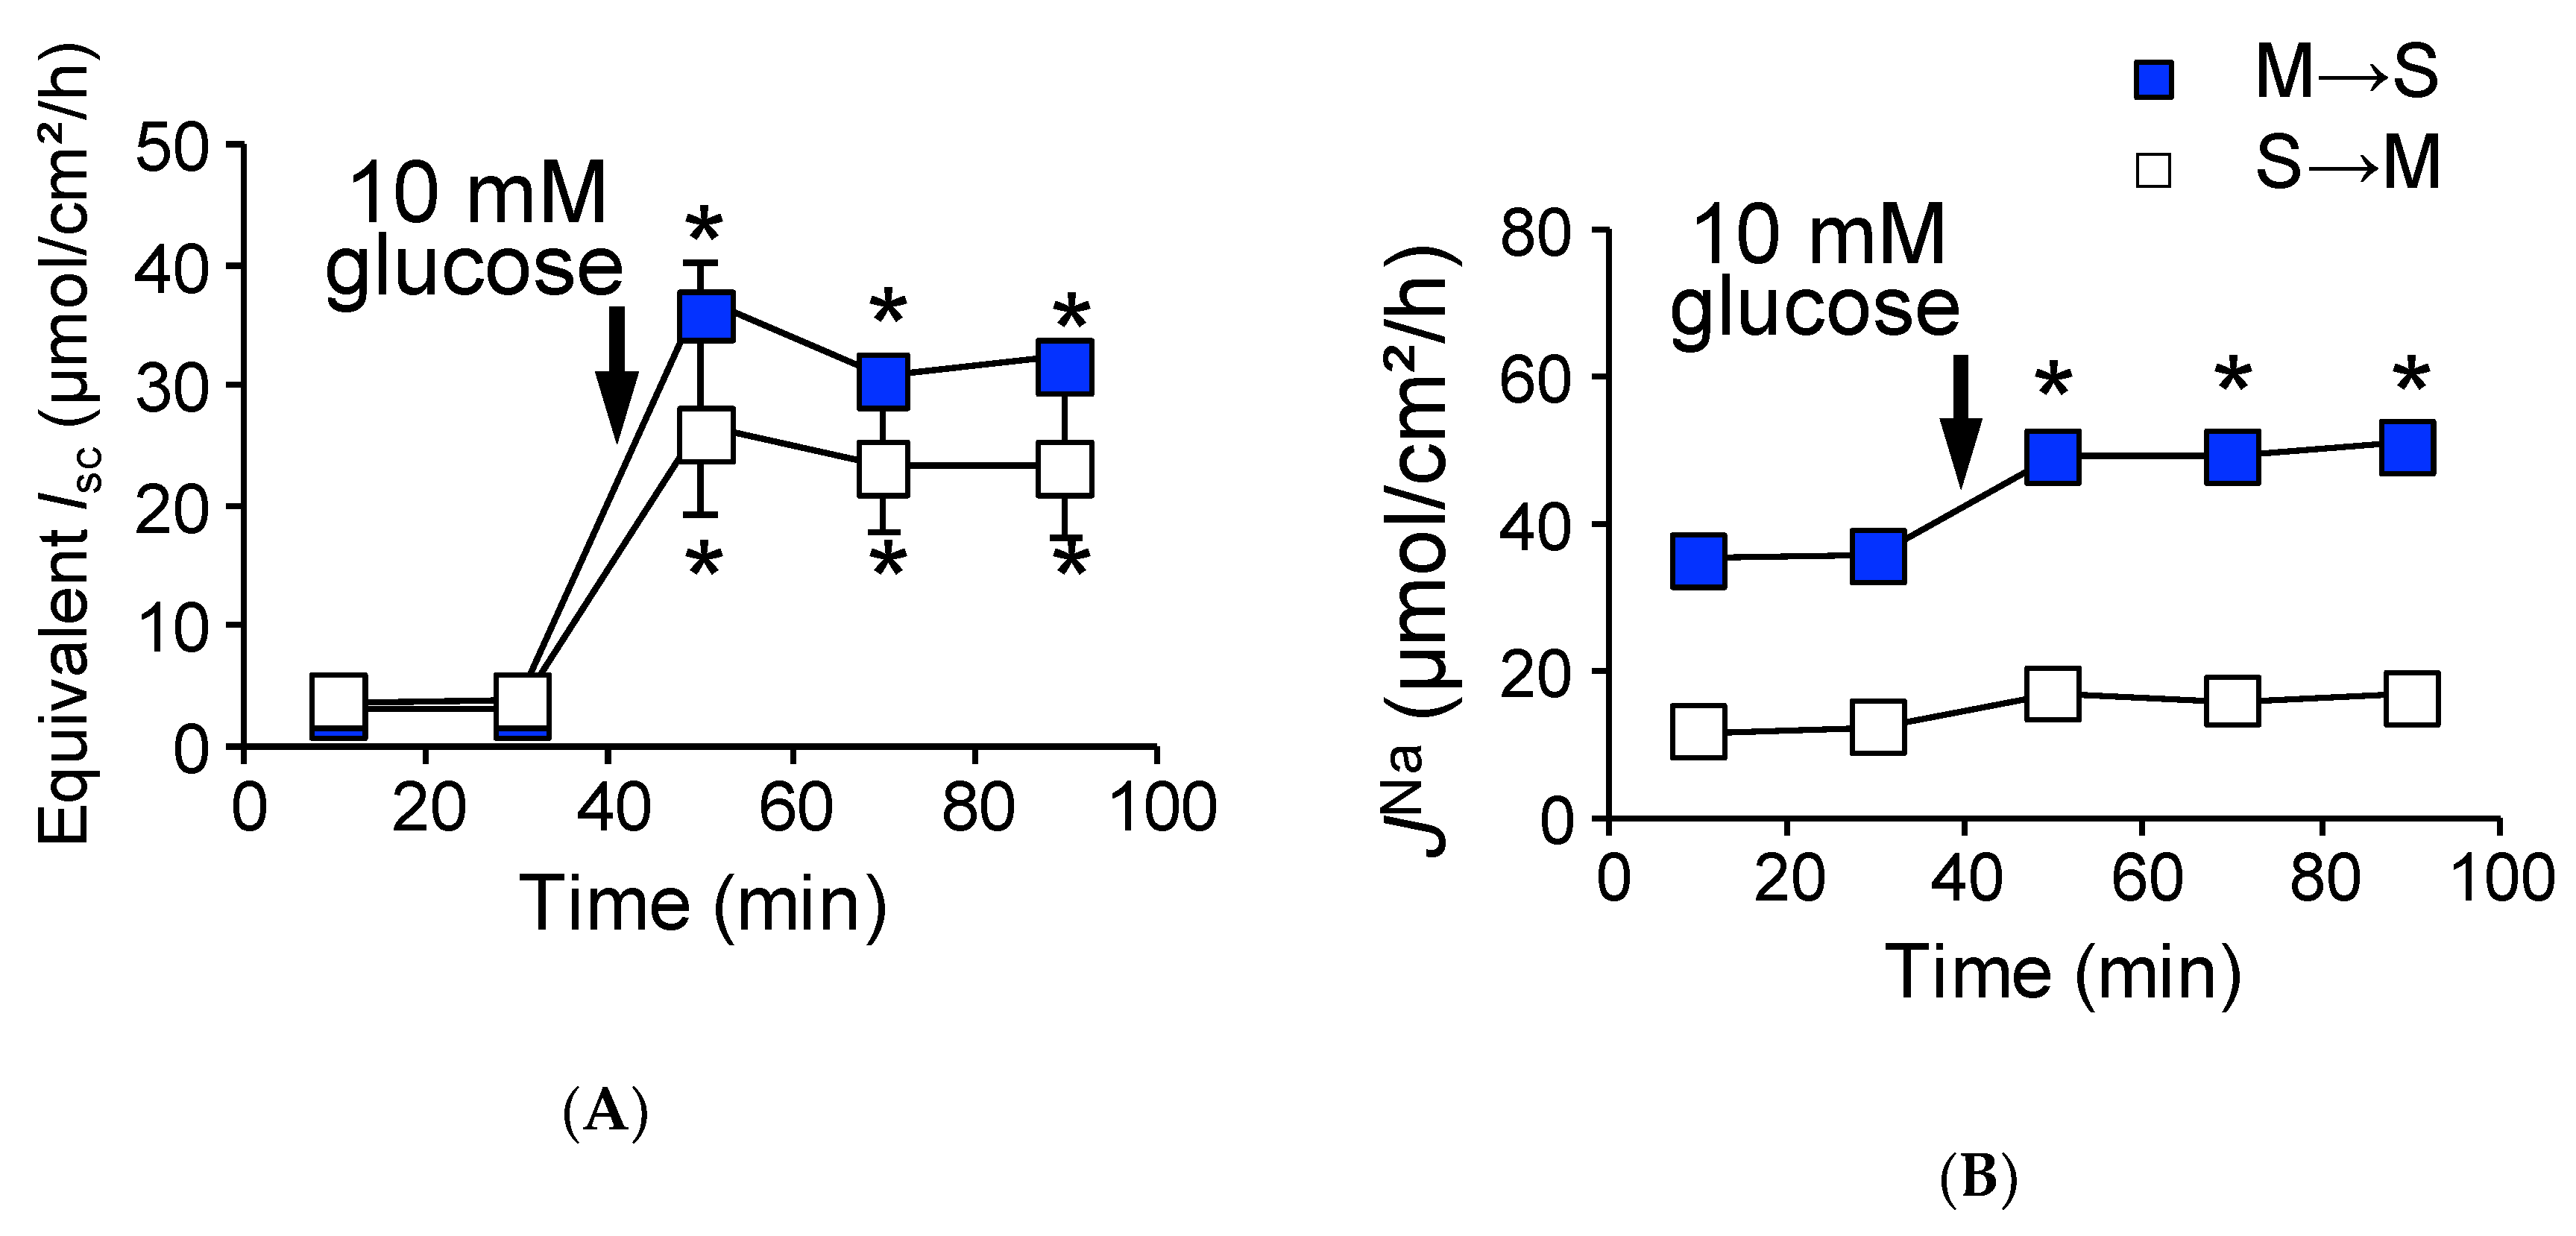
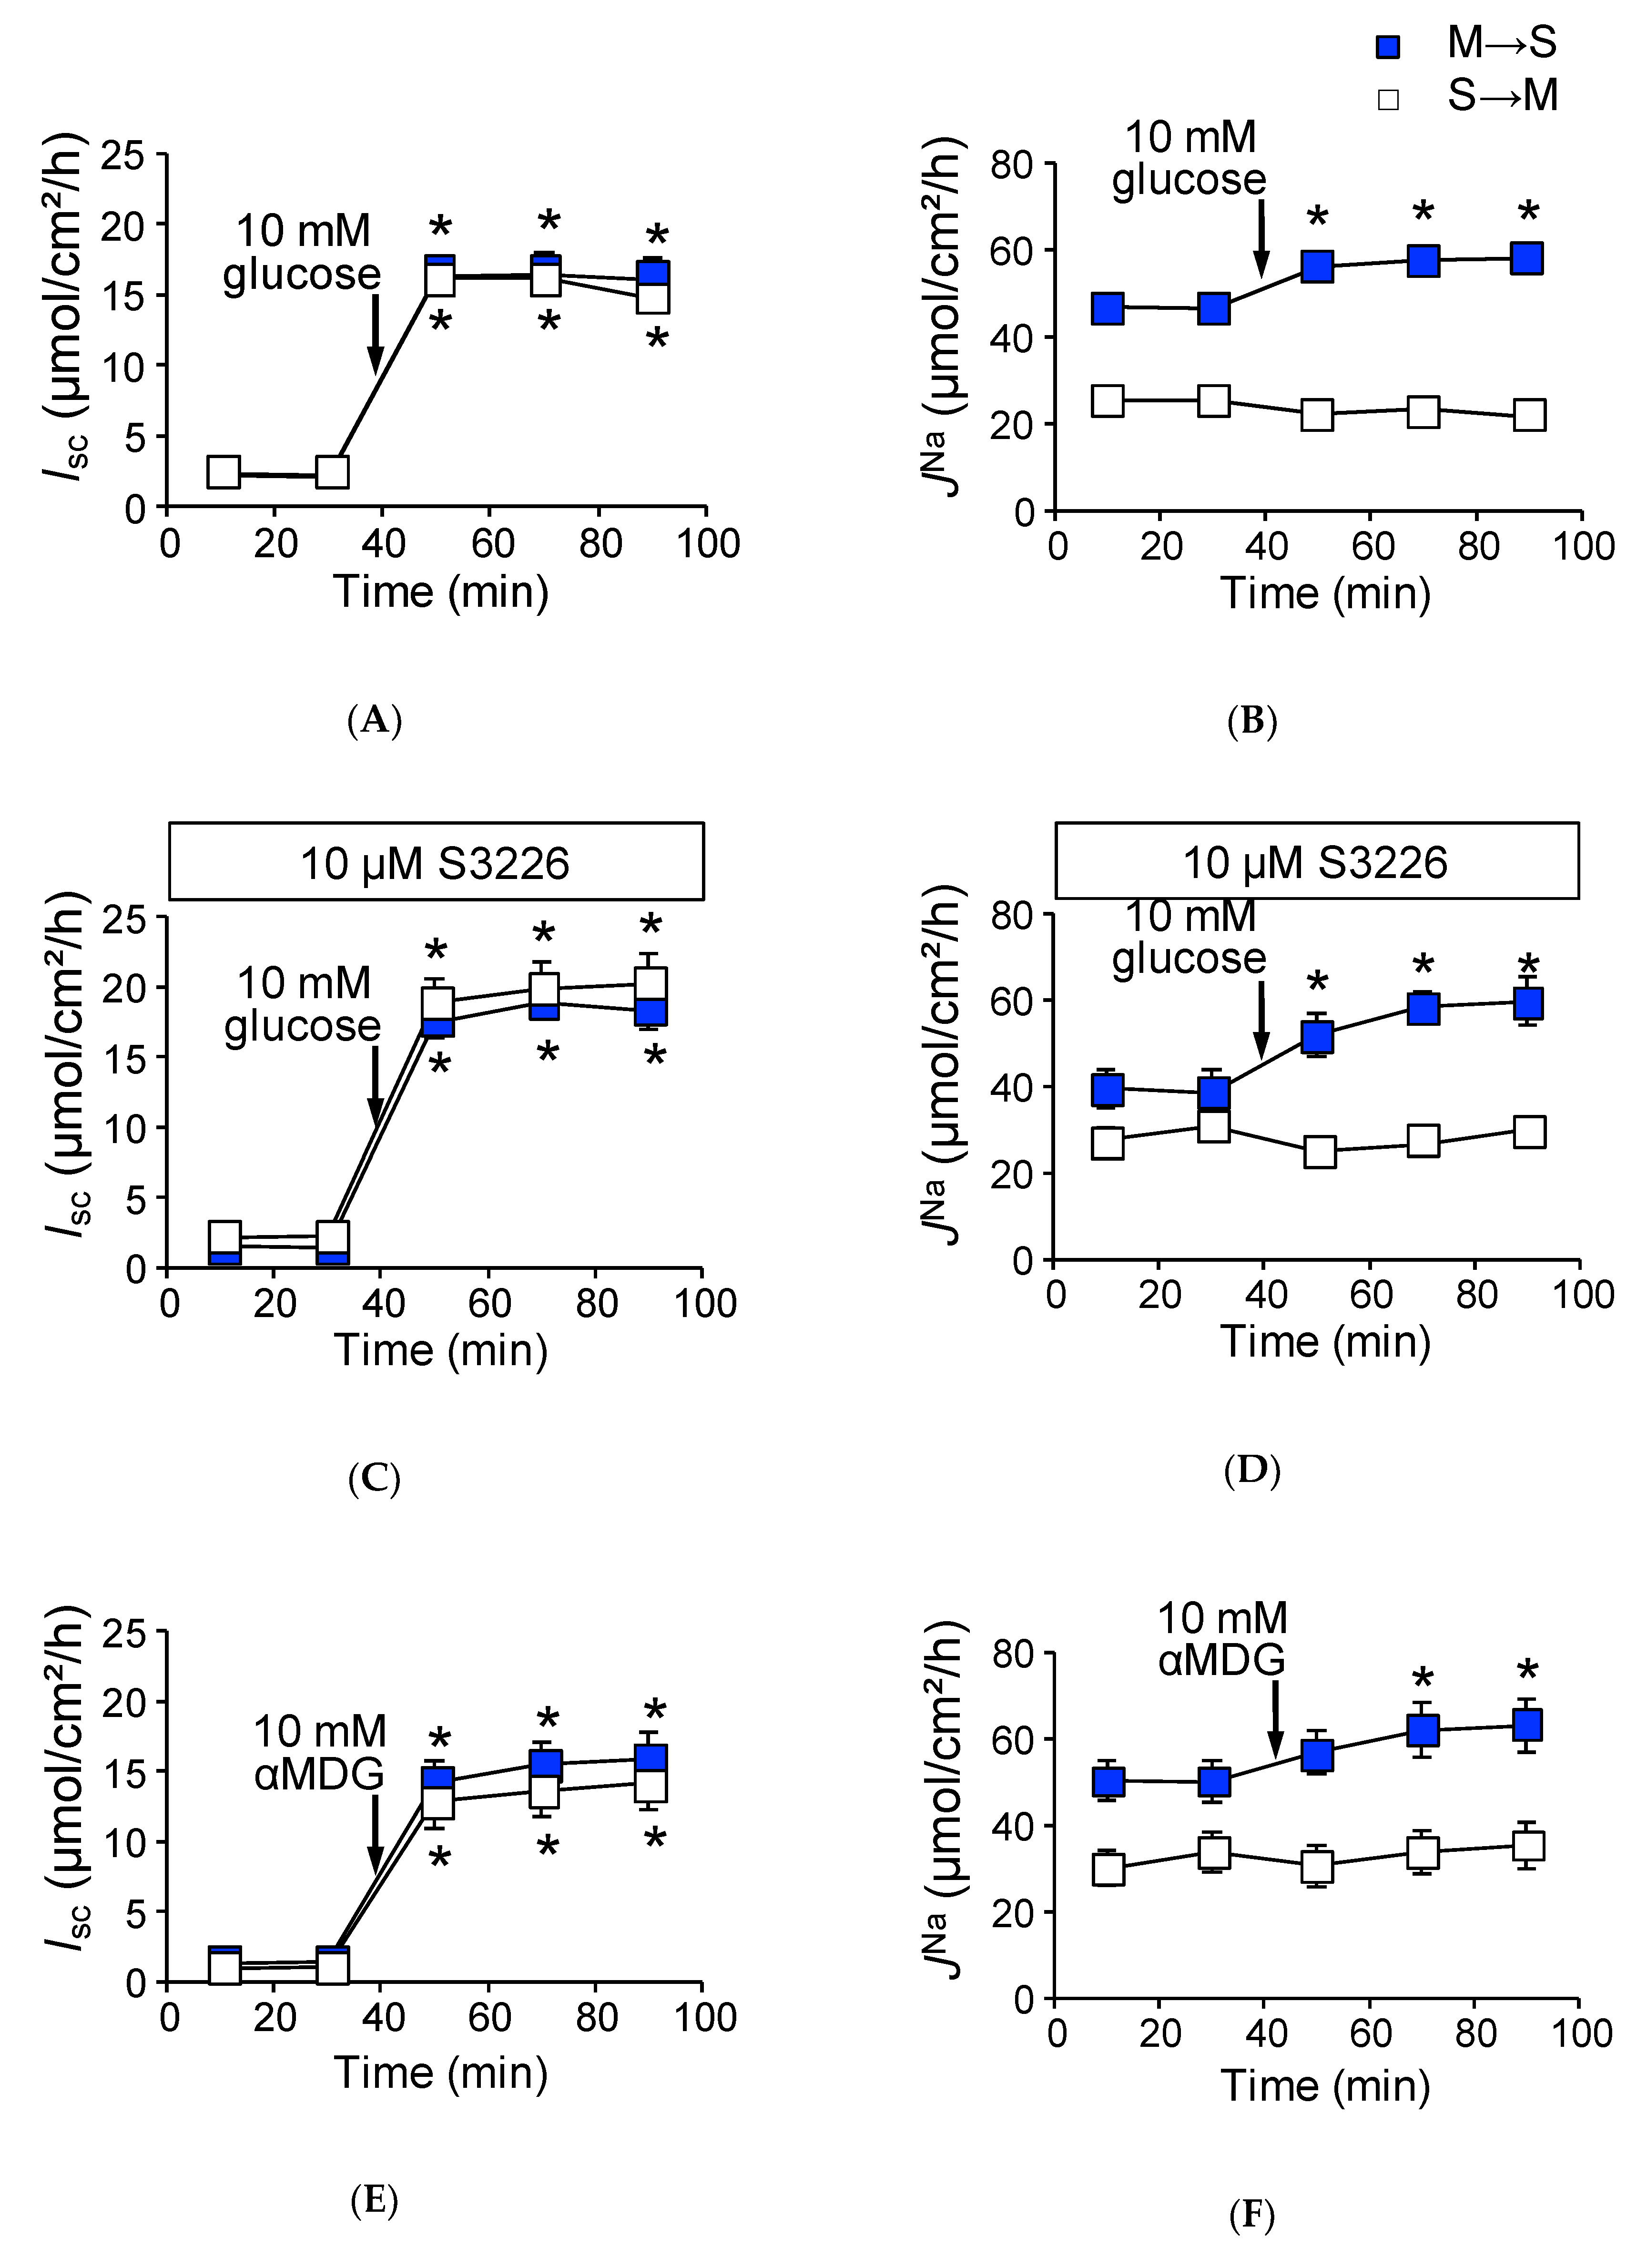
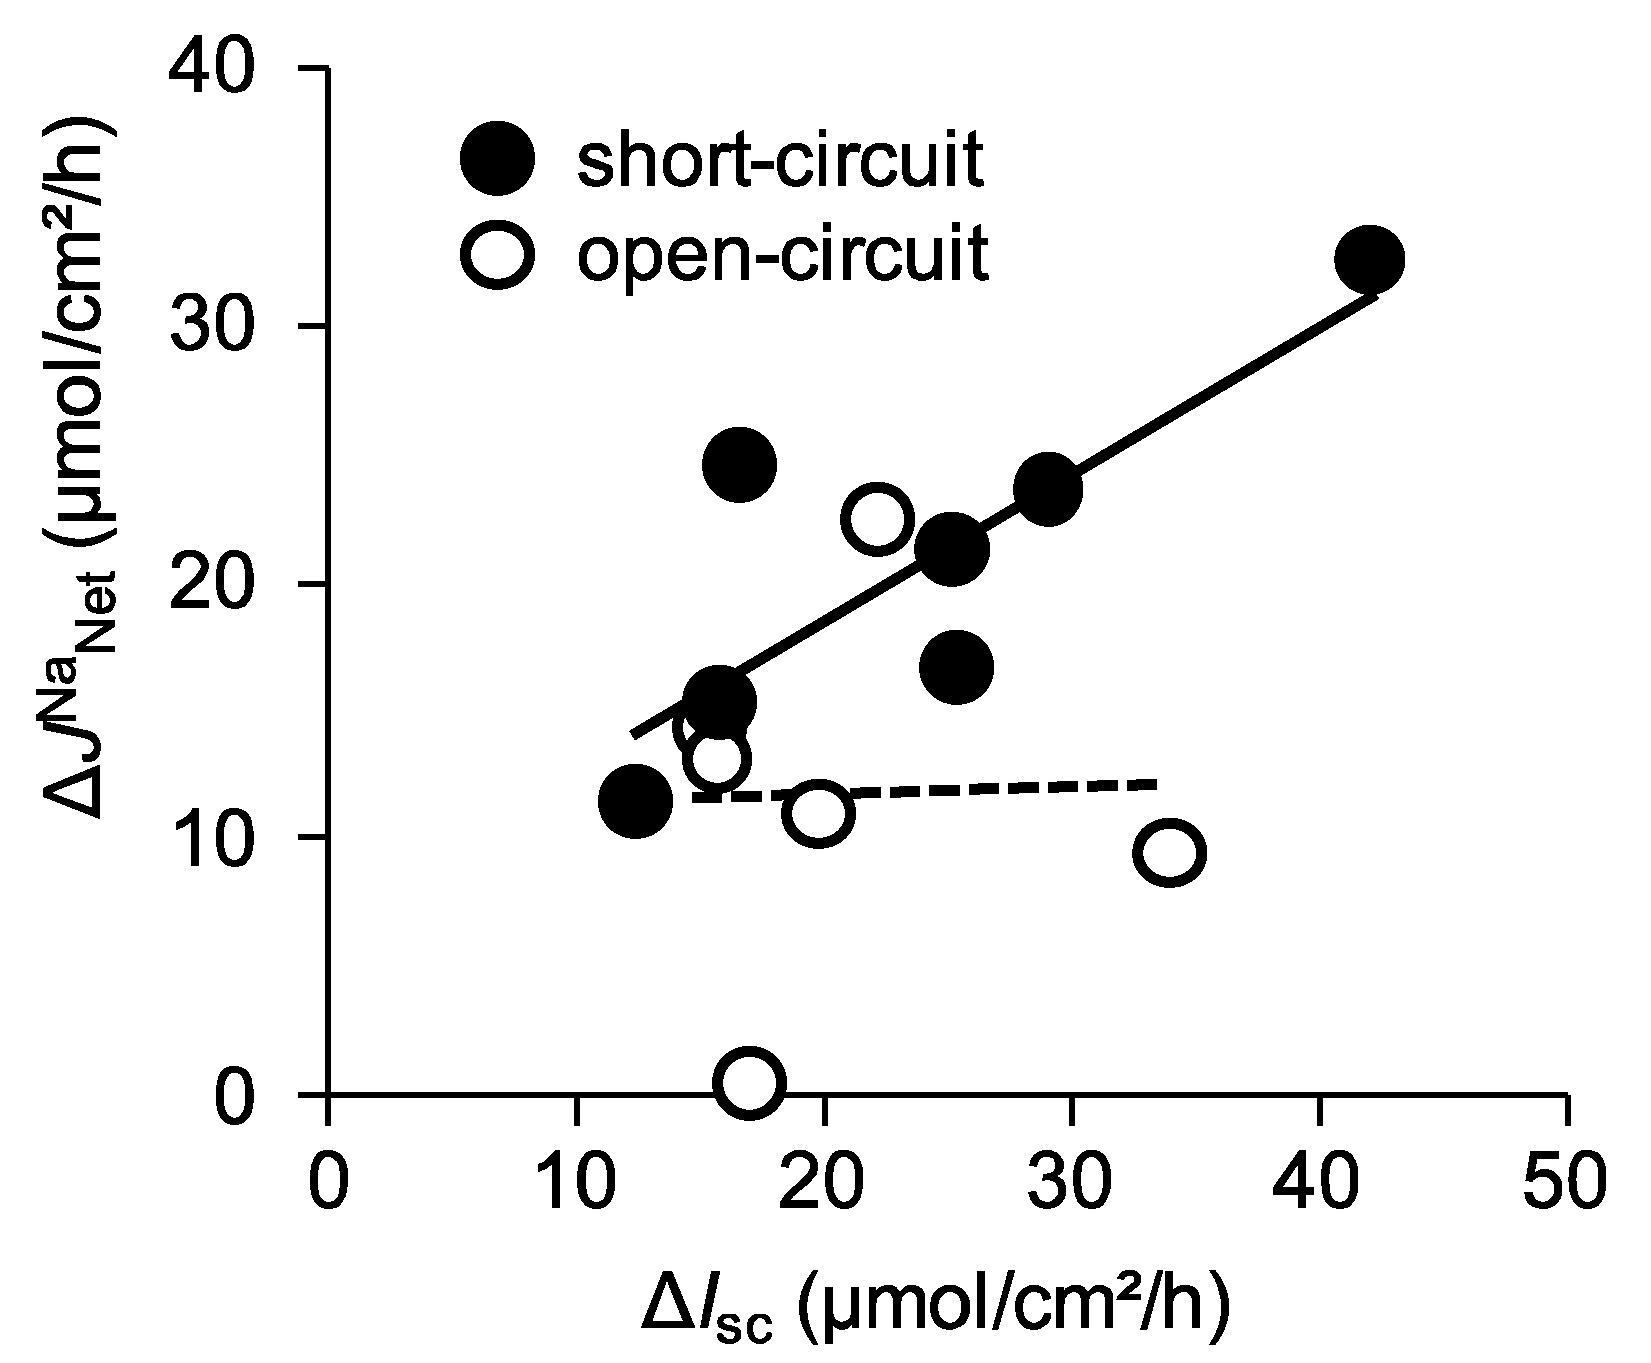
2.2. Activation of SGLT1 Concomitantly Increases Mucosal to Serosal 22Na+ Fluxes under Short-Circuit Conditions

As shown in Figure 1A, the addition of glucose to the mucosal side increased Isc (∆Isc 13.7 ± 0.8 µmol/cm2/h) in wild-type mice. JNaMS was also significantly increased (Figure 1B, ΔJNaMS, 12.5 ± 0.8 µmol/cm2/h, n = 5) after luminal application of glucose, while the unidirectional serosal to mucosal 22Na+ flux (JNaSM) was not significantly changed after the addition of luminal glucose (Figure 1B, 25.5 ± 1.1 vs. 23.5 ± 1.1 µmol/cm2/h, p = 0.21, before and after the addition of glucose, respectively).
These results suggest that glucose-induced ΔJNaMS is mediated by the Na+-dependent glucose transporter SGLT1. To confirm this, we conducted four experiments. First, the specific SGLT1 inhibitor phloridzin (0.2 mM) was added to the luminal side, and glucose-induced ΔJNaMS was measured. In the presence of phloridzin, both glucose-induced ∆Isc and ΔJNaMS increments were totally abolished (Isc: 1.1 ± 0.3 vs. −0.1 ± 0.3 µmol/cm2/h, p = 0.06, JNaMS: 48.8 ± 4.2 vs. 46.1 ± 1.9 µmol/cm2/h, p = 0.88, n = 3 before and after addition of glucose, respectively). Second, transepithelial 36Cl unidirectional flux was measured with or without luminal glucose. It is thought that Na+-coupled glucose transport from the lumen to intercellular spaces provides an osmotic gradient that results in passive ion movement through tight junctions [18]. However, there was no discernable changes in 36Cl unidirectional fluxes with or without luminal glucose (ΔJClNet: 14.5 ± 1.8 vs. 14.0 ± 1.7 µmol/cm2/h, p = 0.54, n = 5 before and after addition of glucose, respectively). We next assessed the contribution of NHE3 to glucose-induced ΔJNaMS increments, as Na+-coupled glucose uptake stimulates NHE3 transport activity in the mouse jejunum [19]. The above-mentioned glucose-induced ΔJNaMS increments could be mediated by NHE3 and not SGLT1. To examine this possibility, we measured the glucose-induced 22Na+ unidirectional fluxes in the presence of the NHE3 specific inhibitor S3226 [20]. As shown in Figure 1C, the addition of glucose to the mucosal side resulted in an increase of the Isc (∆Isc: 17.5 ± 1.6 µmol/cm2/h, n = 5), which is slightly higher in the absence of S3226 (p = 0.05). Robust glucose-induced ΔJNaMS increment was also observed in the presence of S3226 (Figure 1D, ∆JNaMS: 20.2 ± 1.8 µmol/cm2/h), suggesting that NHE3 is not responsible for glucose-induced 22Na+ unidirectional flux increments. Finally, we assessed whether glucose metabolic pathways contribute to ΔJNaMS increments or not. The non-metabolizable glucose analogue α-methyl-d-glucose (αMDG) was used instead of d-glucose, and the αMDG-induced 22Na+ unidirectional fluxes were measured. The addition of αMDG to the mucosal side increased the Isc in a dose-dependent manner. This change in Isc conformed to Michaelis–Menten kinetics, and these values were not significantly different as compared with those of glucose (Vmax: 551 ± 47 vs. 661 ± 45 µA/cm2, p = 0.14, Km: 10.9 ± 2.9 vs. 5.1 ± 1.2 mM, p = 0.14, glucose and αMDG, respectively). As shown in Figure 1E,F, the addition of 10 mM αMDG to the mucosal side increased the Isc (∆Isc: 12.7 ± 1.7 µmol/cm2/h) and ∆JNaMS (12.3 ± 1.6 µmol/cm2/h). These values are not significantly different as compared with those of glucose values (p = 0.55, 0.89, ∆Isc and ∆JNaMS, respectively). Taken together, these results suggest that glucose-induced increment of ∆JNaMS is mediated by SGLT1.
We next assessed the quantitative relationship between ∆Isc and ∆JNaNet under short-circuit conditions, where ∆JNaNet is plotted as a function of ∆Isc (Figure 2, closed circles).
We found that there was a positive correlation between these values (r square = 0.62). Taken together, under short-circuit conditions, these results suggest that glucose-induced ΔJNaMS is mainly mediated by SGLT1 and there is less contribution, if any, from other Na+ transport mechanisms involved in glucose-induced ΔJNaMS increments.

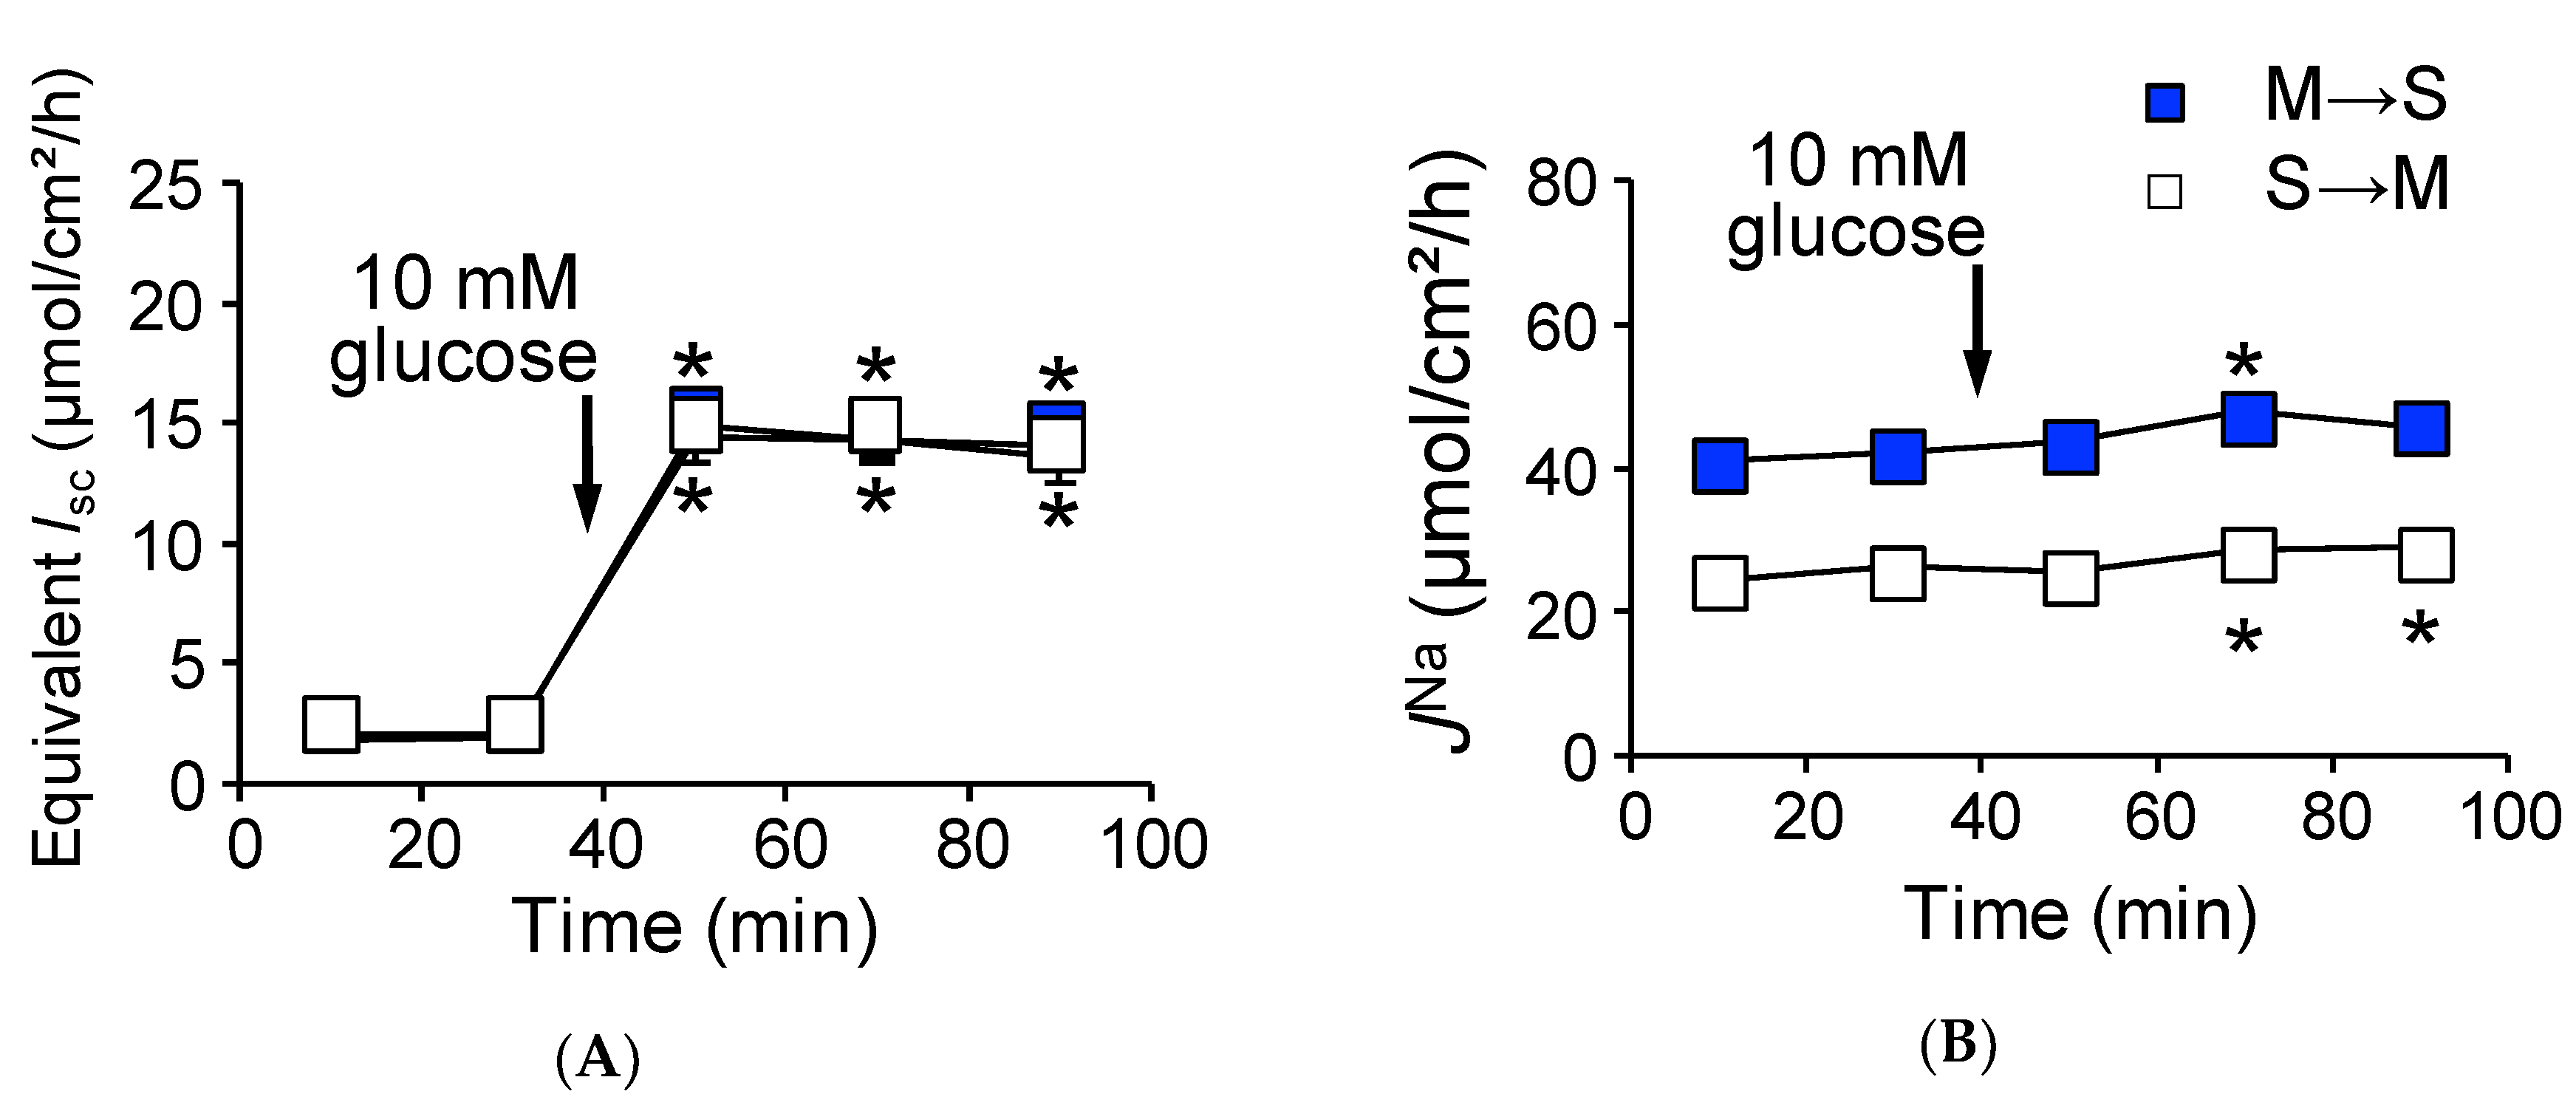
2.3. Activation of SGLT1 does not Increase Mucosal to Serosal 22Na+ Fluxes under Open-Circuit Conditions

To mimic physiological conditions, we conducted identical Ussing chamber experiments as in Figure 1 under open-circuit conditions, which allows for the investigation of paracellular ion pathways [21]. The baseline transepithelial potential difference (Vte) was measured and Gt was determined from voltage deflections when applying short-current pulse. The baseline Vte was −0.9 ± 0.1 mV (n = 3) referenced to the serosal side. For a comparison with short-circuit conditions, equivalent Isc was determined from Vte and Gt by applying Ohm’s law. Under open-circuit conditions (Table 1, lower rows), baseline and equivalent Isc were not significantly different from those of short-circuit conditions. We next determined whether basal unidirectional 22Na+ flux was affected by basal Vte. As shown in Table 1, JNaMS and JNaSM were not significantly different from those of short-circuit conditions, suggesting that baseline Vte does not affect basal transcellular and paracellular Na+ transport. We next measured glucose-induced transepithelial potential difference changes (ΔVte) and ΔJNa under open-circuit conditions (Figure 3). On the one hand, addition of 10 mM luminal glucose increased the VteVte −6.3 ± 0.3 mV, n = 6).
The equivalent ∆Isc was 12.1 ± 0.8 µmol/cm2/h (Figure 3A), which was not significantly different from that of short-circuit conditions as shown in Figure 1A (p = 0.20). On the other hand, glucose-induced ΔJNaMS increment was significantly inhibited by 60% as compared with that of short-circuit conditions (Figure 3B, ΔJNaMS, 4.7 ± 1.2 vs. 12.5 ± 0.8 µmol/cm2/h, p = 0.0001, open-circuit and short-circuit conditions, respectively). Interestingly, the unidirectional serosal to mucosal 22Na+ flux was significantly increased after luminal application of glucose (Figure 3B, open squares 25.2 ± 0.9 vs. 28.8 ± 1.4 µmol/cm2/h, p = 0.0003, before and after addition of glucose, respectively), which was not observed under short-circuit conditions (Figure 1B open squares). These results imply that glucose-induced luminal negativity drives the unidirectional serosal to mucosal 22Na+ flux via paracellular pathways. We next assessed the quantitative relationship between ∆Isc and ∆JNaNet under open-circuit conditions (Figure 2, open circles). There was no relationship between ∆Isc and ∆JNaNet (r square = 0.006) and the averaged ΔJNaNet value (1.7 ± 1.3 µmol/cm2/h) was not significantly different from zero (p = 0.36). Taken together, these results suggest that Na+-dependent glucose cotransport does not concomitantly increase transepithelial Na+ absorption under open-circuit conditions.

2.4. Baseline Na+ Absorption Mechanisms in Claudin-15 Deficient Mice

To evaluate the impact of deficiency of claudin-15 on Na+ absorption in the small intestine, we first measured unidirectional 22Na+ flux across the jejunum of claudin-15 deficient (cldn15−/−) mice under short-circuit conditions (Table 2). The JNaMS was decreased by 40% in cldn15−/− mice as compared with wild-type mice (31.9 ± 1.9 vs. 51.4 ± 2.3 µmol/cm2/h). In addition, JNaSM, which is mainly reflected by the paracellular pathway, was also decreased by 60% in cldn15−/− mice (10.4 ± 0.8 vs. 24.6 ± 1.7 µmol/cm2/h). We also observed a reduced conductance across jejunal preparations from cldn15−/− mice (17.7 ± 0.7 vs. 58.7 ± 2.2 mS/cm2, p < 0.0001 in cldn15−/− and wild-type mice, respectively). It has been shown that electrical conductance of the paracellular pathways accounts for 95% of the total conductance in the small intestine [9]. These results suggest that paracellular Na+-selective pores are mainly formed by claudin-15, consistent with a previous report [14]. The magnitude of the net 22Na+ flux was not significantly different than that of wild-type mice (21.4 ± 2.4 vs. 26.9 ± 1.5 µmol/cm2/h, in cldn15−/− and wild-type mice, respectively), suggesting that net Na+ absorption occurs via an electroneutral mechanism. In contrast, the basal Isc was significantly greater than that of wild-type mice (3.3 ± 0.4 vs. 2.4 ± 0.5 µmol/cm2/h, in cldn15−/− and wild-type mice, respectively). Therefore, we assessed the contribution of NHE3 to 22Na+ unidirectional fluxes under baseline conditions. In the presence of the NHE3 inhibitor S3226, basal JNaMS was inhibited and this magnitude of S3226-sensitive inhibition was similar to that of wild-type mice (Table 1 and Table 2, 9.6 vs. 12.5 µmol/cm2/h, in cldn15−/− and wild-type mice, respectively). Interestingly, the JNaSM and Gt were significantly decreased by S3226 (Table 2, p = 0.001 and 0.018, JNaSM and Gt, respectively), suggesting that paracellular ion permeability was affected by S3226 in cldn15−/− but not wild-type mice. However, we did not further explore this mechanism in this study. Jointly, these results suggest that although other NHE isoforms may be involved in electroneutral Na+ absorption, basal net Na+ absorption is mostly dependent on NHE3 transport, similar to wild-type mice. In addition, paracellular Na+-selective pores, which are formed mainly by claudin-15, were decreased in cldn15−/− mice.

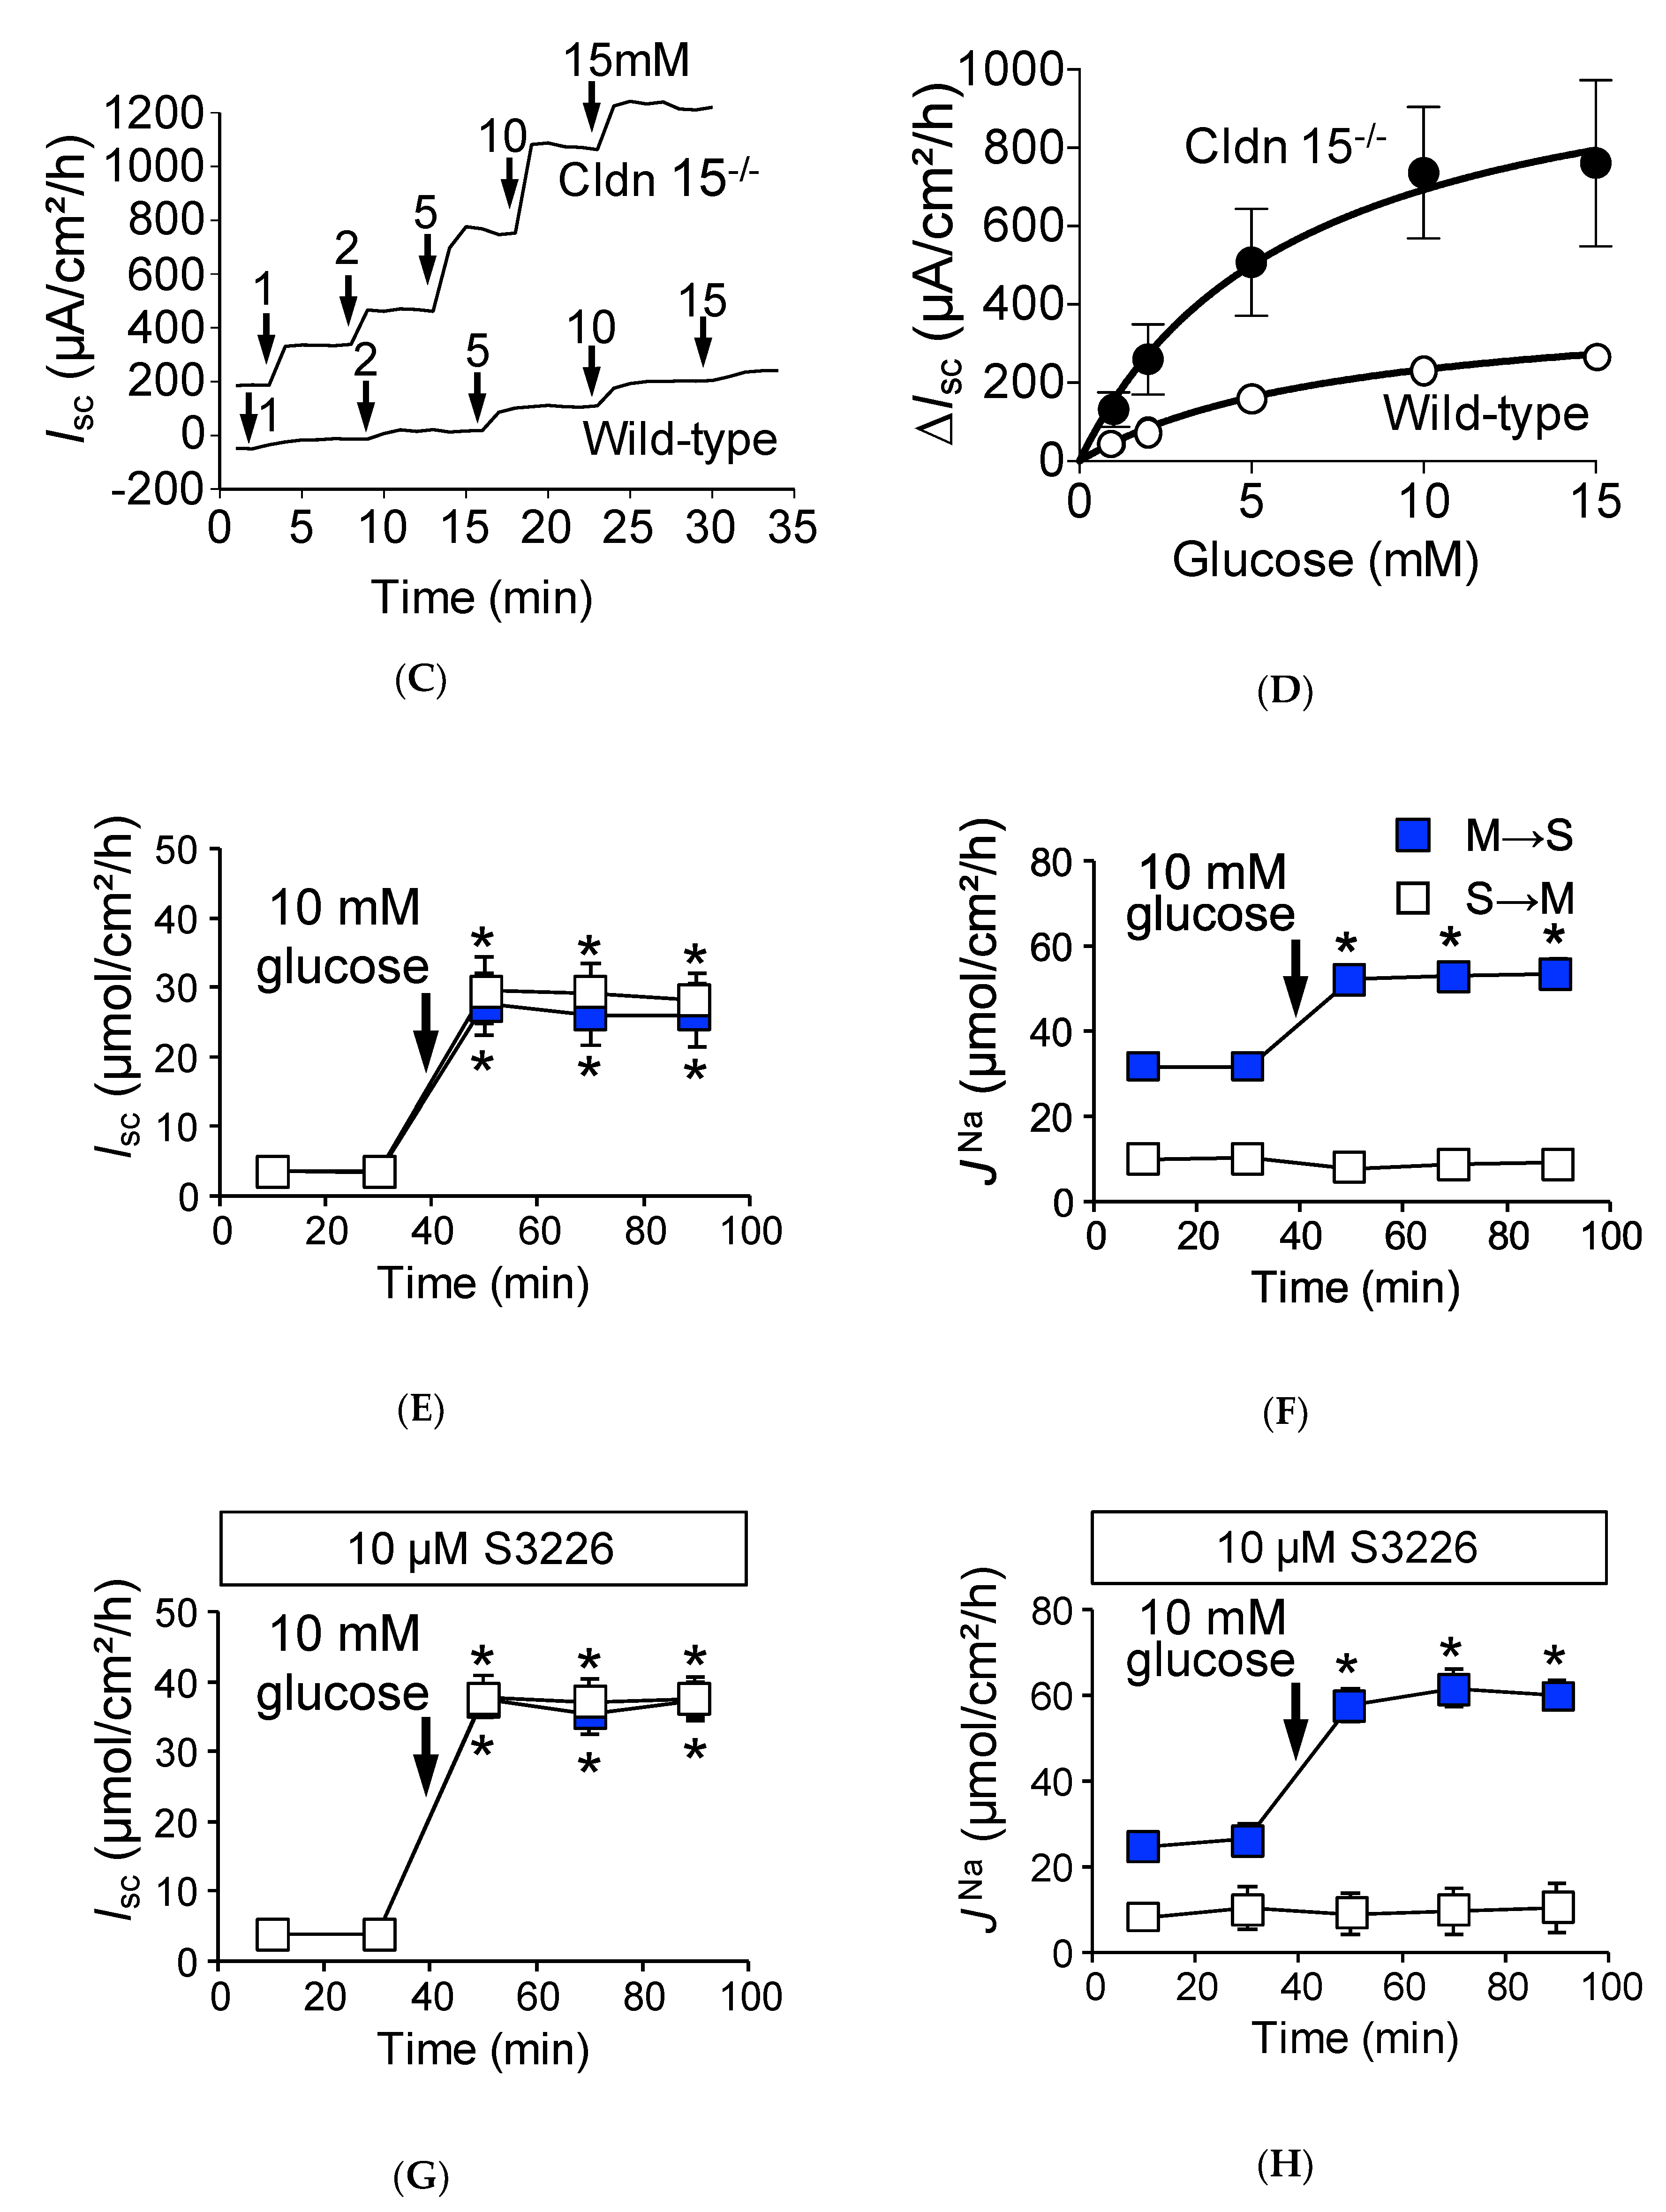
2.5. Na+-Dependent Glucose Transporter SGLT1 Is Up-Regulated in Cldn15−/− Mice

We first confirmed the expression of claudin-15 by immunofluorescence (Figure 4A) and quantitative RT-PCR (Figure 4B) experiments in the duodenum and jejunum. In wild-type mice, claudin-15 colocalized with another tight junction protein occludin. However, claudin-15 signals were completely abolished in cldn15−/− mice, consistent with a previous study [13]. It has been shown that glucose malabsorption occurs in cldn15−/− mice [14]. To elucidate the mechanism underlining these impairments, Isc was measured in cldn15−/− mice. The addition of glucose to the mucosal side increased the Isc in a dose-dependent manner (Figure 4C). This change in Isc conformed to Michaelis–Menten kinetics (Figure 4D, r square = 0.996 ± 0.0001, n = 6), and the value of the maximum change in Isc (Vmax) was three-fold increased (p = 0.034 by the Mann–Whitney test 1479 ± 426 vs. 426 ± 51 µA/cm2/h in cldn15−/− and wild-type mice, respectively).
However, the Michaelis–Menten constant (Km) was not significantly different than that of wild-type mice (p = 0.23 by the Mann–Whitney test, 11.4 ± 2.0 vs. 8.4 ± 2.0 mM in cldn15−/− and wild-type mice, respectively). Together, these results imply that the total number of SGLT1 transporters was increased in cldn15−/− mice to compensate for the lowered luminal Na+ concentration [22].
The addition of 10 mM glucose to the mucosal side resulted in an increase of Isc (Figure 4E, ∆Isc: 23.9 ± 3.8 µmol/cm2/h) and JNaMS (Figure 4F closed squares, 21.4 ± 2.4 µmol/cm2/h), while serosal to mucosal JNaSM was not significantly changed after addition of luminal glucose (Figure 4F open squares, 10.0 ± 0.8 vs. 8.7 ± 0.5 µmol/cm2/h, p = 0.053, before and after addition of glucose, respectively). Since luminal Na+ homeostasis was disturbed in cldn15−/− mice [22], we next assessed the contribution of luminal Na+/H+ exchanger NHE3 to glucose-induced JNaMS increments by using the NHE3 specific inhibitor S3226. The addition of glucose to the mucosal side resulted in an increase of Isc (Figure 4G ∆Isc: 33.6 ± 2.5 µmol/cm2/h), which is slightly higher in the absence of S3226 (p = 0.003). In the presence of S3226, glucose-induced JNaMS increment was also observed (Figure 4H closed squares, ∆JNaMS: 34.9 ± 2.2 µmol/cm2/h), suggesting that NHE3 is not responsible for glucose-induced 22Na+ unidirectional flux increments. We next assessed the quantitative relationship between ∆Isc and ∆JNaNet (Figure 5, closed circles). There was a positive correlation between ∆Isc and ∆JNaNet (r square = 0.67). Taken together, these results suggest that glucose-induced ΔJNaMS is mainly mediated by SGLT1 under short-circuit conditions in cldn15−/− mice, which is the same as in wild-type mice.

2.6. Absence of Claudin-15 Increases Glucose-Induced Mucosal to Serosal 22Na+ Flux

We next measured basal electrical parameters and 22Na+ flux under open-circuit conditions in cldn15−/− mice (Table 2, lower rows). Baseline Vte was −6.0 ± 1.2 mV referenced to the serosal side (equivalent Isc 4.0 ± 0.6 µmol/cm2/h). Under those conditions, we examined whether basal unidirectional 22Na+ flux was affected by Vte. Although there was a negative luminal Vte, which is preferential for increasing serosal to mucosal Na+ flux, the JNaSM was not significantly different from those of short-circuit conditions (10.4 ± 0.8 vs. 12.0 ± 0.9 in short- and open-circuit conditions, respectively). We next measured glucose-induced Vte and JNa under open-circuit conditions (Figure 6). The addition of 10 mM luminal glucose increased the VteVte −20.6 ± 2.9 mV), which corresponded to an equivalent ∆Isc (24.7 ± 2.5 µmol/cm2/h, Figure 6A). This equivalent ∆Isc was not significantly different from that of short-circuit conditions, as shown in Figure 4C (p = 0.32). Unlike wild-type mice, there was a large negative luminal Vte, and a robust glucose-induced mucosal to serosal 22Na+ flux increment was observed in cldn15−/− mice (14.5 ± 1.9 vs. 4.7 ± 1.2 mmol/cm2/h, p = 0.01, in cldn15−/− and wild-type mice, respectively, Figure 6B). After application of glucose, an increase of JNaSM would be expected from such a large negative luminal Vte, however, JNaSM did not significantly change (Figure 6B, open squares). These results suggest that paracellular Na+ permeability was decreased in cldn15−/− mice. We next assessed the quantitative relationship between ∆Isc and ∆JNaNet under open-circuit conditions (Figure 5, open circles). There was no relationship between ∆Isc and ∆JNaNet (r square = 0.0012). However, the averaged ΔJNaNet value (11.5 ± 2.9 µmol/cm2/h) was significantly different from zero (p = 0.01). Taken together, these results suggest that Na+-dependent glucose cotransport concomitantly increases transepithelial Na+ transport under open-circuit conditions in cldn15−/− mice.
To quantitatively evaluate the Vte-dependent paracellular passive Na+ flux, we examined the effect of changing Vte on JNaSM, which mainly represents the paracellular pathway. JNaSM was plotted as a function of (FΔV/RT)/{exp(FΔV/RT) − 1}, which represents the driving force of ion movement. This should yield a line having a slope of the Vte-dependent diffusion flux [23]. As shown in Figure 7, the slope of the line was decreased by 50% in cldn15−/− mice as compared with wild-type mice (3.6 ± 0.9 vs. 7.8 ± 1.9, in cldn15−/− and wild-type mice, respectively), suggesting decreased paracellular Na+ permeability in cldn15−/− mice. Together, these results suggest that the Na+ which is absorbed by Na+-dependent glucose cotransport is recycled back into the lumen to support Na+-dependent glucose absorption and this Na+-cotransport induced luminal negative potential is important for Na+ recycling in wild-type mice.

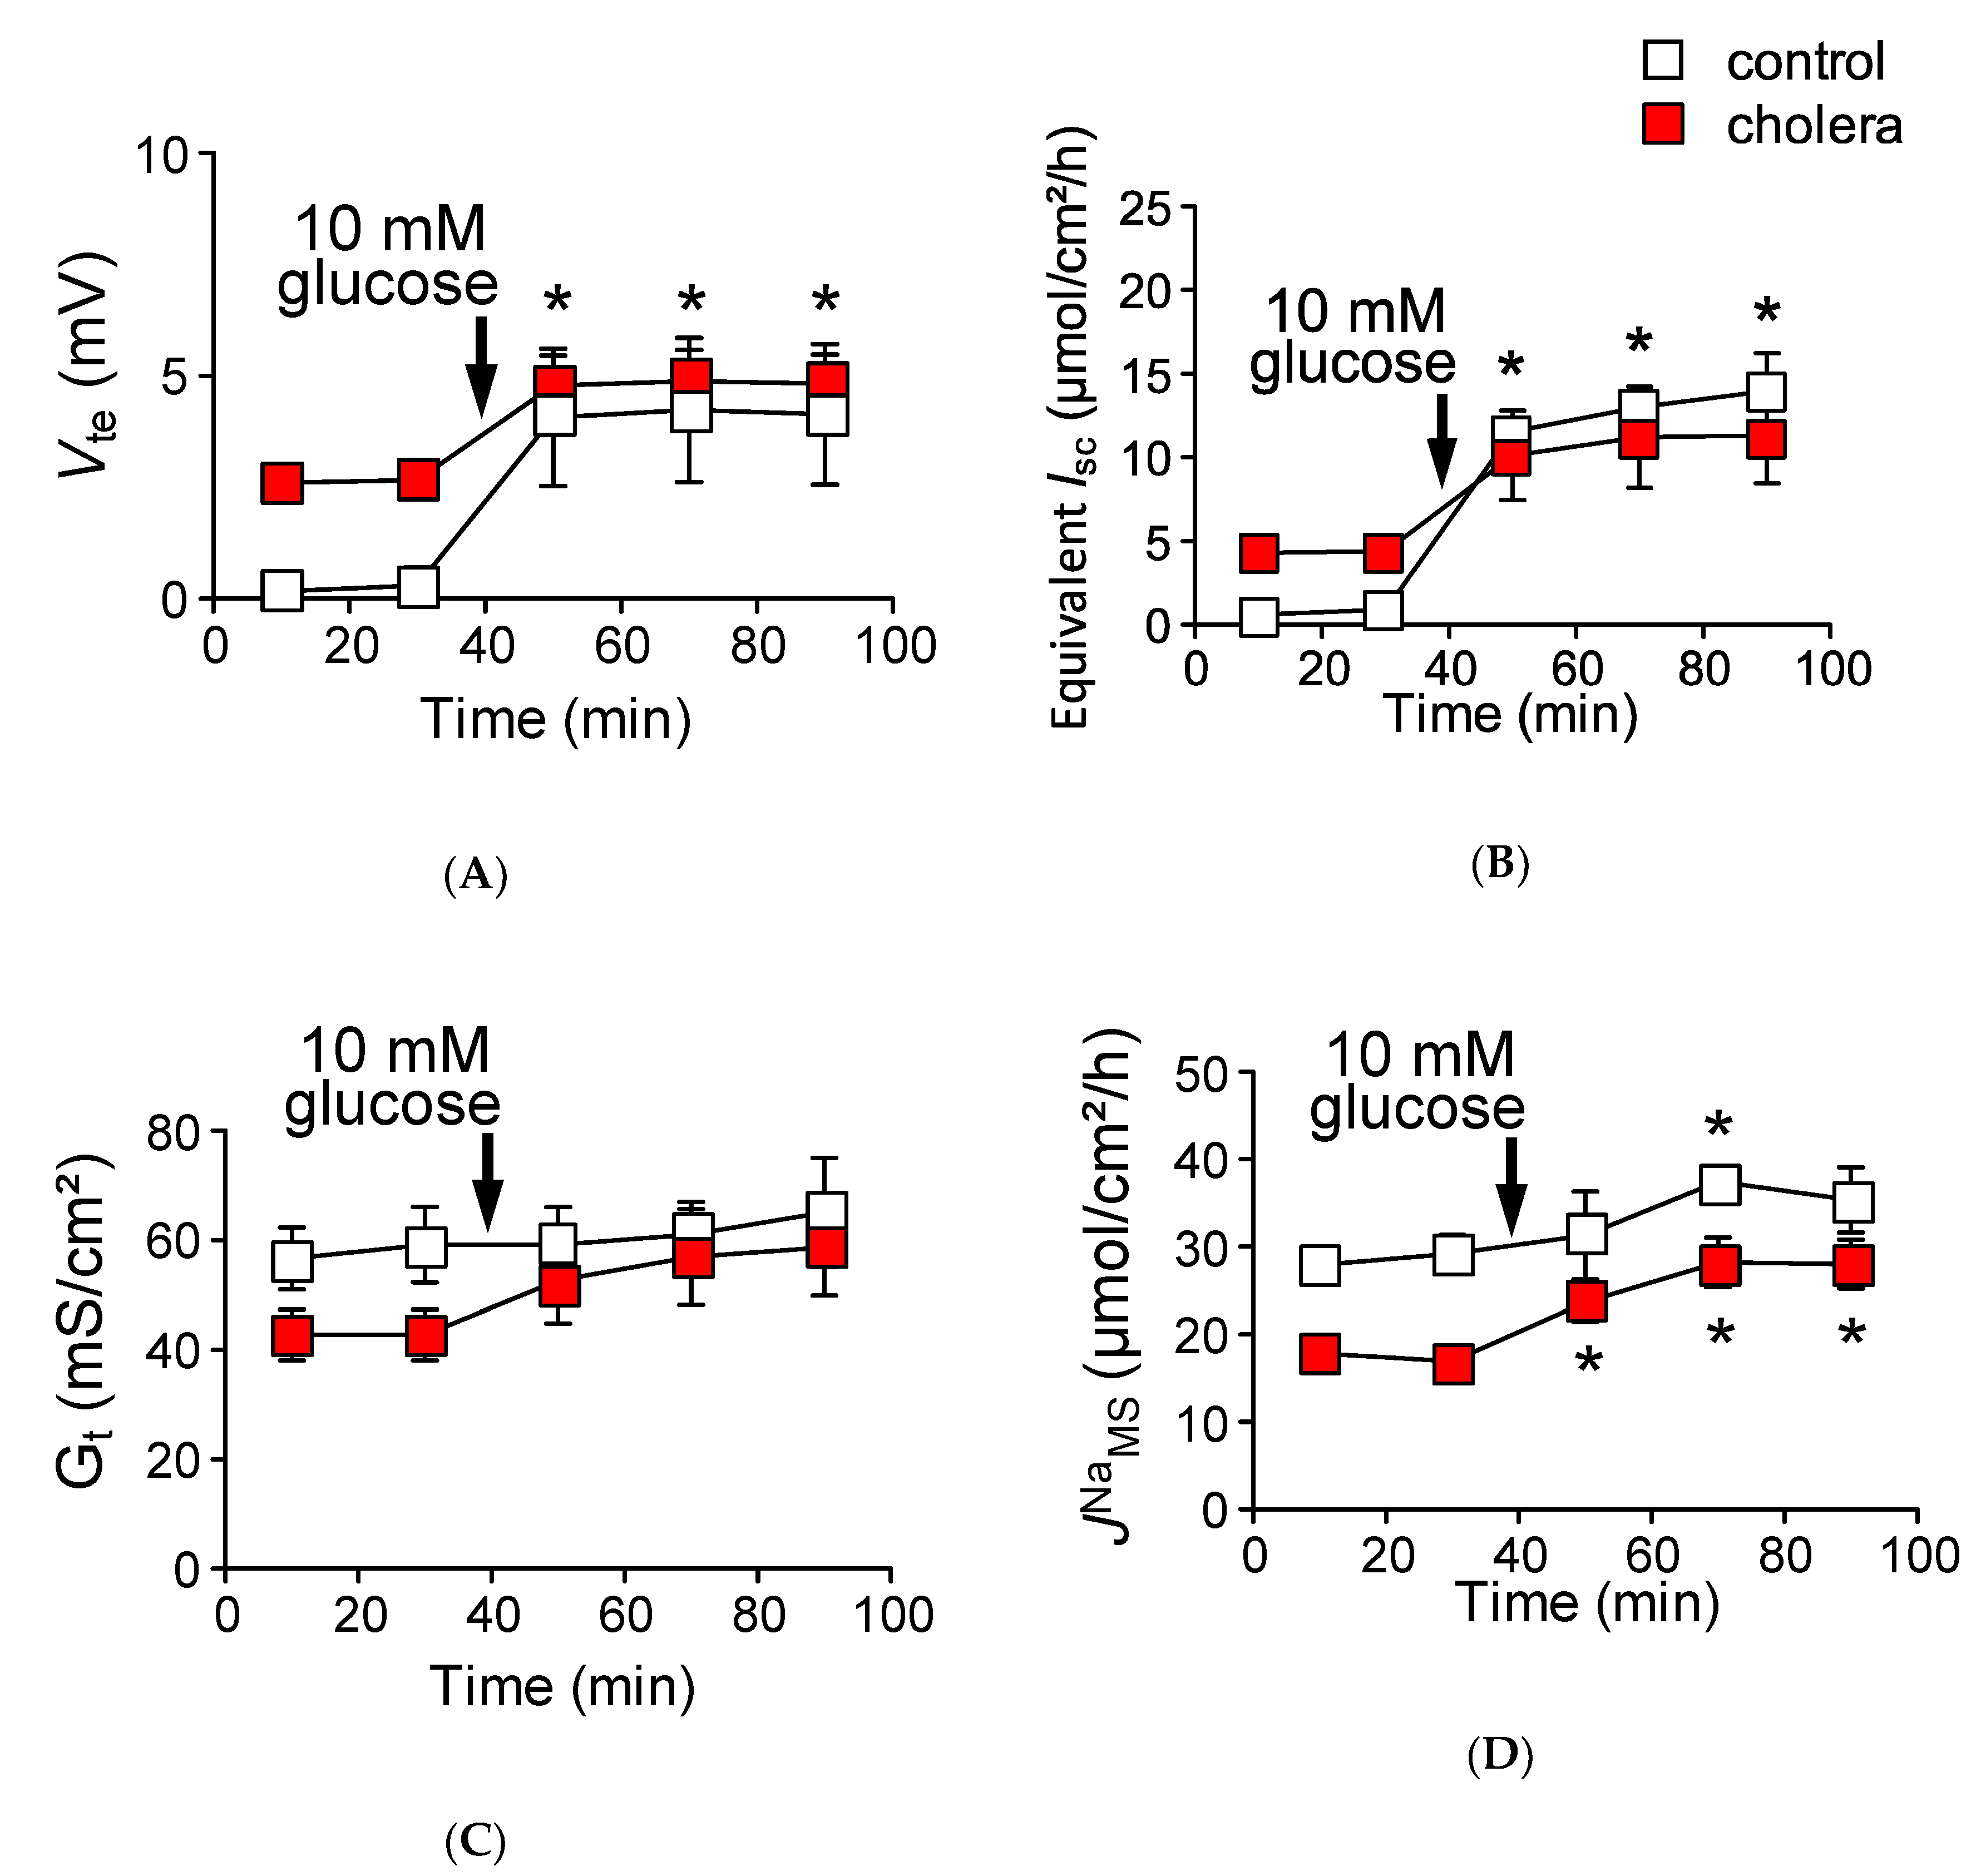
2.7. The Efficiency of Na+ Recycling Systems Is Reduced in a Cholera Toxin-Induced Diarrhea Model

The preceding experiments suggest that, under physiological conditions, the Na+ that is absorbed by Na+-dependent glucose cotransport is recycled back into the lumen via paracellular Na+ conductance which is driven by the Na+ cotransport induced luminal negative potential. However, this idea is not consistent with the mechanisms of oral rehydration therapy, which is based on the notion that the Na+ which is absorbed by Na+-glucose cotransport enters the systemic circulation [16]. This discrepancy could be explained by the idea that the efficiency of Na+ recycling systems is reduced during infectious diarrhea. To address this directly, we measured glucose-induced unidirectional JNaMS in cholera toxin-diarrhea model mice. Five hours after gavage of cholera toxin, we first verified the effect of cholera toxin on intestinal ion transport by measuring the transepithelial potential difference (Vte) in isolated upper small intestine in Ussing chambers. Luminal negative Vte (referenced to the serosal side) was increased after administration of cholera toxin (–0.30 ± 0.3 vs. –2.66 ± 0.3 mV in the control and cholera toxin-diarrhea model mice, respectively, p = 0.008), suggesting that Cl secretion was increased in cholera toxin-diarrhea model mice. In addition, basal unidirectional JNaMS was decreased by 42% as compared with the control mice (Table 3) but not for JNaSM, suggesting inhibition of electroneutral NaCl absorption. These observations are consistent with the action of cholera toxin on intestinal epithelial transport [24]. Interestingly, the basal Gt of cholera toxin-diarrhea model mice was significantly decreased by 27.8% as compared with the control mice (Table 3). Surprisingly, although there was such a large luminal negative Vte (2.7 mV), in which an increase of JNaSM would be expected as shown in Figure 7, JNaSM was actually decreased by 6.2% as compared with the control mice (Table 3). Taken together, these results suggest that paracellular Na+ pores, which can be formed by claudin-15, are decreased in cholera toxin-diarrhea model mice, consistent with a previous study [25]. To address this question directly, we measured Gt after stimulation of cAMP formation by forskolin and the phosphodiesterase inhibitor isobutylmethylxanthine (IBMX) in wild-type and cldn15−/− mice in Ussing chambers. Gt was decreased within 20 min after addition of forskolin and IBMX in wild-type mice (29.1 ± 1.3 vs. 21.8 ± 1.4 mS/cm2 before and after treatment with forskolin and IBMX, respectively, p = 0.0001), consistent with a previous study [26]. However, upon formation of intracellular cAMP induced by forskolin and IBMX, Gt was not decreased in cldn15−/− mice (18.6 ± 5.3 vs. 16.5 ± 5.4 mS/cm2, after treatment with forskolin and IBMX and control, respectively, p = 0.10). These results suggest that paracellular Na+ conductance, which is directed by claudin-15, is acutely regulated by elevation of intracellular cAMP.
We next measured glucose-induced mucosal to serosal 22Na+ flux in the cholera toxin-diarrhea model mice under open-circuit conditions (Figure 8). The addition of glucose to the mucosal side resulted in an increase in Vte (Figure 8A closed squares, ΔVte −2.1 ± 0.3 mV, n = 5). As shown in Figure 8B, glucose-induced equivalent ∆Isc was 6.7 ± 1.9 µmol/cm2/h, which was not significantly different from that of control conditions, as shown in Figure 3A (p = 0.16). Interestingly, after the addition of glucose, Gt was increased in the cholera toxin-diarrhea model mice, but not in the control mice (Figure 8C). Unlike animals that were not treated with cholera toxin treated with vehicle only (Figure 8D, open squares), robust glucose-induced mucosal to serosal 22Na+ flux increment was observed in the cholera toxin-diarrhea model mice (Figure 8D, 11.1 ± 1.8 vs. 6.1 ± 1.6 µmol/cm2/h, p = 0.08 as compared with the control conditions, in the cholera toxin-diarrhea model and the control mice, respectively). It failed to attain statistical significance, but the phenomenon is reminiscent of the cldn15−/− mice (Figure 6B). Taken together, these results suggest that the efficiency of Na+ recycling systems is reduced under cholera toxin diarrhea conditions.

3. Discussion

The aim of this study was to investigate if paracellular recirculation of Na+ is essential to support Na+-dependent nutrient absorption and to elucidate the role of Na+-nutrient cotransport induced luminal negative potential for Na+ recycling. We demonstrated that under short-circuit conditions luminal application of glucose resulted in an increment of absorptive 22Na+ fluxes (∆JNa) which corresponded to increments of short-circuit currents (∆Isc) in wild-type mice. However, under open-circuit conditions, ∆Isc was observed but ∆JNa was strongly inhibited. In cldn15−/− mice, a robust increment of ∆JNa was observed under open-circuit conditions, and this recycling dysfunction was mimicked by a cholera toxin-diarrhea model in wild-type mice. Therefore, we feel that under physiological conditions, the Na+ that is absorbed with nutrients is recycled back into the lumen via the paracellular pathway due to pores which are formed by claudin-15. To further support this idea, the efficiency of this Na+ recycling system was also reduced in cholera toxin-diarrhea model mice.

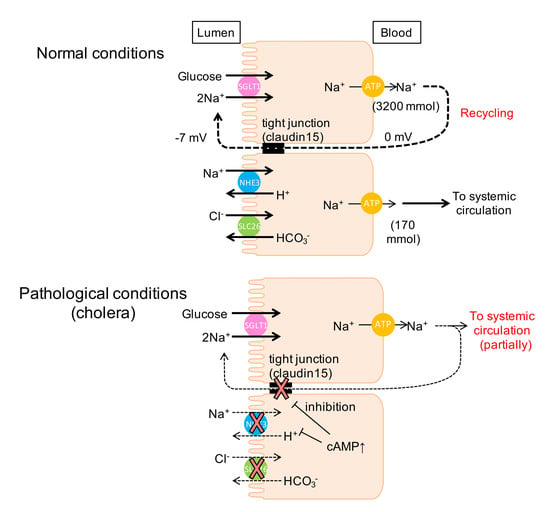
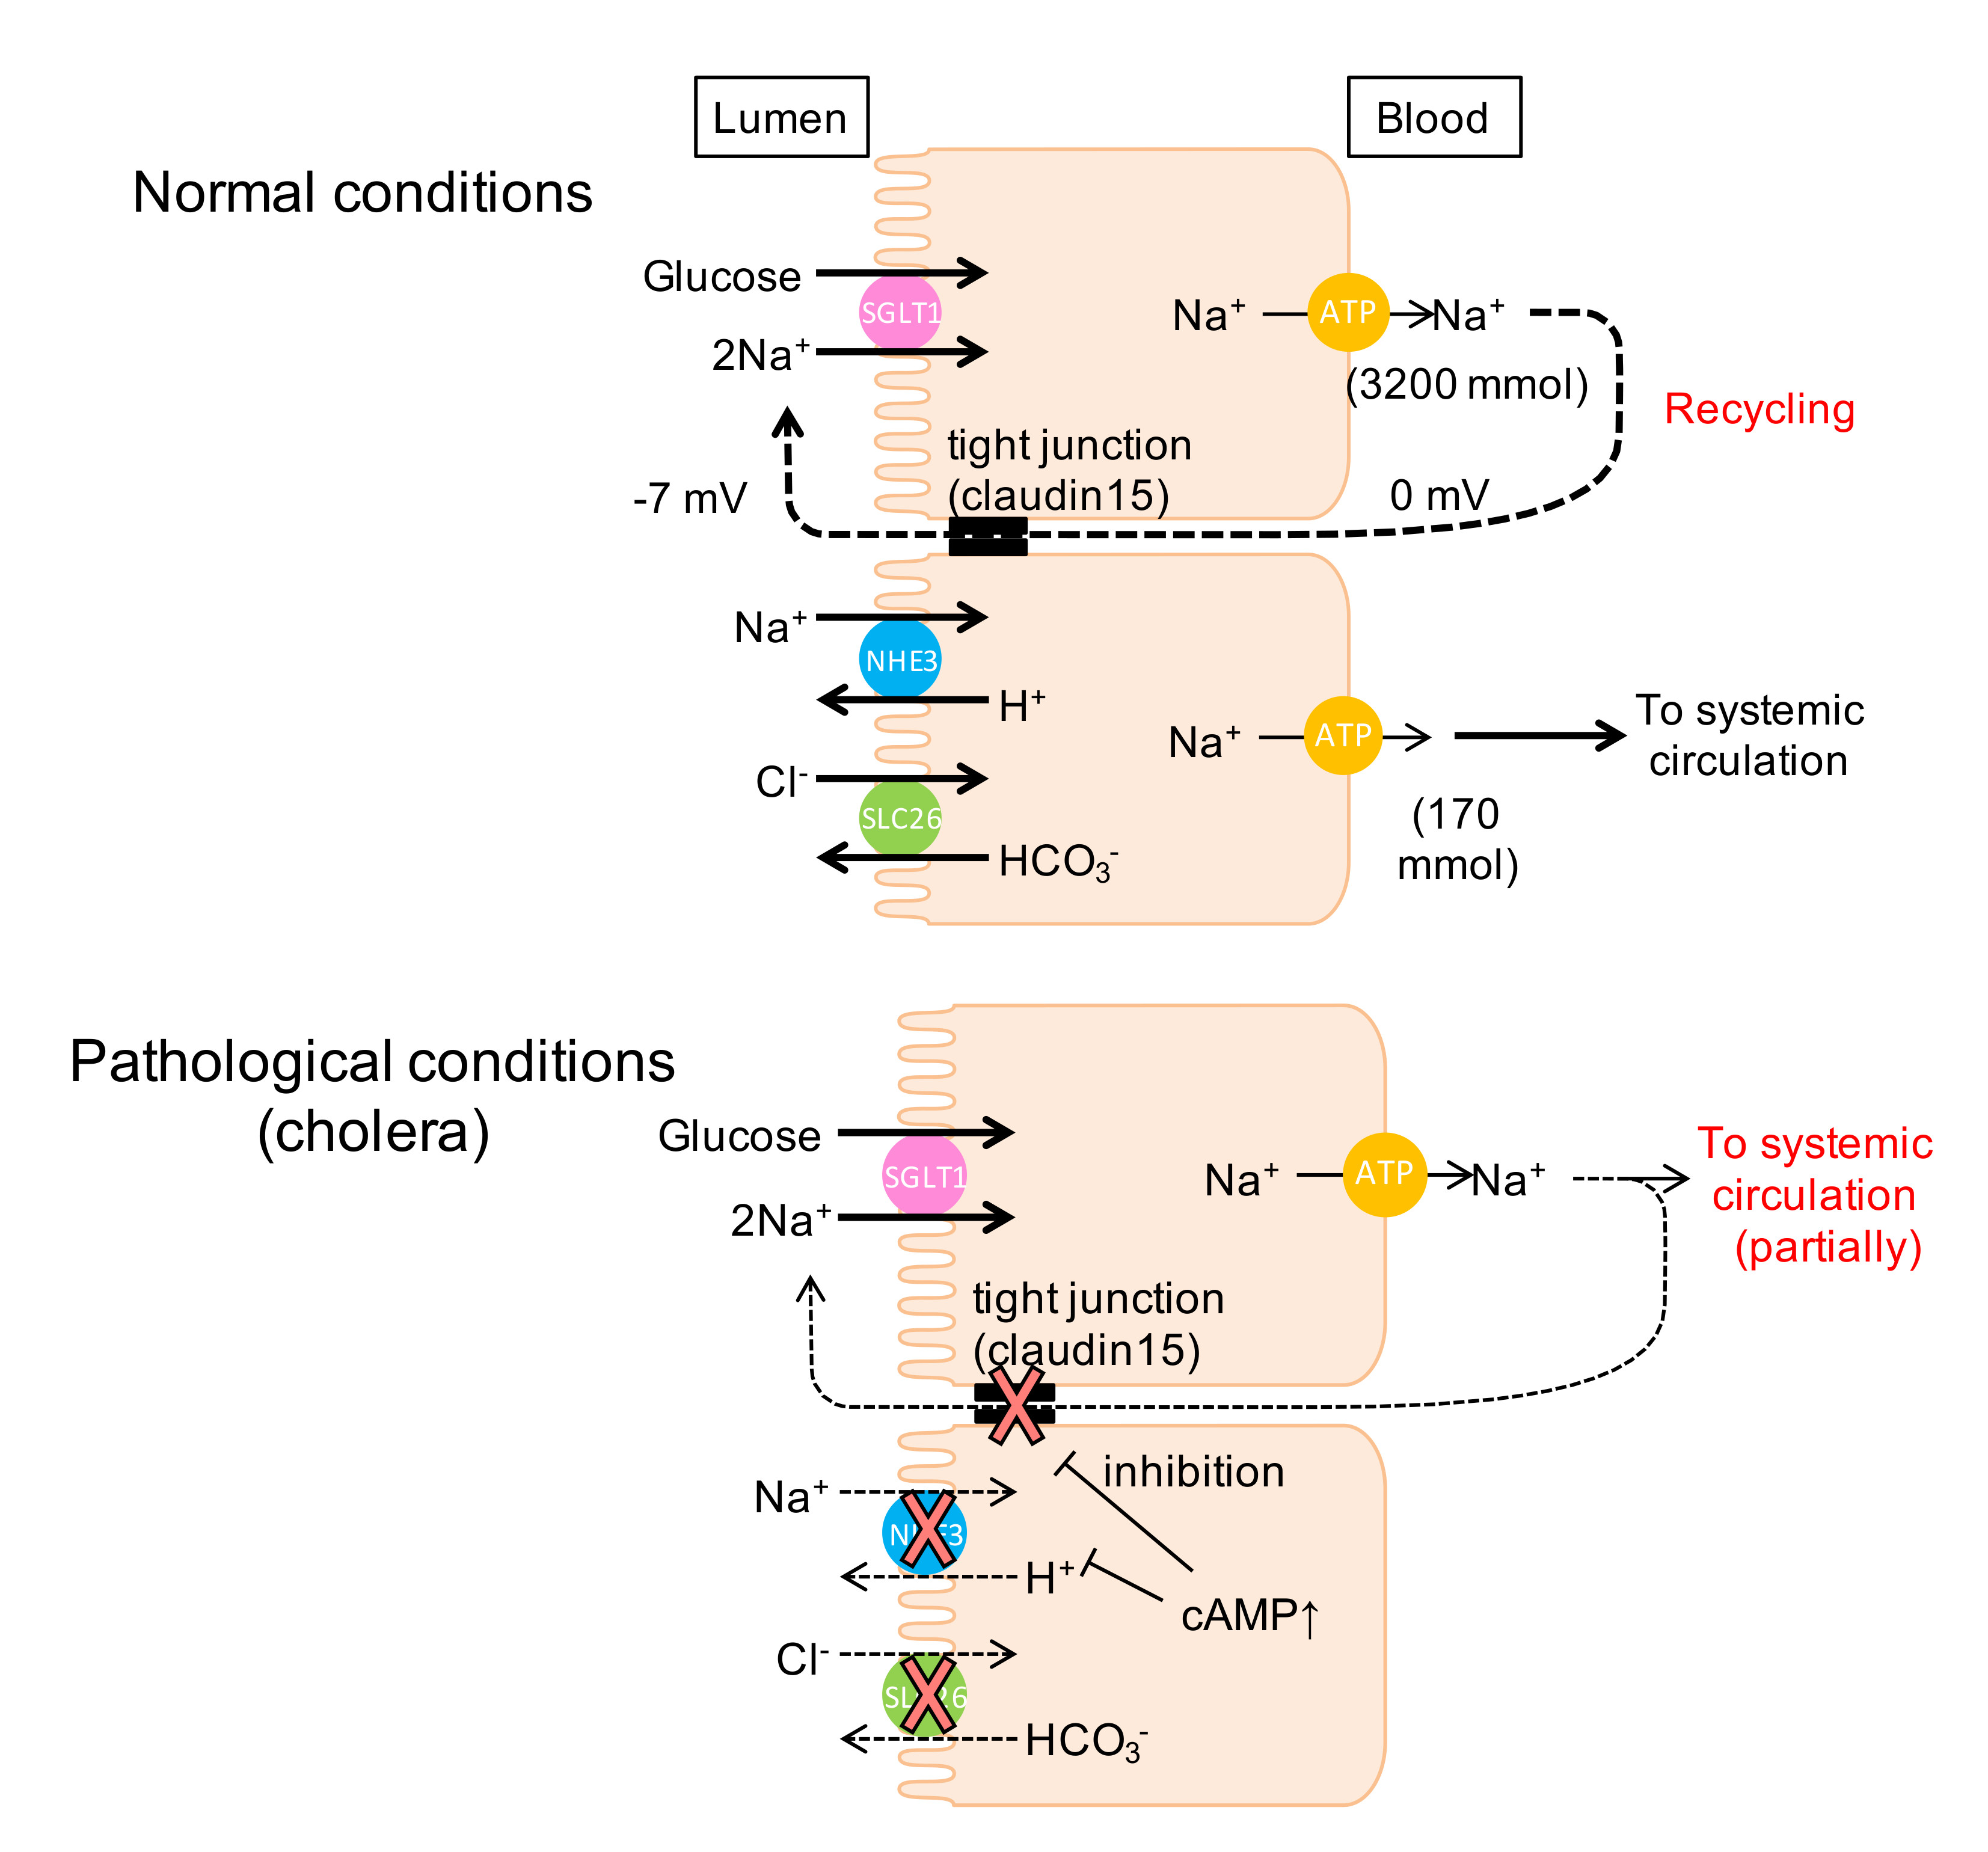
3.1. Intestinal Nutrient Absorption Mechanisms Need a Large Amount of Luminal Na+

We assumed that most protein and carbohydrates are digested to monomers and absorbed via Na+-dependent nutrient transporters. However, it has been proposed that a significant amount of amino acids are absorbed as tripeptides by transporters driven by protons [27]. We have previously shown that the mucosal surface pH in the upper jejunum is significantly alkalinized and glycyl-sarcosine (nonhydrolyzable dipeptide, Gly-Sar) absorption was inhibited in cldn15−/− mice [22]. Furthermore, Gly-Sar induced Isc increments were tightly coupled to luminal Na+/H+ exchange NHE3 activity and these peptide-induced Isc increments were inhibited by NHE3 specific inhibitors S3226 and Tenapanor [22,28]. These results imply that other proton dependent cotransporters systems such as proton coupled amino acid and peptide transporters need luminal Na+. With respect to carbohydrates, it has been shown that complex carbohydrates can reduce the influx of carbohydrates monomers [29], which suggests that our estimation that most carbohydrates are digested to monomers is oversimplified. However, this is unlikely based on the observation that small intestinal mass absorption of glucose is mainly mediated by SGLT1, since the increase of glucose concentration in plasma after glucose gavage is reduced in SGLT1 knock-out mice [30]. Taken together, these considerations suggest that intestinal nutrient absorption mechanisms require a large amount of luminal Na+.

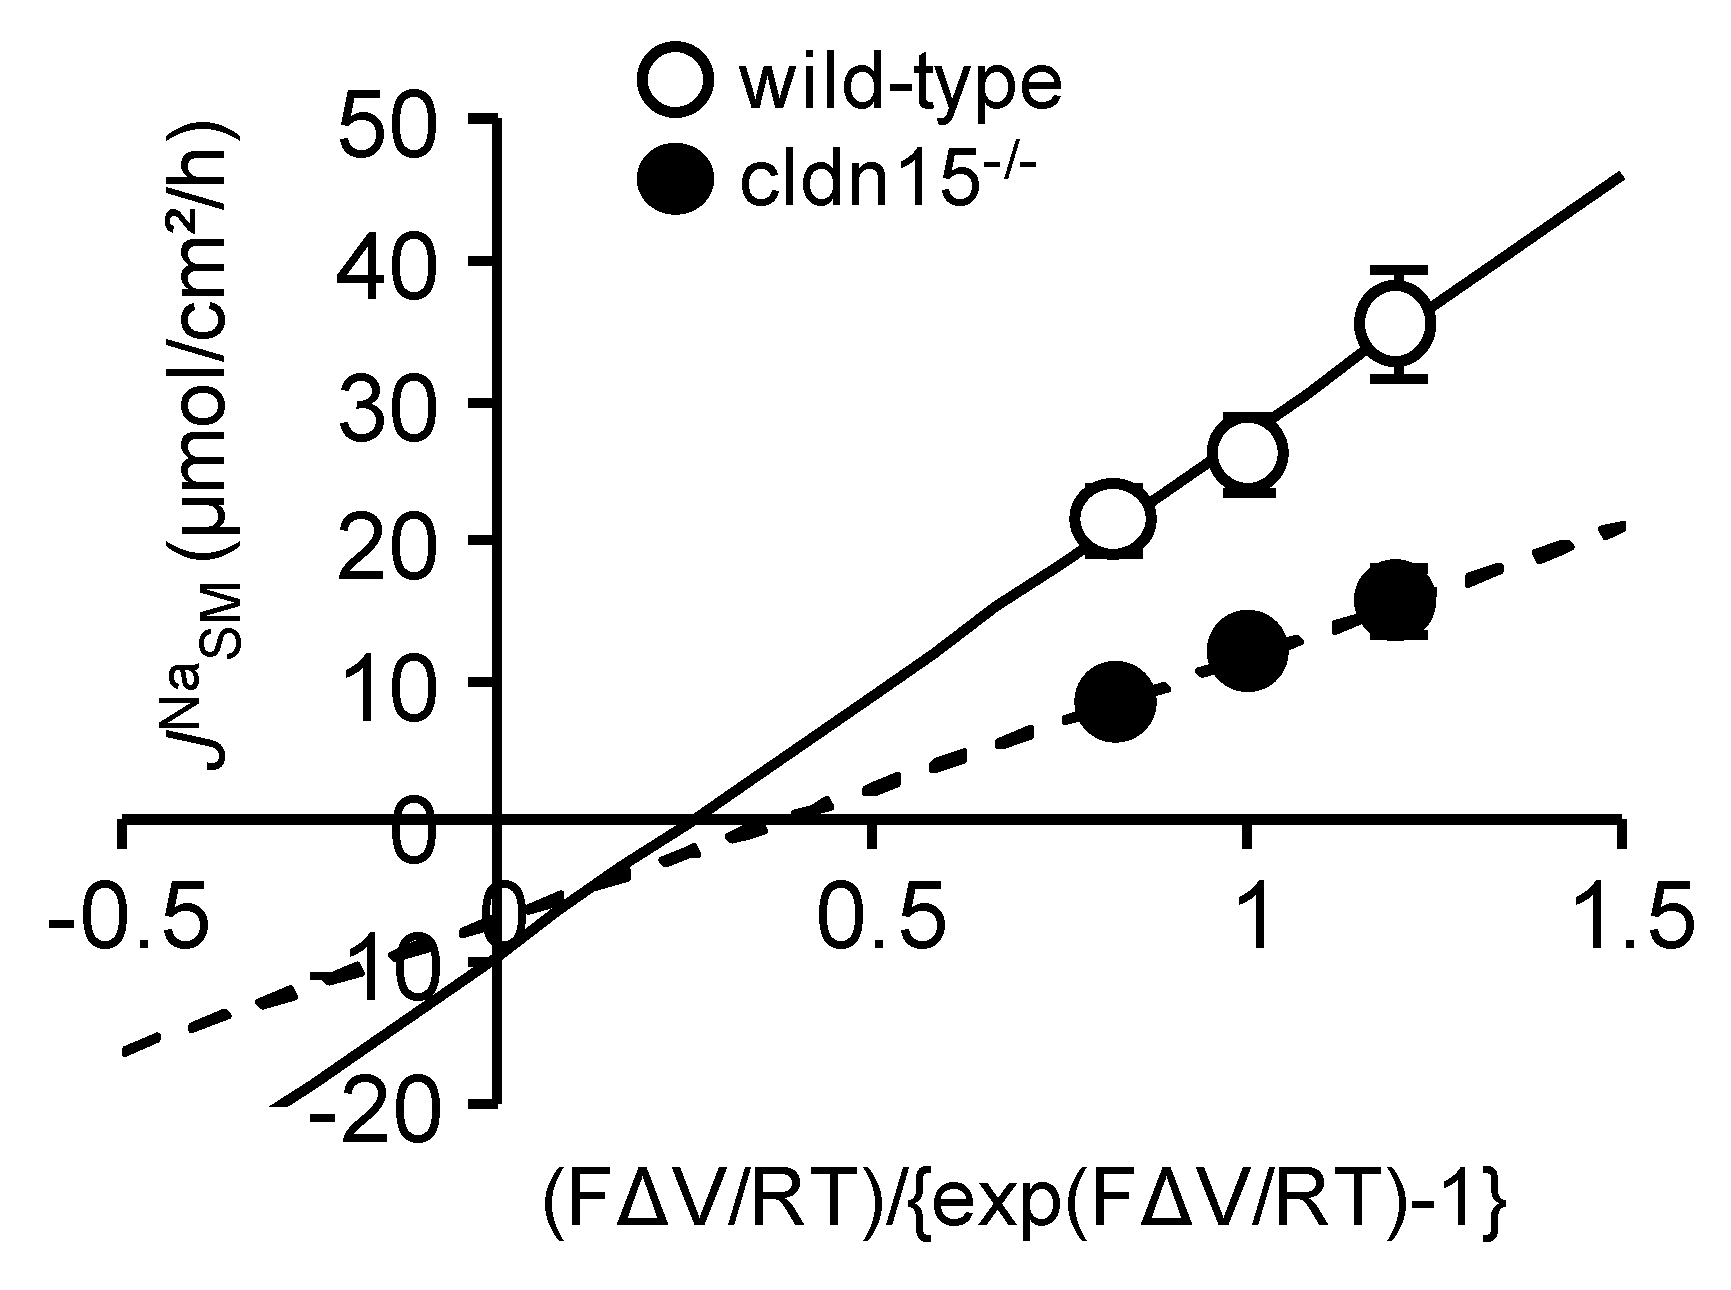
3.2. Paracellular Na+ Permeability Is Decreased in Cldn15−/− Mice

It has been shown that small intestinal epithelia are classified as leaky epithelia, i.e., paracellular conductance greater than ~90% of total tissue conductance and cation selective permselectivity (PNa > PCl) [9]. However, the molecules responsible for permselectivity in the intestine remain to be fully elucidated. We found that electrical transepithelial conductance of cldn15−/− mice was decreased by 70% as compared with wild-type mice (Table 1 and Table 2). In addition, unidirectional 22Na+ flux from serosal to mucosal side in cldn15−/− mice, which is mainly reflected by the paracellular pathway, was decreased by 60% as compared with wild-type mice (Figure 4F and Figure 1B). Taken together, these results suggest that paracellular Na+ pores are mainly formed by claudin-15, consistent with a previous report [14]. Despite having defective luminal Na+ homeostasis [22], cldn15−/− mice do not have severe intestinal dysfunction and malabsorption (serum albumin 2.7 ± 0.19 vs. 3.0 ± 0.12g/dL, p = 0.17; serum total glyceride 43 ± 13 vs. 47 ± 20 mg/dL, p = 0.88; serum glucose 205 ± 10 vs. 270 ± 27 mg/dL, p = 0.1 in cldn15−/− and wild-type mice, respectively, n = 3 to 4 in each genotype). We believe this can be explained by the other remaining claudin(s), which could be sufficient to support the luminal Na+ which is needed for nutrient absorption. One possibility is that claudin-2, which forms cation-selective pores, can contribute to Na+ dependent nutrient absorption [11,31]. Indeed, it has been shown that claudin-2 and claudin-15 double-knockout mice die as a result of malnutrition in early infancy [32], suggesting that claudin-2 could also be contributing to Na+-dependent nutrient absorption.

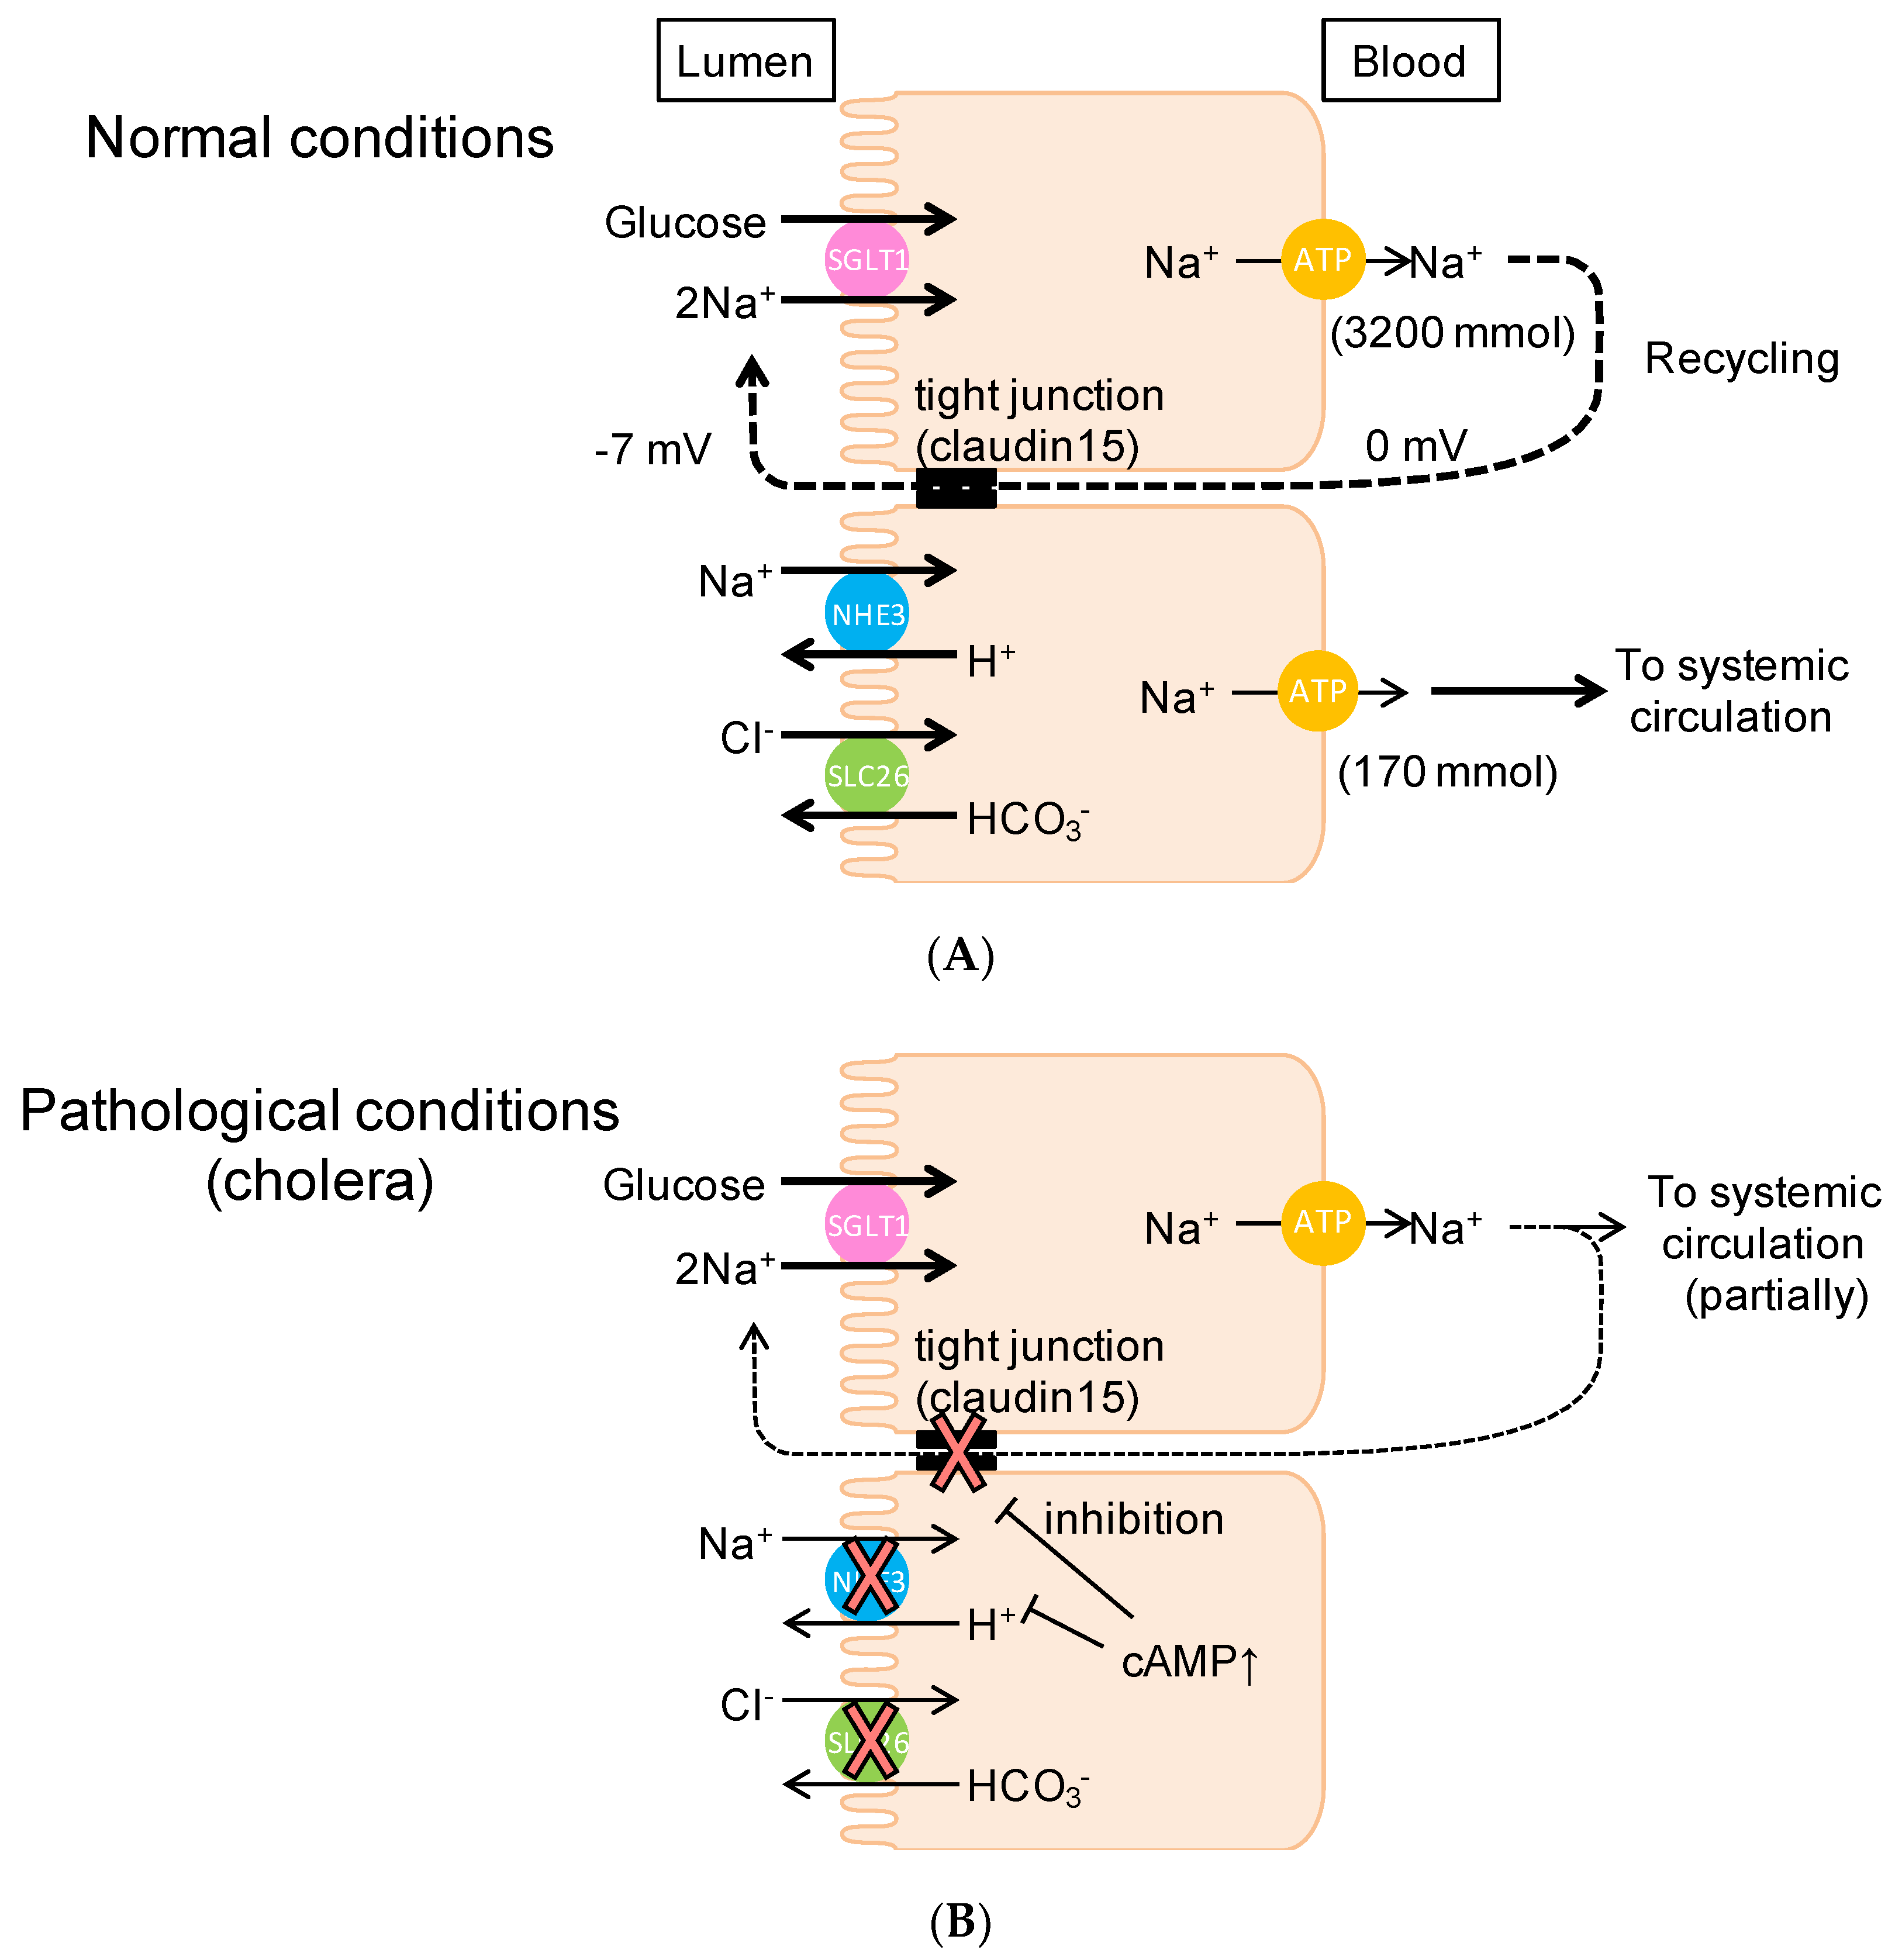
3.3. Luminal Negative Potential Is Important for Na+ Recirculation

Our data support the conclusion that Na+ absorbed by Na+-dependent glucose cotransport is rapidly recycled back into the lumen via paracellular pathways which are driven by increased luminal negative potential generated by electrogenic glucose absorption mechanisms. Under open-circuit conditions, activation of SGLT1 did not increase mucosal to serosal 22Na+ fluxes in wild-type mice (Figure 3B). Furthermore, under the same experimental conditions, although there was a large luminal negative Vte (−20 mV), robust glucose-induced mucosal to serosal 22Na+ flux increment was observed in cldn15−/− mice (Figure 6B). To our knowledge, under physiological conditions, a postprandial robust increase in blood Na+ concentrations has not been shown. However, it is generally believed that there are two Na+ absorption systems in the small intestine; one is electrogenic nutrient-coupled Na+ absorption, and the other is electroneutral NaCl absorption [1]. It is also generally thought that bulk transport of NaCl absorption in the small intestine is mediated by electroneutral absorption by the coupling of luminal Na+/H+ exchanger NHE3, and Cl/HCO3 exchanger SLC26A3, since both NHE3 knockout mice and SLC26A3 knockout mice manifest in diarrhea [33,34]. These two sets of Na+ absorption transporter systems reside in the same nutrient absorbing enterocytes. It is predicted, therefore, that there is an interaction between the two Na+ absorption mechanisms. Indeed, it has been shown that Na+-coupled glucose uptake stimulates NHE3 transport activity in mouse jejunum [19]. However, this interaction would not be favorable for the driving force of nutrient-coupled Na+ absorption because a decrease of luminal Na+ concentration is not favorable for Na+-dependent nutrient absorption to absorb nutrients efficiently. Our results indicated that glucose does not stimulate NHE3 activity (Figure 1D). In addition, we fed rats with nominal Na-free diet for five days and measured intestinal luminal Na+ concentration. There was a significant difference in luminal Na+ concentrations in the stomach (59 ± 9 vs. 7 ± 1 mM in control and Na-free diet, respectively, p < 0.05) and colon (40 ± 8 vs. 18 ± 4 mM in control and Na-free diet, respectively, p < 0.05) but not in in the small intestine (57 ± 13 vs. 50 ± 9 mM in control and Na-free diet, respectively, p > 0.05). These results suggest that luminal Na+ homeostasis in the small intestine, which is the external milieu, is independent of the amount of Na+ intake. We believe that this luminal Na+ homeostasis is maintained by claudin-15 and regulated by increased luminal potential generated by electrogenic Na+-nutrient cotransport, since luminal Na+ homeostasis is disrupted in cldn15−/− mice [22]. Under pathophysiological conditions in wild-type mice, our results indicated that paracellular Na+ conductance was decreased by cholera toxin (Table 3). In accordance, previous studies have shown that paracellular conductance and ion selectivity were changed after treatment with theophylline (phosphodiesterase inhibitor, which raises intracellular cAMP) or cholera toxin in the rabbit ileum [25]. It has also been shown that an increase of intracellular cAMP resulted in a decrease of paracellular conductance [26,35]. Our results imply that Na+ conductance that is directed by claudin-15 is regulated by intracellular cAMP level. However, elucidation of molecular mechanism of this regulation requires further investigation.

3.4. Physiological Relevance of the Na+ Recirculation System in the Small Intestine

On the one hand, our conclusion implies that the Na+ that is absorbed by SGLT1 does not enter the systemic circulation under physiological conditions (Figure 9A). On the other hand, under pathophysiological conditions, such as in cholera-infected patients, glucose-containing oral rehydration solution (ORS) stimulates Na+ and water absorption, implying that the Na+ that is absorbed by SGLT1 does enter the systemic circulation (Figure 9B). It is also thought that glucose-induced Na+ absorption is not affected by cholera toxin [36]. The composition (75 mM glucose, 75 mM NaCl, and so on) of ORS is based on its efficacy in replacing water and electrolytes in individuals [16,37]. This glucose-dependent Na+-absorption mechanism under pathophysiological conditions is not consistent with our results under normal conditions, where Na+ absorbed with glucose is recycled back into the lumen rather than entering systemic circulation. Another explanation for glucose-induced Na+ absorption could be a decrease of Na+ recirculation upon infection with cholera. Indeed, our findings indicated that paracellular Na+ pores were decreased and glucose-induced Na+ absorption was observed in cholera toxin-diarrhea model mice under open-circuit conditions (Figure 8). These findings are consistent with the notion that Na+ recycling systems were reduced under pathophysiological diarrhea conditions. Our findings also suggest that Na+ cotransport-induced luminal negative potential is important for the Na+ recycling system. Conversely, this implies that Na+ absorbed via electroneutral systems, such as NaCl absorption (parallelly coupled Na+/H+ and Cl/HCO3 exchangers) and nonelectrogenic fructose absorption, can enter systemic circulation. In accordance with this notion, a recent study demonstrated that fructose-induced hypertension is initiated by increased absorption of NaCl and fructose in the intestine [38]. It is also noteworthy that ORS was occasionally associated with hypernatremia [39], implying that there is a decrease of Na+ recycling system activity in cases of infectious diarrhea (Figure 9B).
In summary, our data indicate that claudin-15 is important for luminal Na+ homeostasis and Na+-dependent nutrient absorption. These findings may contribute to the understanding of the mechanisms of oral rehydration therapy. Our observations raise the possibility that the Na+ that is absorbed with nutrients is recycled back into the lumen via paracellular pores which are formed mainly by claudin-15 under physiological conditions.

4. Materials and Methods

4.1. Ethical Approval

All animal experimental procedures and handling were approved by the Animal Care and Use Committee of the University of Shizuoka (reference no.165117 and 175151, approved on 28th March 2016 and 8th March 2017, respectively) and conducted in accordance with the Guidelines and Regulations for the Care and Use of Experimental Animals by the University of Shizuoka.

4.2. Animals

Claudin-15 deficient (Cldn15−/−) mice were originally generated in the Laboratory of Prof. Tsukita, as described previously [13]. Cldn15−/− mice on a C57BL/6J genetic background and their age- and sex-matched wild-type mice were used. Wild-type male C57BL/6J Jcl mice from Clea Japan (Tokyo, Japan) were also used in some experiments. Mice were used at 2 to 9 months of age. The mice were fed a standard pellet diet (MF, Oriental Yeast, Tokyo, Japan), and water was provided ad libitum.

4.3. Measurement of Electrical Parameters and Unidirectional Fluxes of 22Na+ and 36Cl

Mice were anaesthetized with a mixture of drugs (10 µL/g B.W., I.P. injection) consisting of medetomidine (30 µg/mL, Nippon Zenyaku Kogyo, Fukushima, Japan), midazolam (0.4 mg/mL, Teva Pharma Ltd., Nagoya, Japan), and butorphanol (0.5 mg/mL, Meiji Seika, Tokyo, Japan). The abdomen was opened by a midline incision, the small intestine from duodenum to terminal ileum was excised, and the middle one-third of the small intestine was used for experiments. The isolated segment was opened and rinsed with ice-cold oxygenized buffer to remove luminal contents, and then the muscle layer was stripped with fine forceps under a stereomicroscope. The tissue was then mounted vertically in Ussing chambers with an internal surface area of 0.2 cm2. The bathing solution in each chamber was 5 mL and was kept at 37 °C in a water-jacketed reservoir. The bathing solution contained (in mM) 119 NaCl, 21 NaHCO3, 2.4 K2HPO4, 0.6 KH2PO4, 1.2 CaCl2, 1.2 MgCl2, 0.5 glutamine, and 10 µM indomethacin, and was gassed with 95% O2 and 5% CO2 (pH 7.4). Isc was recorded using a voltage-clamping amplifier (CEZ9100, Nihon Kohden, Tokyo, Japan). Gt was calculated from the change of current in response to voltage pulses according to Ohm’s law. We also performed experiments under open-circuit conditions to compare electrophysiological parameters and ion flux with those under short-circuited conditions. The equivalent Isc was determined from Vte and Gt by applying Ohm’s law. The unidirectional transmural radioactive isotope fluxes of mucosal to serosal (JMS) and serosal to mucosal (JSM) were measured in adjacent tissues. Then, 9 kBq/mL 22Na+ or 1.6 kBq/mL 36Cl was added either to the serosal or mucosal solutions after reaching stable electrical parameters. After a 45 min period of equilibration, samples (0.5 mL each) were taken from the unlabeled side at 20 min intervals and replaced with an equal volume of unlabeled solution. Medium samples containing 22Na+ and 36Cl were counted in a liquid scintillation counter (LSC-7000, Aloka, Tokyo, Japan). To examine the effect of Vte change on unidirectional 22Na+ flux, we performed two 20 min flux periods with Vte at 0 mV, and two 20 min periods with Vte at 10 mV (or −10 mV).

4.4. Cholera Toxin-Induced Diarrhea Model

Before the administration of cholera toxin (Wako, Osaka, Japan), mice were fasted for 24 h except for water ingestion. Mice were then gavaged with a single dose of 10 µg cholera toxin in 100 µL of 150 mM NaCl solution through a gastric tube, with NaCl solution as a control. Five hours after administration, mice were anaesthetized with a mixture of drugs, the duodenum and upper part of jejunum were excised and used for the Ussing chamber experiments.

4.5. Chemicals

3-[2-(3-guanidino-2-methyl-3-oxopropenyl)-5-methyl-phenyl]-N-isopropylidene-2-methyl-acrylamide dihydrochloride (S3226) was synthesized by WuXi AppTec Co., Ltd. (Shanghai, People’s Republic of China). The S3226 was dissolved in 0.1% DMSO to make stock solutions. The 36Cl was purchased from Amersham Bioscience (Piscataway, NJ, USA), 22Na+ was purchased from Perkin-Elmer (Boston, MA, USA) and all other reagents were from Sigma (St. Louis, MO, USA).

4.6. Real-Time Quantitative PCR

Real-time quantitative PCR experiments were performed as previously described in [22]. The following primers were used for PCR amplifications: Cldn15, 5′-CAACGTGGGCAACATGGA-3′ and 5′-TGACGGCGTACCACGAGATAG-3′; beta-actin, 5′-CATCCGTAAAGACCTCTATGCCAAC-3′ and 5′-ATGGAGCCACCGATCCACA-3′.

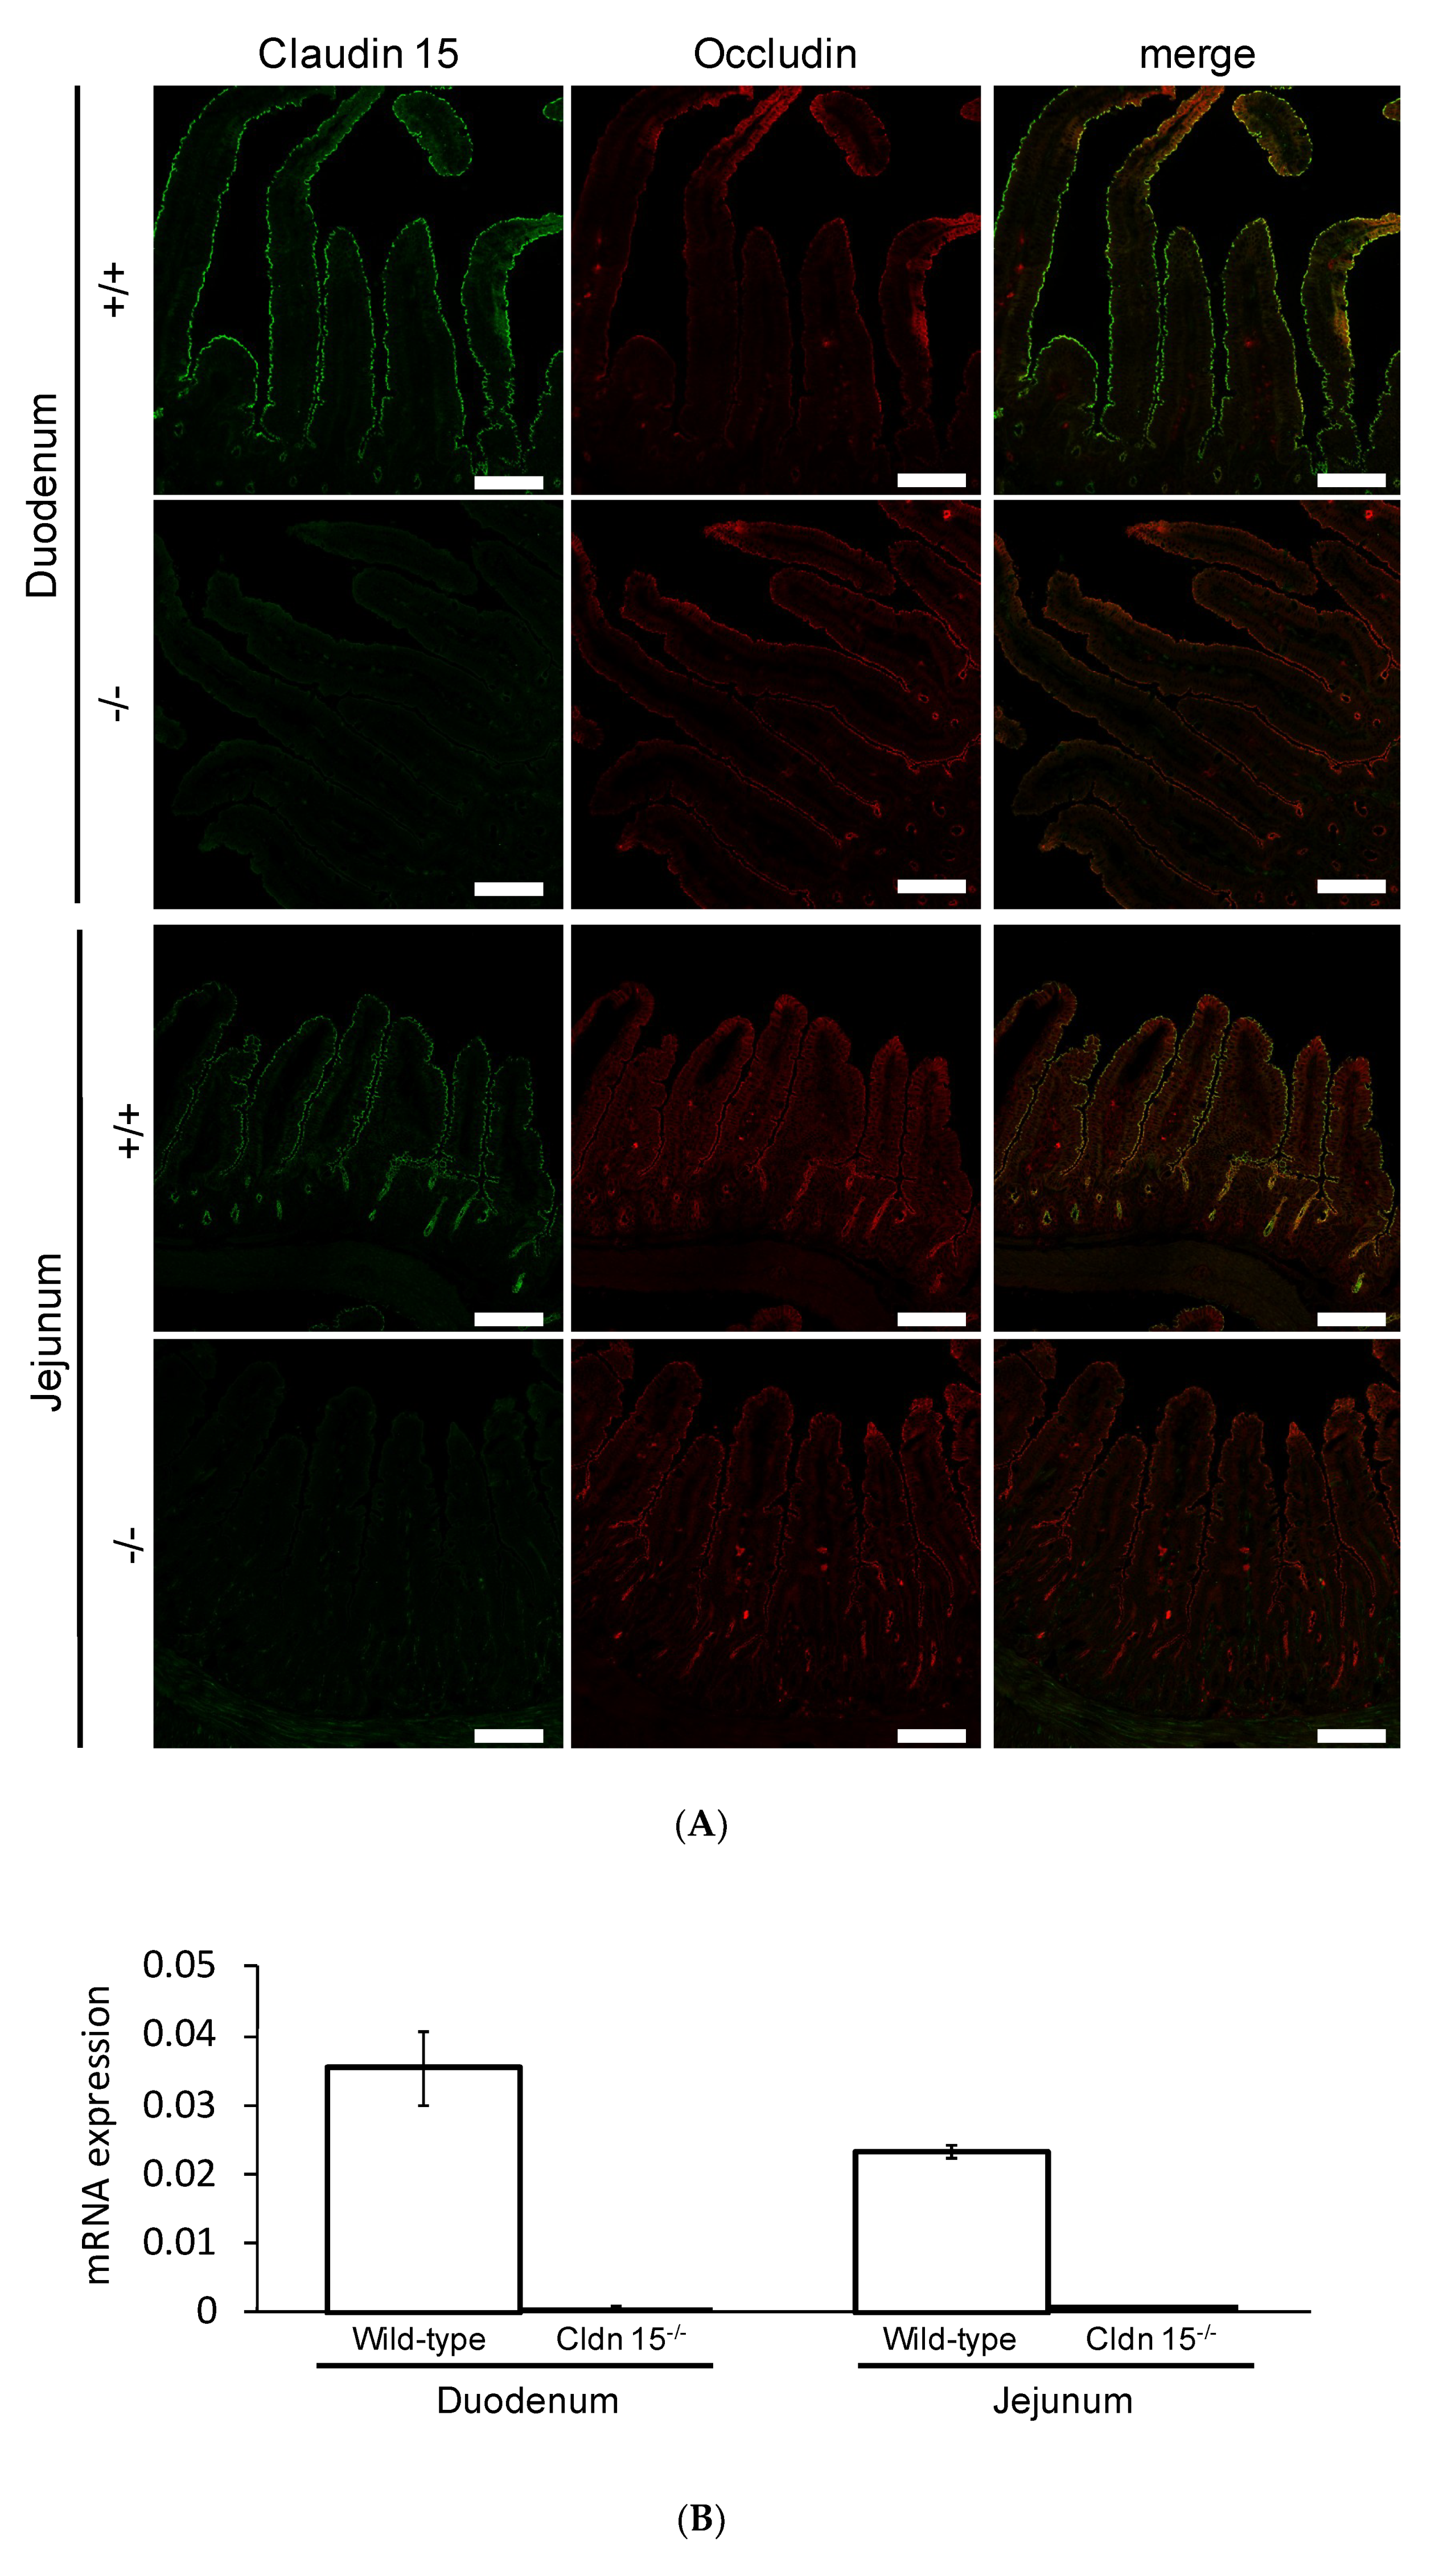
4.7. Immunofluorescence

The small intestine was excised as in the flux experiments and opened and rinsed with ice cold PBS. The tissue segment was coated with Tissue-Tek® OCT compound (Sakura Finetek, Tokyo, Japan), and embedded into a mold containing OCT compound and frozen at −80 °C. Frozen specimens were cut in 5 µm slices using a Cryostat (CM3050 S; Leica Biosystems, Nussloch, Germany) and put on coverslips. Sections were dried for 30 min, and, then, incubated in 95% ethanol on ice for 30 min. Coverslips were then bathed in acetone for one minute and rinsed 3 times in PBS. The tissue was preblocked with 5% skim milk powder in 0.1% Triton X®-100 in PBS (0.1% PBST) for 30 min. The coverslips were incubated with primary antibodies for claudin-15 or occludin (kindly gifted from Prof. M. Furuse, National Institute of Physiological Sciences, Okazaki, Japan) for 30 min. After washing in PBS, coverslips were incubated with secondary antibodies (1:1000 dilution) conjugated with Alexa Fluor 488 (Abcam, Cambridge, UK) or Alexa Fluor 546 (Invitrogen, Carlsbad, CA, USA). After washing, the coverslips were mounted onto glass slides with mounting medium (Fluoromount-G; SBA Southern Biotechnology Associates, Inc., Birmingham, AL, USA). Tissues were visualized using a laser scanning microscope (LSM700; Zeiss, Oberkochen, Germany).

4.8. Statistical and Data Analyses

Experimental values are given as the means ± SE of the indicated number of the animals. Comparisons between two groups were made with unpaired or paired Student’s t-test or the Mann–Whitney test. In all instances, p < 0.05 was considered to be statistically significant. The Km and Vmax values for the Isc response were determined by fitting the concentration response to the Michaelis–Menten equation using nonlinear regression with GraphPad Prism software (San Diego, CA, USA).

Author Contributions

Conceptualization, H.H. and A.I.; investigation, N.I., M.N., and H.H.; formal analysis, M.N., N.I., W.H., and H.H.; writing, H.H. All authors have read and agreed to the published version of the manuscript.

Funding

This work was supported by JSPS KAKENHI grant number 25282024 (to H.H. and A.I.) and 17K00860 (to H.H. and N.I.). This study was supported in part by grants from the Salt Science Research Foundation grant number 1831 (to H.H. and N.I.). W.H. is a recipient of the Otsuka Toshimi Scholarship Foundation from 2018 to 2020.

Acknowledgments

We thank Sachiko Tsukita and Atsushi Tamura for providing claudin-15 deficient mice.

Conflicts of Interest

The authors declare no conflict of interest. The funders had no role in the design of the study; in the collection, analyses, or interpretation of data; in the writing of the manuscript, or in the decision to publish the results.

Abbreviations

αMDGα-methyl-d-glucose
Gttransmural conductance
Iscshort-circuit current
Jflux
Vtetransepithelial potential difference
MSmucosal to serosal
SMserosal to mucosal
NHE3Na+/H+ exchanger-3 isoform
IBMXisobutylmethylxanthine
KmMichaelis–Menten constant
Vmaxvalue of the maximum change
ORSoral rehydration solution

References

  1. Kato, A.; Romero, M.F. Regulation of Electroneutral NaCl Absorption by the Small Intestine. Annu. Rev. Physiol. 2011, 73, 261–281. [Google Scholar] [CrossRef] [PubMed] [Green Version]
  2. Peerce, B.E.; Wright, E.M. Conformational changes in the intestinal brush border sodium-glucose cotransporter labeled with fluorescein isothiocyanate. Proc. Natl. Acad. Sci. USA 1984, 81, 2223–2226. [Google Scholar] [CrossRef] [PubMed] [Green Version]
  3. Prasad, P.D.; Wang, H.; Huang, W.; Leibach, F.H.; Ganapathy, V. Cloning of a cDNA encoding the human sodium-dependent vitamin transporter mediating the uptake of pantothenate, biotin and lipoate. J. Biol. Chem. 1998, 273, 7501–7506. [Google Scholar] [CrossRef] [PubMed] [Green Version]
  4. Yao, S.Y.M.; Muzyka, W.R.; Elliott, J.F.; Cheeseman, C.I.; Young, J.D. Poly(a)+ RNA from the mucosa of rat jejunum induces novel na+-dependent and na+-independent leucine transport activities in in oocytes of xenopus laevis. Mol. Membr. Biol. 1994, 11, 109–118. [Google Scholar] [CrossRef]
  5. Cordain, L.; Eaton, S.B.; Sebastian, A.; Mann, N.; Lindeberg, S.; Watkins, B.A.; O’Keefe, J.H.; Brand-Miller, J. Origins and evolution of the Western diet: Health implications for the 21st century. Am. J. Clin. Nutr. 2005, 81, 341–354. [Google Scholar] [CrossRef]
  6. Hediger, M.A.; Coady, M.J.; Ikeda, T.S.; Wright, E.M. Expression cloning and cDNA sequencing of the Na+/glucose co-transporter. Nature 1987, 330, 379–381. [Google Scholar] [CrossRef]
  7. Mackenzie, B.; Loo, D.D.F.; Wright, E.M. Relationships between Na+/glucose cotransporter (SGLT1) currents and fluxes. J. Membr. Biol. 1998, 162, 101–106. [Google Scholar] [CrossRef]
  8. Phillips, S.F. Diarrhea: A current view of the pathophysiology. Gastroenterology 1972, 63, 495–518. [Google Scholar] [CrossRef]
  9. Powell, D.W. Barrier function of epithelia. Am. J. Physiol. 1981, 241, G275–G288. [Google Scholar] [CrossRef]
  10. Tsukita, S.; Tanaka, H.; Tamura, A. The Claudins: From Tight Junctions to Biological Systems. Trends Biochem. Sci. 2019, 44, 141–152. [Google Scholar] [CrossRef]
  11. Rahner, C.; Mitic, L.L.; Anderson, J.M. Heterogeneity in expression and subcellular localization of claudins 2, 3, 4, and 5 in the rat liver, pancreas, and gut. Gastroenterology 2001, 120, 411–422. [Google Scholar] [CrossRef] [PubMed]
  12. Rendón-Huerta, E.; Teresa, F.; Teresa, G.M.; Xochitl, G.-S.; Georgina, A.-F.; Veronica, Z.-Z.; Montaño, L.F. Distribution and Expression Pattern of Claudins 6, 7, and 9 in Diffuse- and Intestinal-Type Gastric Adenocarcinomas. J. Gastrointest. Cancer 2010, 41, 52–59. [Google Scholar] [CrossRef] [PubMed]
  13. Tamura, A.; Kitano, Y.; Hata, M.; Katsuno, T.; Moriwaki, K.; Sasaki, H.; Hayashi, H.; Suzuki, Y.; Noda, T.; Furuse, M.; et al. Megaintestine in Claudin-15-Deficient Mice. Gastroenterology 2008, 134, 523–534. [Google Scholar] [CrossRef] [PubMed]
  14. Tamura, A.; Hayashi, H.; Imasato, M.; Yamazaki, Y.; Hagiwara, A.; Wada, M.; Noda, T.; Watanabe, M.; Suzuki, Y.; Tsukita, S. Loss of claudin-15, but not claudin-2, causes Na+ deficiency and glucose malabsorption in mouse small intestine. Gastroenterology 2011, 140, 913–923. [Google Scholar] [CrossRef] [PubMed]
  15. Halperin, M.L.; Wolman, S.L.; Greenberg, G.R. Paracellular recirculation of sodium is essential to support nutrient absorption in the gastrointestinal tract: An hypothesis. Clin. Investig. Med. 1986, 9, 209–211. [Google Scholar]
  16. Binder, H.J.; Brown, I.; Ramakrishna, B.S.; Young, G.P. Oral rehydration therapy in the second decade of the twenty-first century. Curr. Gastroenterol. Rep. 2014, 16, 376. [Google Scholar] [CrossRef] [PubMed] [Green Version]
  17. Gawenis, L.R.; Stien, X.; Shull, G.E.; Schultheis, P.J.; Woo, A.L.; Walker, N.M.; Clarke, L.L. Intestinal NaCl transport in NHE2 and NHE3 knockout mice. Am. J. Physiol. Liver Physiol. 2002, 282, G776–G784. [Google Scholar] [CrossRef]
  18. Pappenheimer, J.R.; Reiss, K.Z. Contribution of solvent drag through intercellular junctions to absorption of nutrients by the small intestine of the rat. J. Membr. Biol. 1987, 100, 123–136. [Google Scholar] [CrossRef]
  19. Lin, R.; Murtazina, R.; Cha, B.; Chakraborty, M.; Sarker, R.; Chen, T.; Lin, Z.; Hogema, B.M.; De Jonge, H.R.; Seidler, U.; et al. d-glucose acts via sodium/glucose cotransporter 1 to increase NHE3 in mouse jejunal brush border by a Na+/H+ exchange regulatory factor 2dependent process. Gastroenterology 2011, 140, 560–571. [Google Scholar] [CrossRef] [Green Version]
  20. Schwark, J.-R.; Jansen, H.W.; Lang, H.-J.; Krick, W.; Burckhardt, G.; Hropot, M. S3226, a novel inhibitor of Na+/H+ exchanger subtype 3 in various cell types. Pflugers Arch. Eur. J. Physiol. 1998, 436, 797–800. [Google Scholar] [CrossRef]
  21. Halm, D.R.; Dawson, D.C. Control of potassium transport by turtle colon: Role of membrane potential. Am. J. Physiol. 1984, 247, C26–C32. [Google Scholar] [CrossRef] [PubMed]
  22. Ishizuka, N.; Nakayama, M.; Watanabe, M.; Tajima, H.; Yamauchi, Y.; Ikari, A.; Hayashi, H. Luminal Na+ homeostasis has an important role in intestinal peptide absorption in vivo. Am. J. Physiol. 2018, 315, G799–G809. [Google Scholar] [CrossRef] [PubMed]
  23. Frizzell, R.A.; Schultz, S.G. Ionic Conductances of Extracellular Shunt Pathway in Rabbit Ileum. J. Gen. Physiol. 1972, 59, 318–346. [Google Scholar] [CrossRef] [PubMed] [Green Version]
  24. Field, M. Intestinal ion transport and the pathophysiology of diarrhea Find the latest version: Intestinal ion transport and the pathophysiology of diarrhea. J. Clin. Investig. 2003, 111, 931–943. [Google Scholar] [CrossRef] [Green Version]
  25. Powell, D.W. Intestinal conductance and permselectivity changes with theophylline and choleragen. Am. J. Physiol. 1974, 227, 1436–1443. [Google Scholar] [CrossRef] [Green Version]
  26. Gawenis, L.R.; Boyle, K.T.; Palmer, B.A.; Walker, N.M.; Clarke, L.L. Lateral intercellular space volume as a determinant of CFTR-mediated anion secretion across small intestinal mucosa. Am. J. Physiol. Liver Physiol. 2004, 286, G1015–G1023. [Google Scholar] [CrossRef]
  27. Smith, D.E.; Clémençon, B.; Hediger, M.A. Proton-coupled oligopeptide transporter family SLC15: Physiological, pharmacological and pathological implications. Mol. Aspects Med. 2013, 34, 323–336. [Google Scholar] [CrossRef] [Green Version]
  28. Ishizuka, N.; Hempstock, W.; Hayashi, H. The Mode of Action of NHE3 Inhibitors in Intestinal Na + Absorption. Gastroenterol. Med. Res. 2019, 4, 297–299. [Google Scholar]
  29. Uchida, R.; Iwamoto, K.; Nagayama, S.; Miyajima, A.; Okamoto, H.; Ikuta, N.; Fukumi, H.; Terao, K.; Hirota, T. Effect of γ-cyclodextrin inclusion complex on the absorption of R-α-lipoic acid in rats. Int. J. Mol. Sci. 2015, 16, 10105–10120. [Google Scholar] [CrossRef] [Green Version]
  30. Gorboulev, V.; Schürmann, A.; Vallon, V.; Kipp, H.; Jaschke, A.; Klessen, D.; Friedrich, A.; Scherneck, S.; Rieg, T.; Cunard, R.; et al. Na+-d-glucose cotransporter SGLT1 is pivotal for intestinal glucose absorption and glucose-dependent incretin secretion. Diabetes 2012, 61, 187–196. [Google Scholar] [CrossRef] [Green Version]
  31. Yu, A.S.L.; Cheng, M.H.; Angelow, S.; Günzel, D.; Kanzawa, S.A.; Schneeberger, E.E.; Fromm, M.; Coalson, R.D. Molecular Basis for Cation Selectivity in Claudin-2–based Paracellular Pores: Identification of an Electrostatic Interaction Site. J. Gen. Physiol. 2009, 133, 111–127. [Google Scholar] [CrossRef] [PubMed] [Green Version]
  32. Wada, M.; Tamura, A.; Takahashi, N.; Tsukita, S. Loss of claudins 2 and 15 from mice causes defects in paracellular Na+ flow and nutrient transport in gut and leads to death from malnutrition. Gastroenterology 2013, 144, 369–380. [Google Scholar] [CrossRef] [PubMed]
  33. Schultheis, P.J.; Meneton, P.; Riddle, T.M.; Duffy, J.J.; Doetschman, T.; Shull, G.E.; Miller, M.L.; Soleimani, M.; Lorenz, J.N.; Wang, T.; et al. Renal and intestinal absorptive defects in mice lacking the NHE3 Na+/H+ exchanger. Nat. Genet. 1998, 19, 282–285. [Google Scholar] [CrossRef] [PubMed]
  34. Schweinfest, C.W.; Spyropoulos, D.D.; Henderson, K.W.; Kim, J.H.; Chapman, J.M.; Barone, S.; Worrell, R.T.; Wang, Z.; Soleimani, M. slc26a3 (dra)-deficient mice display chloride-losing diarrhea, enhanced colonic proliferation, and distinct up-regulation of ion transporters in the colon. J. Biol. Chem. 2006, 281, 37962–37971. [Google Scholar] [CrossRef] [Green Version]
  35. Duffey, M.E.; Hainau, B.; Ho, S.; Bentzel, C.J. Regulation of epithelial tight junction permeability by cyclic AMP. Nature 1981, 294, 451–453. [Google Scholar] [CrossRef]
  36. Field, M.; Fromm, D.; al-Awqati, Q.; Greenough, W.B. Effect of cholera enterotoxin on Ion transport across isolated ileal mucosa. J. Clin. Investig. 1972, 51, 796–804. [Google Scholar] [CrossRef] [Green Version]
  37. Duggan, C.; Fontaine, O.; Pierce, N.F.; Glass, R.I.; Mahalanabis, D.; Alam, N.H.; Bhan, M.K.; Santosham, M. Scientific Rationale for a Change in the Composition of Oral Rehydration Solution. JAMA 2004, 291, 2628–2631. [Google Scholar] [CrossRef]
  38. Singh, A.K.; Amlal, H.; Haas, P.J.; Dringenberg, U.; Fussell, S.; Barone, S.L.; Engelhardt, R.; Zuo, J.; Seidler, U.; Soleimani, M. Fructose-induced hypertension: Essential role of chloride and fructose absorbing transporters PAT1 and Glut5. Kidney Int. 2008, 74, 438–447. [Google Scholar] [CrossRef] [Green Version]
  39. Fayad, I.M.; Kamel, M.; Hirschhorn, N.; Abu-Zikry, M. Hypernatraemia surveillance during a national diarrhoeal diseases control project in Egypt. Lancet 1992, 339, 389–393. [Google Scholar] [CrossRef]
Figure 1. Activation of SGLT1 increases unidirectional mucosal to serosal 22Na+ fluxes under short-circuit conditions in wild-type mice: Glucose-induced short-circuit current changes (Isc) (A) and 22Na+ unidirectional flux changes (JNa) (B) were measured simultaneously in Ussing chambers, as described in the Materials and Methods. After measure basal Isc and JNa during the initial 30 min (squares represent mean of 9 and 8 measurements mucosal to serosal (M to S) and serosal to mucosal (S to M), respectively), glucose was added to the mucosal side, indicated by arrows (n = 9 and 8, M to S and S to M, respectively). The effects of S3226 on glucose-induced Isc (C), and JNa (D). Thirty minutes before initiation of measurement, 10 µM S3226 was added to the mucosal side (n = 5 and 5, M to S and S to M, respectively). Non-metabolizable sugar alpha methyl-d-glucose (αMDG) increase of Isc (E) and JNa (F) (n = 6 and 6, M to S and S to M, respectively). Closed squares indicate mucosal to serosal unidirectional 22Na+ fluxes (JNaMS) and open squares indicate mucosal to serosal 22Na+ fluxes (JNaSM). Each point represents the mean ± SE. Where error bars are absent, they are smaller than the symbol used. * p < 0.05 as compared with the baseline control.
Ijms 21 00376 g001
Figure 2. The relationship between changes of glucose-induced IscIsc) and changes of glucose-induced net 22Na+ fluxes (ΔJNa Net) in wild-type mice: Glucose-induced ΔIsc and net Na+ flux (JNaNet) were calculated from the data of Figure 1 (short-circuit conditions) and Figure 3 (open-circuit conditions) and replotted. ΔIsc was determined by subtracting baseline values from those obtained after addition of glucose. Mean values for the last two periods after addition of glucose are taken as the change in Isc and JNa. Net Na+ flux (JNaNet) was calculated using adjacent tissues by subtraction (JNaMSJNaSM = JNaNet). The lines were fitted by least-squares analysis. r2 = 0.623 and 0.006 for the short-circuit (closed circles) and open-circuit (open circles) conditions, respectively.
Ijms 21 00376 g002
Figure 3. Open-circuit conditions attenuate glucose-induced JNaMS in wild-type mice: Glucose-induced equivalent short-circuit current changes (A) and 22Na+ unidirectional flux changes (JNa) (B) were measured simultaneously under open-circuit conditions. Equivalent short-circuit current was determined from transepithelial potential differences and transepithelial conductance by applying Ohm’s law as described in the Materials and Methods. Where indicated by the arrows, glucose was added to the mucosal side. Each point represents means ± SE (n = 5 and 5, M to S and S to M, respectively). Where error bars are absent, they are smaller than the symbol used. * p < 0.05 as compared with the control.
Ijms 21 00376 g003
Figure 4. Representative confocal images of double immunofluorescence staining of claudin-15 (green) and occluding (red) (A) (n = 3) and quantitative RT-PCR (B) (n = 3) in wild-type and cldn15−/− mice. Bar, 100 µm. Activation of SGLT1 increases glucose-induced JNaMS under short-circuit conditions in cldn15−/− mice: Representative Isc trace of glucose-induced Isc changes in cldn15−/− and wild-type mice (C), where, indicated by the arrows, glucose was added to the mucosal side, the final concentration of glucose is shown in mM; and the concentration dependence of the glucose-induced Isc (D). The curve was fit to the Michaelis–Menten equation (n = 3 and 6, wild-type, and cldn15−/− mice, respectively). Where error bars are absent, they are smaller than the symbol used. The 10 mM glucose-induced short-circuit current changes (Isc) (E) and 22Na+ unidirectional flux changes (JNa) (F) were measured simultaneously the same as Figure 1 (n = 7 and 7, M to S and S to M, respectively). Where indicated by the arrows, glucose was added to the mucosal side. The effect of S3226 on glucose-induced ΔIsc (G) and ΔJNa (H) (n = 5 and 5, M to S and S to M, respectively). Where indicated by the arrows, glucose was added to the mucosal side. Each point represents the mean ± SE. Where error bars are absent, they are smaller than the symbol used. * p < 0.05 as compared with the baseline control.
Ijms 21 00376 g004aIjms 21 00376 g004b
Figure 5. The relationship between changes of glucose-induced Isc and changes of glucose-induced net 22Na+ fluxes in cldn15−/− mice: Glucose-induced ΔIsc and JNaNet were calculated from the data of Figure 4 and Figure 6 and replotted the same as in Figure 2. The lines were fitted by least-squares analysis. r2 = 0.67 and 0.0012 for the short-circuit and open-circuit conditions, respectively.
Ijms 21 00376 g005
Figure 6. Robust glucose-induced JNaMS are observed in cldn15−/− mice under open-circuit conditions: Glucose-induced equivalent Isc (A) and ΔJNa (B) were measured simultaneously under open-circuit conditions. Where indicated by the arrows, glucose was added to the mucosal side. Equivalent Isc was determined the same as in Figure 3. Closed squares indicate JNaMS and open squares indicate JNaSM (n = 7 and 6, M to S and S to M, respectively). Each point represents the mean ± SE. Where error bars are absent, they are smaller than the symbol used. * p < 0.05 as compared with the baseline control.
Ijms 21 00376 g006
Figure 7. The effect of changing the transepithelial potential on JNaSM: JNaSM was measured at Vte = 0 and ± 10 mV. JNaSM was plotted as a function of (FΔVte/RT)/{exp(FΔVte/RT)−1}, where F is the Faraday constant, R is the molar gas constant, and T is the temperature. Lines are fitted with least-squares method. Wild-type (open circles, n = 6) and cldn15−/− mice (closed circles, n = 4).
Ijms 21 00376 g007
Figure 8. Robust glucose-induced JNaMS is observed in cholera toxin-diarrhea model mice under open-circuit conditions: Glucose-induced Vte (A), equivalent Isc (B), and ΔJNa (D) were measured simultaneously under open-circuit conditions. Equivalent Isc was determined the same as in Figure 3. Gt (C) was determined from transepithelial potential difference (Vte) and current pulse by applying Ohm’s law. Open squares indicate control conditions (without cholera toxin) and closed squares indicate cholera toxin treated conditions (n = 3 and 5, control and cholera toxin treated mice, respectively). Where indicated by the arrows, glucose was added to the mucosal side. Each point represents the mean ± SE. Where error bars are absent, they are smaller than the symbol used. * p < 0.05 as compared with the baseline control.
Ijms 21 00376 g008
Figure 9. Schematic illustration of Na+ recycling mechanisms in the murine small intestine: Under normal physiological conditions (A), Na+, which is absorbed with glucose, is recycled back into the lumen. However, under pathological conditions (B), the Na+ that is absorbed with glucose can be partially transported to systemic circulation. Dashed lines indicate the Na+ recirculation and the thickness of lines indicate the amount of Na+. T-bars indicate inhibition. For more detail, see Discussion.
Ijms 21 00376 g009
Table 1. Basal 22Na+ flux and electrical parameters in wild-type mice.
JNa, µmol/cm2/hIsc, µmol/cm2/hGt, mS/cm2n
M→SS→MNet
Short-Circuit Conditions
Control51.4 ± 2.324.6 ± 1.726.9 ± 1.52.4 ± 0.558.7±2.24
S322638.9 ± 3.4 *28.3 ± 1.910.6 ± 3.9 *1.7 ± 0.254.6±2.86
Open-Circuit Conditions
Control44.2 ± 2.6 N.S.22.8 ± 1.6 N.S.21.4 ± 3.7 N.S.1.8 ± 0.3 N.S.55.2±2.4 N.S.3
10 µM S3336 was added to the mucosal side. Each value represents the mean ± SE. * p < 0.05 as compared with control. N.S. not significant as compared with short-circuit conditions by Mann–Whitney test. M→S indicates the unidirectional mucosal to serosal Na+ flux. S→M indicates the unidirectional serosal to mucosal Na+ flux. n: Number of animals examined.
Table 2. Basal 22Na+ flux and electrical parameters in cldn15−/− mice.
JNa, µmol/cm2/hIsc, µmol/cm2/hGt, mS/cm2n
M→SS→MNet
Short-Circuit Conditions
Control31.9 ± 1.9 10.4 ± 0.8 21.4 ± 2.43.3 ± 0.4 17.7 ± 0.7 6
S322622.3 ± 1.5 *5.8 ± 0.5 *16.4 ± 1.03.9 ± 0.113.6 ± 1.0 *4
Open-Circuit Conditions
Control35.6 ± 2.4 N.S.12.0 ± 0.9 N.S.23.7 ± 2.44.0 ± 0.619.4 ± 1.46
10 µM S3226 was added to the mucosal side. Each value represents the mean ± SE. * p < 0.05 as compared with the control. N.S. not significant as compared with short-circuit conditions. p < 0.05 as compared with the same conditions in wild-type mice as shown in Table 1. M→S indicates the unidirectional mucosal to serosal Na+ flux. S→M indicates the unidirectional serosal to mucosal Na+ flux. n: Number of animals examined.
Table 3. Basal 22Na+ flux and electrical parameters in cholera toxin-diarrhea model.
JNa, µmol/cm2/hIsc, µmol/cm2/hGt, mS/cm2n
M→SS→MNet
Open-Circuit Conditions
Control29.2 ± 2.118.4 ± 3.610.8 ± 2.8−1.0 ± 0.261.6 ± 9.33
Cholera16.9 ± 1.4*17.3 ± 1.4−0.3 ± 1.0 *3.9± 0.3 *39.6 ± 1.1 *5
Mice were gavaged without (control) or with 10 µg cholera toxin in 150 mM NaCl solution. Five hours after administration, the upper small intestine was excised and used for the Ussing chamber experiments. Each value represents the mean ± SE. * p < 0.05 as compared with the control by the Mann–Whitney test. M→S indicates the unidirectional mucosal to serosal Na+ flux. S→M indicates the unidirectional serosal to mucosal Na+ flux. n: Number of animals examined.

