Anisotropic Platinum Nanoparticle-Induced Cytotoxicity, Apoptosis, Inflammatory Response, and Transcriptomic and Molecular Pathways in Human Acute Monocytic Leukemia Cells

 , , , and
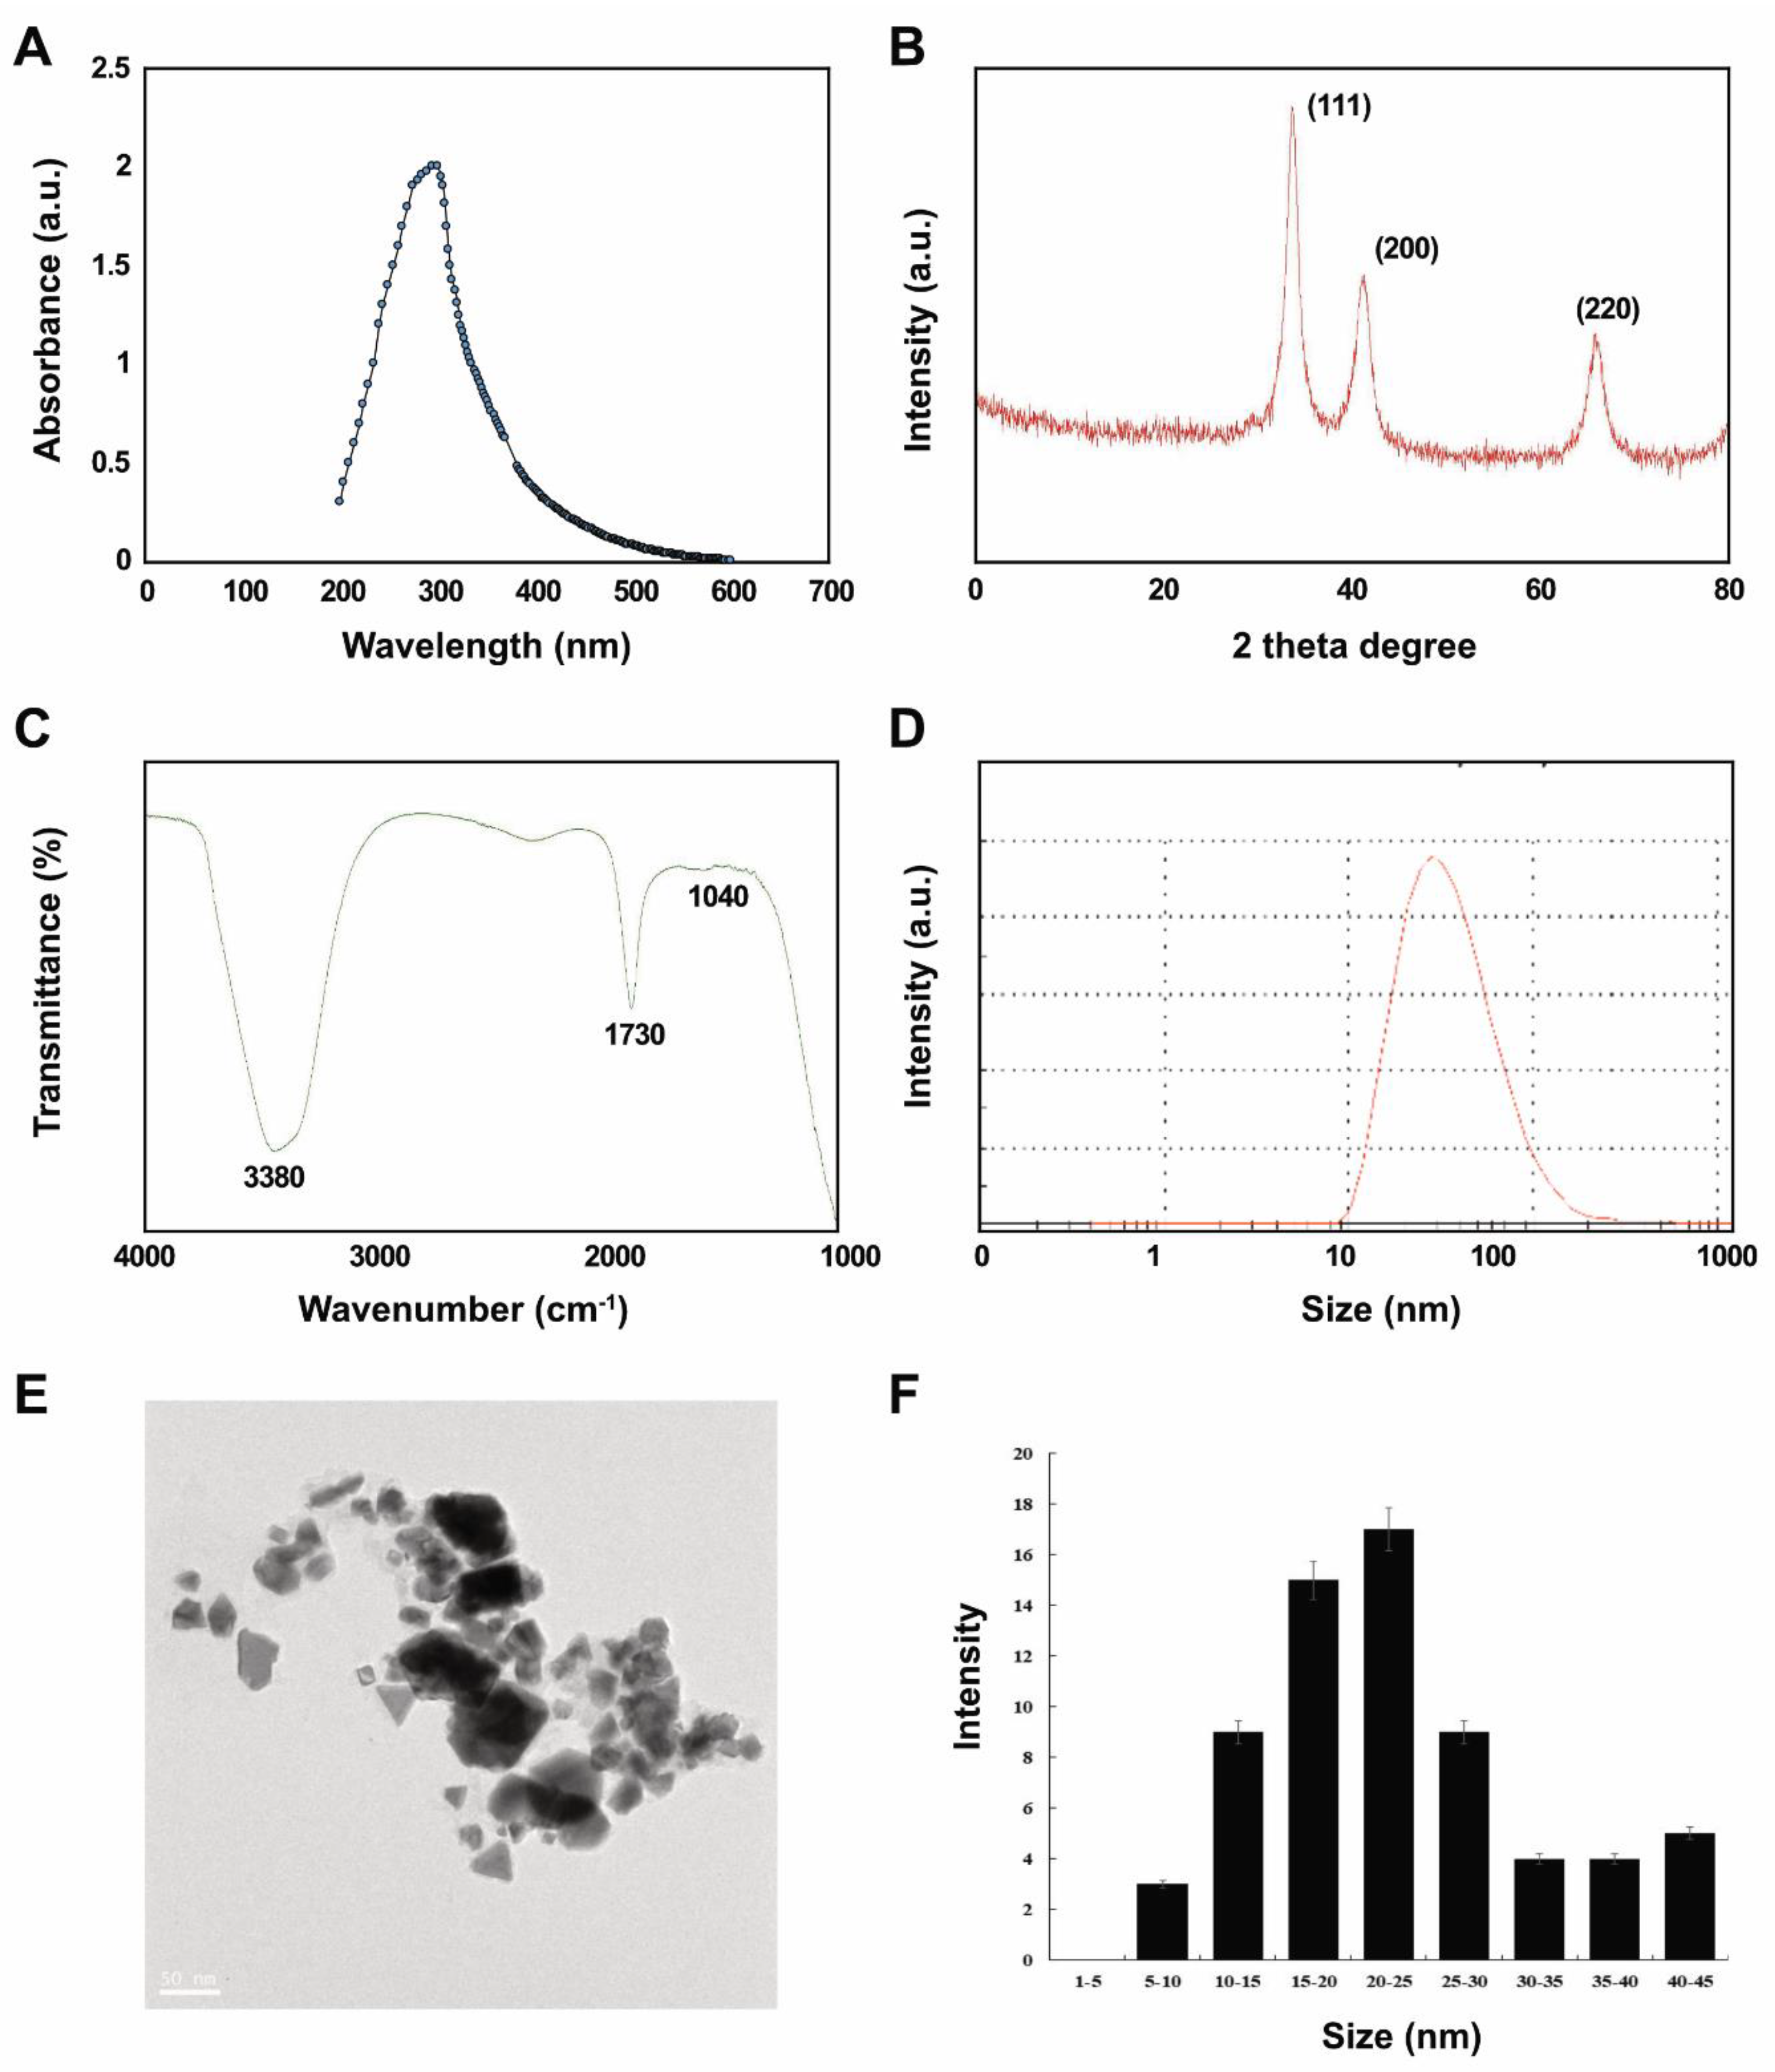
Abstract
:1. Introduction
2. Results and Discussion
2.1. Synthesis and Characterization of PtNPs Using Lycopene
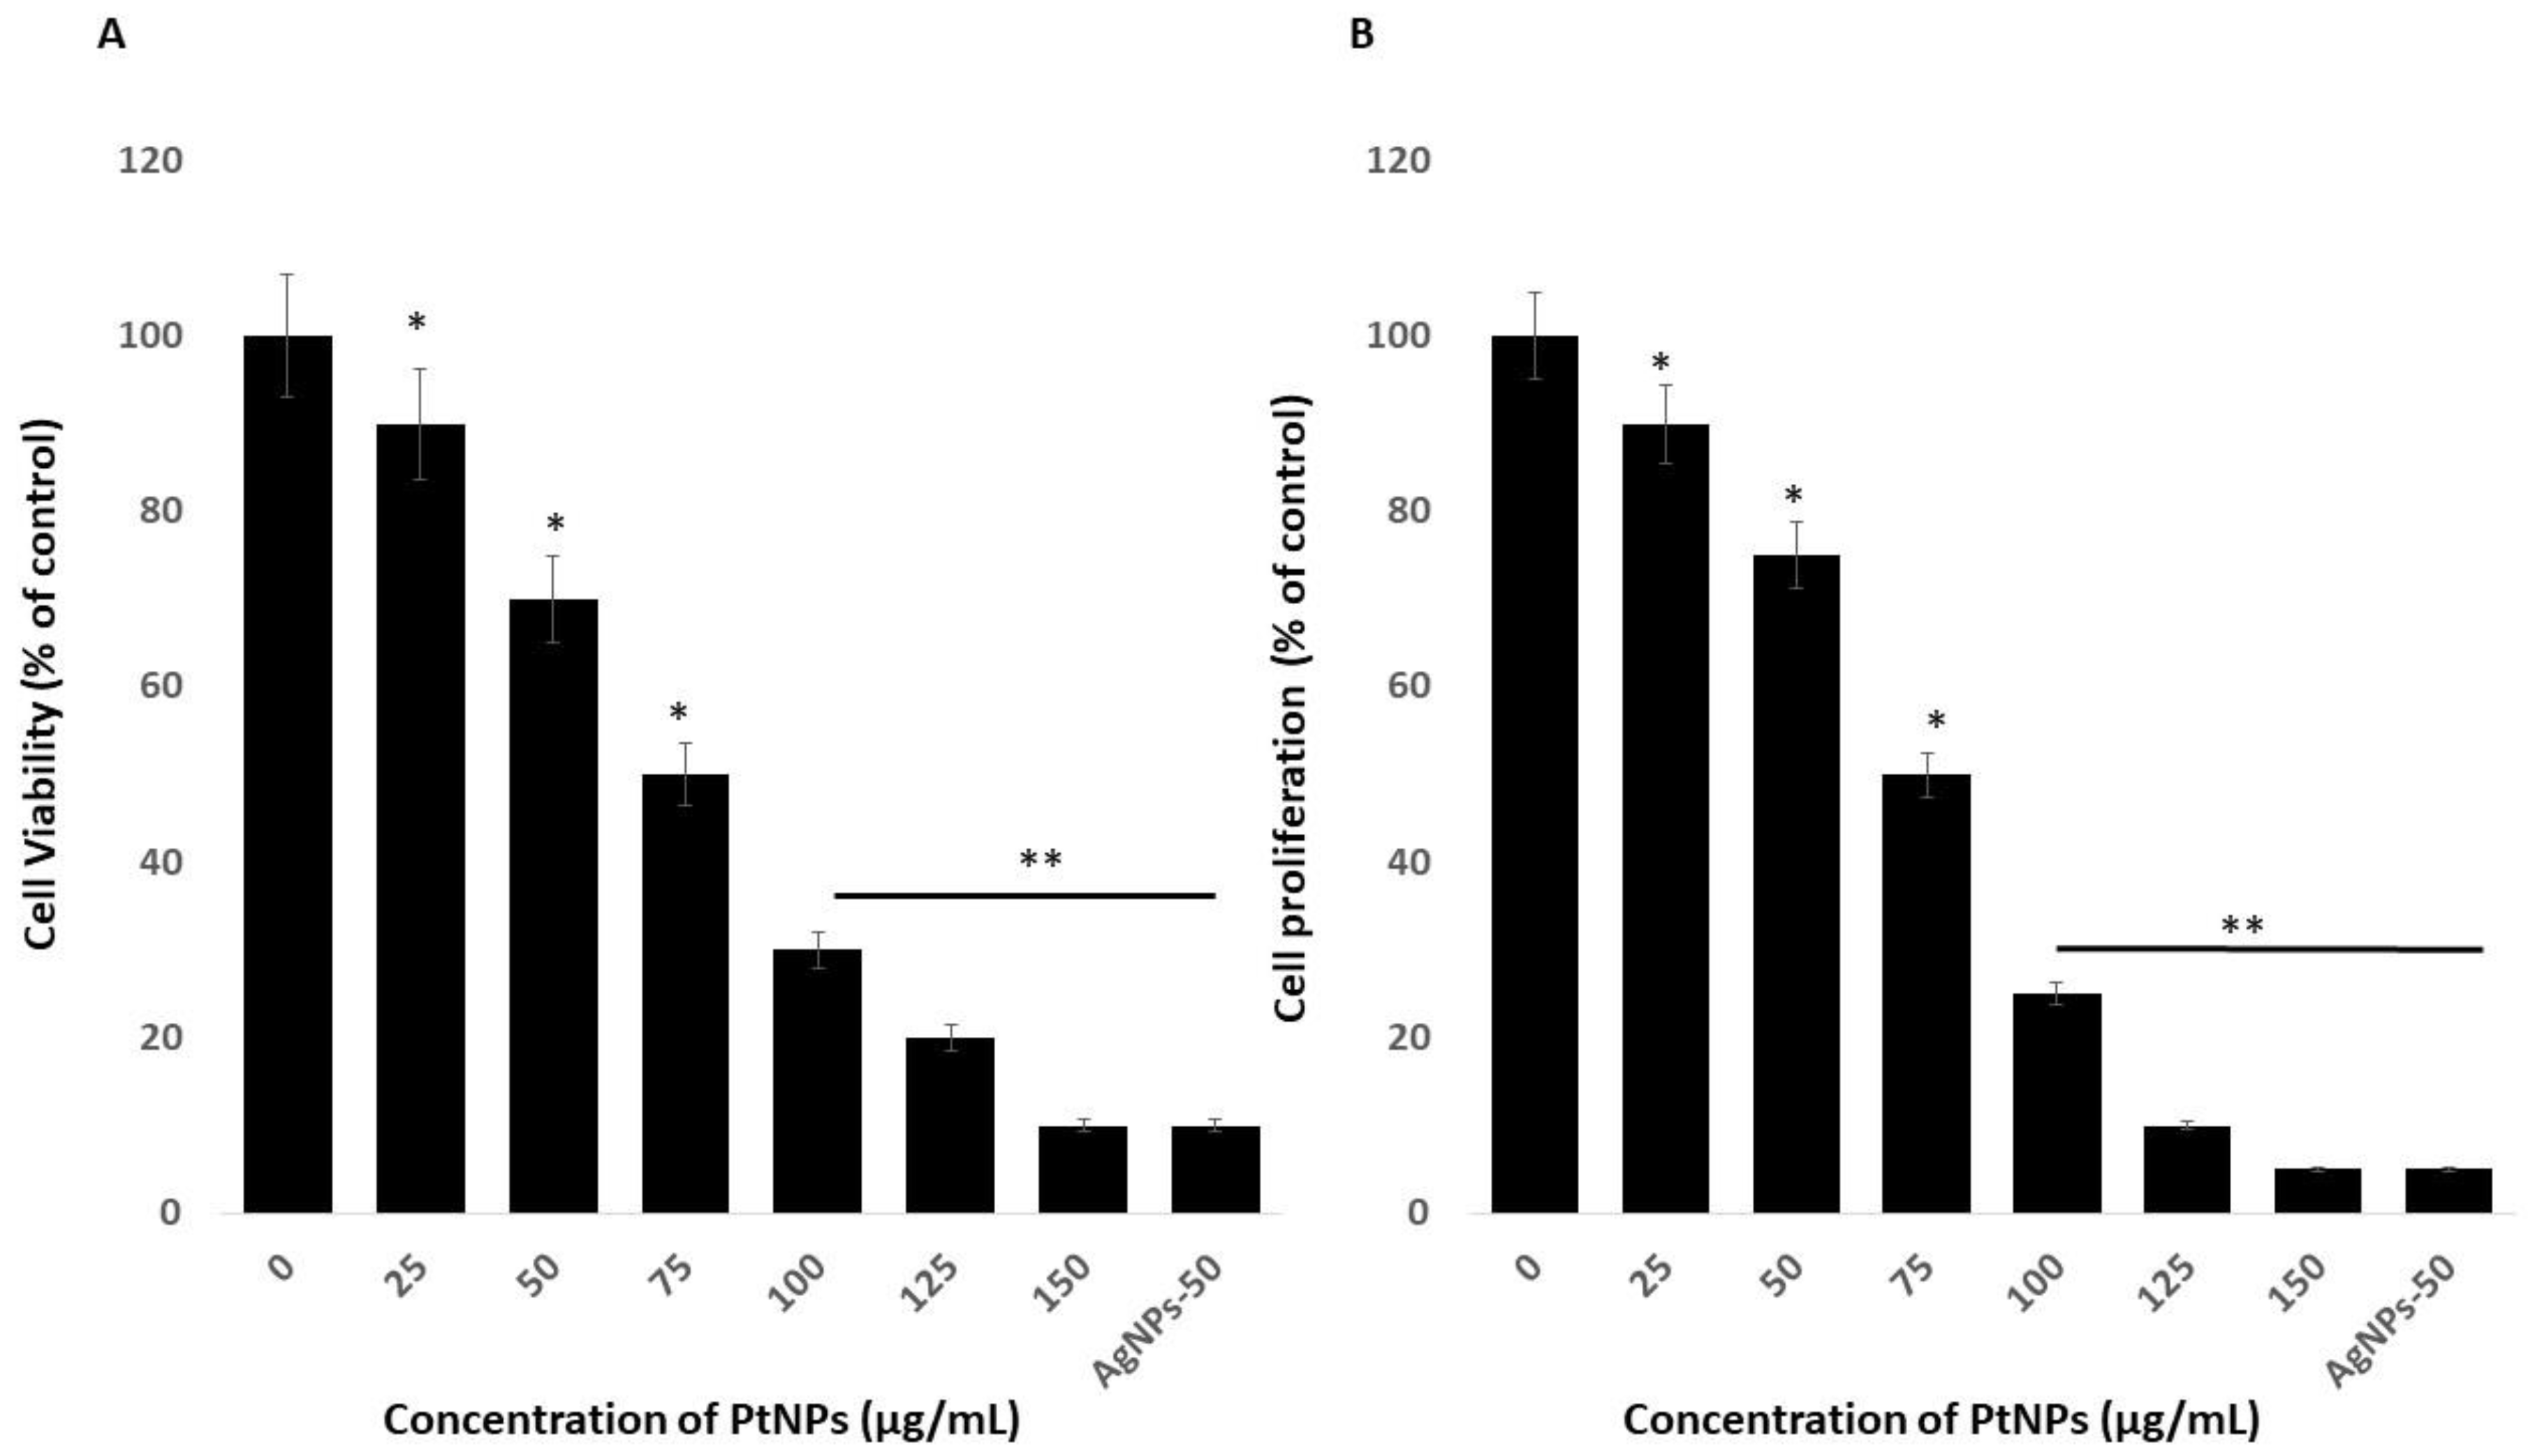
2.2. Effects of PtNPs on Cell Viability and Proliferation of THP-1 Cells
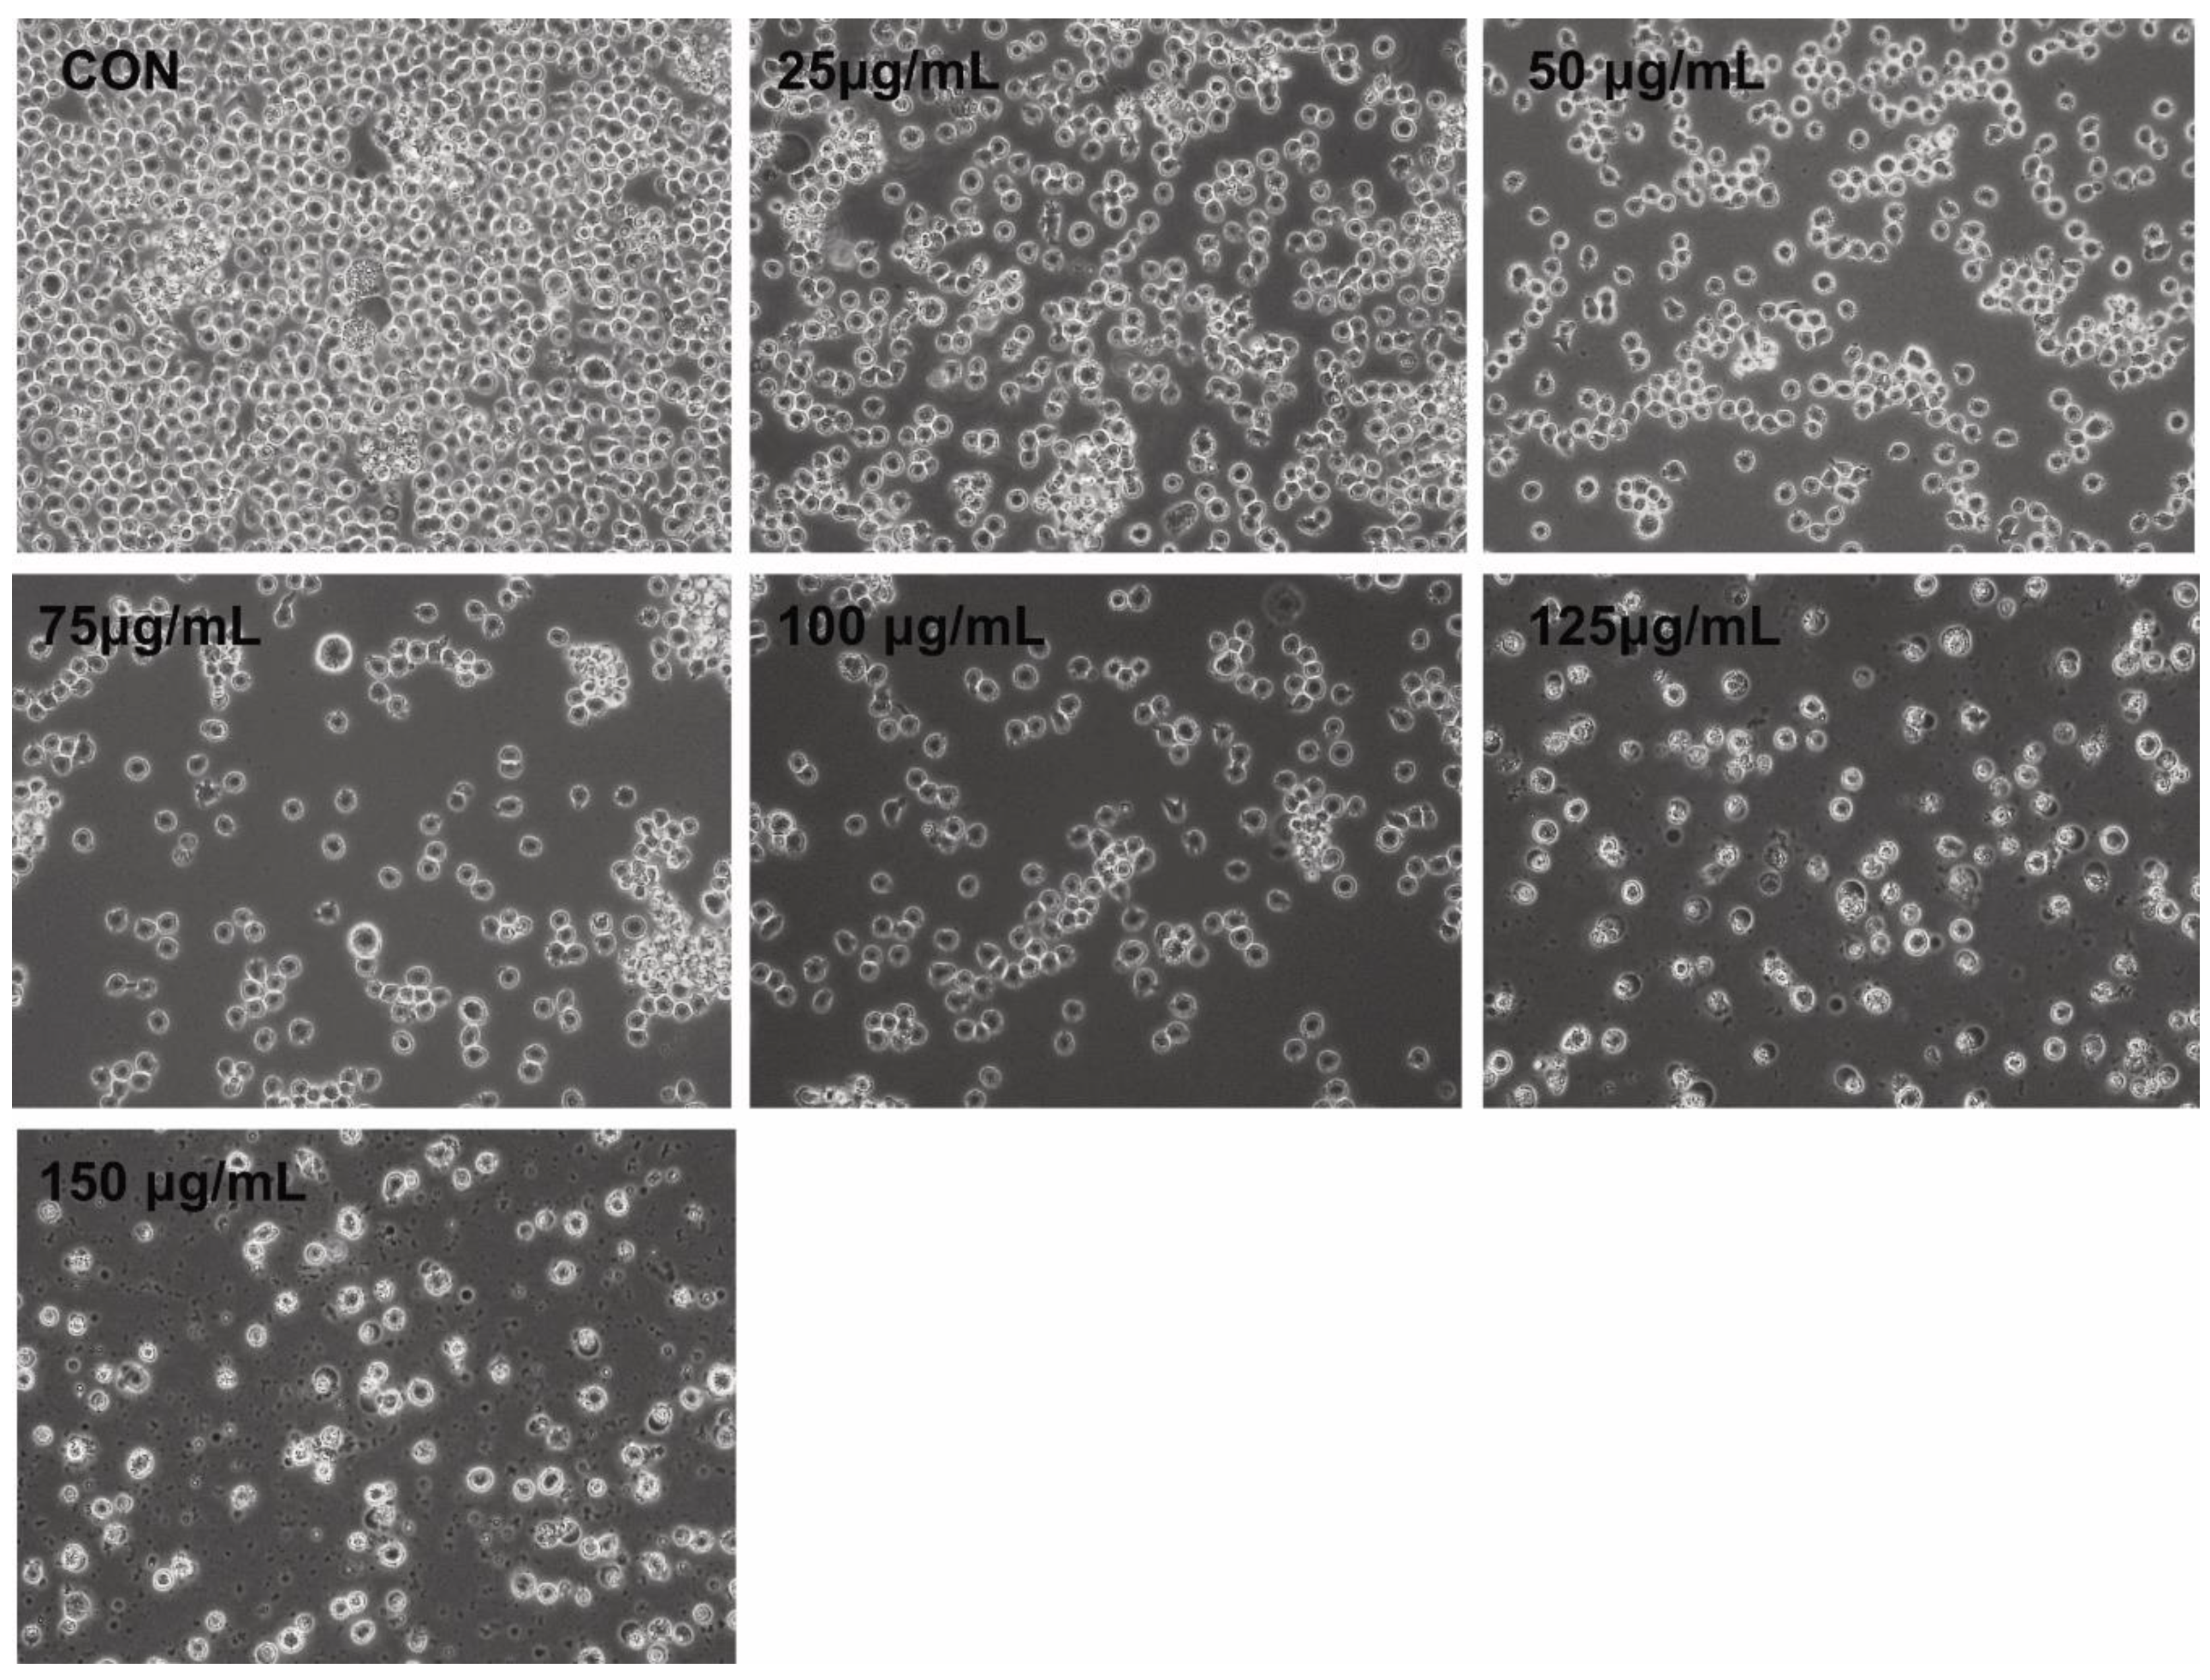
2.3. Morphology of THP-1 Cells in the Presence of PtNPs
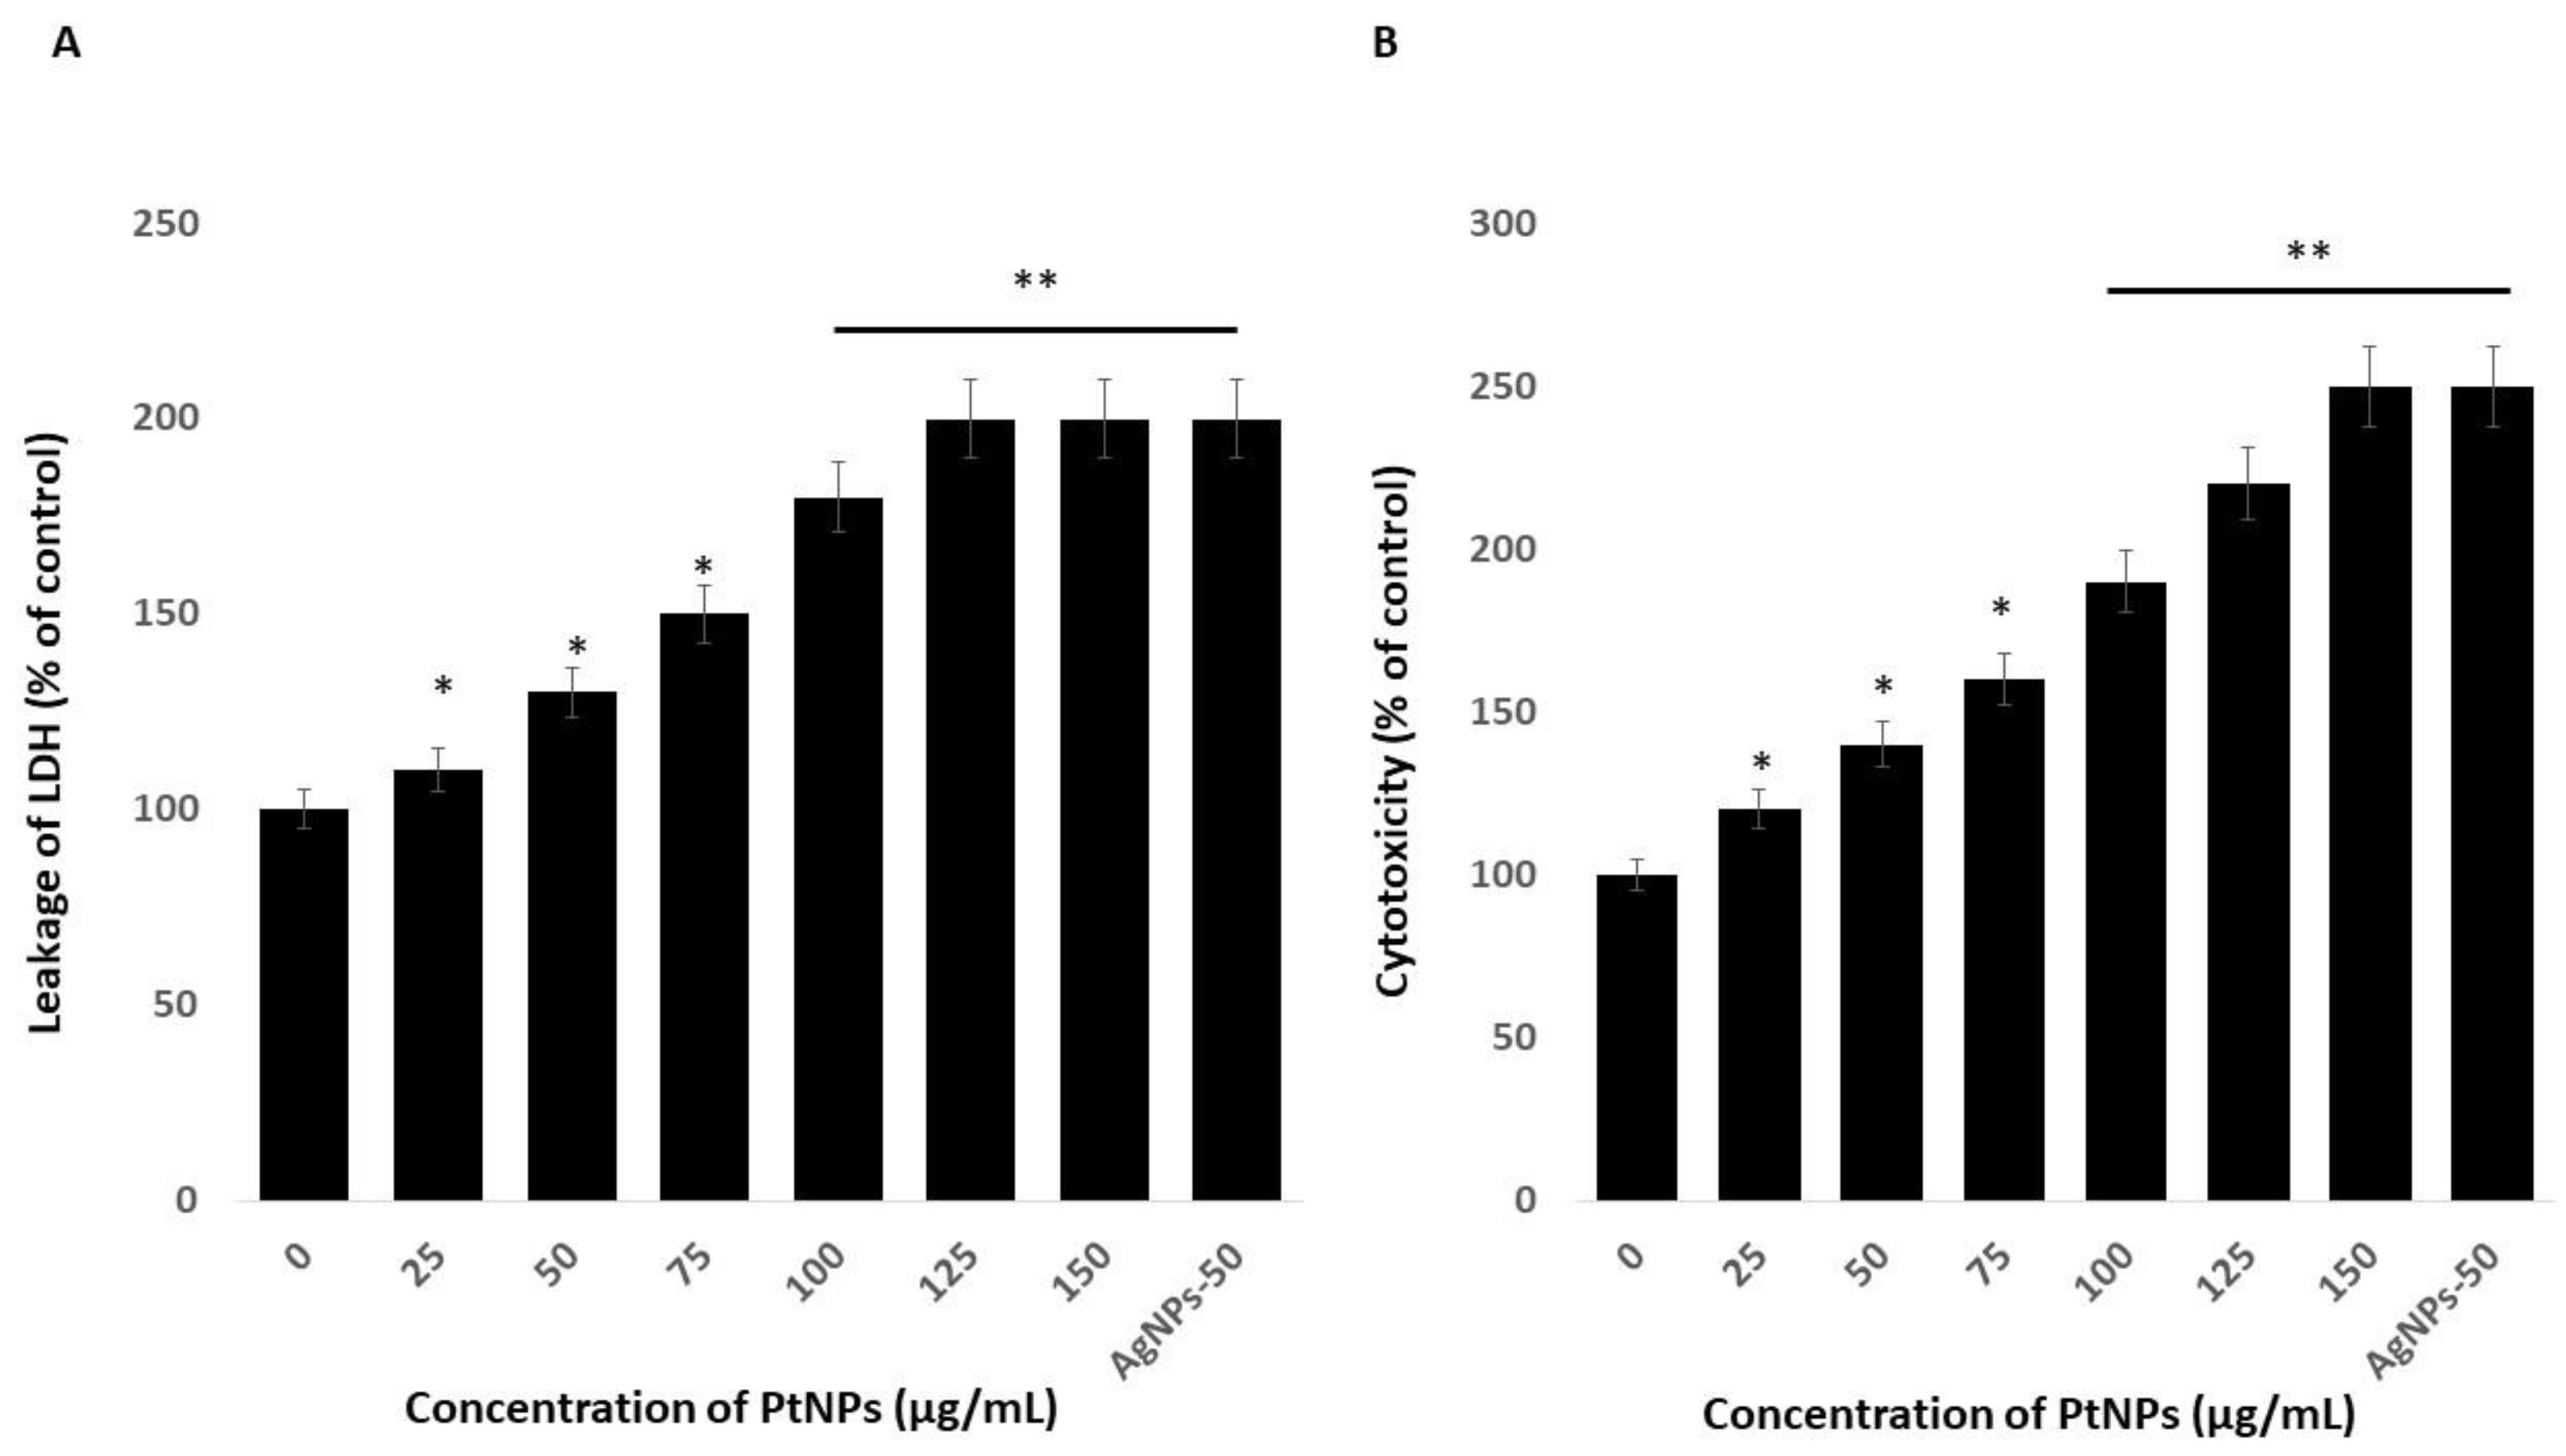
2.4. PtNPs Induce Cytotoxicity in THP-1 Cells
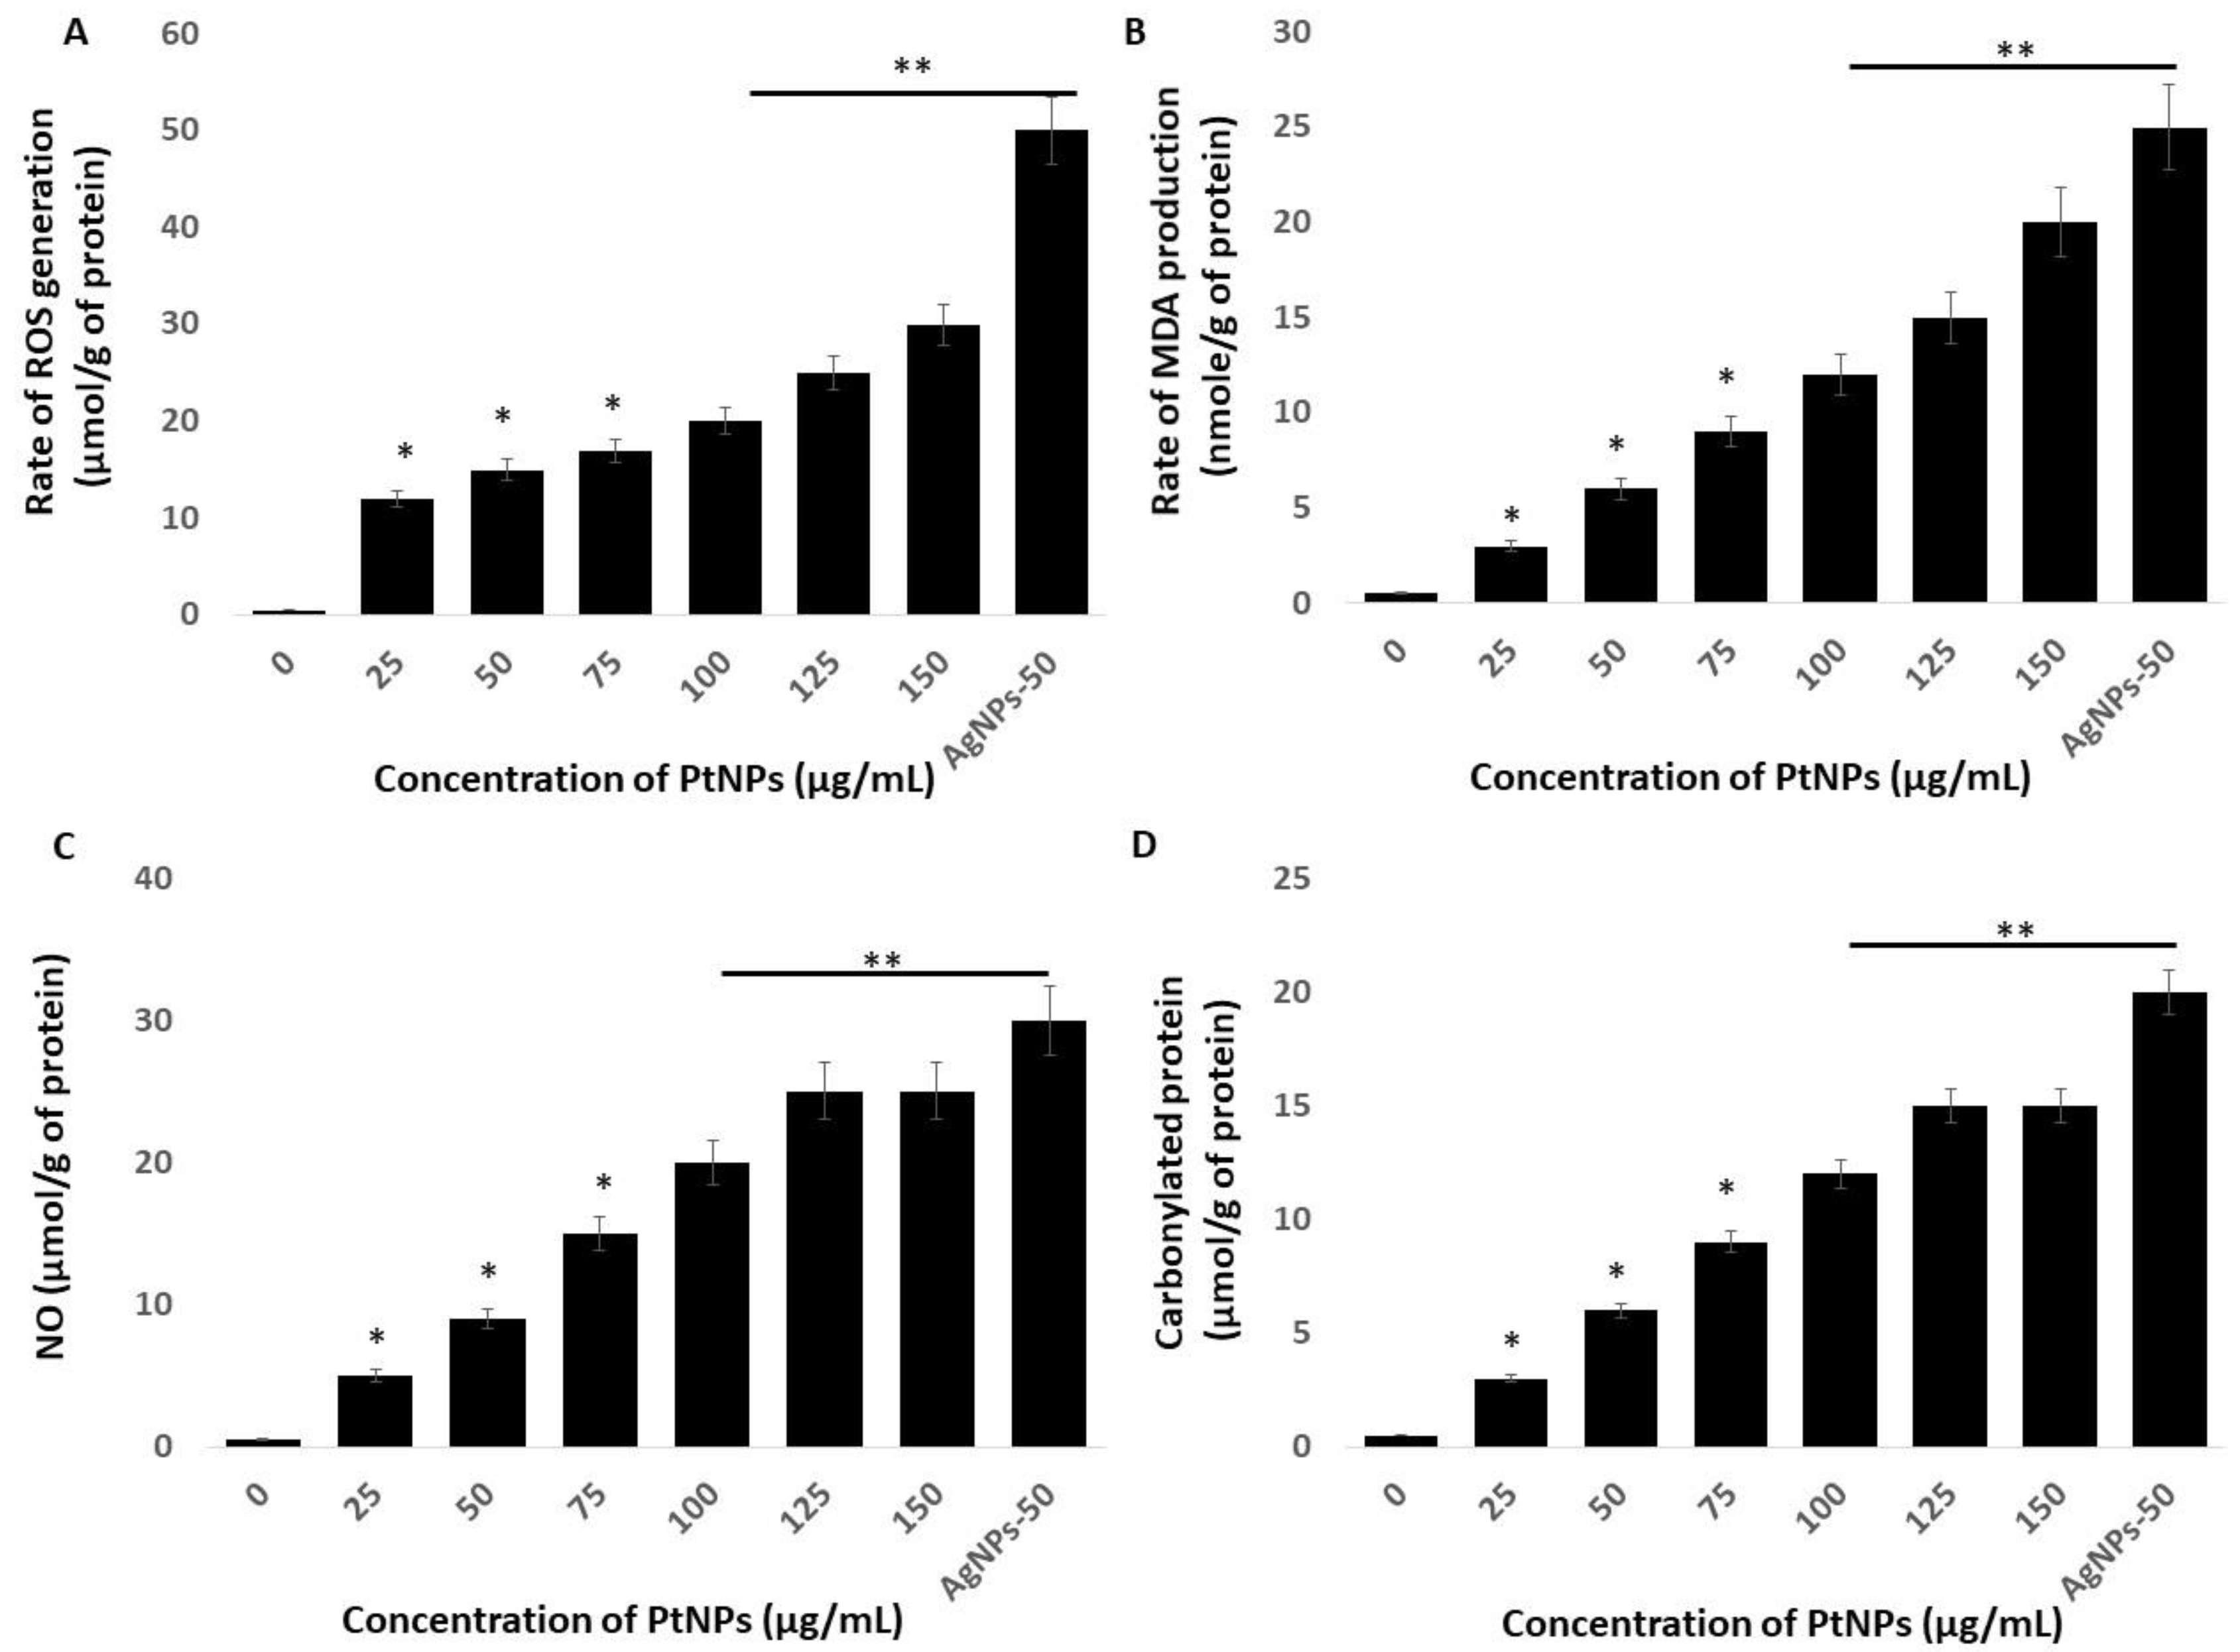
2.5. Platinum-Based NPs Induce ROS, Lipid peroxidation (LPO), Nitric Oxide (NO), and Protein Carbonylation in THP-1 Cells
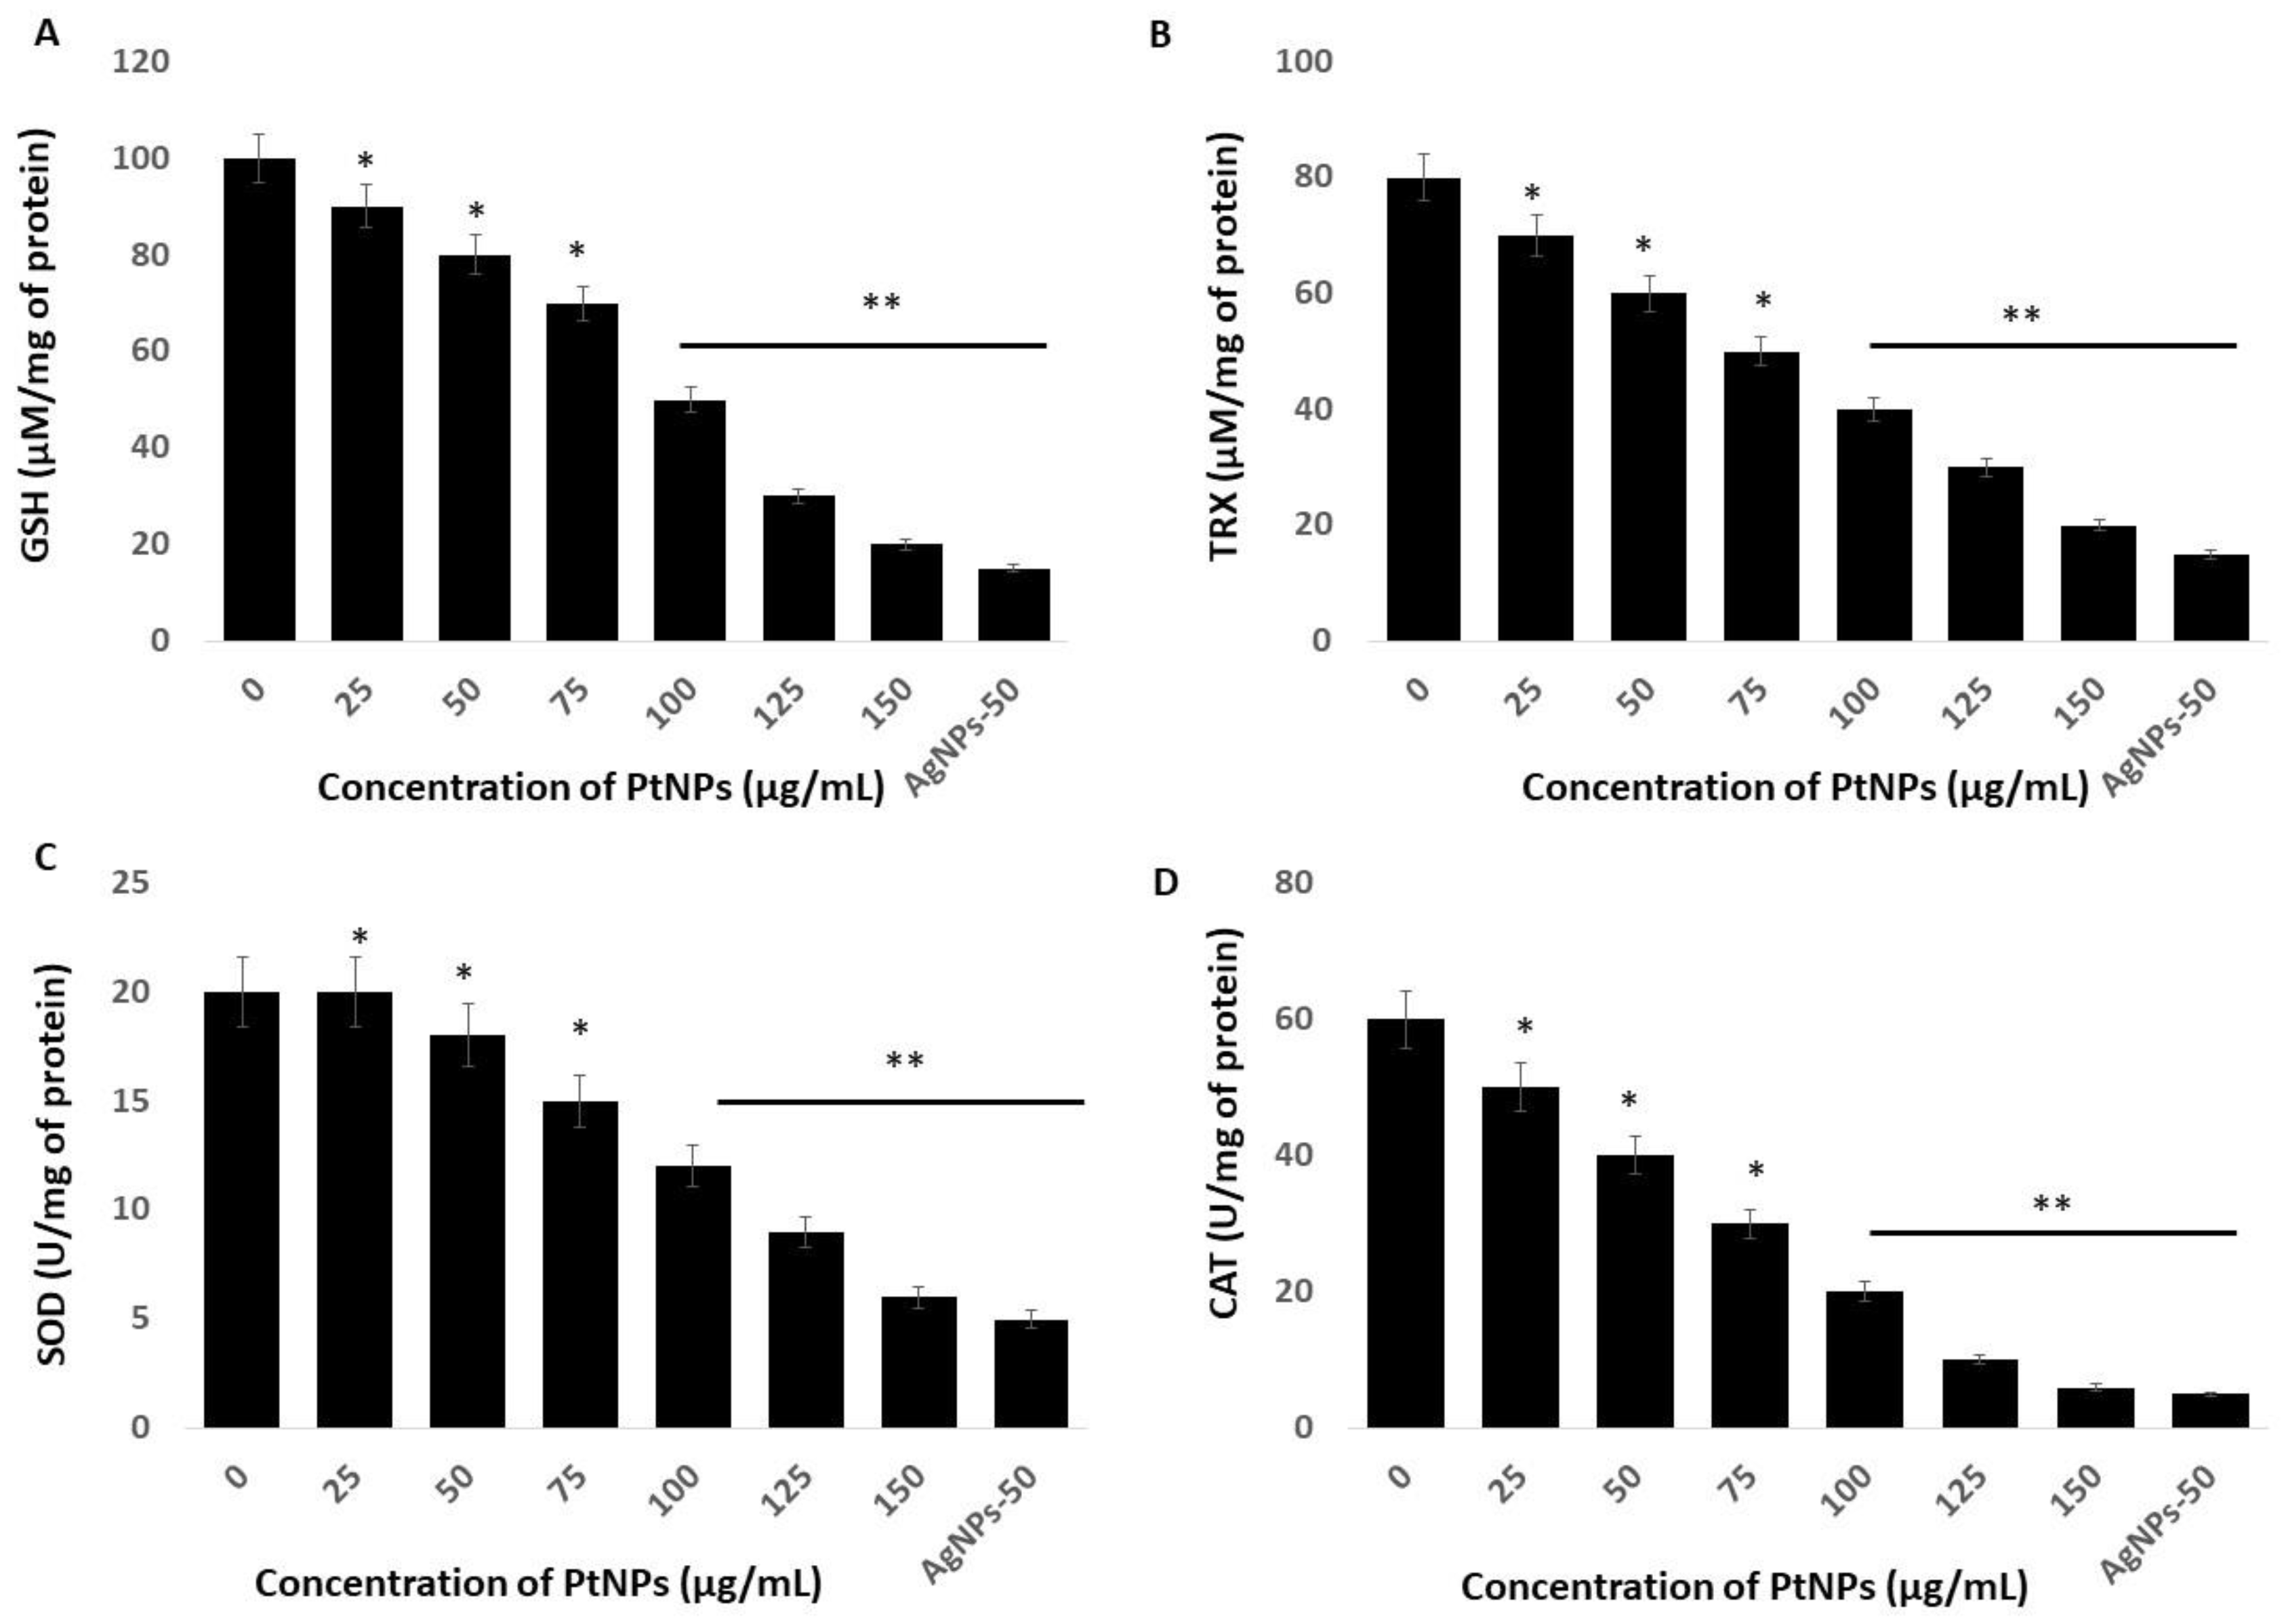
2.6. Platinum NPs Impair Antioxidants in THP-1 Cells
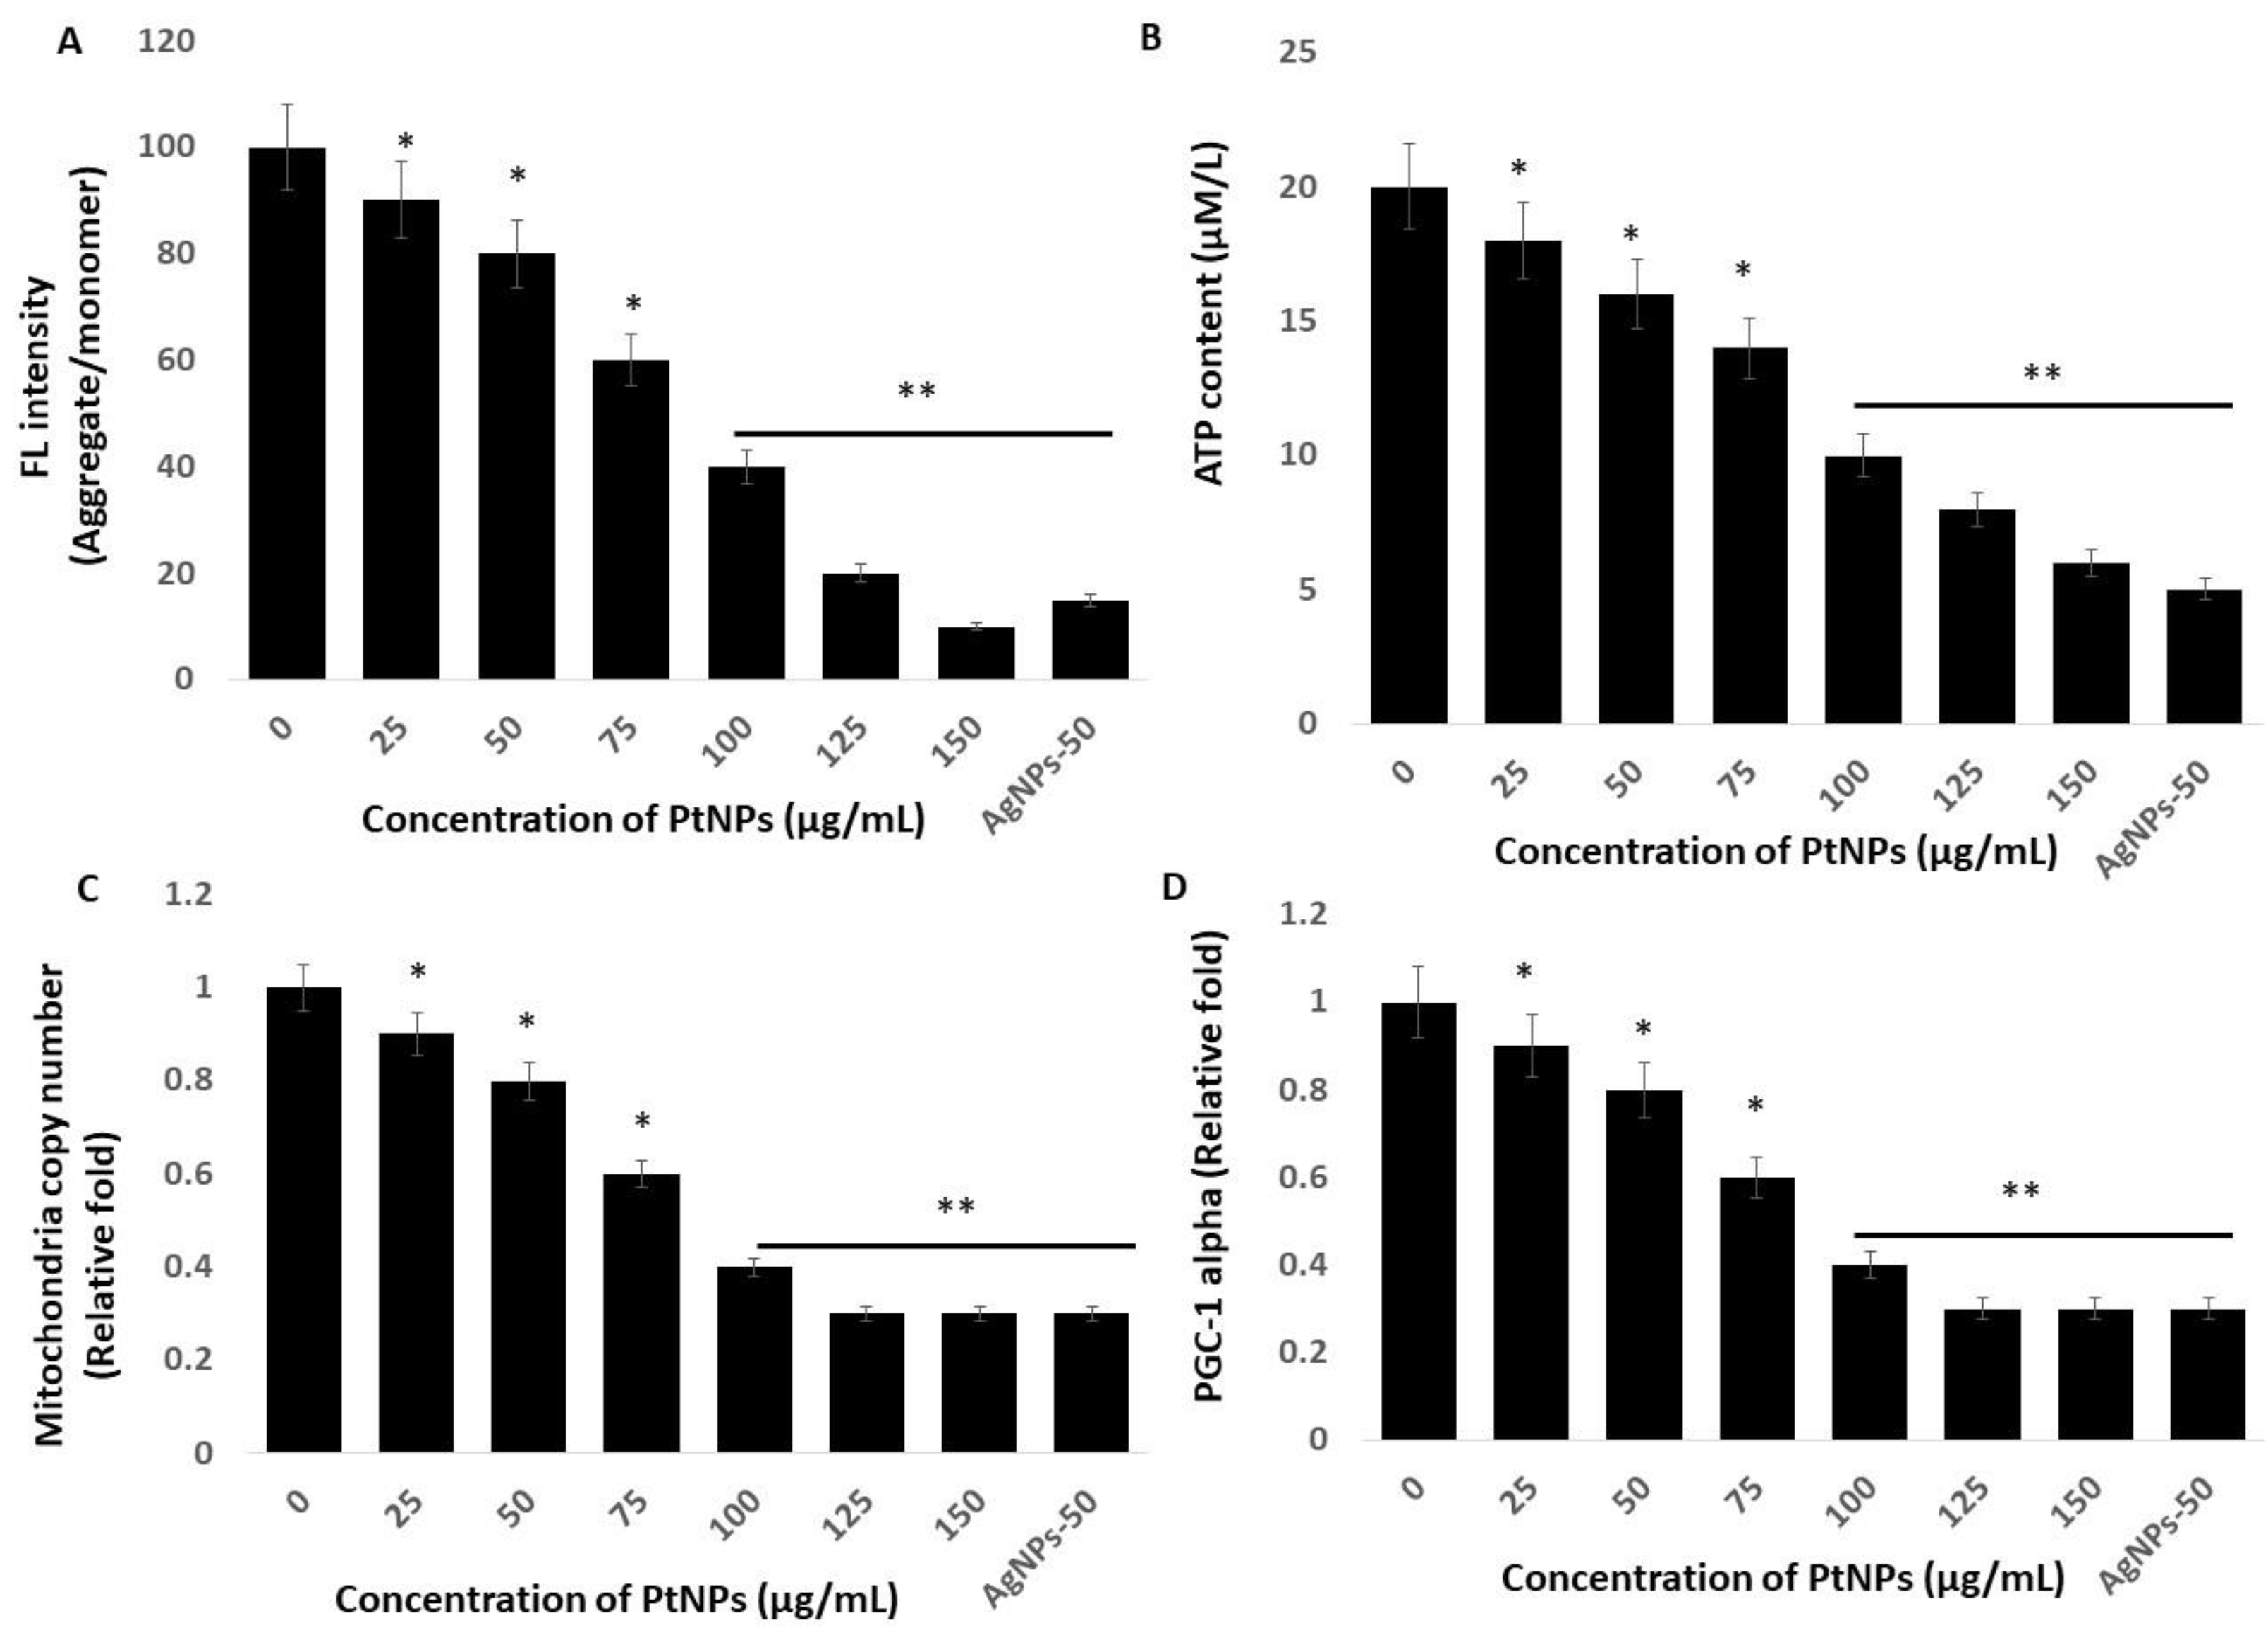
2.7. PtNPs Cause Mitochondrial Dysfunction, and Decrease ATP Content, Mitochondrial Copy Number, and Peroxisome Proliferator-Activated Receptor Gamma Coactivator 1-Alpha (PGC-1 Alpha) Expression
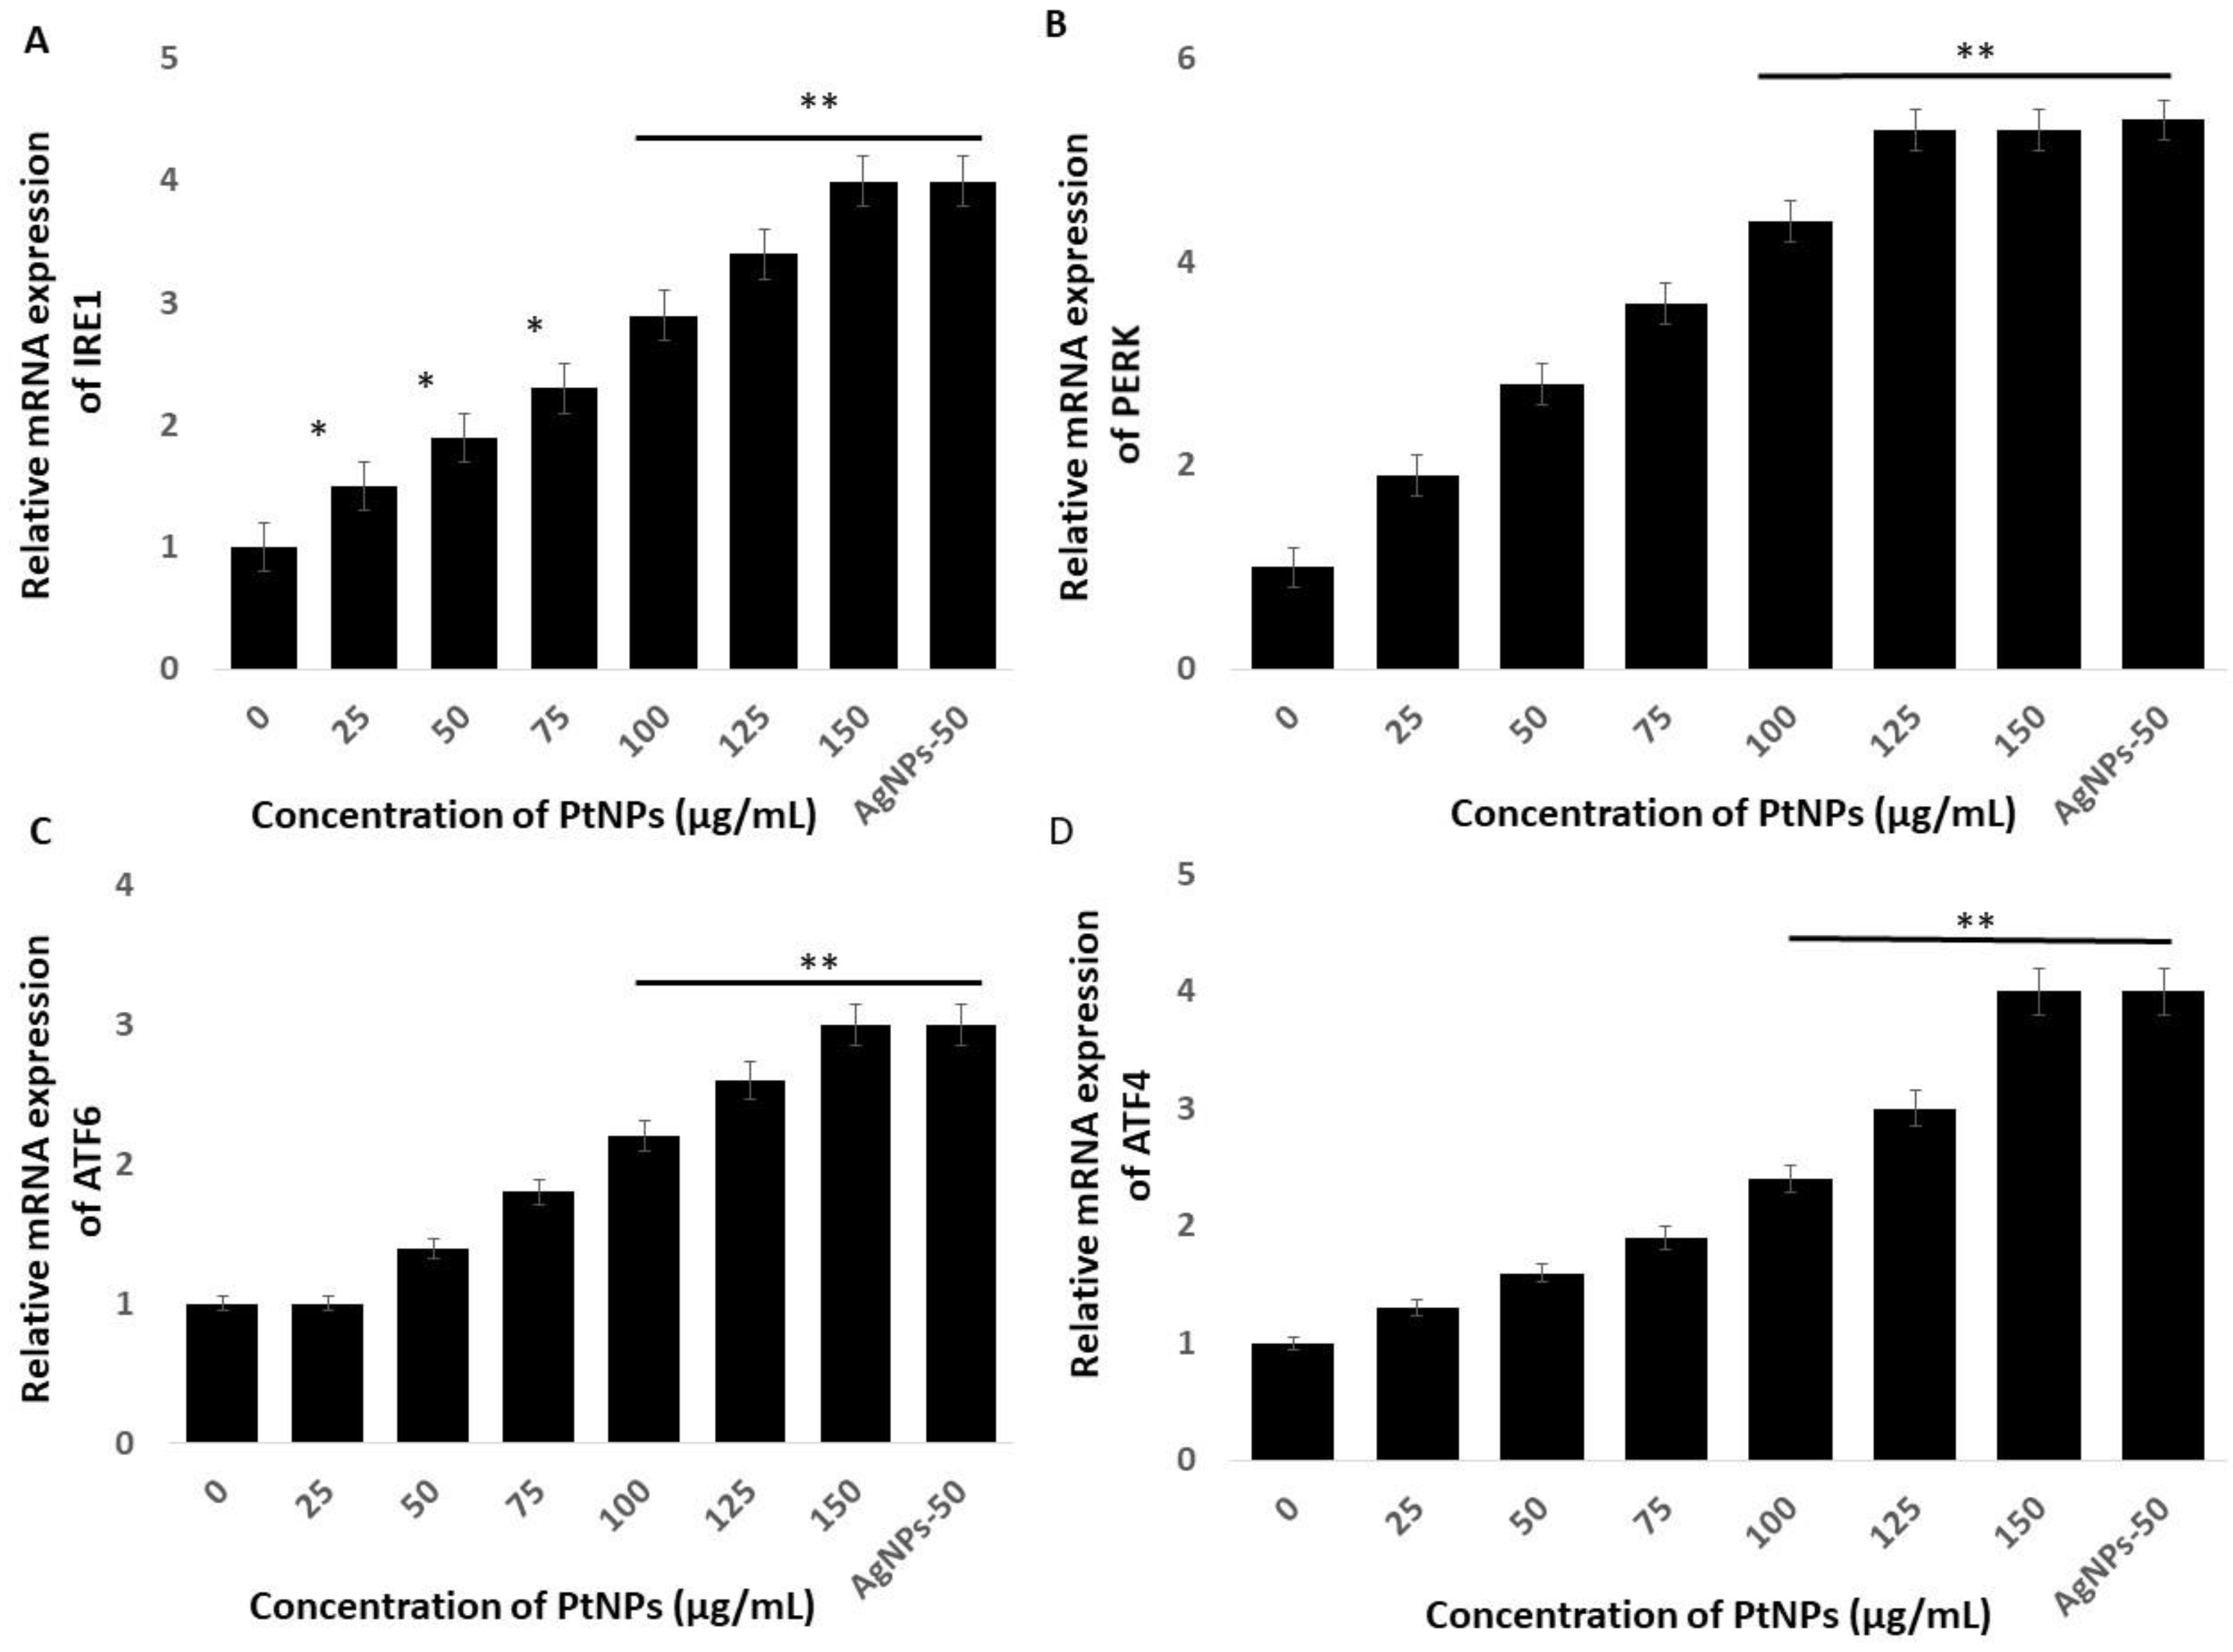
2.8. PtNPs Induce Cell Death Mediated by Endoplasmic Reticulum Stress
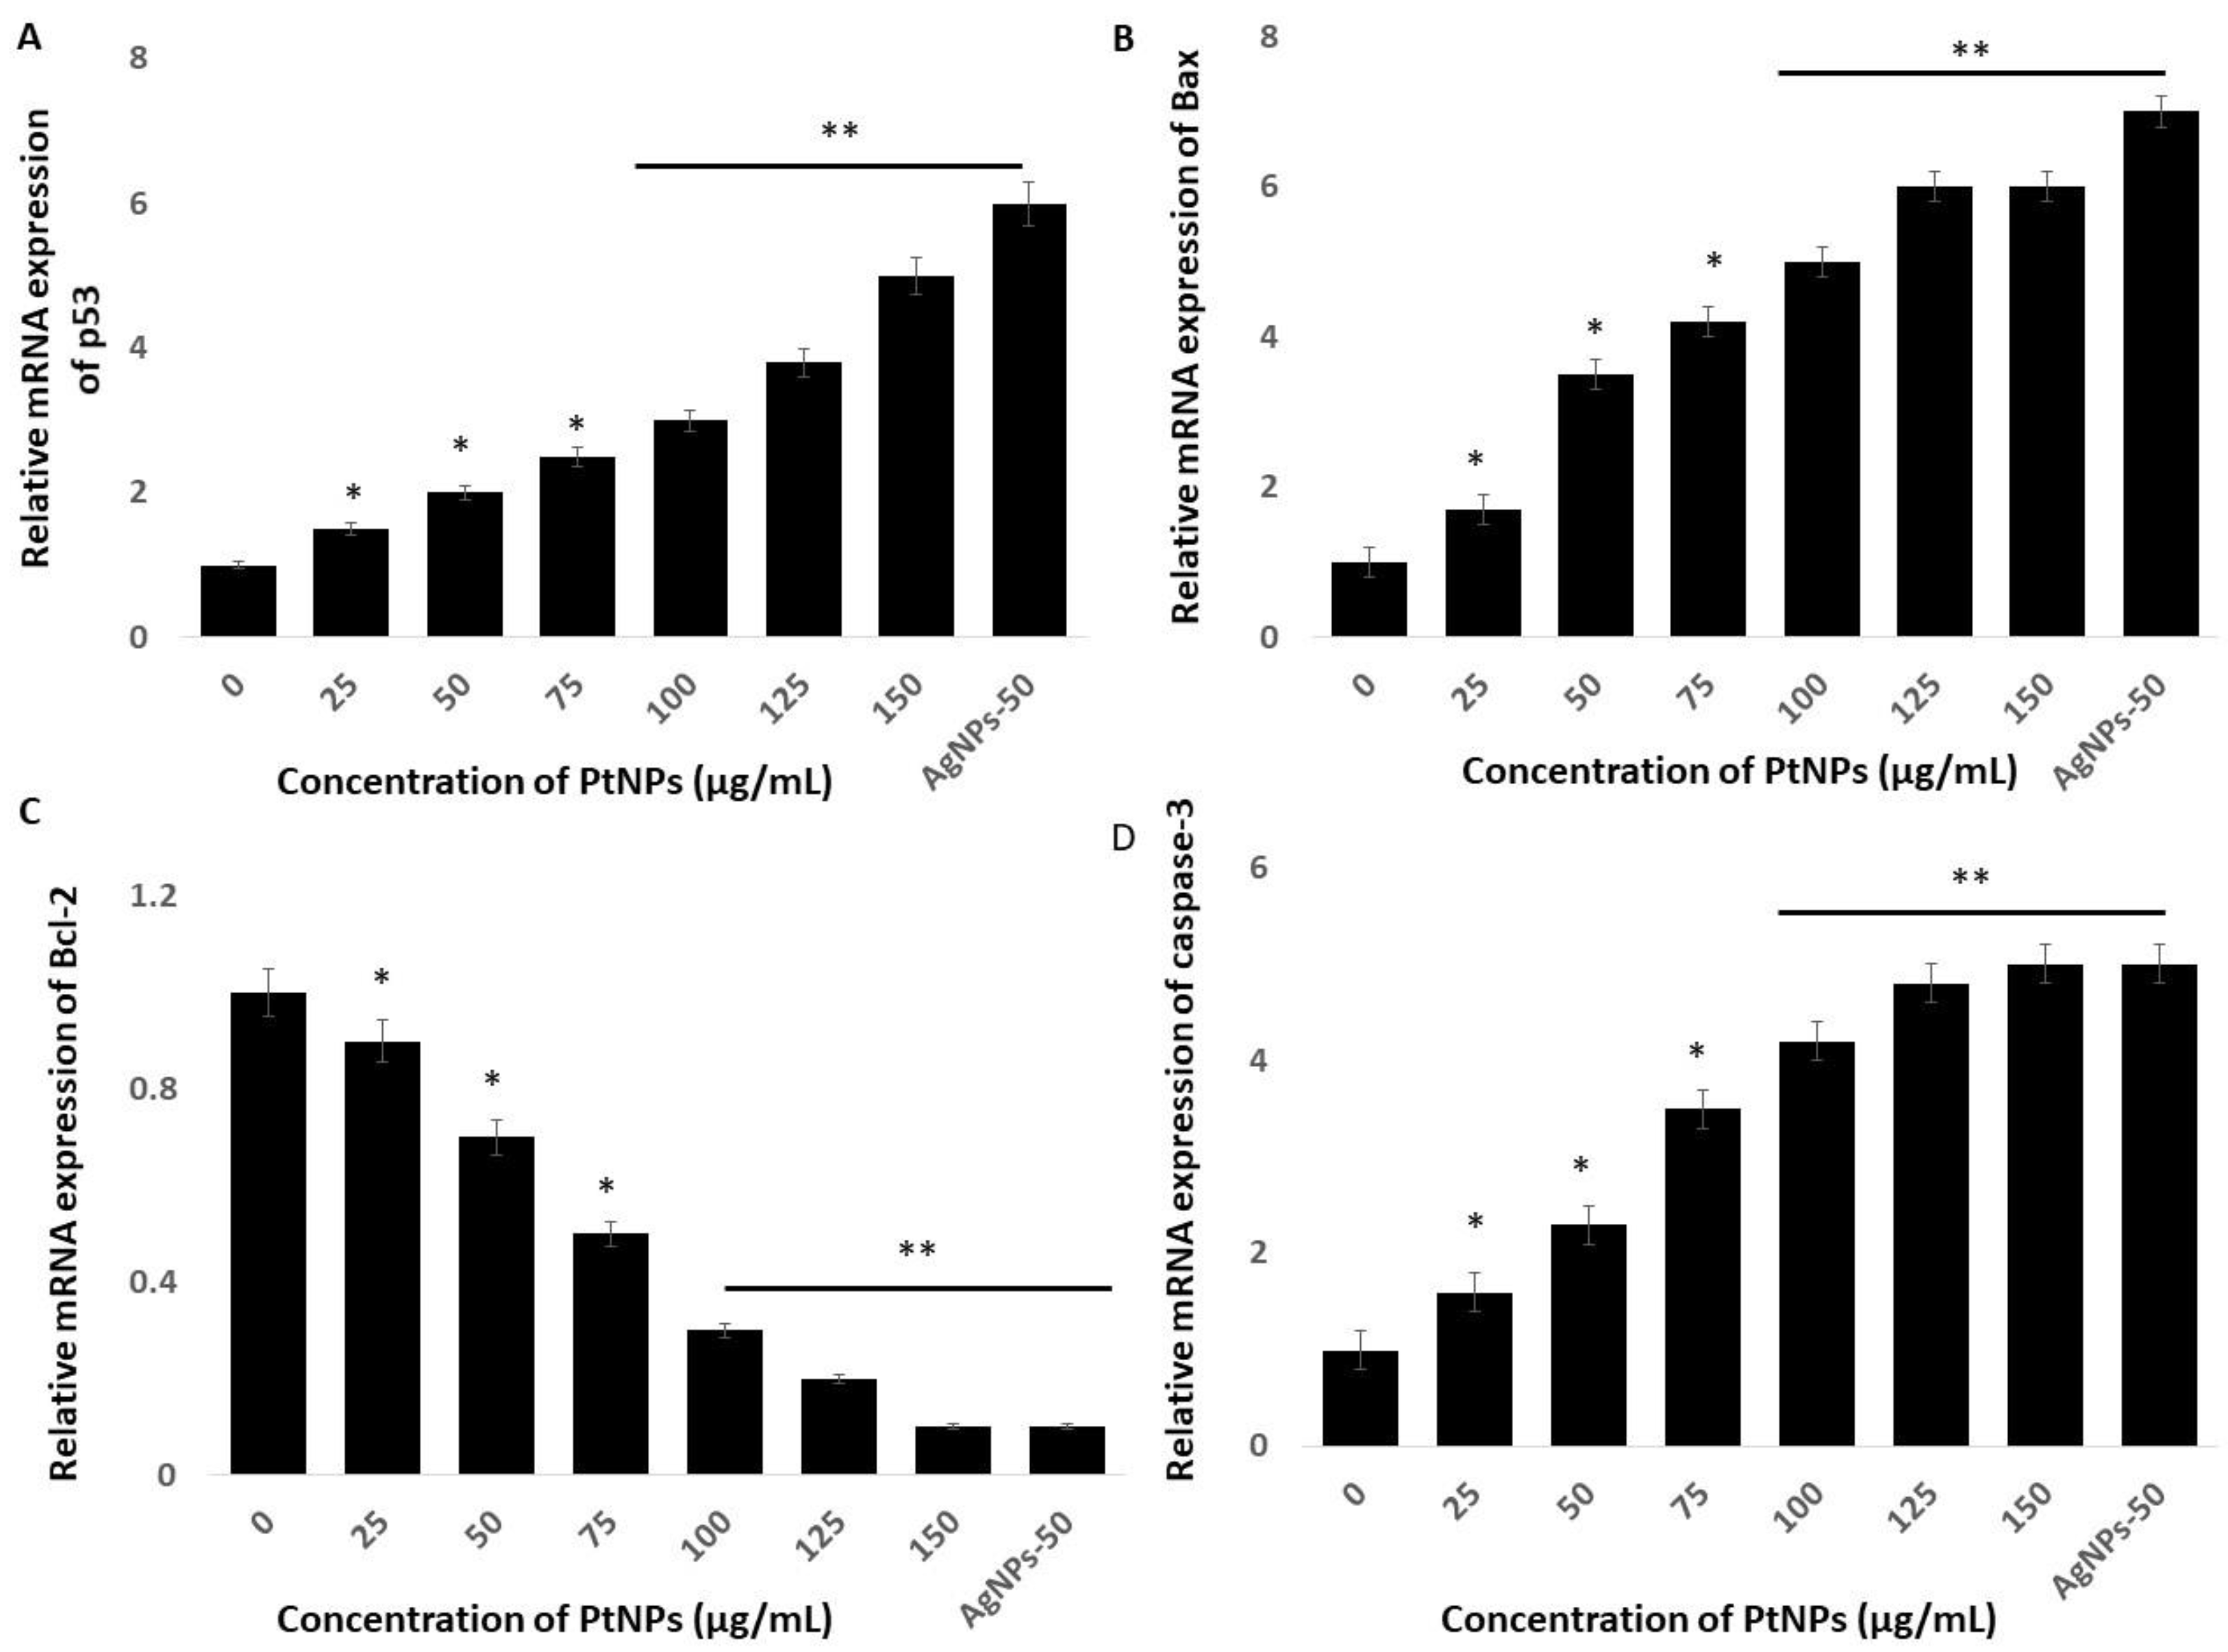
2.9. PtNPs Induce Expression of Pro-Apoptotic and Anti-Apoptotic Genes
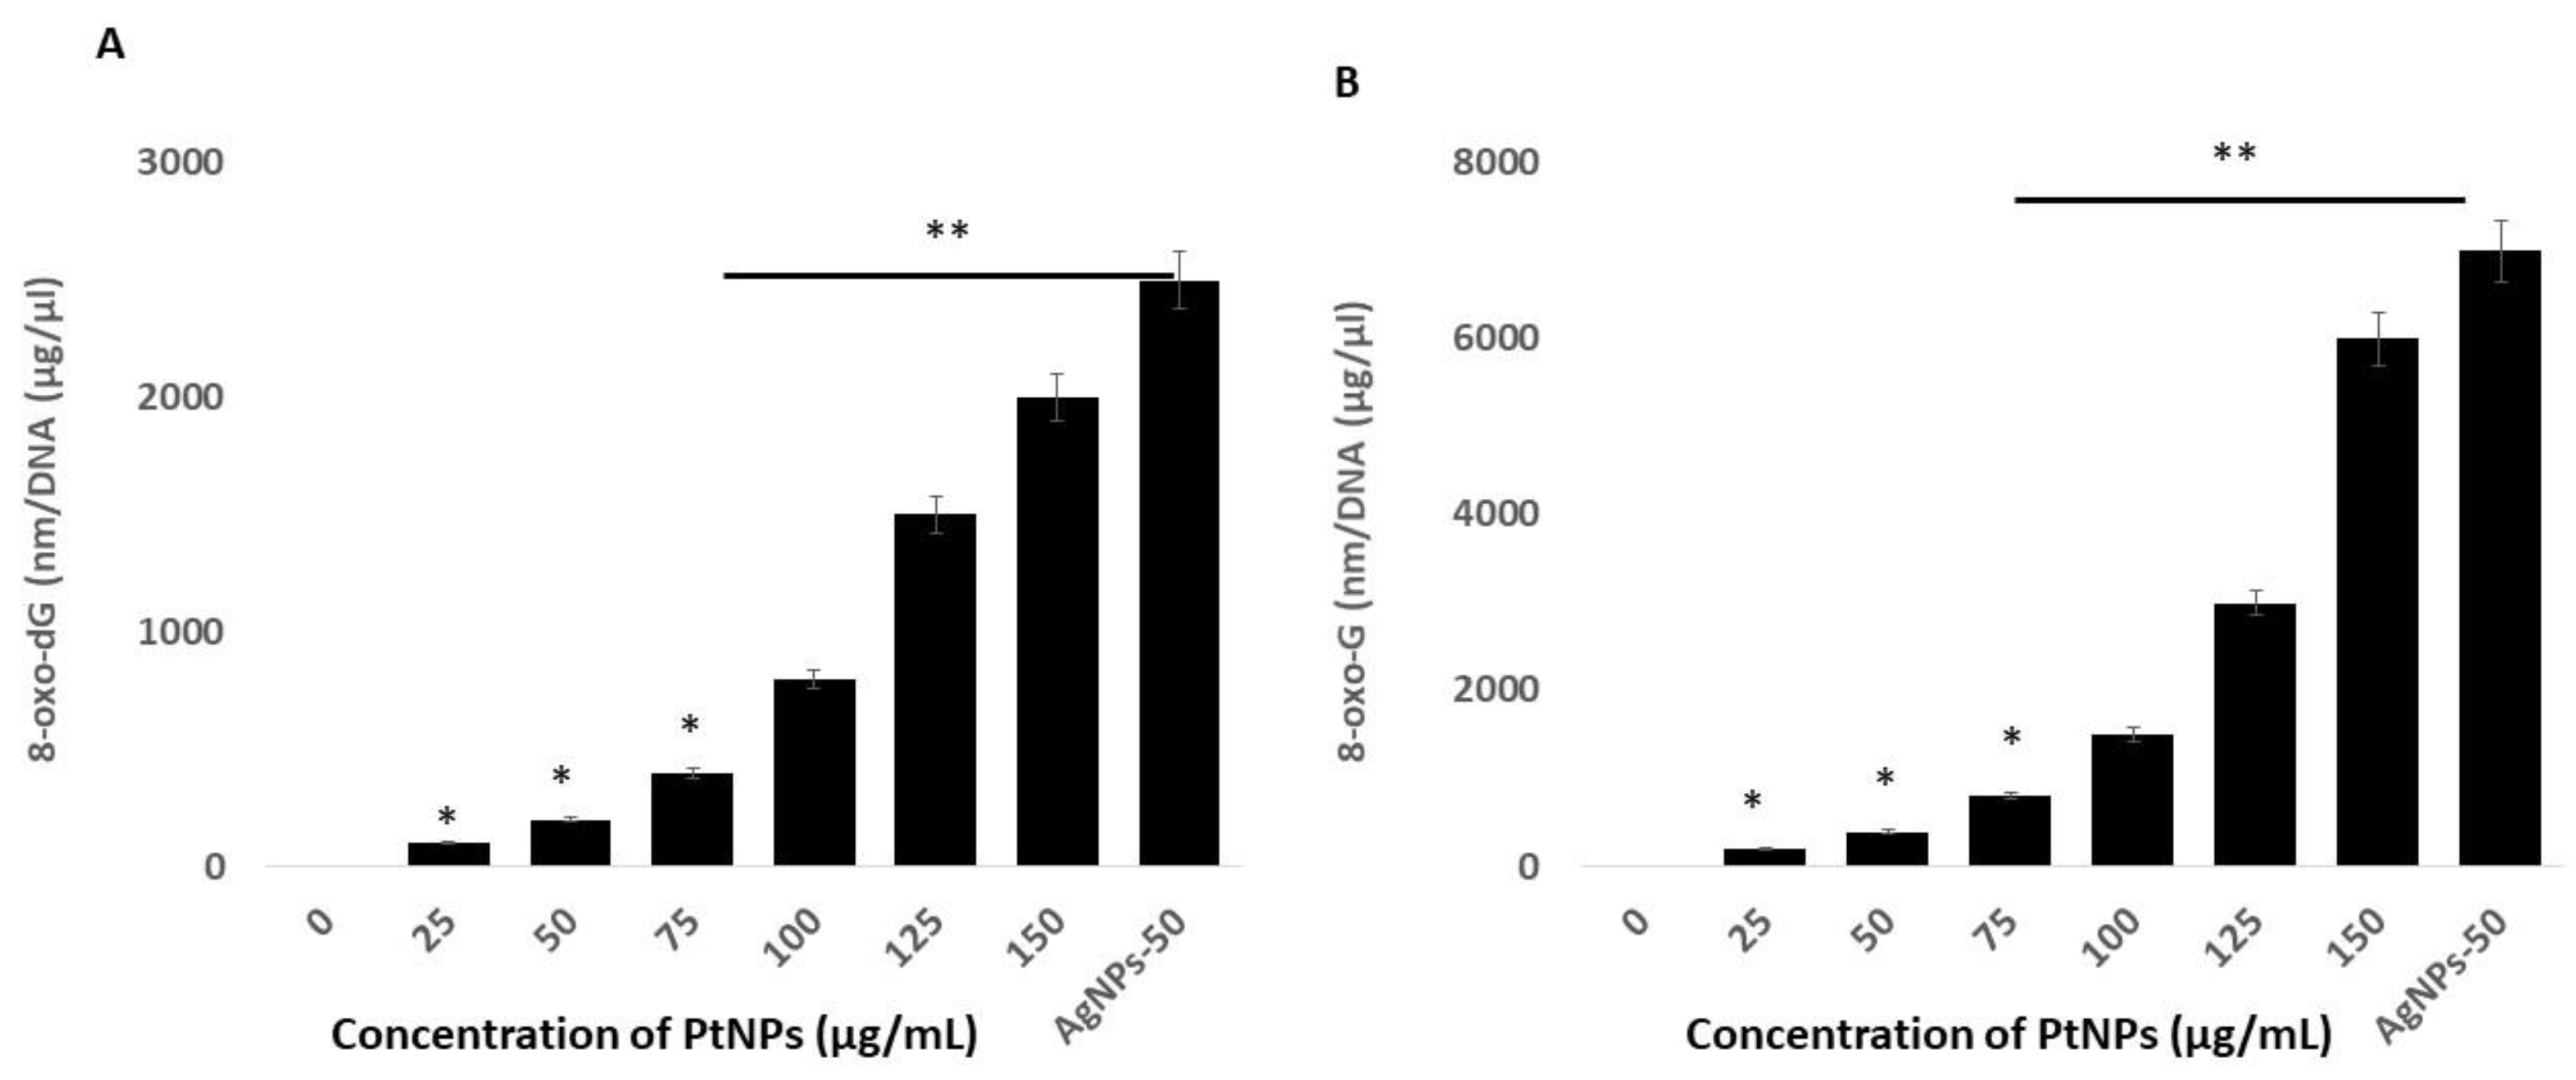
2.10. PtNPs Induce Oxidative Damage to DNA
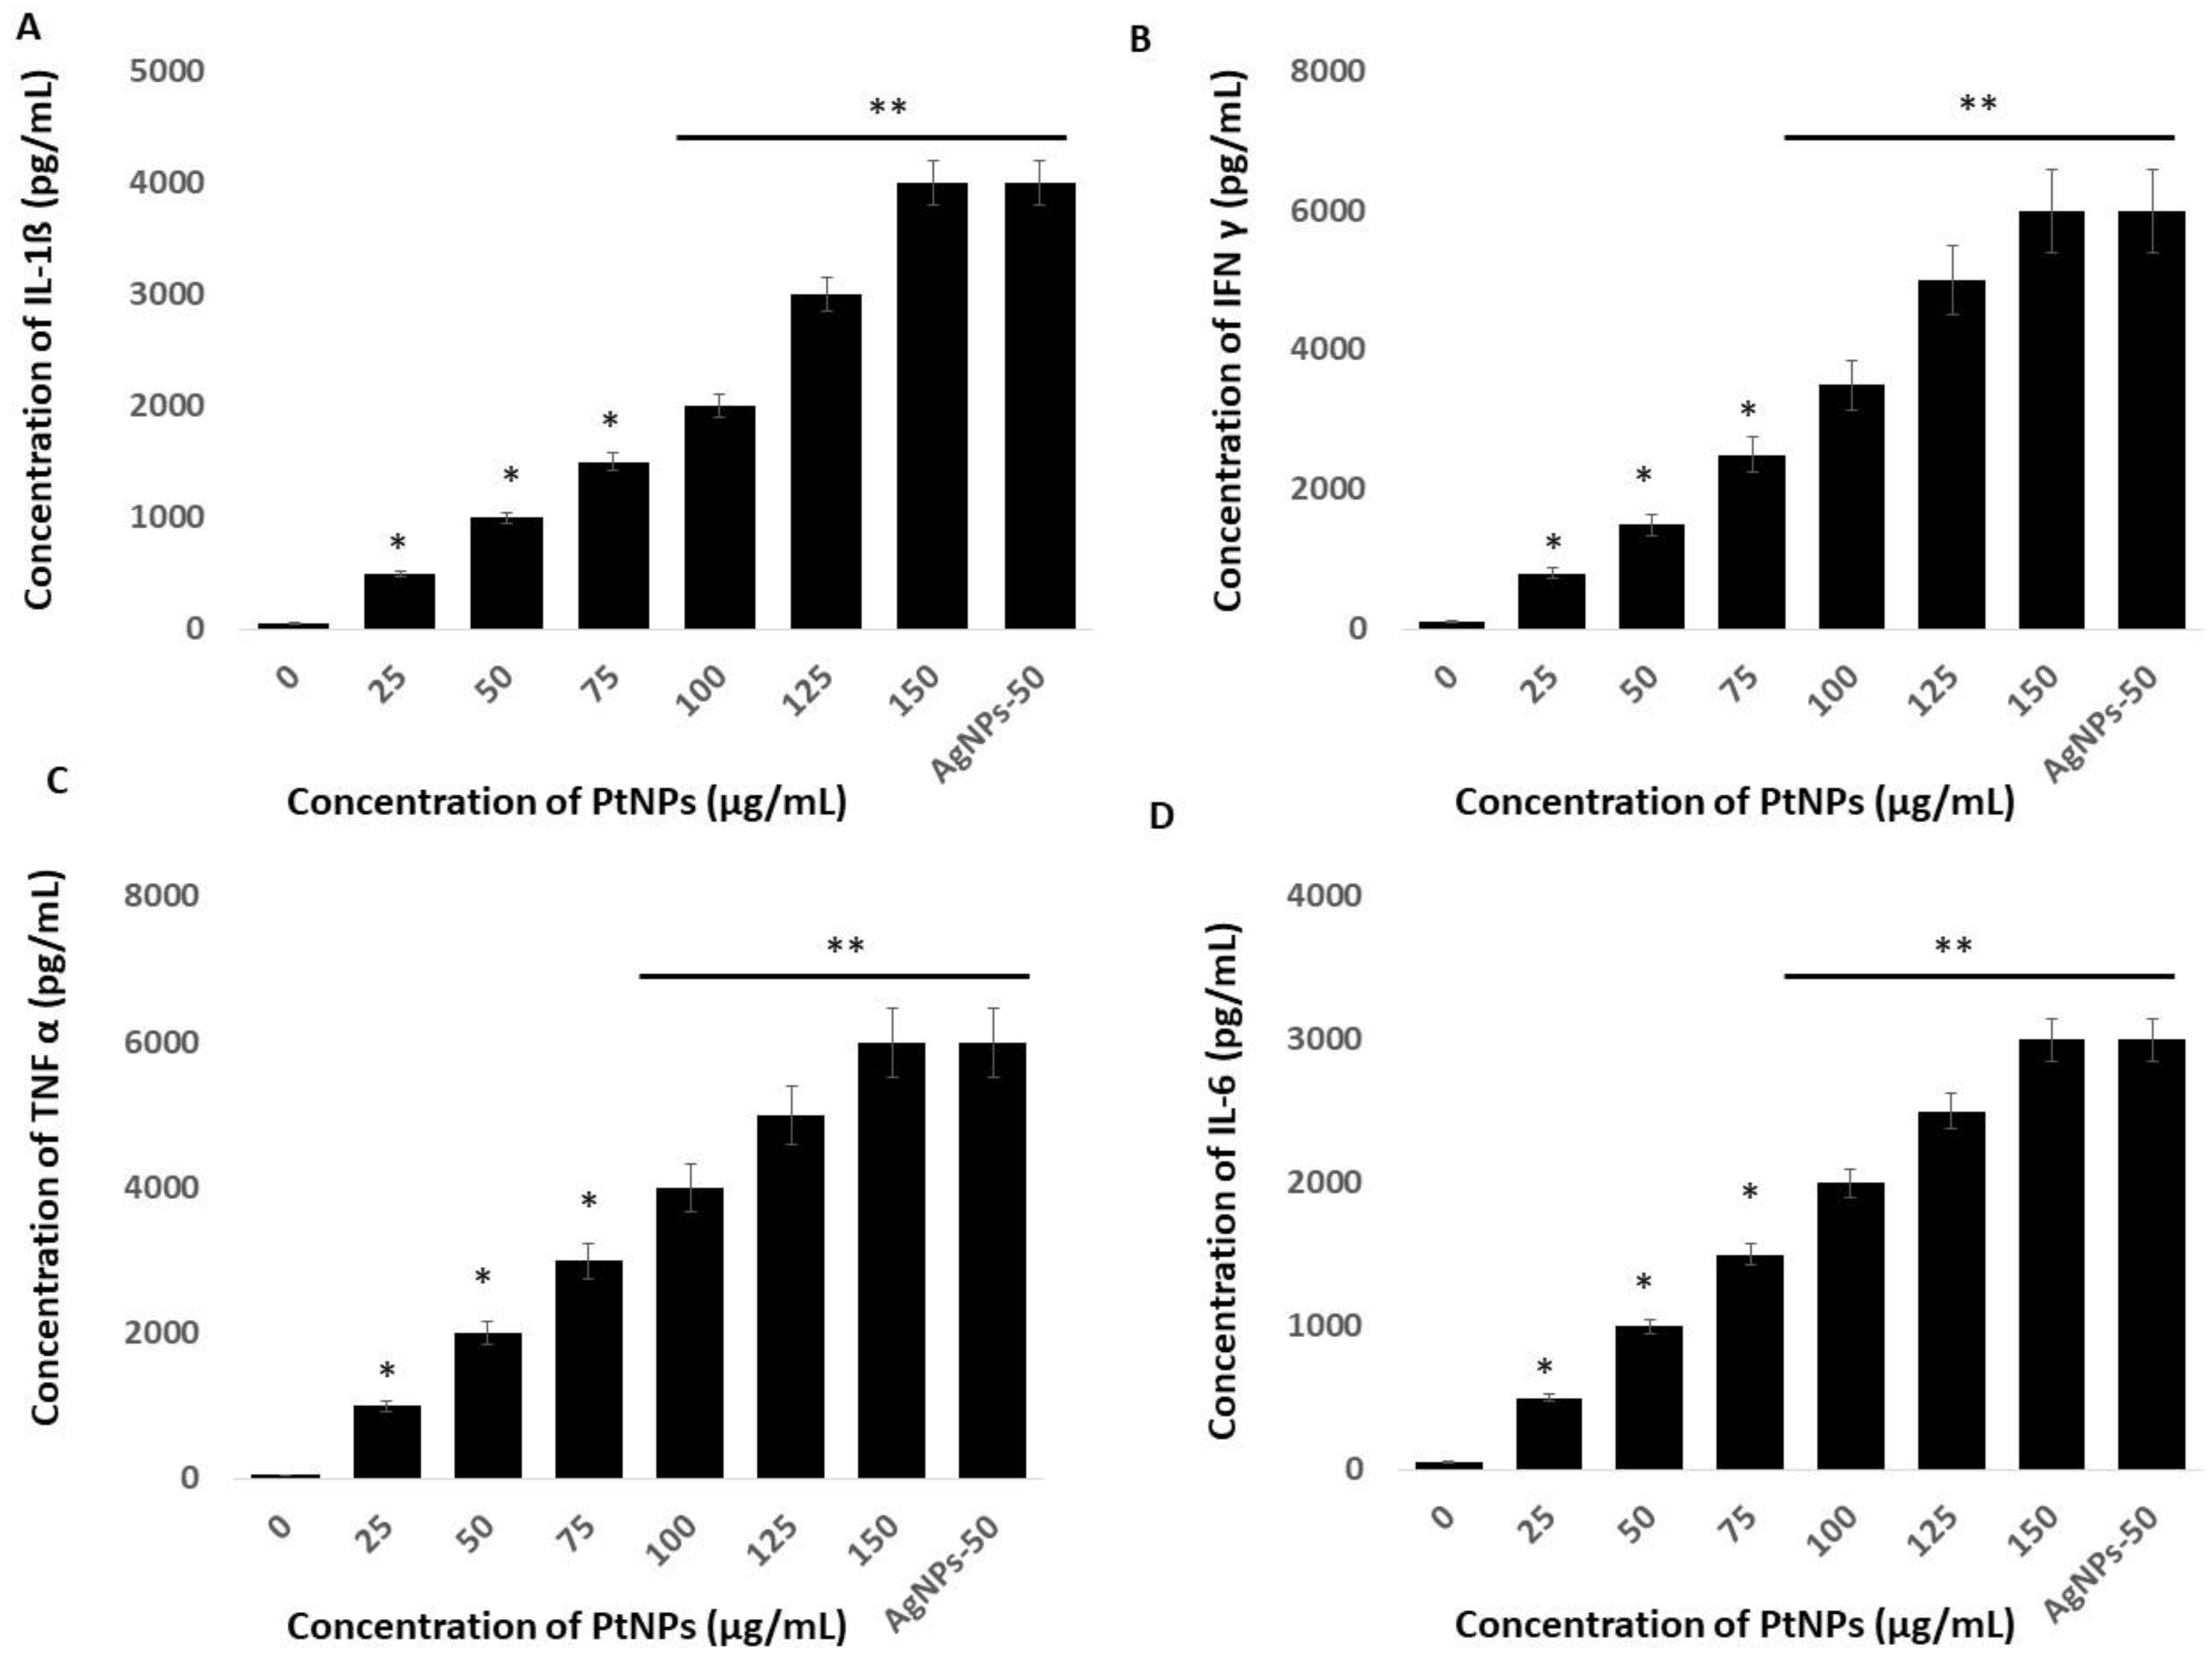
2.11. PtNPs Activate Inflammatory Responses in THP-1 Cells
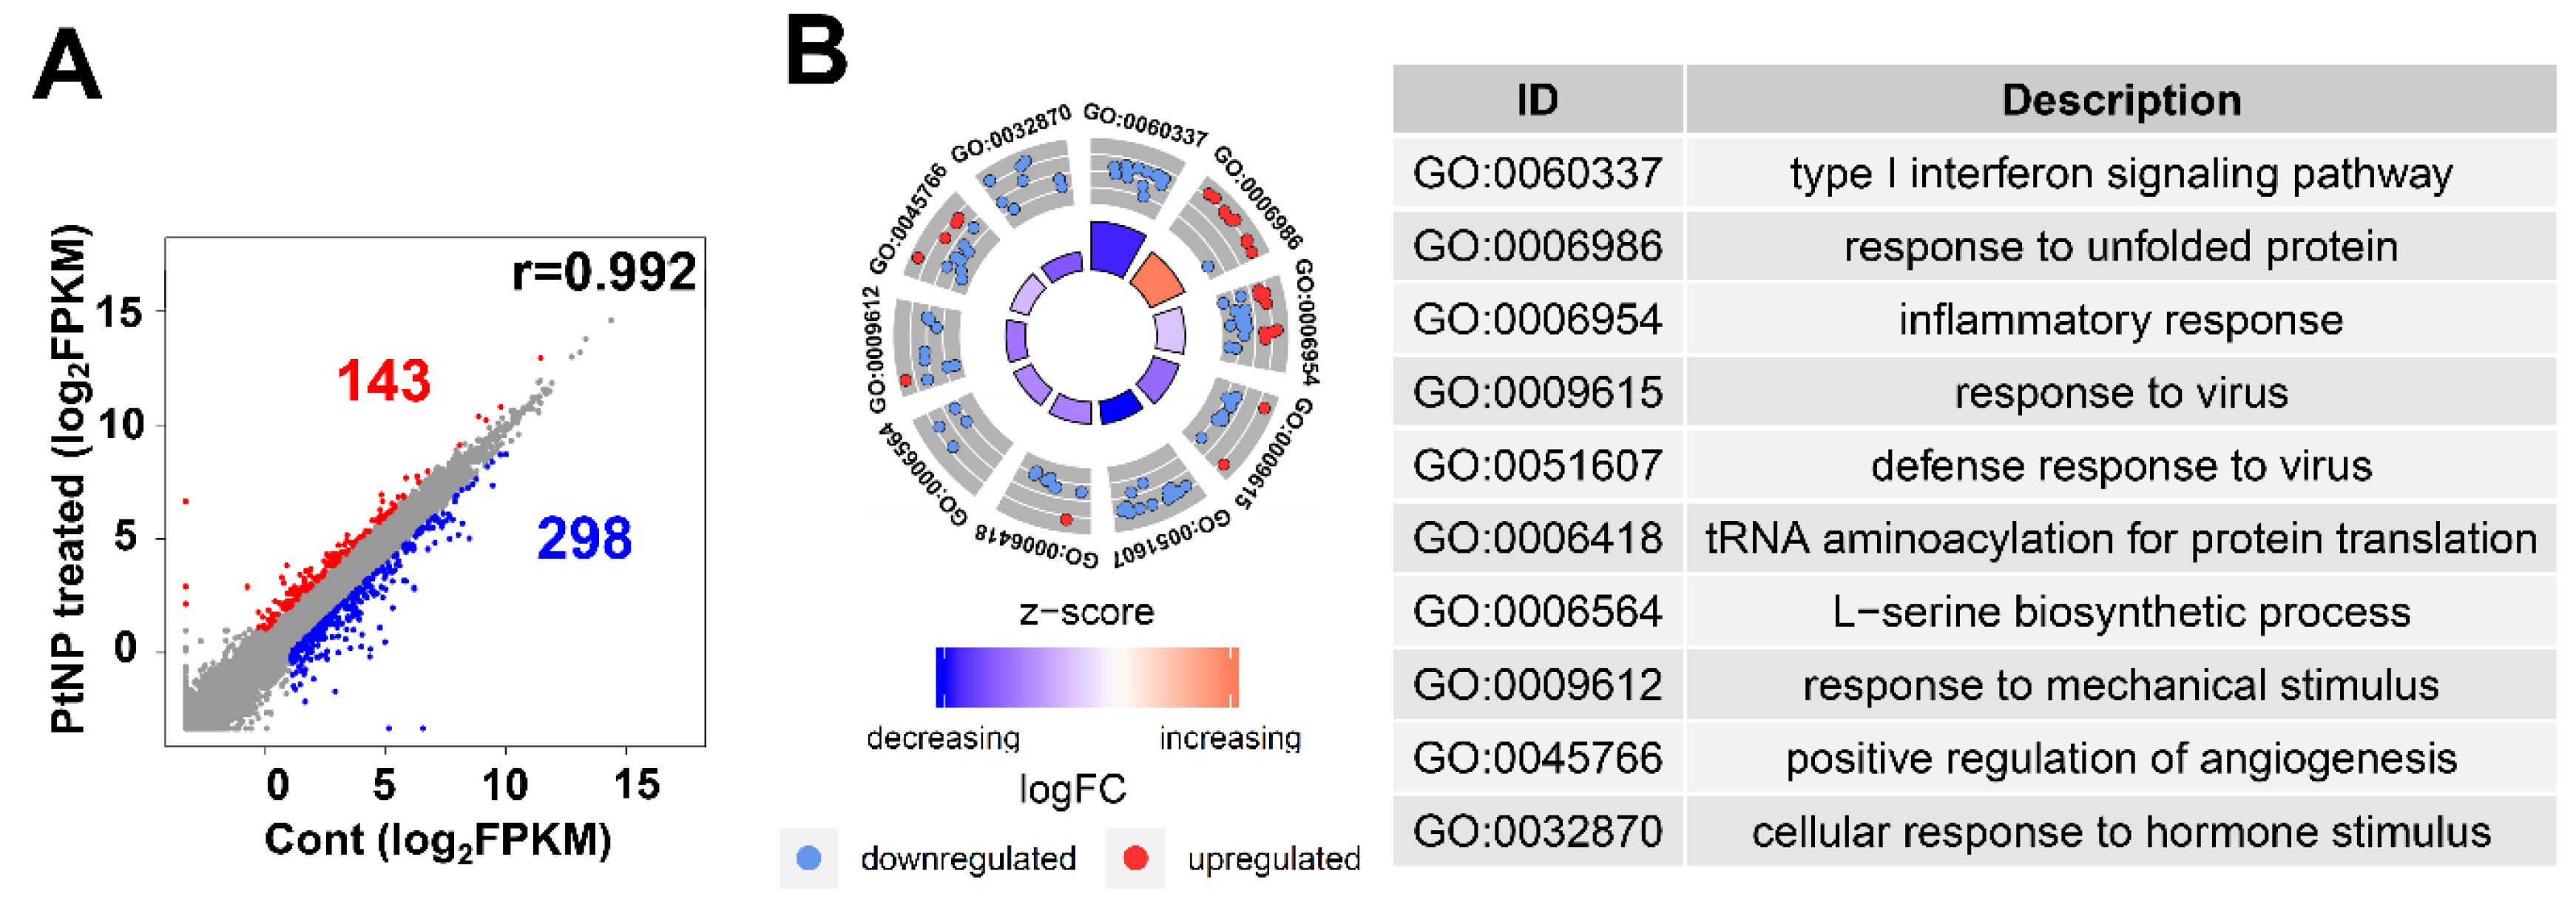
2.12. Gene Expression Profile Is Altered in THP-1 Cells Incubated with PtNPs
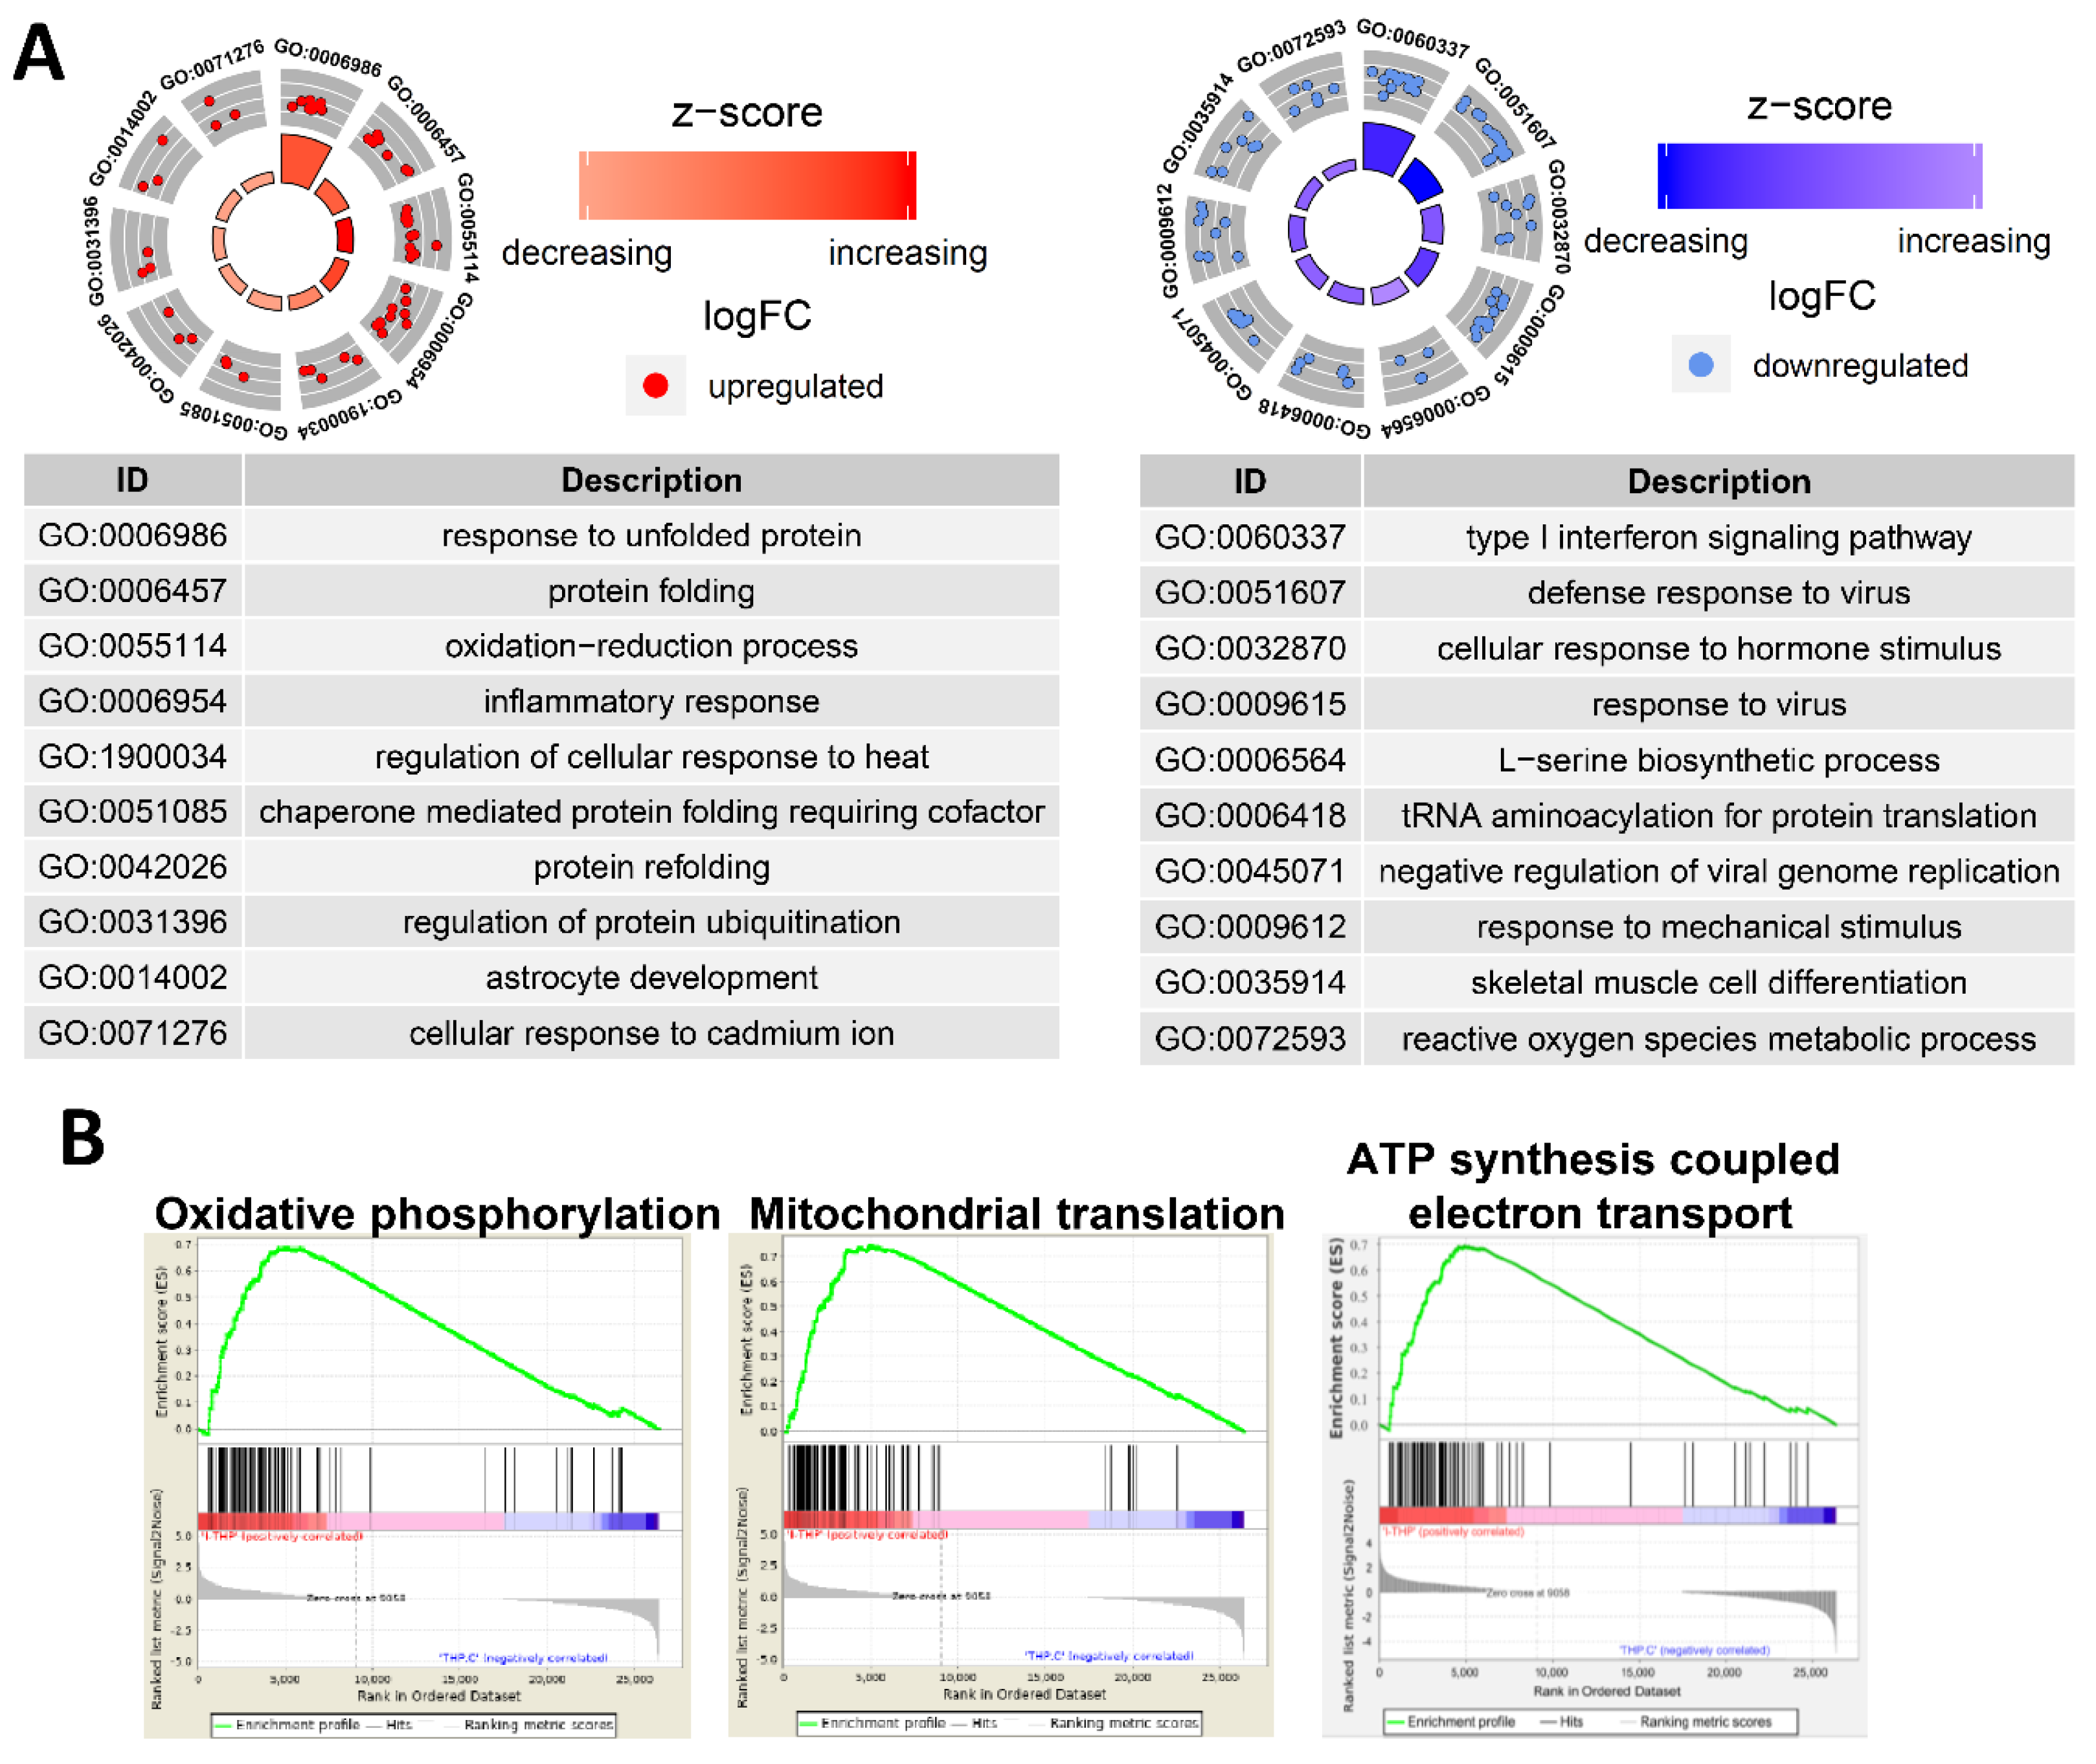
2.13. PtNP Treatment Changes Genes Related to Protein Misfolding and Mitochondrial Function
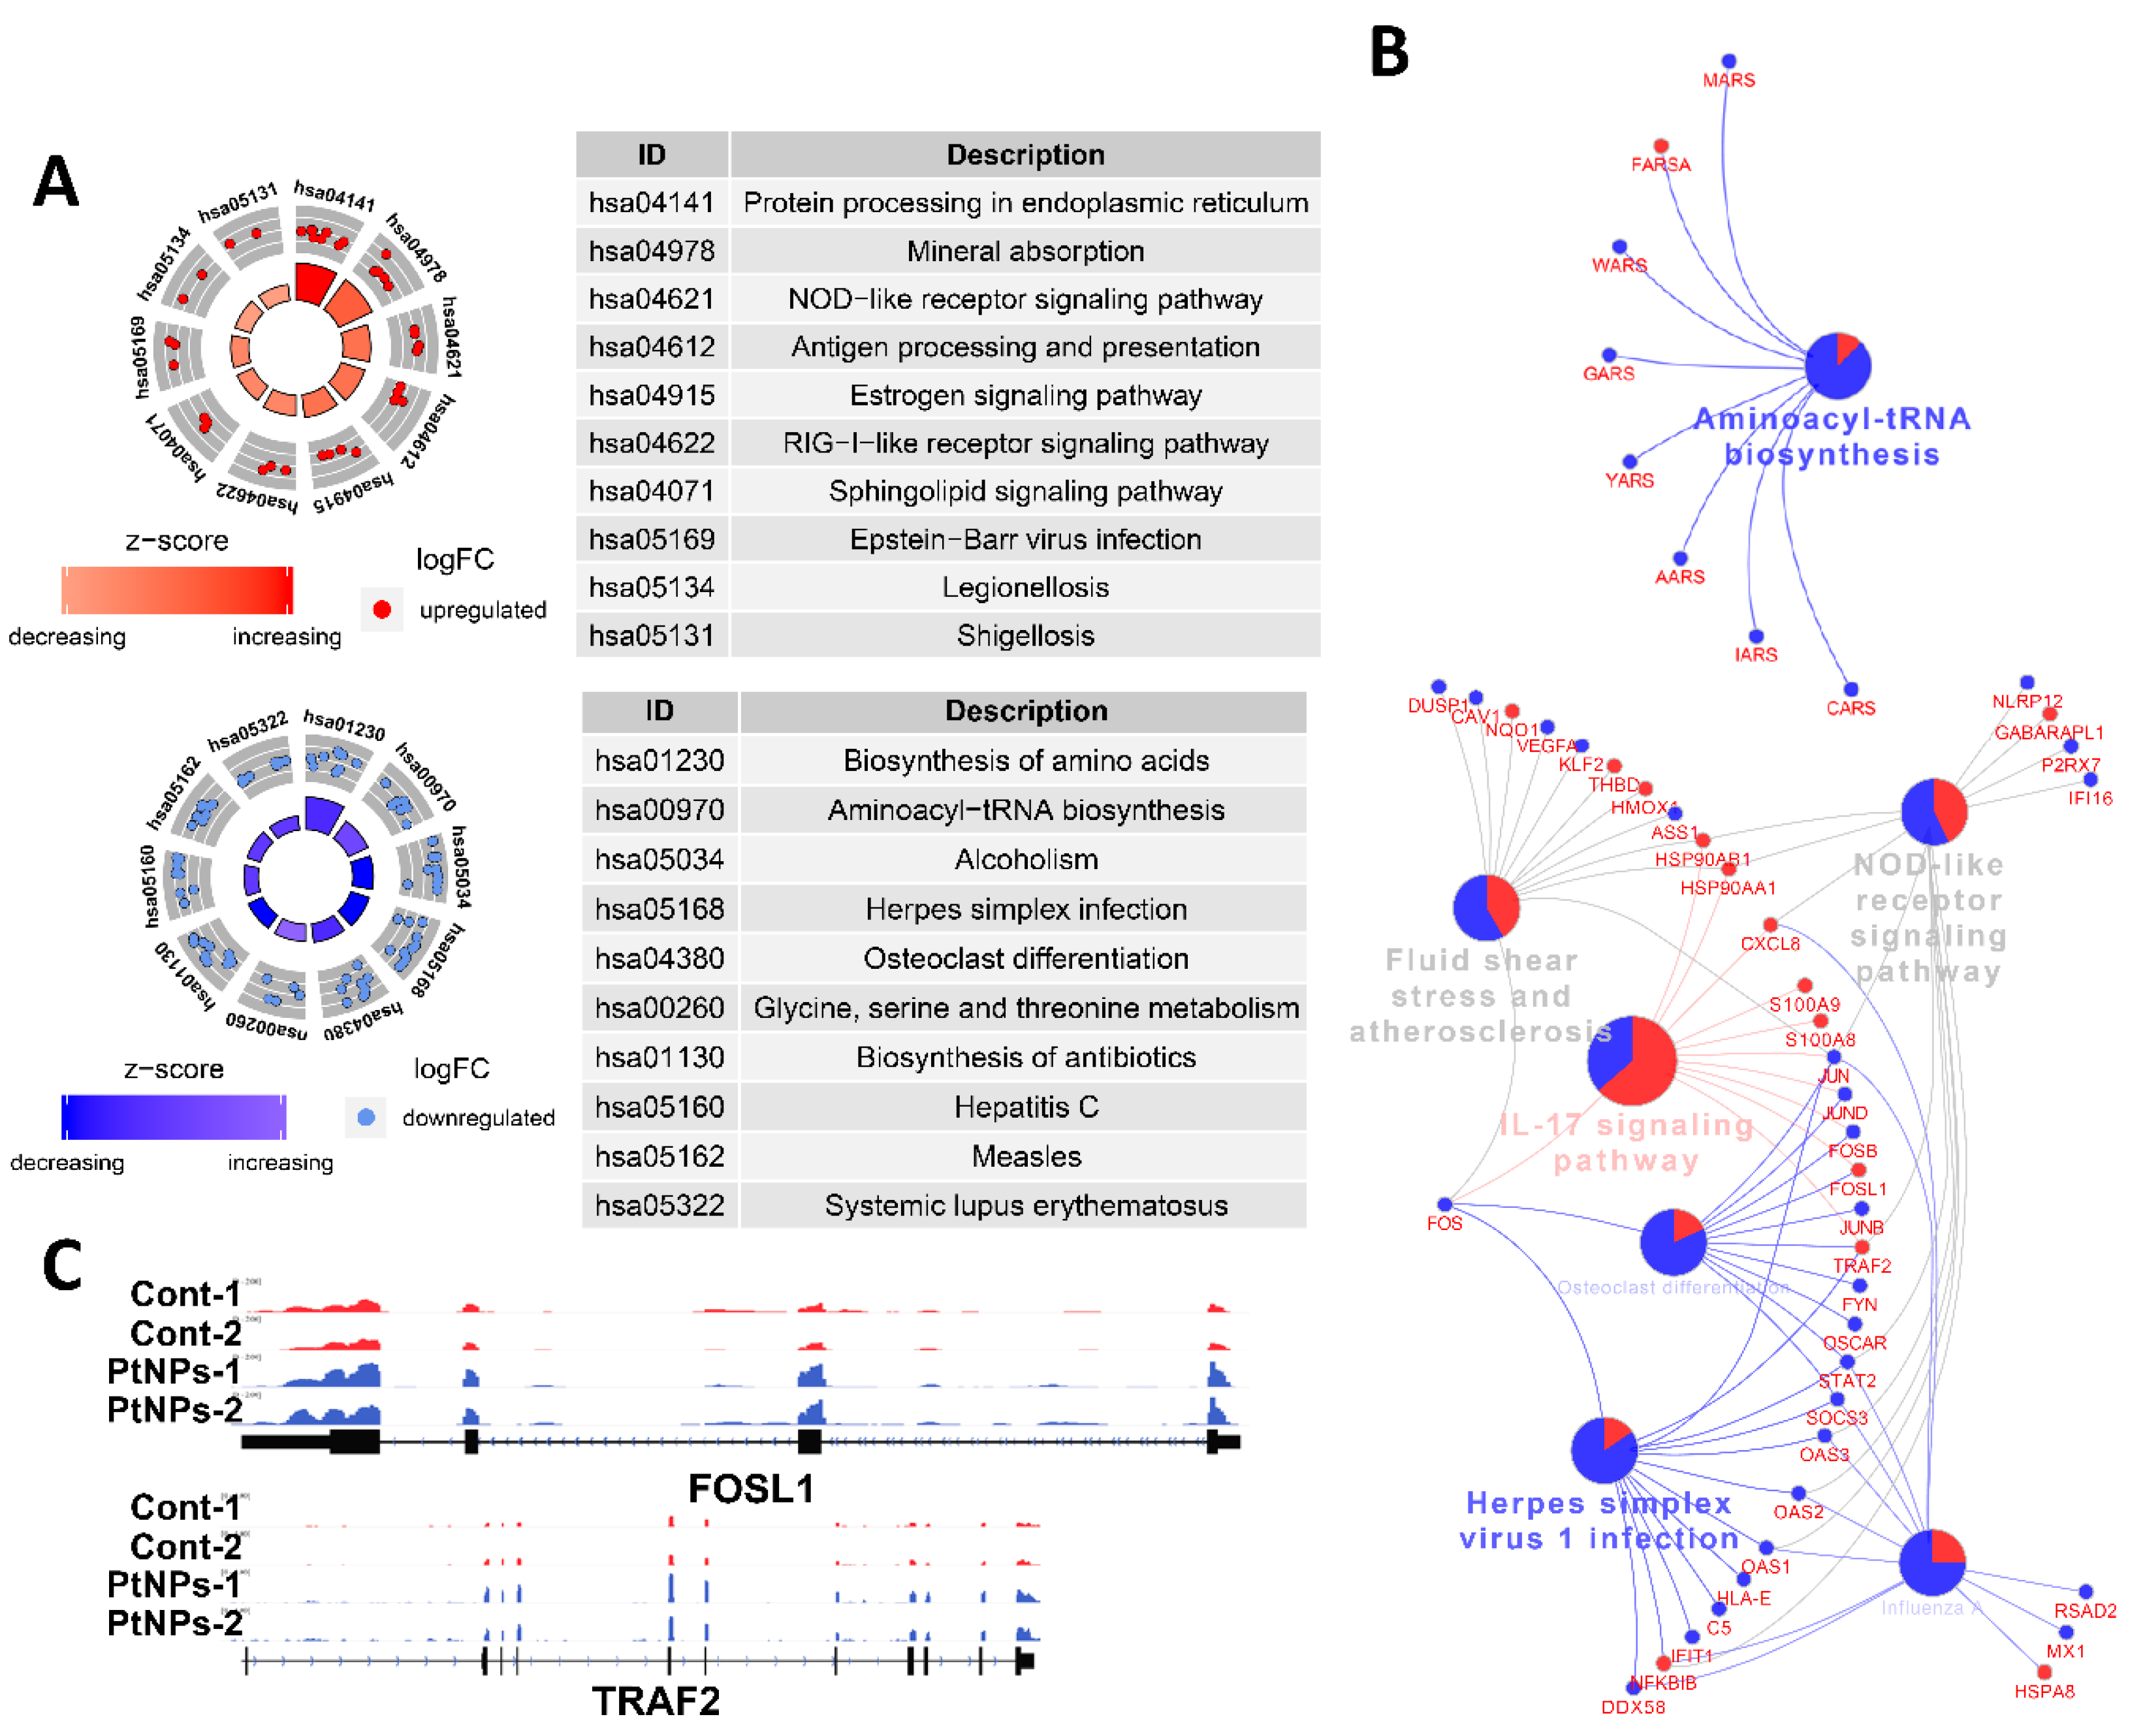
2.14. PtNPs Impair Pathways Involved in Protein Synthesis
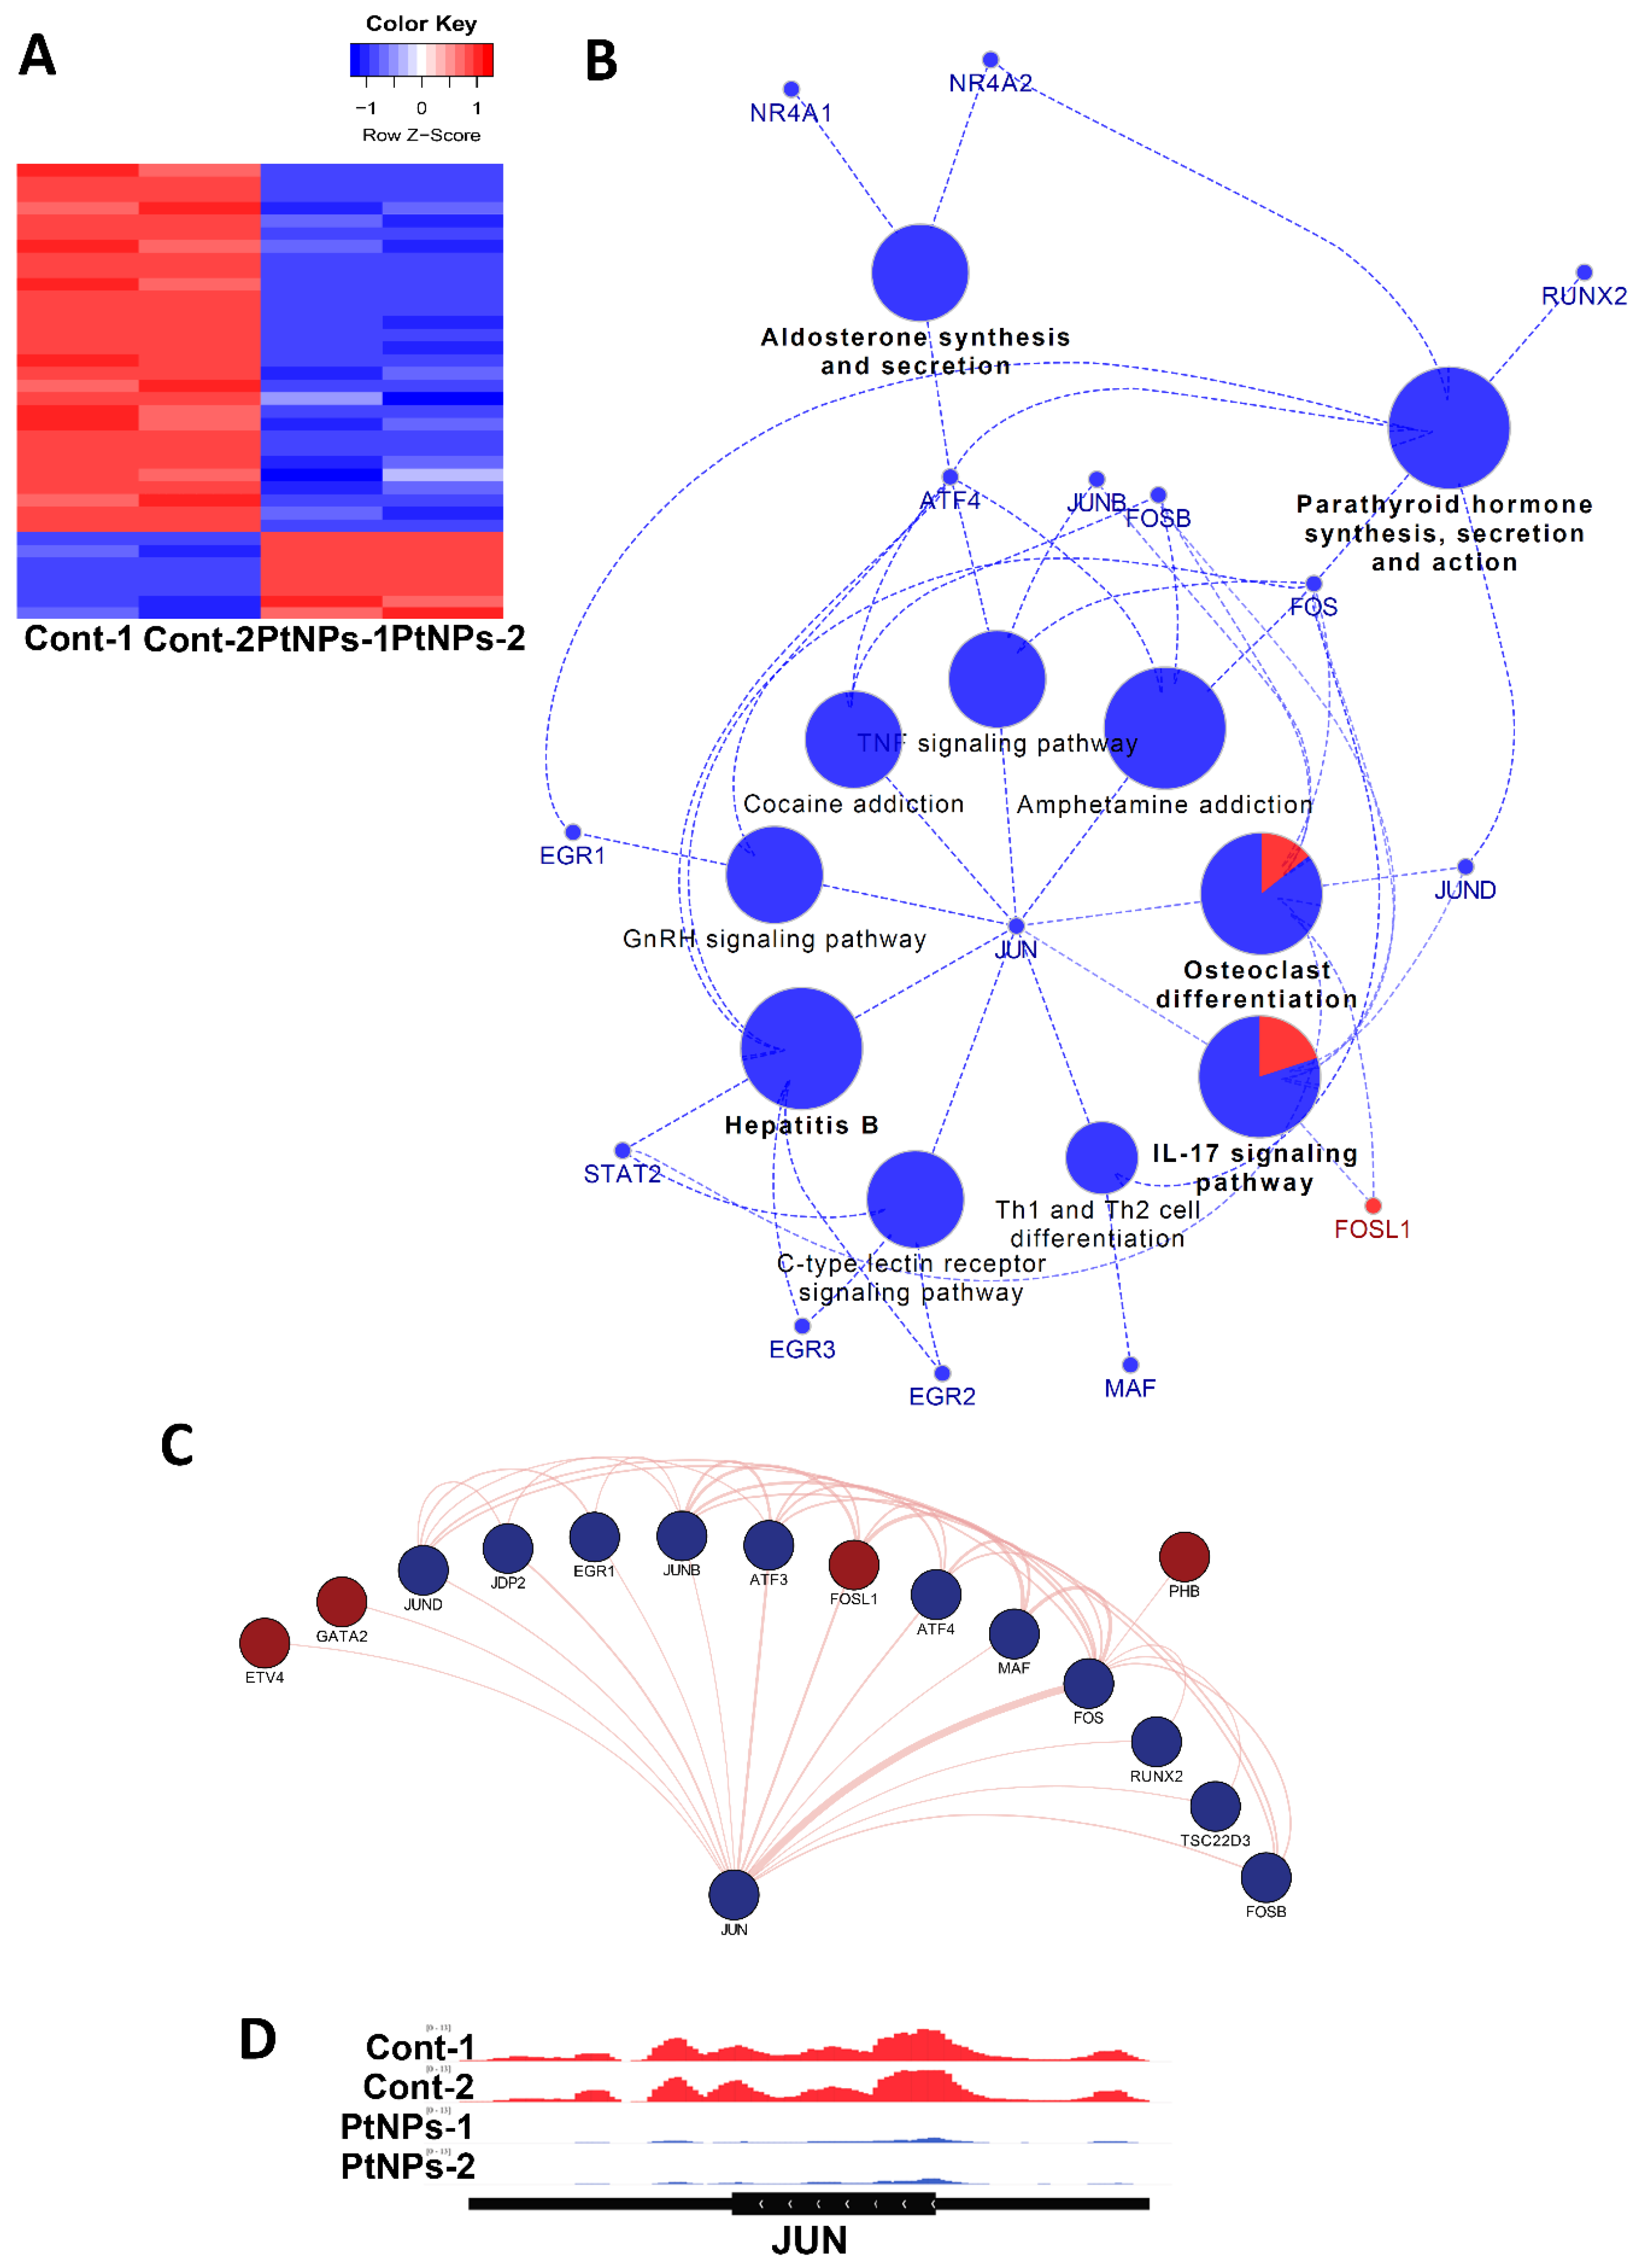
2.15. Transcriptional Regulation Is Impaired by PtNPs
3. Materials and Methods
3.1. Materials
3.2. Synthesis and Characterization of PtNPs
3.3. Cell Culture Conditions and PtNP Exposure
3.4. Cell Viability Assays
3.5. BrdU Cell Proliferation Assays
3.6. Cell Morphology Analysis
3.7. Assessment of Membrane Integrity
3.8. Assessment of Dead-Cell Protease Activity
3.9. Determination of ROS, MDA, Nitric Oxide (NO), and Carbonylated Protein Levels
3.10. Measurement of Anti-Oxidative Markers
3.11. Determination of Mitochondrial Membrane Potential (MMP)
3.12. Measurement of ATP
3.13. Analysis of Mitochondrial DNA Copy Number
3.14. Reverse Transcription-Quantitative Polymerase Chain Reaction (RT-qPCR)
3.15. Measurement of 8-Oxo-7,8-dihydro-20-deoxyguanosine (8-Oxo-Dg) and 8-Oxo-G Levels
3.16. Measurement of Cytokines
3.17. Library Preparation and Sequencing
3.18. Bioinformatics
3.19. Statistical Analysis
4. Conclusions
Author Contributions
Funding
Acknowledgments
Conflicts of Interest
References
- Kievit, F.M.; Zhang, M. Cancer nanotheranostics: Improving imaging and therapy by targeted delivery across biological barriers. Adv. Mater. 2011, 23, H217–H247. [Google Scholar] [CrossRef] [PubMed] [Green Version]
- Namiki, Y.; Fuchigami, T.; Tada, N.; Kawamura, R.; Matsunuma, S.; Kitamoto, Y.; Nakagawa, M. Nanomedicine for cancer: Lipid-based nanostructures for drug delivery and monitoring. Acc. Chem. Res. 2011, 44, 1080–1093. [Google Scholar] [CrossRef] [PubMed]
- Xu, R.; Wang, D.; Zhang, J.; Li, Y. Shape-dependent catalytic activity of silver nanoparticles for the oxidation of styrene. Chem. Asian J. 2006, 1, 888–893. [Google Scholar] [CrossRef] [PubMed]
- Arvizo, R.R.; Bhattacharyya, S.; Kudgus, R.A.; Giri, K.; Bhattacharya, R.; Mukherjee, P. Intrinsic therapeutic applications of noble metal nanoparticles: Past, present and future. Chem. Soc. Rev. 2012, 41, 2943–2970. [Google Scholar] [CrossRef] [PubMed] [Green Version]
- Gehrke, H.; Pelka, J.; Hartinger, C.G.; Blank, H.; Bleimund, F.; Schneider, R.; Gerthsen, D.; Brase, S.; Crone, M.; Turk, M.; et al. Platinum nanoparticles and their cellular uptake and DNA platination at non-cytotoxic concentrations. Arch. Toxicol. 2011, 85, 799–812. [Google Scholar] [CrossRef]
- Horie, M.; Kato, H.; Endoh, S.; Fujita, K.; Nishio, K.; Komaba, L.K.; Fukui, H.; Nakamura, A.; Miyauchi, A.; Nakazato, T.; et al. Evaluation of cellular influences of platinum nanoparticles by stable medium dispersion. Metallomics 2011, 3, 1244–1252. [Google Scholar] [CrossRef] [PubMed]
- McFarlane, S.; Manchee, C.P.K.; Silverstone, J.W.; Veinot, J.; Meldrum, A. Synthesis and Operation of Fluorescent-core Microcavities for Refractometric Sensing. J. Vis. Exp. 2013, 73, e50256. [Google Scholar] [CrossRef] [Green Version]
- Gurunathan, S.; Han, J.W.; Eppakayala, V.; Jeyaraj, M.; Kim, J.H. Cytotoxicity of biologically synthesized silver nanoparticles in MDA-MB-231 human breast cancer cells. BioMed Res. Int. 2013, 535796. [Google Scholar] [CrossRef] [Green Version]
- Johnstone, T.C.; Suntharalingam, K.; Lippard, S.J. The Next Generation of Platinum Drugs: Targeted Pt(II) Agents, Nanoparticle Delivery, and Pt(IV) Prodrugs. Chem. Rev. 2016, 116, 3436–3486. [Google Scholar] [CrossRef] [Green Version]
- Wang, Y.; Yang, J.; Liu, H.; Wang, X.; Zhou, Z.; Huang, Q.; Song, D.; Cai, X.; Li, L.; Lin, K.; et al. Osteotropic peptide-mediated bone targeting for photothermal treatment of bone tumors. Biomaterials 2017, 114, 97–105. [Google Scholar] [CrossRef]
- Doherty, R.E.; Sazanovich, I.V.; McKenzie, L.K.; Stasheuski, A.S.; Coyle, R.; Baggaley, E.; Bottomley, S.; Weinstein, J.A.; Bryant, H.E. Photodynamic killing of cancer cells by a Platinum(II) complex with cyclometallating ligand. Sci. Rep. 2016, 6, 22668. [Google Scholar] [CrossRef] [Green Version]
- Hussain, M.A.; Yang, M.; Lee, T.J.; Kim, J.W.; Choi, B.G. High density decoration of noble metal nanoparticles on polydopamine-functionalized molybdenum disulphide. J. Colloid Interface Sci. 2015, 451, 216–220. [Google Scholar] [CrossRef] [PubMed]
- Comfort, K.K.; Maurer, E.I.; Braydich-Stolle, L.K.; Hussain, S.M. Interference of silver, gold, and iron oxide nanoparticles on epidermal growth factor signal transduction in epithelial cells. ACS Nano 2011, 5, 10000–10008. [Google Scholar] [CrossRef] [PubMed]
- Comfort, K.K.; Maurer, E.I.; Hussain, S.M. Slow release of ions from internalized silver nanoparticles modifies the epidermal growth factor signaling response. Colloids Surf. B Biointerfaces 2014, 123, 136–142. [Google Scholar] [CrossRef] [PubMed]
- Bendale, Y.; Bendale, V.; Paul, S. Evaluation of cytotoxic activity of platinum nanoparticles against normal and cancer cells and its anticancer potential through induction of apoptosis. Integr. Med. Res. 2017, 6, 141–148. [Google Scholar] [CrossRef]
- Brown, A.L.; Kai, M.P.; DuRoss, A.N.; Sahay, G.; Sun, C. Biodistribution and Toxicity of Micellar Platinum Nanoparticles in Mice via Intravenous Administration. Nanomaterials 2018, 8, 410. [Google Scholar] [CrossRef] [Green Version]
- Gurunathan, S.; Jeyaraj, M.; Kang, M.H.; Kim, J.H. Graphene Oxide(-)Platinum Nanoparticle Nanocomposites: A Suitable Biocompatible Therapeutic Agent for Prostate Cancer. Polymers 2019, 11, 733. [Google Scholar] [CrossRef] [Green Version]
- Gurunathan, S.; Jeyaraj, M.; Kang, M.H.; Kim, J.H. Tangeretin-Assisted Platinum Nanoparticles Enhance the Apoptotic Properties of Doxorubicin: Combination Therapy for Osteosarcoma Treatment. Nanomaterials 2019, 9, 1089. [Google Scholar] [CrossRef] [Green Version]
- Gatto, F.; Moglianetti, M.; Pompa, P.P.; Bardi, G. Platinum Nanoparticles Decrease Reactive Oxygen Species and Modulate Gene Expression without Alteration of Immune Responses in THP-1 Monocytes. Nanomaterials 2018, 8, 392. [Google Scholar] [CrossRef] [Green Version]
- Katsumi, H.; Fukui, K.; Sato, K.; Maruyama, S.; Yamashita, S.; Mizumoto, E.; Kusamori, K.; Oyama, M.; Sano, M.; Sakane, T.; et al. Pharmacokinetics and preventive effects of platinum nanoparticles as reactive oxygen species scavengers on hepatic ischemia/reperfusion injury in mice. Metallomics 2014, 6, 1050–1056. [Google Scholar] [CrossRef]
- Asharani, P.V.; Lianwu, Y.; Gong, Z.; Valiyaveettil, S. Comparison of the toxicity of silver, gold and platinum nanoparticles in developing zebrafish embryos. Nanotoxicology 2011, 5, 43–54. [Google Scholar] [CrossRef]
- Gurunathan, S.; Jeyaraj, M.; Kang, M.H.; Kim, J.H. The Effects of Apigenin-Biosynthesized Ultra-Small Platinum Nanoparticles on the Human Monocytic THP-1 Cell Line. Cells 2019, 8, 444. [Google Scholar] [CrossRef] [PubMed] [Green Version]
- Kostova, I. Platinum complexes as anticancer agents. Recent Pat. Anti-Cancer Drug Discov. 2006, 1, 1–22. [Google Scholar] [CrossRef] [PubMed]
- Stephens, I.E.; Bondarenko, A.S.; Perez-Alonso, F.J.; Calle-Vallejo, F.; Bech, L.; Johansson, T.P.; Jepsen, A.K.; Frydendal, R.; Knudsen, B.P.; Rossmeisl, J.; et al. Tuning the activity of Pt(111) for oxygen electroreduction by subsurface alloying. J. Am. Chem. Soc. 2011, 133, 5485–5491. [Google Scholar] [CrossRef] [PubMed]
- Nellore, J.; Pauline, C.; Amarnath, K. Bacopa monnieri Phytochemicals Mediated Synthesis of Platinum Nanoparticles and Its Neurorescue Effect on 1-Methyl 4-Phenyl 1,2,3,6 Tetrahydropyridine-Induced Experimental Parkinsonism in Zebrafish. J. Neurodegener. Dis. 2013, 2013, 972391. [Google Scholar] [PubMed] [Green Version]
- Alshatwi, A.A.; Athinarayanan, J.; Vaiyapuri Subbarayan, P. Green synthesis of platinum nanoparticles that induce cell death and G2/M-phase cell cycle arrest in human cervical cancer cells. J. Mater. Sci. Mater. Med. 2015, 26, 7. [Google Scholar] [CrossRef] [PubMed]
- Pelka, J.; Gehrke, H.; Esselen, M.; Turk, M.; Crone, M.; Brase, S.; Muller, T.; Blank, H.; Send, W.; Zibat, V.; et al. Cellular uptake of platinum nanoparticles in human colon carcinoma cells and their impact on cellular redox systems and DNA integrity. Chem. Res. Toxicol. 2009, 22, 649–659. [Google Scholar] [CrossRef]
- Nakashima, A.; Higashisaka, K.; Kusabiraki, T.; Aoki, A.; Ushijima, A.; Ono, Y.; Tsuda, S.; Shima, T.; Yoshino, O.; Nagano, K.; et al. Autophagy is a new protective mechanism against the cytotoxicity of platinum nanoparticles in human trophoblasts. Sci. Rep. 2019, 9, 5478. [Google Scholar] [CrossRef]
- Lebedova, J.; Hedberg, Y.S.; Odnevall Wallinder, I.; Karlsson, H.L. Size-dependent genotoxicity of silver, gold and platinum nanoparticles studied using the mini-gel comet assay and micronucleus scoring with flow cytometry. Mutagenesis 2018, 33, 77–85. [Google Scholar] [CrossRef] [Green Version]
- Sahin, O.; Ozdemir, U.O.; Seferoglu, N.; Genc, Z.K.; Kaya, K.; Aydiner, B.; Tekin, S.; Seferoglu, Z. New platinum (II) and palladium (II) complexes of coumarin-thiazole Schiff base with a fluorescent chemosensor properties: Synthesis, spectroscopic characterization, X-ray structure determination, in vitro anticancer activity on various human carcinoma cell lines and computational studies. J. Photochem. Photobiol. B Biol. 2018, 178, 428–439. [Google Scholar]
- Nejdl, L.; Kudr, J.; Moulick, A.; Hegerova, D.; Ruttkay-Nedecky, B.; Gumulec, J.; Cihalova, K.; Smerkova, K.; Dostalova, S.; Krizkova, S.; et al. Platinum nanoparticles induce damage to DNA and inhibit DNA replication. PLoS ONE 2017, 12, e0180798. [Google Scholar] [CrossRef] [Green Version]
- Diabate, S.; Mulhopt, S.; Paur, H.R.; Krug, H.F. The response of a co-culture lung model to fine and ultrafine particles of incinerator fly ash at the air-liquid interface. Altern. Lab. Anim. 2008, 36, 285–298. [Google Scholar] [CrossRef] [PubMed]
- Buchtelova, H.; Dostalova, S.; Michalek, P.; Krizkova, S.; Strmiska, V.; Kopel, P.; Hynek, D.; Richtera, L.; Ridoskova, A.; Adam, P.; et al. Size-related cytotoxicological aspects of polyvinylpyrrolidone-capped platinum nanoparticles. Food Chem. Toxicol. 2017, 105, 337–346. [Google Scholar] [CrossRef] [PubMed]
- Labrador-Rached, C.J.; Browning, R.T.; Braydich-Stolle, L.K.; Comfort, K.K. Toxicological Implications of Platinum Nanoparticle Exposure: Stimulation of Intracellular Stress, Inflammatory Response, and Akt Signaling In Vitro. J. Toxicol. 2018, 2018, 1367801. [Google Scholar] [CrossRef] [PubMed] [Green Version]
- Safar, R.; Doumandji, Z.; Saidou, T.; Ferrari, L.; Nahle, S.; Rihn, B.H.; Joubert, O. Cytotoxicity and global transcriptional responses induced by zinc oxide nanoparticles NM 110 in PMA-differentiated THP-1 cells. Toxicol. Lett. 2019, 308, 65–73. [Google Scholar] [CrossRef] [PubMed]
- Jones, C.F.; Grainger, D.W. In vitro assessments of nanomaterial toxicity. Adv. Drug Deliv. Rev. 2009, 61, 438–456. [Google Scholar] [CrossRef] [PubMed] [Green Version]
- Nguyen, D.; Duguet, E.; Bourgeat-Lami, E.; Ravaine, S. An Easy Way to Control the Morphology of Colloidal Polymer-Oxide Supraparticles through Seeded Dispersion Polymerization. Langmuir 2010, 26, 6086–6090. [Google Scholar] [CrossRef] [PubMed]
- Dipankar, C.; Murugan, S. The green synthesis, characterization and evaluation of the biological activities of silver nanoparticles synthesized from Iresine herbstii leaf aqueous extracts. Colloid Surf. B 2012, 98, 112–119. [Google Scholar] [CrossRef]
- Gurunathan, S.; Kang, M.H.; Kim, J.H. Combination Effect of Silver Nanoparticles and Histone Deacetylases Inhibitor in Human Alveolar Basal Epithelial Cells. Molecules 2018, 23, 2046. [Google Scholar] [CrossRef] [Green Version]
- Borowik, A.; Banasiuk, R.; Derewonko, N.; Rychlowski, M.; Krychowiak-Masnicka, M.; Wyrzykowski, D.; Ziabka, M.; Woziwodzka, A.; Krolicka, A.; Piosik, J. Interactions of newly synthesized platinum nanoparticles with ICR-191 and their potential application. Sci. Rep. 2019, 9, 4987. [Google Scholar] [CrossRef]
- Asharani, P.V.; Xinyi, N.; Hande, M.P.; Valiyaveettil, S. DNA damage and p53-mediated growth arrest in human cells treated with platinum nanoparticles. Nanomedicine (Lond) 2010, 5, 51–64. [Google Scholar] [CrossRef]
- Prasek, M.; Sawosz, E.; Jaworski, S.; Grodzik, M.; Ostaszewska, T.; Kamaszewski, M.; Wierzbicki, M.; Chwalibog, A. Influence of nanoparticles of platinum on chicken embryo development and brain morphology. Nanoscale Res. Lett. 2013, 8, 251. [Google Scholar] [CrossRef] [PubMed] [Green Version]
- Mohammadi, A.; Mohammadi, S.; Moghaddam, A.B.; Masoumi, V.; Walker, R.B. Electropolymerized Fluorinated Aniline-Based Fiber for Headspace Solid-Phase Microextraction and Gas Chromatographic Determination of Benzaldehyde in Injectable Pharmaceutical Formulations. J. Chromatogr. Sci. 2014, 52, 971–976. [Google Scholar] [CrossRef] [PubMed] [Green Version]
- Kutwin, M.; Sawosz, E.; Jaworski, S.; Hinzmann, M.; Wierzbicki, M.; Hotowy, A.; Grodzik, M.; Winnicka, A.; Chwalibog, A. Investigation of platinum nanoparticle properties against U87 glioblastoma multiforme. Arch. Med. Sci. 2017, 13, 1322–1334. [Google Scholar] [CrossRef] [PubMed]
- Kutwin, M.; Sawosz, E.; Jaworski, S.; Wierzbicki, M.; Strojny, B.; Grodzik, M.; Chwalibog, A. Assessment of the proliferation status of glioblastoma cell and tumour tissue after nanoplatinum treatment. PLoS ONE 2017, 12, e0178277. [Google Scholar] [CrossRef] [PubMed] [Green Version]
- Loan, T.T.; Do, L.T.; Yoo, H. Platinum Nanoparticles Induce Apoptosis on Raw 264.7 Macrophage Cells. J. Nanosci. Nanotechnol. 2018, 18, 861–864. [Google Scholar] [CrossRef] [PubMed]
- Shiny, P.J.; Mukherjee, A.; Chandrasekaran, N. Haemocompatibility assessment of synthesised platinum nanoparticles and its implication in biology. Bioprocess Biosyst. Eng. 2014, 37, 991–997. [Google Scholar] [CrossRef]
- Kim, W.K.; Kim, J.C.; Park, H.J.; Sul, O.J.; Lee, M.H.; Kim, J.S.; Choi, H.S. Platinum nanoparticles reduce ovariectomy-induced bone loss by decreasing osteoclastogenesis. Exp. Mol. Med. 2012, 44, 432–439. [Google Scholar] [CrossRef]
- Rahman, I.; MacNee, W. Antioxidant pharmacological therapies for COPD. Curr. Opin. Pharmacol. 2012, 12, 256–265. [Google Scholar] [CrossRef] [Green Version]
- Valdiglesias, V.; Fernandez-Bertolez, N.; Kilic, G.; Costa, C.; Costa, S.; Fraga, S.; Bessa, M.J.; Pasaro, E.; Teixeira, J.P.; Laffon, B. Are iron oxide nanoparticles safe? Current knowledge and future perspectives. J. Trace Elem. Med. Biol. 2016, 38, 53–63. [Google Scholar] [CrossRef] [Green Version]
- Barcinska, E.; Wierzbicka, J.; Zauszkiewicz-Pawlak, A.; Jacewicz, D.; Dabrowska, A.; Inkielewicz-Stepniak, I. Role of Oxidative and Nitro-Oxidative Damage in Silver Nanoparticles Cytotoxic Effect against Human Pancreatic Ductal Adenocarcinoma Cells. Oxidative Med. Cell. Longev. 2018. [Google Scholar] [CrossRef] [Green Version]
- Bedoya, F.J.; Salguero-Aranda, C.; Cahuana, G.M.; Tapia-Limonchi, R.; Soria, B.; Tejedo, J.R. Regulation of pancreatic beta-cell survival by nitric oxide: Clinical relevance. Islets 2012, 4, 108–118. [Google Scholar] [CrossRef] [Green Version]
- Rainville, L.C.; Carolan, D.; Varela, A.C.; Doyle, H.; Sheehan, D. Proteomic evaluation of citrate-coated silver nanoparticles toxicity in Daphnia magna. Analyst 2014, 139, 1678–1686. [Google Scholar] [CrossRef] [PubMed] [Green Version]
- Haase, A.; Rott, S.; Mantion, A.; Graf, P.; Plendl, J.; Thunemann, A.F.; Meier, W.P.; Taubert, A.; Luch, A.; Reiser, G. Effects of Silver Nanoparticles on Primary Mixed Neural Cell Cultures: Uptake, Oxidative Stress and Acute Calcium Responses. Toxicol. Sci. 2012, 126, 457–468. [Google Scholar] [CrossRef] [PubMed]
- Haase, A.; Arlinghaus, H.F.; Tentschert, J.; Jungnickel, H.; Graf, P.; Mantion, A.; Draude, F.; Galla, S.; Plendl, J.; Goetz, M.E.; et al. Application of Laser Postionization Secondary Neutral Mass Spectrometry/Time-of-Flight Secondary Ion Mass Spectrometry in Nanotoxicology: Visualization of Nanosilver in Human Macrophages and Cellular Responses. ACS Nano 2011, 5, 3059–3068. [Google Scholar] [CrossRef] [PubMed]
- Verano-Braga, T.; Miethling-Graff, R.; Wojdyla, K.; Rogowska-Wrzesinska, A.; Brewer, J.R.; Erdmann, H.; Kjeldsen, F. Insights into the Cellular Response Triggered by Silver Nanoparticles Using Quantitative Proteomics. ACS Nano 2014, 8, 2161–2175. [Google Scholar] [CrossRef] [PubMed]
- Driessen, M.D.; Mues, S.; Vennemann, A.; Hellack, B.; Bannuscher, A.; Vimalakanthan, V.; Riebeling, C.; Ossig, R.; Wiemann, M.; Schnekenburger, J.; et al. Proteomic analysis of protein carbonylation: A useful tool to unravel nanoparticle toxicity mechanisms. Part. Fibre Toxicol. 2015, 12, 36. [Google Scholar] [CrossRef] [Green Version]
- Butterfield, D.A.; Dalle-Donne, I. Redox Proteomics. Antioxid. Redox Signal. 2012, 17, 1487–1489. [Google Scholar] [CrossRef] [Green Version]
- Dalle-Donne, I.; Aldini, G.; Carini, M.; Colombo, R.; Rossi, R.; Milzani, A. Protein carbonylation, cellular dysfunction, and disease progression. J. Cell. Mol. Med. 2006, 10, 389–406. [Google Scholar] [CrossRef]
- Butterfield, D.A.; Perluigi, M.; Reed, T.; Muharib, T.; Hughes, C.P.; Robinson, R.A.S.; Sultana, R. Redox Proteomics in Selected Neurodegenerative Disorders: From Its Infancy to Future Applications. Antioxid. Redox Signal. 2012, 17, 1610–1655. [Google Scholar] [CrossRef] [Green Version]
- Ergin, V.; Bali, E.B.; Hariry, R.E.; Karasu, C. Natural products and the aging process. Horm. Mol. Biol. Clin. Investig. 2013, 16, 55–64. [Google Scholar] [CrossRef]
- Cabiscol, E.; Tamarit, J.; Ros, J. Protein carbonylation: Proteomics, specificity and relevance to aging. Mass Spectrom. Rev. 2014, 33, 21–48. [Google Scholar] [CrossRef] [PubMed]
- Watanabe, J.; Yamada, M.; Niibe, K.; Zhang, M.; Kondo, T.; Ishibashi, M.; Egusa, H. Preconditioning of bone marrow-derived mesenchymal stem cells with N-acetyl-L-cysteine enhances bone regeneration via reinforced resistance to oxidative stress. Biomaterials 2018, 185, 25–38. [Google Scholar] [CrossRef] [PubMed]
- Chae, H.Z.; Kim, H.J.; Kang, S.W.; Rhee, S.G. Characterization of three isoforms of mammalian peroxiredoxin that reduce peroxides in the presence of thioredoxin. Diabetes Res. Clin. Pract. 1999, 45, 101–112. [Google Scholar] [CrossRef]
- Lillig, C.H.; Holmgren, A. Thioredoxin and related molecules--from biology to health and disease. Antioxid. Redox Signal. 2007, 9, 25–47. [Google Scholar] [CrossRef] [PubMed]
- Nordberg, J.; Arner, E.S. Reactive oxygen species, antioxidants, and the mammalian thioredoxin system. Free. Radic. Biol. Med. 2001, 31, 1287–1312. [Google Scholar] [CrossRef]
- Arner, E.S.; Holmgren, A. Physiological functions of thioredoxin and thioredoxin reductase. Eur. J. Biochem. 2000, 267, 6102–6109. [Google Scholar] [CrossRef] [PubMed]
- Manke, A.; Wang, L.; Rojanasakul, Y. Mechanisms of nanoparticle-induced oxidative stress and toxicity. BioMed Res. Int. 2013, 942916. [Google Scholar] [CrossRef] [Green Version]
- Ahamed, M.; Akhtar, M.J.; Raja, M.; Ahmad, I.; Siddiqui, M.K.; AlSalhi, M.S.; Alrokayan, S.A. ZnO nanorod-induced apoptosis in human alveolar adenocarcinoma cells via p53, survivin and bax/bcl-2 pathways: Role of oxidative stress. Nanomed. Nanotechnol. Biol. Med. 2011, 7, 904–913. [Google Scholar] [CrossRef]
- Arora, S.; Jain, J.; Rajwade, J.M.; Paknikar, K.M. Cellular responses induced by silver nanoparticles: In vitro studies. Toxicol. Lett. 2008, 179, 93–100. [Google Scholar] [CrossRef]
- Jin, C.Y.; Zhu, B.S.; Wang, X.F.; Lu, Q.H. Cytotoxicity of titanium dioxide nanoparticles in mouse fibroblast cells. Chem. Res. Toxicol. 2008, 21, 1871–1877. [Google Scholar] [CrossRef]
- Bhatti, F.U.R.; Kim, S.J.; Yi, A.K.; Hasty, K.A.; Cho, H. Cytoprotective role of vitamin E in porcine adipose-tissue-derived mesenchymal stem cells against hydrogen-peroxide-induced oxidative stress. Cell Tissue Res. 2018, 374, 111–120. [Google Scholar] [CrossRef] [PubMed]
- Pieczenik, S.R.; Neustadt, J. Mitochondrial dysfunction and molecular pathways of disease. Exp. Mol. Pathol. 2007, 83, 84–92. [Google Scholar] [CrossRef] [PubMed]
- Almeer, R.S.; Ali, D.; Alarifi, S.; Alkahtani, S.; Almansour, M. Green Platinum Nanoparticles Interaction With HEK293 Cells: Cellular Toxicity, Apoptosis, and Genetic Damage. Dose -Response 2018, 16. [Google Scholar] [CrossRef] [PubMed]
- Jiang, Q.; Liu, G.; Wang, X.Q.; Hou, Y.Q.; Duan, Y.H.; Wu, G.Y.; Yin, Y.L.; Yao, K. Mitochondrial pathway is involved in the protective effects of alpha-ketoglutarate on hydrogen peroxide induced damage to intestinal cells. Oncotarget 2017, 8, 74820–74835. [Google Scholar] [CrossRef] [Green Version]
- Ben Safta, T.; Ziani, L.; Favre, L.; Lamendour, L.; Gros, G.; Mami-Chouaib, F.; Martinvalet, D.; Chouaib, S.; Thiery, J. Granzyme B-Activated p53 Interacts with Bcl-2 To Promote Cytotoxic Lymphocyte-Mediated Apoptosis. J. Immunol. 2015, 194, 418–428. [Google Scholar] [CrossRef] [Green Version]
- Ismail, A.M.; In, L.L.A.; Tasyriq, M.; Syamsir, D.R.; Awang, K.; Mustafa, A.H.O.; Idris, O.F.; Fadl-Elmula, I.; Hasima, N. Extra virgin olive oil potentiates the effects of aromatase inhibitors via glutathione depletion in estrogen receptor-positive human breast cancer (MCF-7) cells. Food Chem. Toxicol. 2013, 62, 817–824. [Google Scholar] [CrossRef]
- Xue, M.Z.; Momiji, H.; Rabbani, N.; Barker, G.; Bretschneider, T.; Shmygol, A.; Rand, D.A.; Thornalley, P.J. Frequency Modulated Translocational Oscillations of Nrf2 Mediate the Antioxidant Response Element Cytoprotective Transcriptional Response. Antioxid. Redox Signal. 2015, 23, 613–629. [Google Scholar] [CrossRef] [Green Version]
- Chistiakov, D.A.; Sobenin, I.A.; Revin, V.V.; Orekhov, A.N.; Bobryshev, Y.V. Mitochondrial Aging and Age-Related Dysfunction of Mitochondria. BioMed Res. Int. 2014. [Google Scholar] [CrossRef] [Green Version]
- Murphy, M.P. How mitochondria produce reactive oxygen species. Biochem. J. 2009, 417, 1–13. [Google Scholar] [CrossRef] [Green Version]
- Beckman, K.B.; Ames, B.N. Detection and quantification of oxidative adducts of mitochondrial DNA. Methods Enzymol. 1996, 264, 442–453. [Google Scholar]
- Valko, M.; Morris, H.; Cronin, M.T. Metals, toxicity and oxidative stress. Curr. Med. Chem. 2005, 12, 1161–1208. [Google Scholar] [CrossRef] [Green Version]
- Mootha, V.K.; Bunkenborg, J.; Olsen, J.V.; Hjerrild, M.; Wisniewski, J.R.; Stahl, E.; Bolouri, M.S.; Ray, H.N.; Sihag, S.; Kamal, M.; et al. Integrated analysis of protein composition, tissue diversity, and gene regulation in mouse mitochondria. Cell 2003, 115, 629–640. [Google Scholar] [CrossRef] [Green Version]
- Canto, C.; Auwerx, J. PGC-1 alpha, SIRT1 and AMPK, an energy sensing network that controls energy expenditure. Curr. Opin. Lipidol. 2009, 20, 98–105. [Google Scholar] [CrossRef] [Green Version]
- Malhotra, J.D.; Kaufman, R.J. ER Stress and Its Functional Link to Mitochondria: Role in Cell Survival and Death. Cold Spring Harb. Perspect. Biol. 2011, 3, a004424. [Google Scholar] [CrossRef]
- Amen, O.M.; Sarker, S.D.; Ghildyal, R.; Arya, A. Endoplasmic Reticulum Stress Activates Unfolded Protein Response Signaling and Mediates Inflammation, Obesity, and Cardiac Dysfunction: Therapeutic and Molecular Approach. Front. Pharmacol. 2019, 10. [Google Scholar] [CrossRef] [Green Version]
- Christen, V.; Fent, K. Silica nanoparticles induce endoplasmic reticulum stress response and activate mitogen activated kinase (MAPK) signalling. Toxicol. Rep. 2016, 3, 832–840. [Google Scholar] [CrossRef]
- Shen, T.; Li, Y.; Chen, Z.G.; Liang, S.; Guo, Z.Y.; Wang, P.; Wu, Q.J.; Ba, G.; Fu, Q. CHOP negatively regulates Polo-like kinase 2 expression via recruiting C/EBP alpha to the upstream-promoter in human osteosarcoma cell line during ER stress. Int. J. Biochem. Cell B 2017, 89, 207–215. [Google Scholar] [CrossRef]
- Schroder, M.; Kaufman, R.J. ER stress and the unfolded protein response. Mutat. Res. 2005, 569, 29–63. [Google Scholar] [CrossRef]
- Ron, D.; Walter, P. Signal integration in the endoplasmic reticulum unfolded protein response. Nat. Rev. Mol. Cell Biol. 2007, 8, 519–529. [Google Scholar] [CrossRef]
- Tsujii, S.; Ishisaka, M.; Shimazawa, M.; Hashizume, T.; Hara, H. Zonisamide suppresses endoplasmic reticulum stress-induced neuronal cell damage in vitro and in vivo. Eur. J. Pharmacol. 2015, 746, 301–307. [Google Scholar] [CrossRef]
- Go, B.S.; Kim, J.; Yang, J.H.; Choe, E.S. Psychostimulant-Induced Endoplasmic Reticulum Stress and Neurodegeneration. Mol. Neurobiol. 2017, 54, 4041–4048. [Google Scholar] [CrossRef]
- Yoshida, H. ER stress and diseases. FEBS J. 2007, 274, 630–658. [Google Scholar] [CrossRef]
- Wei, X.; Qi, Y.; Jia, N.; Zhou, Q.; Zhang, S.; Wang, Y. Hyperbaric oxygen treatment sensitizes gastric cancer cells to melatonin-induced apoptosis through multiple pathways. J. Cell. Biochem. 2018, 119, 6723–6731. [Google Scholar] [CrossRef]
- Danial, N.N.; Korsmeyer, S.J. Cell death: Critical control points. Cell 2004, 116, 205–219. [Google Scholar] [CrossRef] [Green Version]
- Puthalakath, H.; O’Reilly, L.A.; Gunn, P.; Lee, L.; Kelly, P.N.; Huntington, N.D.; Hughes, P.D.; Michalak, E.M.; McKimm-Breschkin, J.; Motoyama, N.; et al. ER stress triggers apoptosis by activating BH3-only protein Bim. Cell 2007, 129, 1337–1349. [Google Scholar] [CrossRef] [Green Version]
- Galehdar, Z.; Swan, P.; Fuerth, B.; Callaghan, S.M.; Park, D.S.; Cregan, S.P. Neuronal apoptosis induced by endoplasmic reticulum stress is regulated by ATF4-CHOP-mediated induction of the Bcl-2 homology 3-only member PUMA. J. Neurosci. 2010, 30, 16938–16948. [Google Scholar] [CrossRef]
- McCullough, K.D.; Martindale, J.L.; Klotz, L.O.; Aw, T.Y.; Holbrook, N.J. Gadd153 sensitizes cells to endoplasmic reticulum stress by down-regulating Bcl2 and perturbing the cellular redox state. Mol. Cell. Biol. 2001, 21, 1249–1259. [Google Scholar] [CrossRef] [Green Version]
- Morishima, N.; Nakanishi, K.; Takenouchi, H.; Shibata, T.; Yasuhiko, Y. An endoplasmic reticulum stress-specific caspase cascade in apoptosis. Cytochrome c-independent activation of caspase-9 by caspase-12. J. Biol. Chem. 2002, 277, 34287–34294. [Google Scholar] [CrossRef] [Green Version]
- Nakabeppu, Y.; Kajitani, K.; Sakamoto, K.; Yamaguchi, H.; Tsuchimoto, D. MTH1, an oxidized purine nucleoside triphosphatase, prevents the cytotoxicity and neurotoxicity of oxidized purine nucleotides. DNA Repair 2006, 5, 761–772. [Google Scholar] [CrossRef]
- Nakabeppu, Y. Cellular levels of 8-oxoguanine in either DNA or the nucleotide pool play pivotal roles in carcinogenesis and survival of cancer cells. Int. J. Mol. Sci. 2014, 15, 12543–12557. [Google Scholar] [CrossRef] [Green Version]
- Guan, R.; Kang, T.; Lu, F.; Zhang, Z.; Shen, H.; Liu, M. Cytotoxicity, oxidative stress, and genotoxicity in human hepatocyte and embryonic kidney cells exposed to ZnO nanoparticles. Nanoscale Res. Lett. 2012, 7, 602. [Google Scholar] [CrossRef] [Green Version]
- Gong, C.; Tao, G.; Yang, L.; Liu, J.; He, H.; Zhuang, Z. The role of reactive oxygen species in silicon dioxide nanoparticle-induced cytotoxicity and DNA damage in HaCaT cells. Mol. Biol. Rep. 2012, 39, 4915–4925. [Google Scholar] [CrossRef]
- Magdolenova, Z.; Lorenzo, Y.; Collins, A.; Dusinska, M. Can Standard Genotoxicity Tests Be Applied to Nanoparticles? J. Toxicol. Envieon. Heal Part A 2012, 75, 800–806. [Google Scholar] [CrossRef]
- Zhang, K.Z.; Kaufman, R.J. Identification and characterization of endoplasmic reticulum stress-induced apoptosis In vivo. Method Enzym. 2008, 442, 395–419. [Google Scholar]
- Xue, X.; Piao, J.H.; Nakajima, A.; Sakon-Komazawa, S.; Kojima, Y.; Mori, K.; Yagita, H.; Okumura, K.; Harding, H.; Nakano, H. Tumor necrosis factor alpha (TNFalpha) induces the unfolded protein response (UPR) in a reactive oxygen species (ROS)-dependent fashion, and the UPR counteracts ROS accumulation by TNFalpha. J. Biol. Chem. 2005, 280, 33917–33925. [Google Scholar] [CrossRef] [Green Version]
- Lin, M.L.; Chen, S.S.; Lu, Y.C.; Liang, R.Y.; Ho, Y.T.; Yang, C.Y.; Chung, J.G. Rhein induces apoptosis through induction of endoplasmic reticulum stress and Ca2+-dependent mitochondrial death pathway in human nasopharyngeal carcinoma cells. Anticancer. Res. 2007, 27, 3313–3322. [Google Scholar]
- Tsuchiya, S.; Yamabe, M.; Yamaguchi, Y.; Kobayashi, Y.; Konno, T.; Tada, K. Establishment and characterization of a human acute monocytic leukemia cell line (THP-1). Int. J. Cancer 1980, 26, 171–176. [Google Scholar] [CrossRef]
- Wagner, S.C.; Roskamp, M.; Pallerla, M.; Araghi, R.R.; Schlecht, S.; Koksch, B. Nanoparticle-Induced Folding and Fibril Formation of Coiled-Coil-Based Model Peptides. Small 2010, 6, 1321–1328. [Google Scholar] [CrossRef]
- McGeachy, M.J.; Cua, D.J.; Gaffen, S.L. The IL-17 Family of Cytokines in Health and Disease. Immunity 2019, 50, 892–906. [Google Scholar] [CrossRef]
- Yan, M.J.; Yang, S.B.; Meng, F.B.; Zhao, Z.H.; Tian, Z.S.; Yang, P. MicroRNA 199a-5p induces apoptosis by targeting JunB. Sci. Rep. 2018, 8, 6699. [Google Scholar] [CrossRef]
- Yuan, Y.G.; Wang, Y.H.; Xing, H.H.; Gurunathan, S. Quercetin-mediated synthesis of graphene oxide-silver nanoparticle nanocomposites: A suitable alternative nanotherapy for neuroblastoma. Int. J. Nanomed. 2017, 12, 5819–5839. [Google Scholar] [CrossRef] [Green Version]


© 2020 by the authors. Licensee MDPI, Basel, Switzerland. This article is an open access article distributed under the terms and conditions of the Creative Commons Attribution (CC BY) license (http://creativecommons.org/licenses/by/4.0/).
Share and Cite
Gurunathan, S.; Jeyaraj, M.; La, H.; Yoo, H.; Choi, Y.; Do, J.T.; Park, C.; Kim, J.-H.; Hong, K. Anisotropic Platinum Nanoparticle-Induced Cytotoxicity, Apoptosis, Inflammatory Response, and Transcriptomic and Molecular Pathways in Human Acute Monocytic Leukemia Cells. Int. J. Mol. Sci. 2020, 21, 440. https://0-doi-org.brum.beds.ac.uk/10.3390/ijms21020440
Gurunathan S, Jeyaraj M, La H, Yoo H, Choi Y, Do JT, Park C, Kim J-H, Hong K. Anisotropic Platinum Nanoparticle-Induced Cytotoxicity, Apoptosis, Inflammatory Response, and Transcriptomic and Molecular Pathways in Human Acute Monocytic Leukemia Cells. International Journal of Molecular Sciences. 2020; 21(2):440. https://0-doi-org.brum.beds.ac.uk/10.3390/ijms21020440
Chicago/Turabian StyleGurunathan, Sangiliyandi, Muniyandi Jeyaraj, Hyeonwoo La, Hyunjin Yoo, Youngsok Choi, Jeong Tae Do, Chankyu Park, Jin-Hoi Kim, and Kwonho Hong. 2020. "Anisotropic Platinum Nanoparticle-Induced Cytotoxicity, Apoptosis, Inflammatory Response, and Transcriptomic and Molecular Pathways in Human Acute Monocytic Leukemia Cells" International Journal of Molecular Sciences 21, no. 2: 440. https://0-doi-org.brum.beds.ac.uk/10.3390/ijms21020440