Article

A Biostimulant Obtained from the Seaweed Ascophyllum nodosum Protects Arabidopsis thaliana from Severe Oxidative Stress

by
Mohammad Amin Omidbakhshfard
1,†,
Neerakkal Sujeeth
2,*,†,
Saurabh Gupta
1,3,†,
Nooshin Omranian
1,4,
Kieran J. Guinan
2,
Yariv Brotman
1,
Zoran Nikoloski
4,5,
Alisdair R. Fernie
1,5,
Bernd Mueller-Roeber
1,3,5 and
Tsanko S. Gechev
5,6
1
Max Planck Institute of Molecular Plant Physiology, Am Mühlenberg 1, 14476 Potsdam-Golm, Germany
2
BioAtlantis Ltd., Clash Industrial Estate, Tralee, V92 RWV5 Co. Kerry, Ireland
3
Molecular Biology, Institute of Biochemistry and Biology, University of Potsdam, Karl Liebknecht Str. 24-25, 14476 Potsdam-Golm, Germany
4
Bioinformatics, Institute of Biochemistry and Biology, University of Potsdam, Karl Liebknecht Str. 24-25, 14476 Potsdam-Golm, Germany
5
Department of Molecular Stress Physiology, Center of Plant Systems Biology and Biotechnology, 139 Ruski blvd., 4000 Plovdiv, Bulgaria
6
Department of Plant Physiology and Molecular Biology, University of Plovdiv, 24 Tsar Assen Str., 4000 Plovdiv, Bulgaria
*
Author to whom correspondence should be addressed.
M.A.O., N.S. & S.G. are joint first authors.
Int. J. Mol. Sci. 2020, 21(2), 474; https://0-doi-org.brum.beds.ac.uk/10.3390/ijms21020474
Submission received: 5 December 2019 / Revised: 26 December 2019 / Accepted: 9 January 2020 / Published: 11 January 2020
(This article belongs to the Special Issue ROS and Abiotic Stress in Plants)

Abstract

:
Abiotic stresses cause oxidative damage in plants. Here, we demonstrate that foliar application of an extract from the seaweed Ascophyllum nodosum, SuperFifty (SF), largely prevents paraquat (PQ)-induced oxidative stress in Arabidopsis thaliana. While PQ-stressed plants develop necrotic lesions, plants pre-treated with SF (i.e., primed plants) were unaffected by PQ. Transcriptome analysis revealed induction of reactive oxygen species (ROS) marker genes, genes involved in ROS-induced programmed cell death, and autophagy-related genes after PQ treatment. These changes did not occur in PQ-stressed plants primed with SF. In contrast, upregulation of several carbohydrate metabolism genes, growth, and hormone signaling as well as antioxidant-related genes were specific to SF-primed plants. Metabolomic analyses revealed accumulation of the stress-protective metabolite maltose and the tricarboxylic acid cycle intermediates fumarate and malate in SF-primed plants. Lipidome analysis indicated that those lipids associated with oxidative stress-induced cell death and chloroplast degradation, such as triacylglycerols (TAGs), declined upon SF priming. Our study demonstrated that SF confers tolerance to PQ-induced oxidative stress in A. thaliana, an effect achieved by modulating a range of processes at the transcriptomic, metabolic, and lipid levels.

1. Introduction

Oxidative stress in plants occurs as a consequence of many abiotic stresses including extreme temperatures, drought, salinity, osmotic stress, and pollutants (e.g., heavy metals or herbicides) [1,2,3,4,5]. Abiotic stress-induced oxidative stress, manifested as an increased production of reactive oxygen species (ROS), has detrimental effects on plant growth, inhibits photosynthesis, leads to cell damage, and, in the most severe cases, results in the activation of programmed cell death [6]. The herbicide paraquat (PQ) causes oxidative stress by accepting electrons from the reduced end of photosystem I and transferring them to molecular oxygen, thereby generating superoxide radicals, which in turn are converted to hydrogen peroxide by superoxide dismutases (SODs) [7,8]. Paraquat is widely used to study the effects of oxidative stress to isolate mutants and investigate the functions of genes involved in ROS detoxification pathways [7,9,10,11,12,13]. In addition to SODs and other antioxidant enzymes that are part of the elaborate antioxidant defense network, plants employ various molecular strategies to counteract oxidative stress and minimize its detrimental effect, including the accumulation of osmoprotectants and compatible solutes, stress protective proteins such as late embryogenesis abundant (LEA) proteins/dehydrins, heat shock proteins (HSPs), and an activation of cellular repair mechanisms [8,14,15].
Molecular priming is a phenomenon by which biologically active molecules activate plant defense mechanisms and secure tolerance against a subsequent stress. For example, application of hydrogen peroxide (H2O2) at low doses can lead to tolerance against oxidative stress induced during chilling, high light, and toxicity due to the presence of heavy metals and pathogens in many plant species [5,16,17,18,19,20]. Molecular priming is similar to the process of acclimation, where application of a mild stress, for example, at a low temperature can protect plants against subsequent, more severe stress events (e.g., chilling/freezing) [3,4]. Both molecular priming and acclimation alter transcriptomes and metabolomes, resulting in molecular re-adjustments that are necessary and sufficient to provide stress protection [21]. Although not deeply studied yet, a re-adjustment of the lipidome is an important part of the metabolome that captures the entirety of lipids in a biological system [22,23].
“Biostimulants” or “plant strengtheners” are considered metabolic enhancers other than fertilizers and are being used worldwide to enhance crop resistance to various stresses while also enhancing plant growth and performance [24,25,26,27]. A wide range of biostimulants are commercially produced using brown seaweed species such as Ascophyllum nodosum as a raw material [28]. However, based on the extraction methodology used and the quantity and availability of bioactives present in the extracts, they can exert different effects with respect to plant growth and stress mitigation [28,29]. SuperFifty® (SF) is a commercially available biostimulant which contains highly concentrated A. nodosum extract (500 g/L) produced in an extraction process at high temperature and pressure [29]. Experiments using SF have shown its effectiveness in reducing abiotic stress and increasing plant growth [29]. However, the molecular mode of action that leads to improved stress tolerance is currently unknown. One possibility is that different bioactive compounds present in A. nodosum extracts work synergistically to modulate innate pathways for biosynthesis of endogenous phytohormones. This may influence developmental processes, resulting in increased photosynthetic efficiency and delayed senescence in treated crops [30,31,32]. Ascophyllum extracts contain a range of organic compounds such as laminarin, fucoidan, polyphenols, mannitol, and alginates [33]. These diverse molecules including uncommon or unique polysaccharides could potentially prime and elevate stress tolerance in plants and improve plant growth. Ascophyllum extracts can reduce drought stress in tomato [34] and alleviate drought and salinity stress in Arabidopsis [31,35]. An in-depth understanding of the molecular mechanisms through which these extracts induce stress tolerance is required for accurate applications in agriculture.
We hypothesized that SF increases abiotic stress tolerance in plants by inducing pathways associated with the reduction of oxidative stress. To test this hypothesis, the efficacy of SF was examined in a PQ-induced oxidative stress model in Arabidopsis thaliana, involving an in-depth “OMICs” characterization of the responses of treated plants at transcriptome, metabolome, and lipidome levels. We showed that SF markedly increased tolerance to oxidative stress in Arabidopsis. This was accompanied by transcriptome reprogramming and metabolome (including lipidome) readjustments, resulting in the upregulation of defense genes, repression of cell death-associated genes, and increased levels of stress-protective metabolites.

2. Results and Discussion

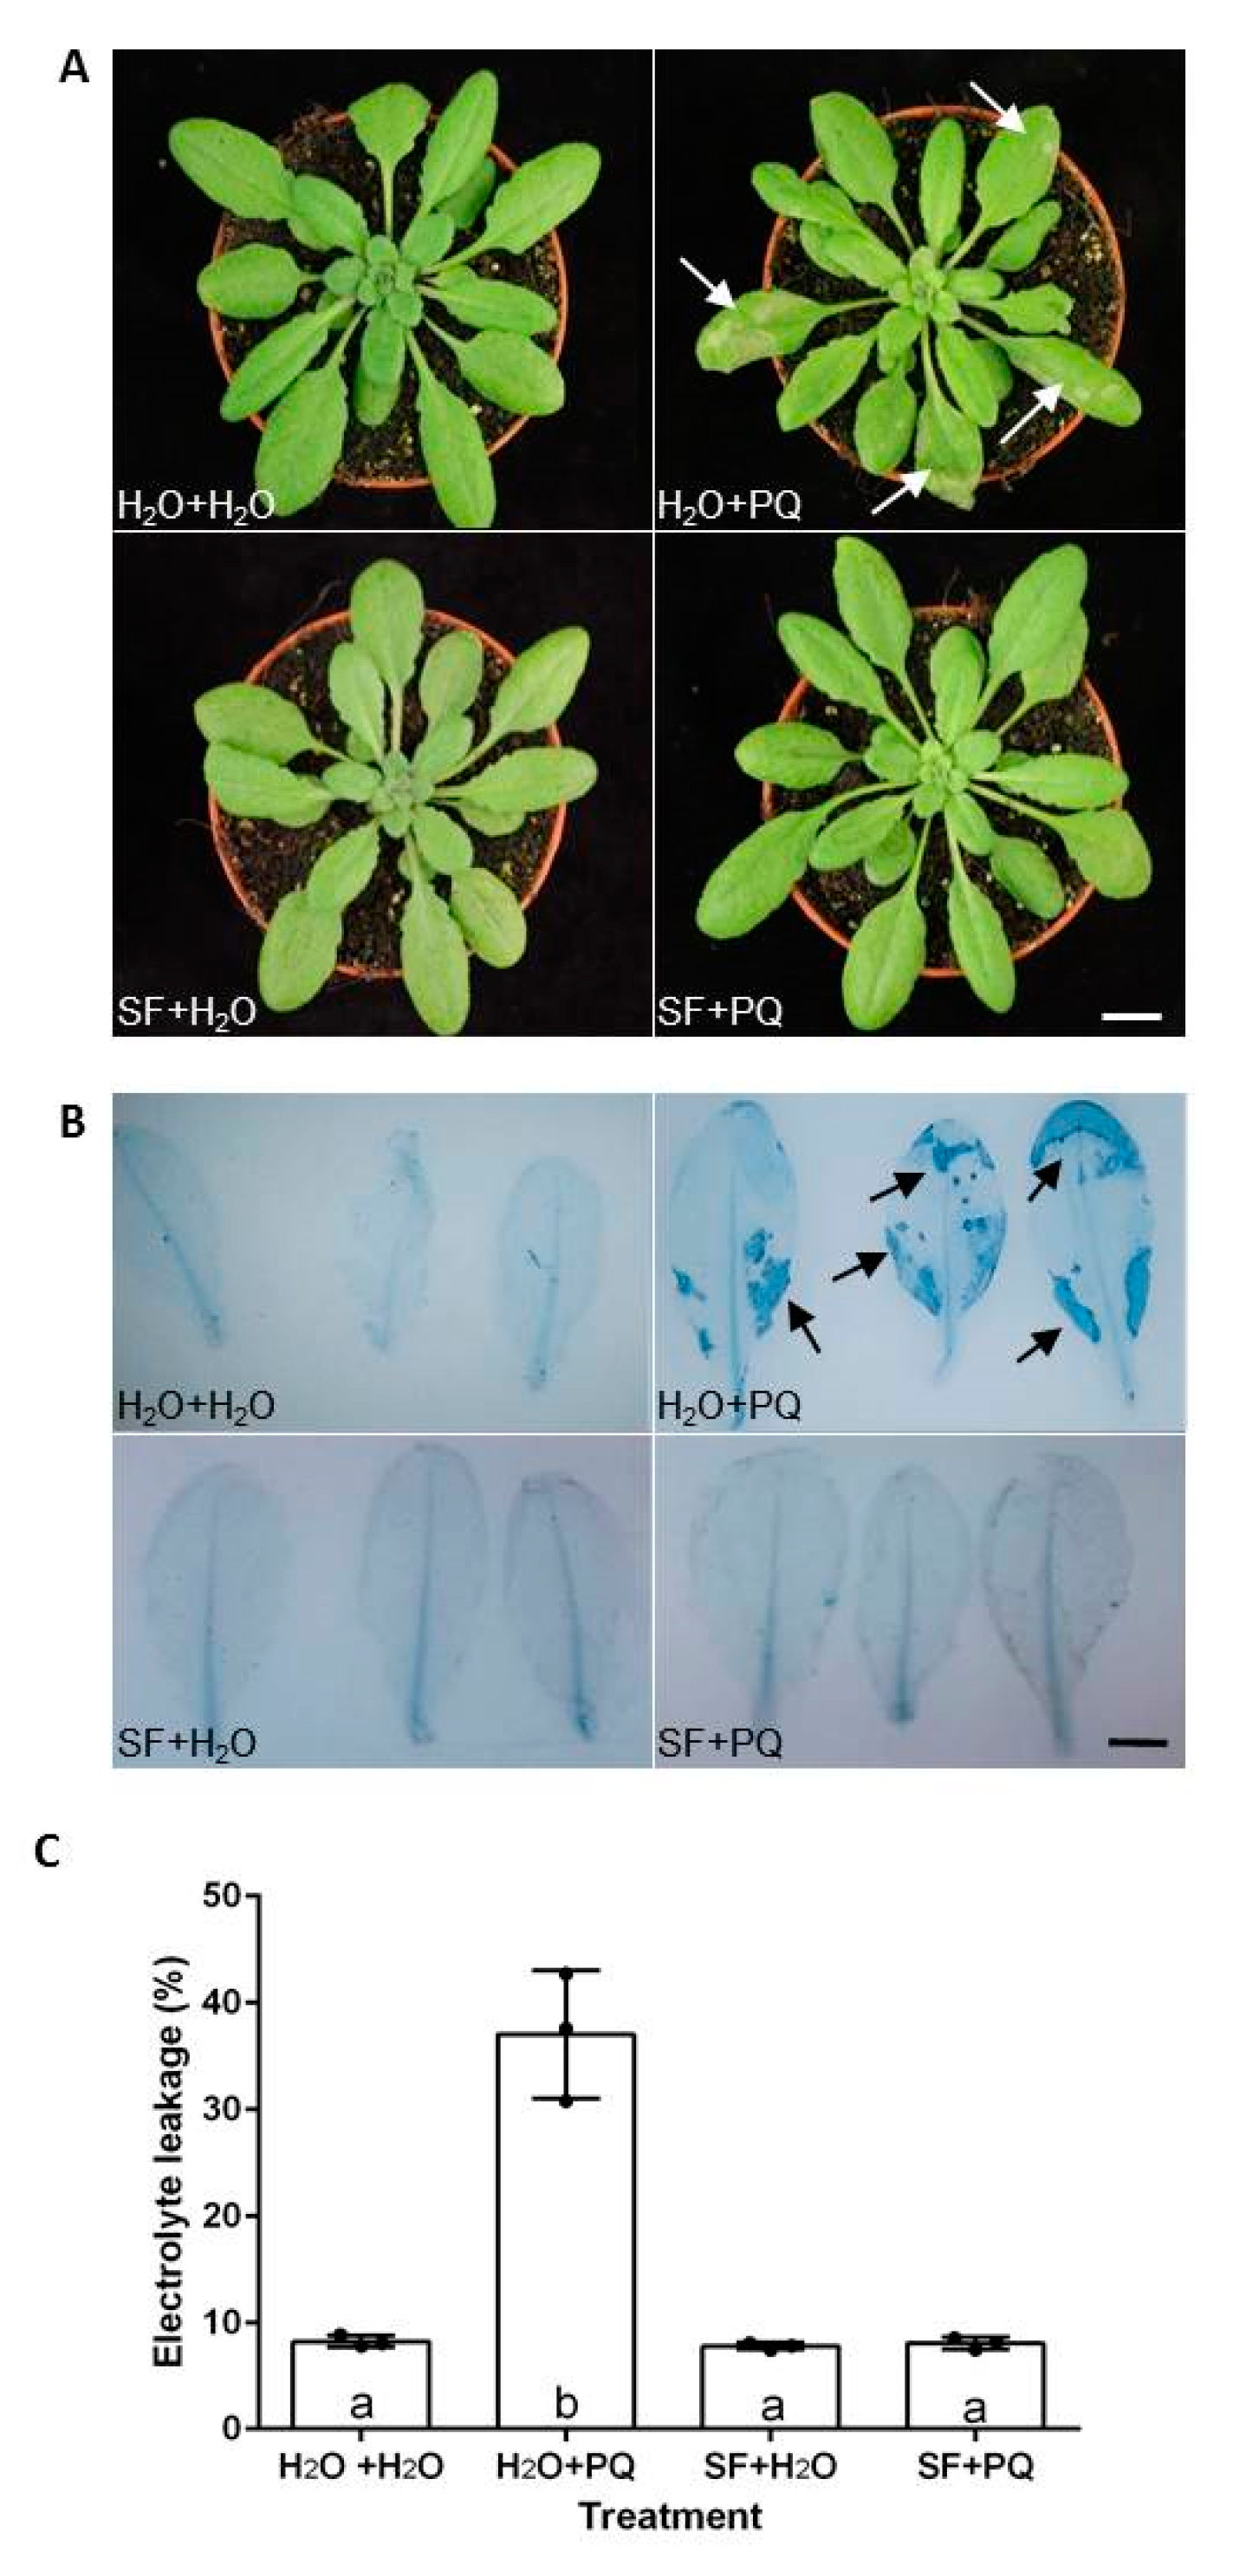
2.1. SF Protects Arabidopsis from Oxidative Stress

Oxidative stress was induced by spraying twenty-three-day-old A. thaliana Col-0 plants with 15 µM PQ (Figure 1). Only PQ-treated plants developed large visible necrotic lesions within one day after treatment (Figure 1A). The presence of cell death was demonstrated by trypan blue staining (Figure 1B). To investigate the protective role of SF, Arabidopsis plants were pre-treated or primed with 0.1% SF six times on two consecutive days prior to the day of the PQ treatment. The SF-primed plants subjected to the subsequent PQ treatment did not develop any necrotic lesion on the leaves (Figure 1A), and trypan blue staining did not detect dead cells (Figure 1B), demonstrating that SF fully protects the plants from PQ-induced oxidative cell death. Cell death was further quantified by monitoring the electric conductivity of solutions in which rosette leaves from treatment groups and untreated controls were immersed (Figure 1C; Supplementary Materials Data S1). Severe ion leakage was observed in PQ-treated plants, likely due to the ROS-induced oxidative damage [36]. However, when SF-primed plants were challenged with PQ, no increase in ion leakage was observed. Our results demonstrate that SF priming improved cell membrane integrity, reducing cell death induced by PQ.

2.2. RNA-Seq Identifies Genes and Pathways Associated with SF-Induced Oxidative Stress Protection

By comparing gene expression in the different samples, we identified a total of 2192 significantly differentially expressed genes (DEGs) (Supplementary Materials Data S2; see Materials and Methods for details). To identify changes at the gene expression level, differential expression analysis was performed for a number of pairwise combinations (Table S1). In general, when PQ was applied alone, significant changes were observed in the expression of genes compared to the untreated control (H2O + H2O); the vast majority of the genes affected by PQ treatment (>1400) were upregulated (>1200). Pre-treatment with SF (“priming”) prior to the PQ application resulted in a substantially lower number of DEGs (317) compared to untreated controls. Importantly, SF-primed PQ-stressed plants exhibited only a very small number of significant changes compared to plants treated with SF alone (six genes). Application of SF alone led to significant changes of only 163 genes compared to untreated controls. Our results suggest that SF primes plants in a manner which prevents PQ from inducing large-scale molecular or phenotypic changes (see Figure 1 for comparison). While SF induces only limited molecular or phenotypic changes when applied to unstressed plants, the biological effects of SF are striking when examined in the context of applying an oxidative stress-inducing agent such as PQ.

2.2.1. Cluster Analysis of DEGs

The DEGs from all pairwise comparisons were combined and clustered into 20 clusters using k-means clustering (Figure S1). These 20 coordinated expression patterns revealed gene modulation and key transition states due to the treatments. Clusters 4, 7, 19, and 20 consisted of genes downregulated due to the SF priming in PQ-stress and non-stress conditions. Cluster 6 consisted of genes upregulated upon SF priming in PQ-stress and non-stress conditions. The remaining clusters exhibited upregulated genes (clusters 2, 3, 5, 8, 9, 10, 13, 16, 17, and 18) or downregulated genes (clusters 1, 11, and 15) due to the PQ induced oxidative stress. Interestingly, genes belonging to clusters that were up- or downregulated by PQ were not affected when plants were primed with SF prior to PQ application. Thus, treatment with SF prevented alteration of these genes that would otherwise occur due to the PQ application (Figure S1). Expression levels and log2 fold changes among treatments for the DEGs in each cluster are given in Supplementary Materials Data S2.

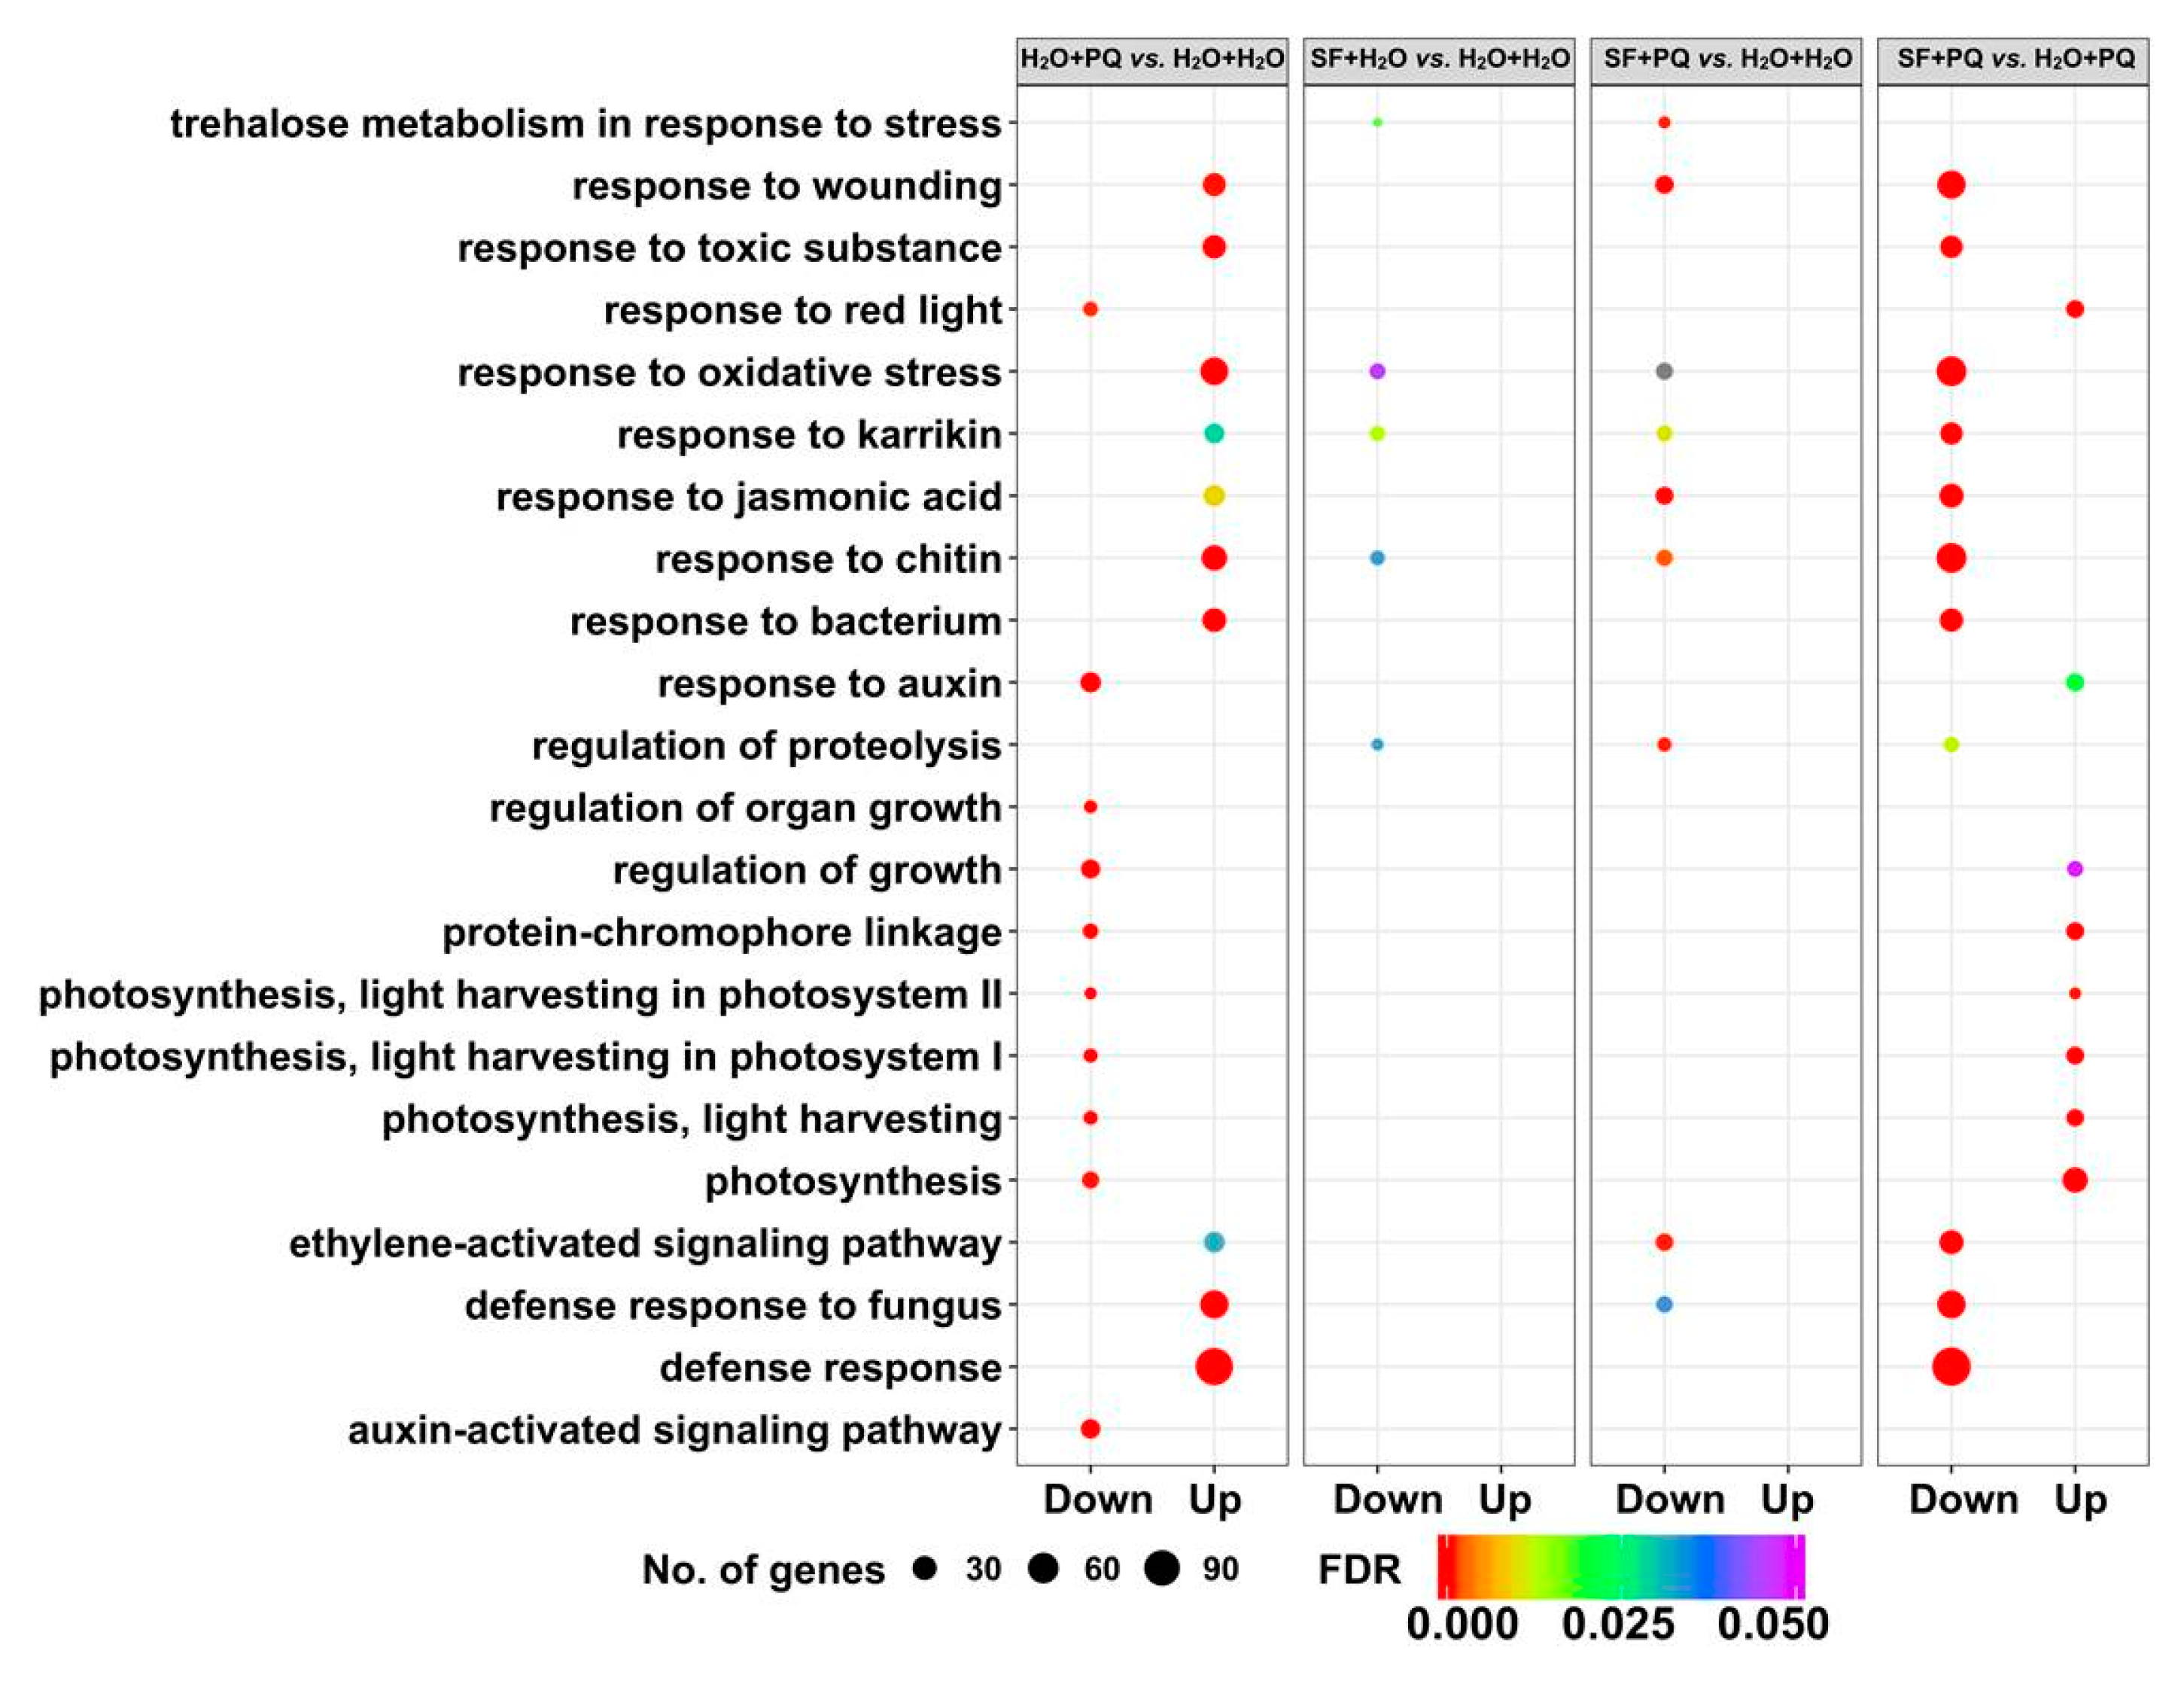
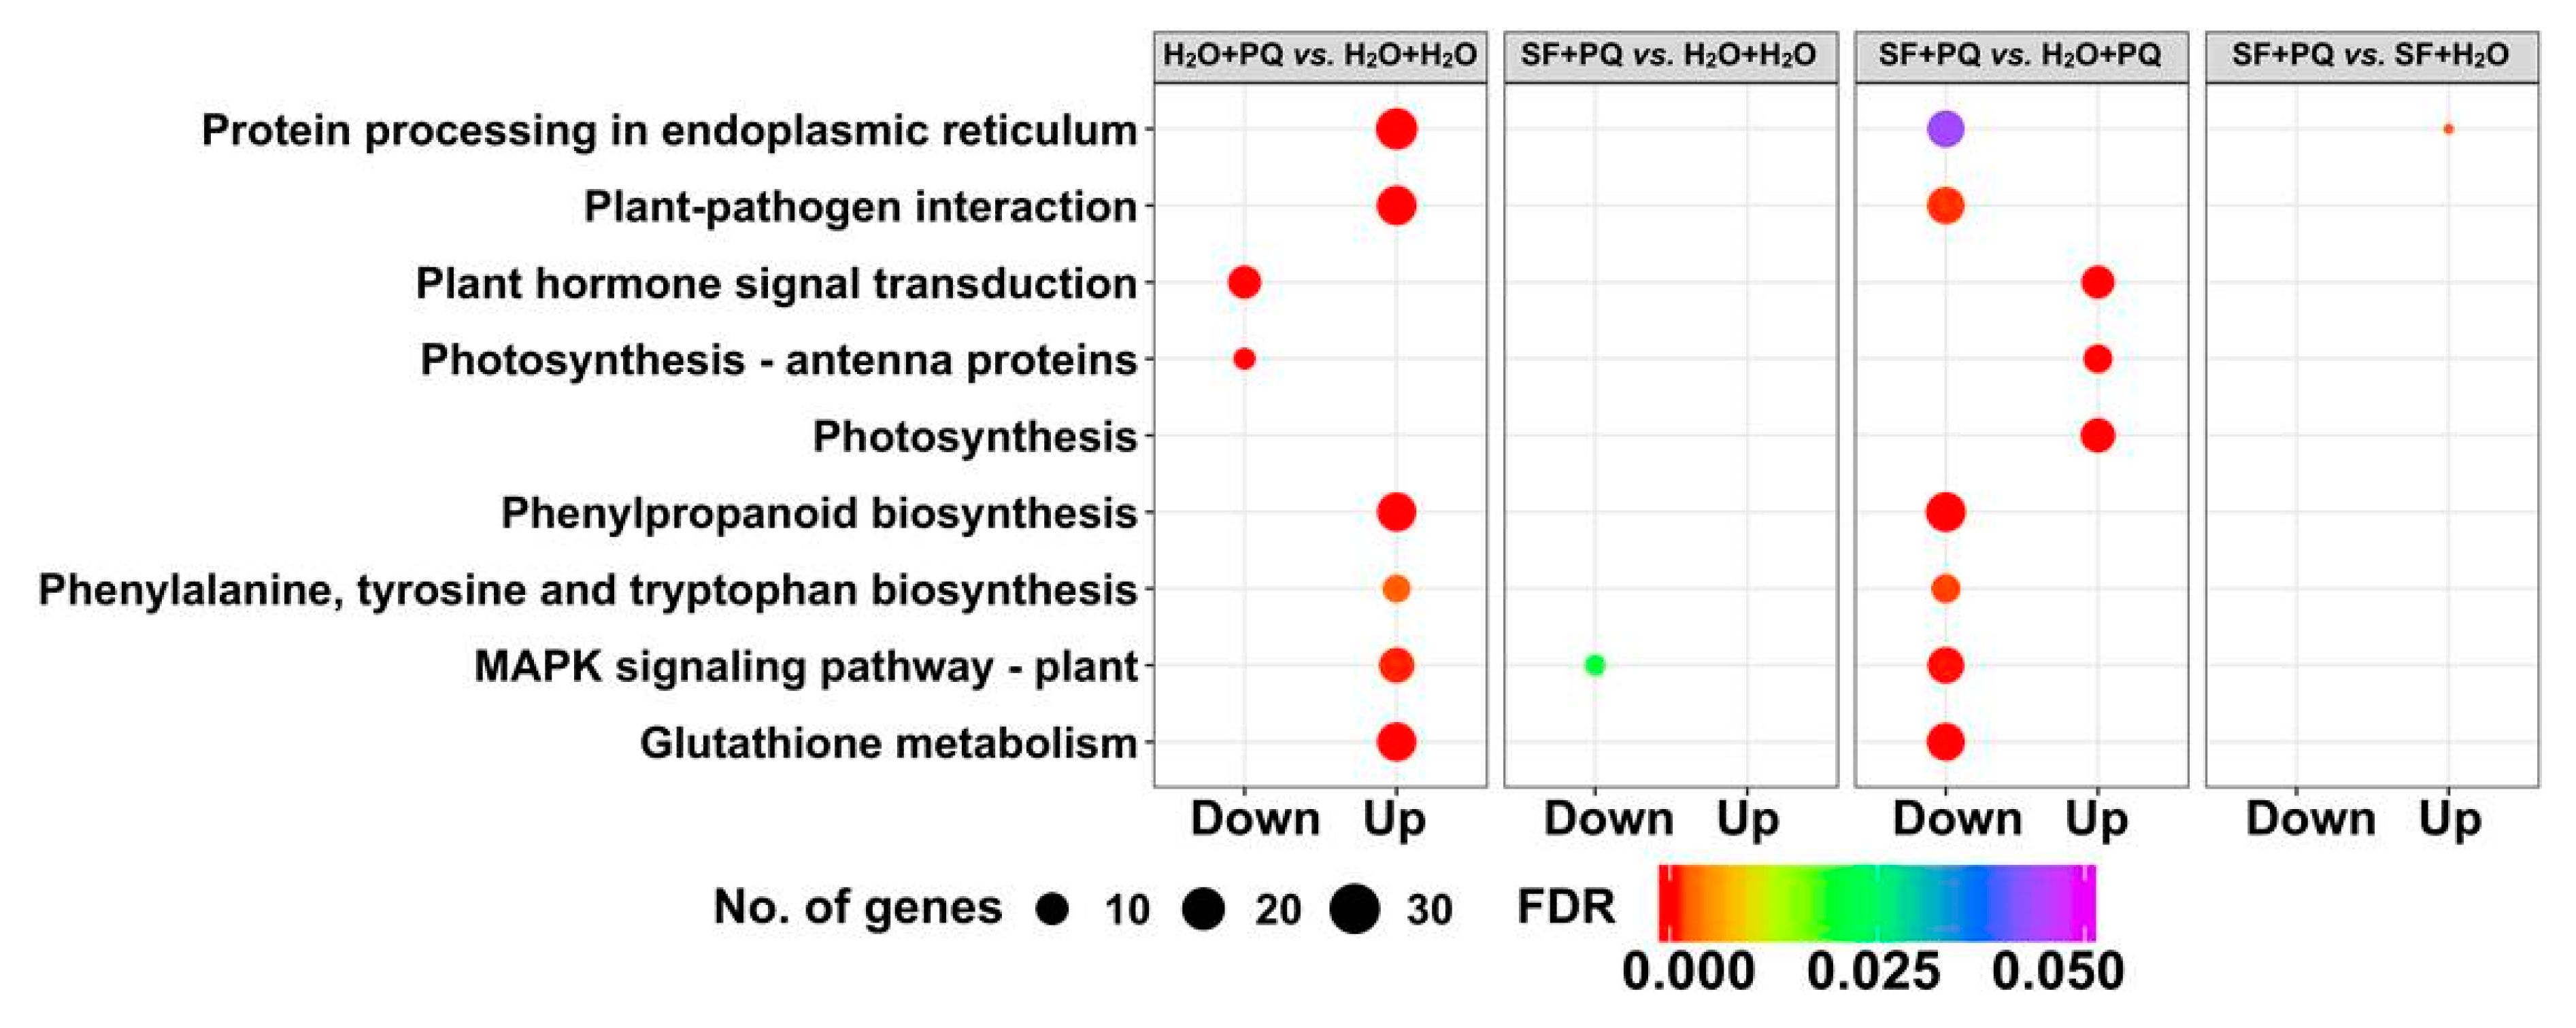
2.2.2. Gene Set Enrichment Analysis of DEGs

To gain insights into the molecular mechanisms involved in SF-mediated stress tolerance, we performed a Gene Ontology (GO) enrichment analysis of the DEGs (Supplementary Materials Data S3). In non-stress conditions, 128 genes were significantly downregulated upon SF priming versus the untreated control with the following GO terms being enriched: “trehalose metabolism in response to stress” (GO:0070413), “regulation of proteolysis” (GO:0030162), “response to chitin” (GO:0010200), “response to oxidative stress” (GO:0006979). Thirty-five DEGs were significantly upregulated in SF-primed versus unprimed control plants (Table S2), including several ERF/AP2 transcription factors such as ERF15, a positive regulator of ABA responses [37], ERF34, a transcriptional regulator of primary cell wall biosynthesis [38], BBX30, a B-box-type zinc finger protein involved in developmental regulation in long day-grown plants [39], and TINY2, a potential regulator of genes in the response to environmental stresses [40]. Also, CIPK20, which encodes a CBL-interacting protein kinase, was specifically upregulated in SF-primed plants. CIPK20, also known as PKS18, is involved in abscisic acid (ABA) signaling; its inhibition by RNA interference leads to ABA insensitivity [41]. Other genes specifically upregulated upon SF priming are: WAG1 encoding a serine/threonine-protein kinase involved in auxin signaling and the regulation of differential growth, tissue patterning, and organogenesis [42], and SPX1, a gene encoding a protein involved in responses to environmental cues and internal regulation of nutrition homeostasis [43]. A gene with unknown function (AT2G19650) coding for a putative cysteine/histidine-rich C1 domain family protein and several other unknown proteins encoded by genes AT3G44450, AT5G66740, AT2G15020, AT2G44940, AT5G11590, AT3G45210, AT1G04570, AT5G61570, and AT3G04140 were also specifically upregulated upon SF priming compared to PQ-treated plants and untreated controls (Supplementary Materials Data S2).
The top five enriched GO terms from each pairwise comparison, based on FDR (false discovery rate) values, were then selected and compared between the pairwise combinations. This analysis demonstrates that enrichment and transition of key biological processes and functions occurred during stress and upon SF priming (Figure 2). The abiotic stress-related GO terms “response to oxidative stress”, “response to wounding”, and “response to toxic substance” were upregulated after PQ stress. In stark contrast, SF priming resulted in the downregulation of these stress-associated GO terms when subsequently exposed to PQ. Priming with SF specifically upregulated GO terms related to photosynthesis, hormones, and plant growth such as “response to red light” (GO:0010114), “protein–chromophore linkage” (GO:0018298), “photosynthesis” (GO:0015979), “light harvesting in photosystem I” (GO:0009768), “light harvesting in photosystem II” (GO:0009769), “response to auxin” (GO:0009733), and “regulation of growth” (GO:0040008) when exposed to PQ stress. It is also interesting that biotic stress and defense-related responses such as “response to chitin” (GO:0010200), “response to bacterium” (GO:0009617), “defense response to fungus” (GO:0050832), and “ethylene-activated signaling pathway’” (GO:0009873) terms were downregulated after SF priming followed by subsequent exposure to PQ. This supports our previous findings that a significant degree of specificity exists for extracts of A. nodosum in terms of stress reduction with efficacy clearly related to temperatures involved in the extraction process, i.e., high-temperature derived extract (SF) is effective in enhancing growth in abiotic stress condition compared to other lower-temperature derived extracts [29].
To obtain a complete view of significantly altered pathways at the transcriptional level during PQ treatment and upon SF priming, we performed a KEGG (Kyoto Encyclopedia of Genes and Genomes) pathway analysis [44] for DEGs from different pairwise comparisons (Figure 3). The following pathways were significantly upregulated in PQ-induced stress conditions: “protein processing in endoplasmic reticulum” (ko04141), “plant-pathogen interaction” (ko04626), “phenylpropanoid biosynthesis” (ko00940), “phenylalanine, tyrosine, and tryptophan biosynthesis” (ko00400), “MAPK signaling pathway–plant” (ko04016), and “glutathione metabolism” (ko00480). Notably, these pathways were significantly downregulated in SF-primed PQ-stress condition. On the other hand, SF priming followed by PQ treatment specifically upregulated pathways for “plant hormone signal transduction” (ko04075) and “photosynthesis” (ko00195).
Overall, the transcriptome analysis in this study demonstrated that PQ-induced oxidative stress causes extensive transcriptional reprogramming as evidenced by the upregulation of many stress marker genes, downregulation of many photosynthesis- and growth-related genes, and induction of genes involved in cell death. Upregulation of stress genes and downregulation of photosynthesis and growth genes are hallmarks of severe stress and cell death [45,46]. Such an extensive level of transcriptional reprogramming was absent in the SF-primed plants exposed to PQ, with no induction of stress genes and no downregulation of photosynthesis and growth genes. The overall pattern of differential gene expression between untreated, PQ stressed, SF priming, and SF priming PQ-stress treatments are represented by a heatmap (Figure 4). The heatmap demonstrates that at the transcriptome level, plants subjected to PQ stress after pre-treatment with SF resemble SF-primed and unstressed plants.

2.2.3. Annotation of Genes Induced by SF for Oxidative Stress Protection

Based on the enrichment analysis, DEGs were selected from the various treatments (Table 1) for an in-depth literature review of the known functions of these genes. This investigation revealed genes that could be directly or indirectly involved in SF priming-induced oxidative stress tolerance. It also identified potential adaptions possibly underlying the stress tolerance phenotype.

ROS-Responsive Genes, Programmed Cell Death, and Senescence

In a previous study, we identified five genes that are hallmarks for oxidative stress [47]; each of them was highly induced by PQ treatment (Table 1). Besides the ROS inducible/marker genes [47], Table 1 contains the genes most regulated by PQ or/and SF that represent pathways and processes such as ROS dependent PCD and senescence, ROS detoxification, photosynthesis, carbohydrate metabolism and cellulose synthesis, growth and hormone signaling, autophagy, lipid metabolism, transcription factors, and stress-related genes. In addition, 140 out of 177 genes, known to be ROS responsive [48], were induced by PQ treatment (Supplementary Materials Data S4). Our results therefore indicate that PQ treatment caused prominent oxidative stress similar to previous reports [47,49,50]. In contrast, none of these genes were upregulated in SF-primed PQ-treated plants (Supplementary Materials Data S4).
Reactive oxygen species can induce programmed cell death (PCD) and metacaspases play a key role in several types of ROS-induced PCD [51]. Two metacaspase-encoding genes, AtMC2 and AtMC8, were highly induced by PQ in the unprimed plants but not in the SF-primed plants. Moreover, PROMOTION OF CELL SURVIVAL 1 (PCS1), encoding an aspartic protease that regulates cell death and promotes cell survival, was induced in both SF-primed and primed/stressed plants (Table 1). PCS1 plays an important role in reproductive gametogenesis and its loss-of-function mutation causes excessive cell death of embryonic tissues [52]. The above results demonstrate that SF prevents the activation of the ROS-triggered PCD pathway. In addition, we observed an upregulation of SENESCENCE-SUPPRESSED PROTEIN PHOSPHATASE (SSPP) and a downregulation of the transcription factor RD26 as well as of SENESCENCE-ASSOCIATED GENE 13 (SAG13) in SF-primed and primed/stressed plants (Table 1). SSPP functions in sustaining leaf longevity and its overexpression significantly delays leaf senescence in Arabidopsis [53]. The transcription factor RD26 (ANAC072) is a positive regulator of stress- and darkness-induced senescence [54,55]. As we recently demonstrated, an enhanced expression of RD26 triggers the accumulation of free amino acids (in particular Gln and Asn), enhances the accumulation of tricarboxylic acid (TCA) cycle intermediates and represses the accumulation of γ-aminobutyric acid (GABA; [54]). SAG13 is induced by stresses such as darkness, drought, wounding, and pathogen challenge in leaves [56] and is involved in the breakdown of cellular components during stress-induced senescence. Expression of SAG13 is directly controlled by RD26 [54]. The induced expression of both, RD26 and SAG13 by PQ and repression of these genes by SF priming, therefore, is likely to contribute to the absence of cell death in SF-treated plants (Table 1).

Detoxification of PQ-induced ROS

PQ produces superoxide radicals, followed by a cascade of reactions producing hydrogen peroxide and hydroxyl radicals [57,58]. Accumulation of these toxic free radicals will result in a decline of photosynthesis, an increase of lipid peroxidation and the destruction of cell membranes, leading to chlorosis and necrosis of plant tissues [58,59]. With respect to enzymatic antioxidants, SF-primed plants had higher levels of Fe SUPEROXIDE DISMUTASE 1 (FSD1) and ASCORBATE PEROXIDASE 1 and 4 (APX1 and APX4) compared to plants stressed with only PQ (Table 1). Increased expression of these genes can assist the detoxification of superoxides and peroxides [60,61,62]. In addition, higher levels of AtOXR, which encodes transmembrane OXR protein, was observed in SF-primed plants (Table 1). Overexpression of AtOXR in Arabidopsis results in ascorbate accumulation, concomitant with an increased tolerance to oxidative stress [63]. Notably, expression of 1-myo-inositol-1-phosphate synthase encoding MIPS1 was elevated in SF-primed plants. MIPS catalyzes the rate-limiting step in the synthesis of myo-inositol which is critical for maintaining cellular levels of ascorbic acid [64]. In addition to transcriptome profiling, we also analyzed the primary metabolic profiles using GC-MS (see below). We found an increased level of threonate in PQ-stressed plants, an effect that was entirely mitigated when plants were primed with SF prior to the PQ treatment (Figure 5). Threonate typically accumulates due to the degradation of ascorbate during stress, which appears to be suppressed by SF. In accordance with the strong priming effect of SF, the gene coding for L-ascorbate oxidase (AO) that converts ascorbate to dehydroascorbate (DHA) had higher expression in SF-primed plants (Table 1). DHA is transported from the apoplast to the cytosol in exchange with ascorbate (reduced form), to ensure a constant apoplast redox flux [65,66,67,68]. The antioxidant ascorbate is one of the key components for reducing ROS. It also acts as a redox buffer and regulates the response to the extracellular environment in the apoplast [64]. The above observations suggest that priming by SF treatment induces a ROS detoxification pathway that involves the antioxidant ascorbic acid.
A gene coding for an iron–sulfur domain containing protein, NEET, was also upregulated in SF-primed plants (Table 1). This gene has a role in regulating redox reactions and the control of apoptosis. In Arabidopsis, T-DNA knockdown and RNA interference NEET lines accumulated higher levels of ROS than wild-type control plants [69]. NEET is involved in iron (Fe) homeostasis, supporting a proper ROS balance and photosynthesis in cells [70,71]. Notably, several cytochrome P450 encoding genes (CYP76C1, CYP71B35, and CYP706A) were also more strongly expressed in SF-primed plants (Table 1). Cytochrome P450 enzymes have previously been shown to be involved in herbicide metabolism and detoxification [72,73].

Photosynthetic Genes

Most of the photosynthesis-related genes were significantly downregulated by PQ in unprimed plants. In fact, this is the largest functional group of genes that was repressed by PQ. The group included genes encoding subunits of photosystem II, genes involved in chlorophyll biosynthesis, such as protochlorophyllide oxidoreductase, genes from the Calvin–Benson cycle such as RuBisCO, and several others (Table 1). SF mitigates against the detrimental effect of PQ and enables plants to photosynthesize even when threated with PQ. None of these genes were repressed in SF-primed plants subsequently treated with PQ. On the contrary, a number of these genes had even higher levels of expression in the SF-primed plants, suggesting that SF actually induces their expression in both unstressed and PQ-stressed plants (Table 1). Upregulation in this manner may enhance photosynthetic efficiency in the SF-primed plants and also protect against stress, consistent with the healthy phenotype observed for all SF-treated groups.
Gene AT2G23670, which encodes thylakoid protein YCF37, was upregulated in SF-primed plants compared to both PQ-stressed and untreated control plants. YCF37 is likely involved in photosystem 1 (PSI) assembly and oligomerization; its gene is induced by high-light stress and the protein has a likely role in repairing PSI during light stress [74]. A disrupted photosynthetic machinery and impaired photosynthesis result in the generation of various ROS, including superoxide radicals (O2•–) and singlet oxygen (1O2). Studies have also shown that to prevent high light-induced 1O2 accumulation and oxidative damage, it is essential to minimize the steady state concentration of chlorophyll biosynthetic intermediates in day light plants [75]. Here, we observed an increased level of PROTOCHLOROPHYLLIDE OXIDOREDUCTASE C (PORC) gene expression in SF-primed plants. The protein PORC is involved in chlorophyll biosynthesis. Under high-light conditions, transgenic Arabidopsis plants overexpressing PORC showed reduced accumulation of the chlorophyll biosynthesis intermediate protochlorophyllide (Pchlide), resulting in minimal 1O2 generation and protection from oxidative damage [75]. Increased expression of PORC in SF-primed plants may lead to a decrease in Pchlide, potentially protecting the plants from oxidative damage. Overall, transcriptomic analysis indicated that SF-treated plants likely maintain their photosynthetic machinery after PQ treatment and minimize ROS generation.

Carbohydrate Metabolism

Several genes related to carbohydrate metabolism were upregulated in the SF-primed plants (Table 1). GALACTINOL SYNTHASE (GOLS) encodes a key enzyme in the synthesis of raffinose family oligosaccharides (RFOs). Raffinose protect plants against PQ-induced oxidative stress [76]. Hence, upregulation of this pathway in SF-primed plants likely contributes to the enhanced tolerance to PQ observed in this study.
Two other genes, GLYCOSYL HYDROLASE 9C2, also known as ENDO-1,4-BETA-GLUCANASE 6, and TRICHOME BIREFRINGENCE-LIKE 27 (TBL27), were upregulated in SF-primed plants and may have functions in cellulose synthesis, cell wall deposition and O-acetylation of cell wall polysaccharides [77,78]. Glycosyl hydrolases are involved in cellulose biosynthesis, cell wall deposition and integration of polysaccharides [77]. O-acetylation of xyloglucans is possibly accomplished by the enzyme encoded by TBL27 (also known as ALTERED XYLOGLUCAN 4, AXY4) [79]. Acetylation of cell wall polysaccharides is essential for maintaining the structural integrity of the leaf; it is also important for exerting a global impact on plant stress responses [80].

Growth and Hormone Signaling

Several growth-related genes are repressed by PQ, including genes encoding expansins (EXPA8, EXPA11, and EXPB1), auxin-responsive genes such as IAA6, PIN7, and SAUR-like genes. In contrast, these genes are not repressed in SF-PQ treated plants. On the contrary, many growth- and auxin-related genes are induced by SF in both PQ-stressed and unstressed SF-primed plants (Table 1). Gibberellin-regulated GASA6 is also repressed by PQ but induced in SF-primed plants (stressed or unstressed), while GIBBERELLIN 2-OXIDASE 6 (that inactivates GA) is induced only in PQ-treated unprimed plants. Taken together, these data show that while PQ represses growth, this effect of PQ is completely eliminated by SF. Furthermore, there is evidence that SF promotes growth (induction of growth-related genes as well as auxin and GA pathways), providing a molecular explanation of its action as a biostimulant/plant strengthener.

Autophagy

Oxidative stress can activate autophagy, an energy-dependent cellular process of recycling cellular components [81]. The WRKY33 transcription factor plays a role in regulating autophagy by interacting with autophagy-related (ATG) proteins [82,83]. Expression of WRKY33 is highly induced by PQ while its transcript levels are even lower in SF-treated plants than controls (Table 1). Overexpression of ATG8 (different genes including ATG8E) in Arabidopsis leads to an increase in the number of autophagosomes concomitant with an activated autophagy [84]. Similarly, experimental evidence was obtained to indicate that elevated expression of ATG8H increases autophagy during abiotic stress conditions [85]. Expression of both, ATG8E and ATG8H is repressed by SF (Table 1). Collectively, our observations suggest activation of autophagy by PQ and repression of autophagy by SF.

Lipid Metabolism

Genes related to lipid degradation including PHOSPHOLIPASE A 2A (PLA2A) and MYZUS PERSICAE-INDUCED LIPASE1 (MPL1) [86] are strongly upregulated by PQ treatment, but not in PQ-treated plants previously primed with SF (Table 1). On the other hand, one gene encoding an oleosin-B3 like protein is downregulated by PQ treatment but upregulated in SF-primed plants. Oleosins are relatively small hydrophobic proteins (with a molecular weight of 15–26 kDa) associated with oil bodies, i.e., cellular organelles for the storage of triacylglycerols in plants. A knockout mutant of a gene coding oleosin-B3-like protein is hypersensitive to salt stress [87]. Lipid reconfigurations occur during oxidative stress balancing energy metabolism and mitigating the oxidative damage [23,88].

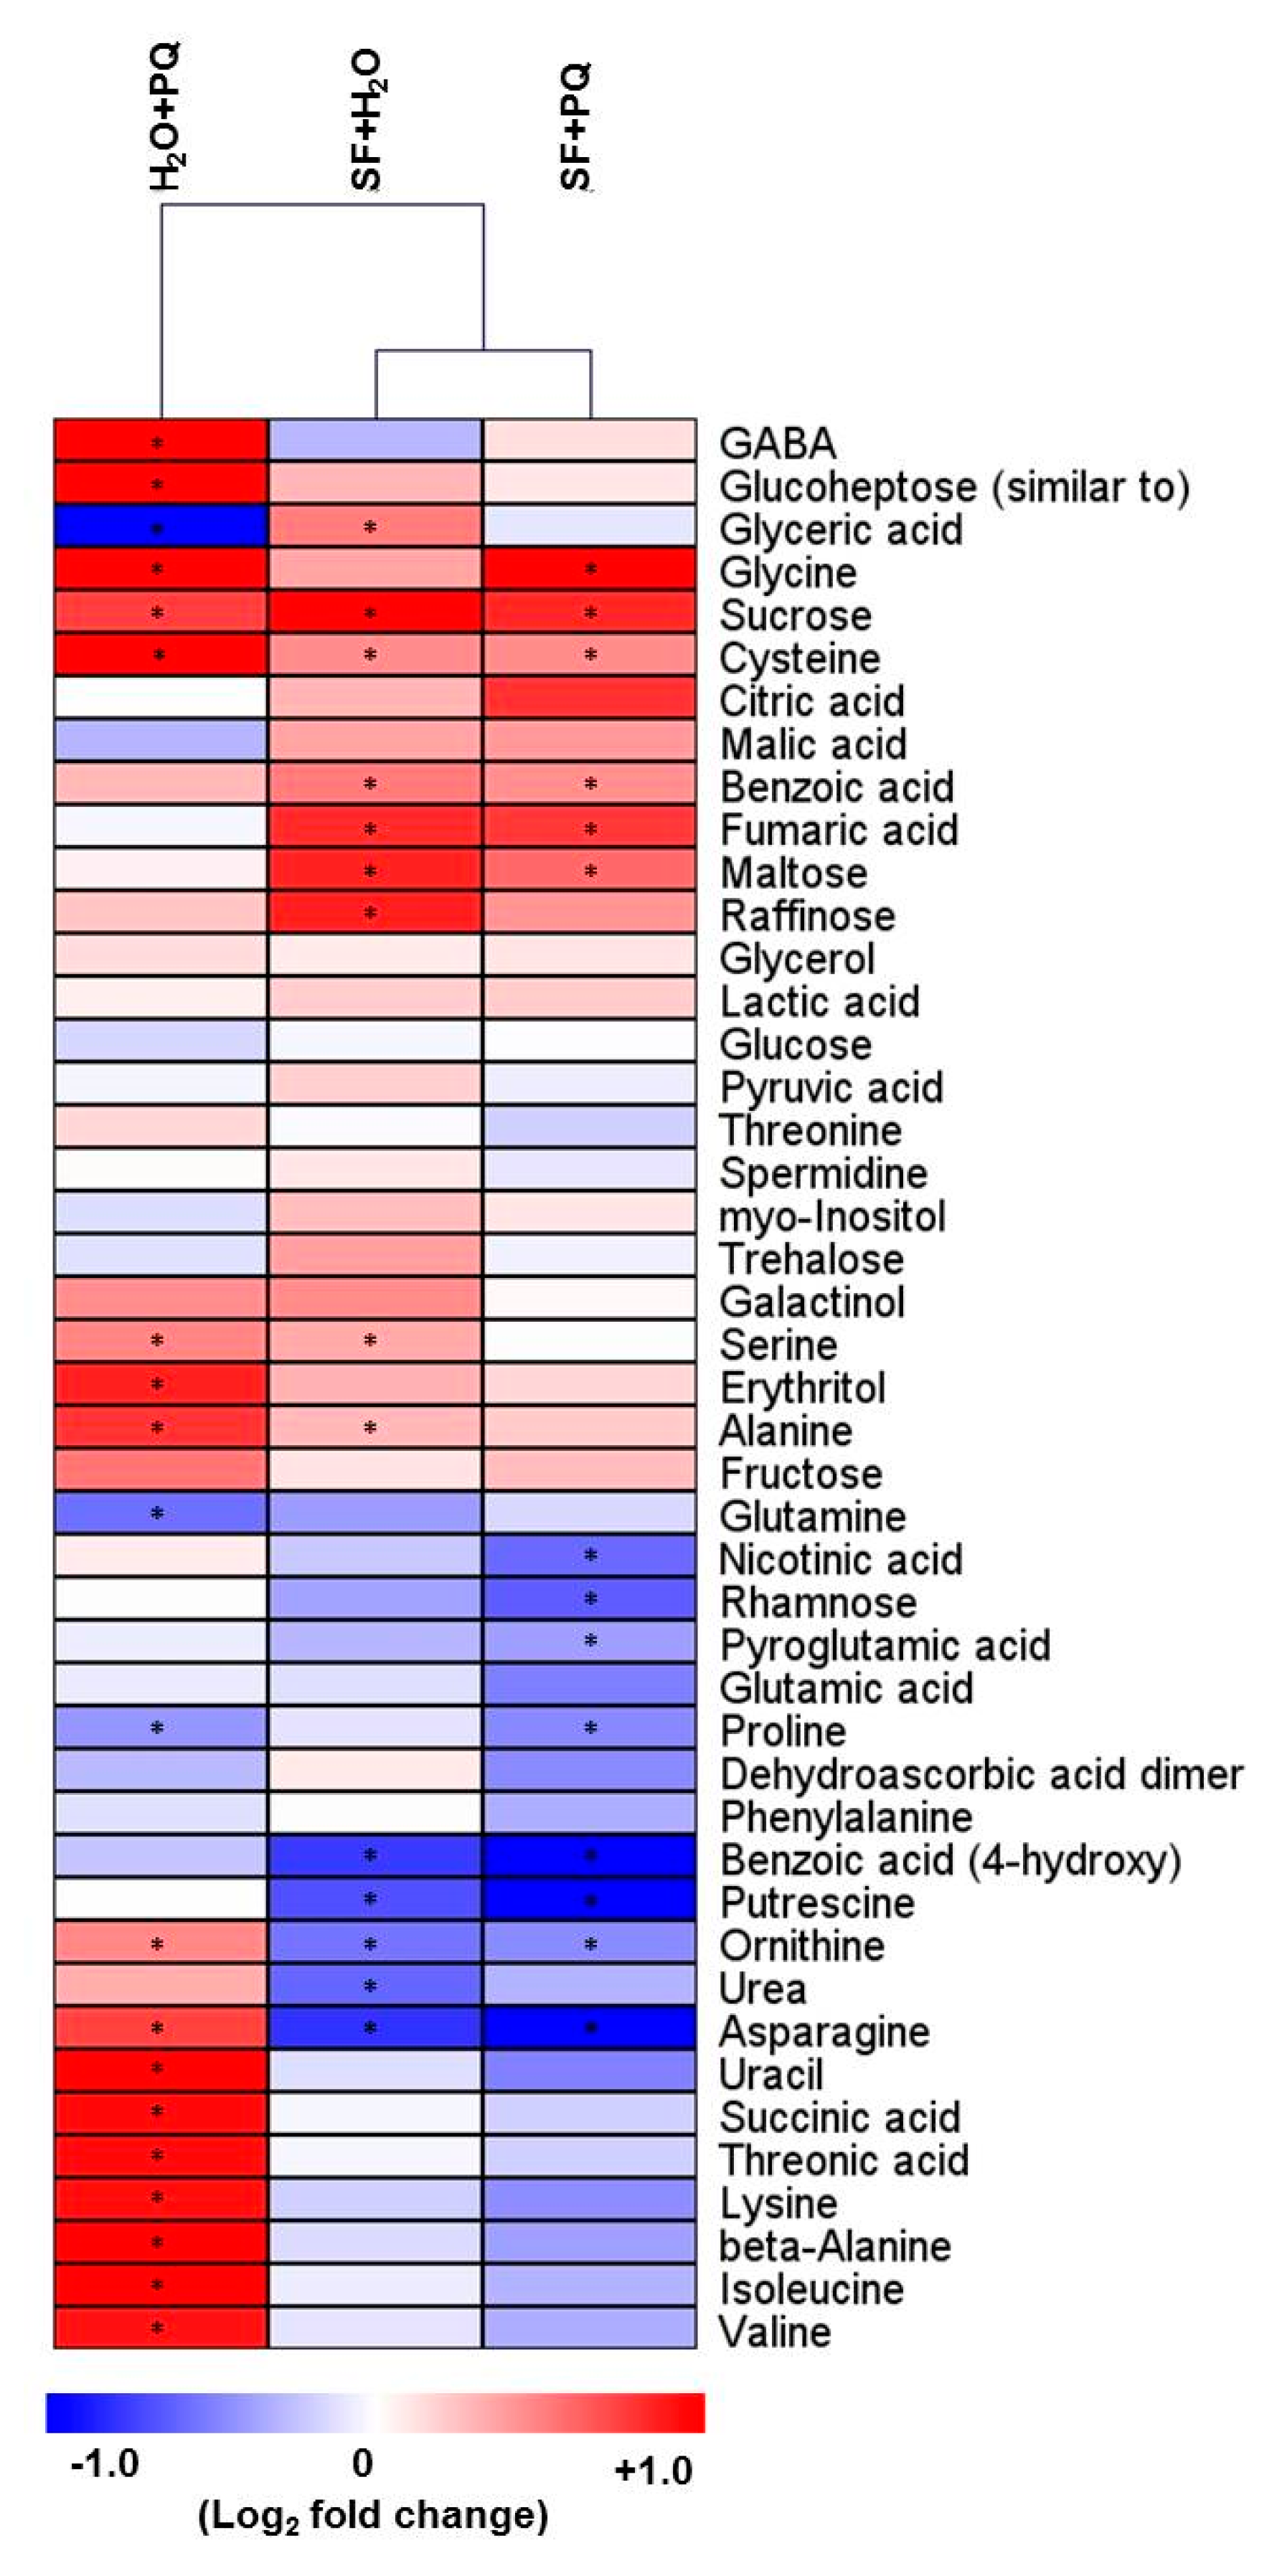
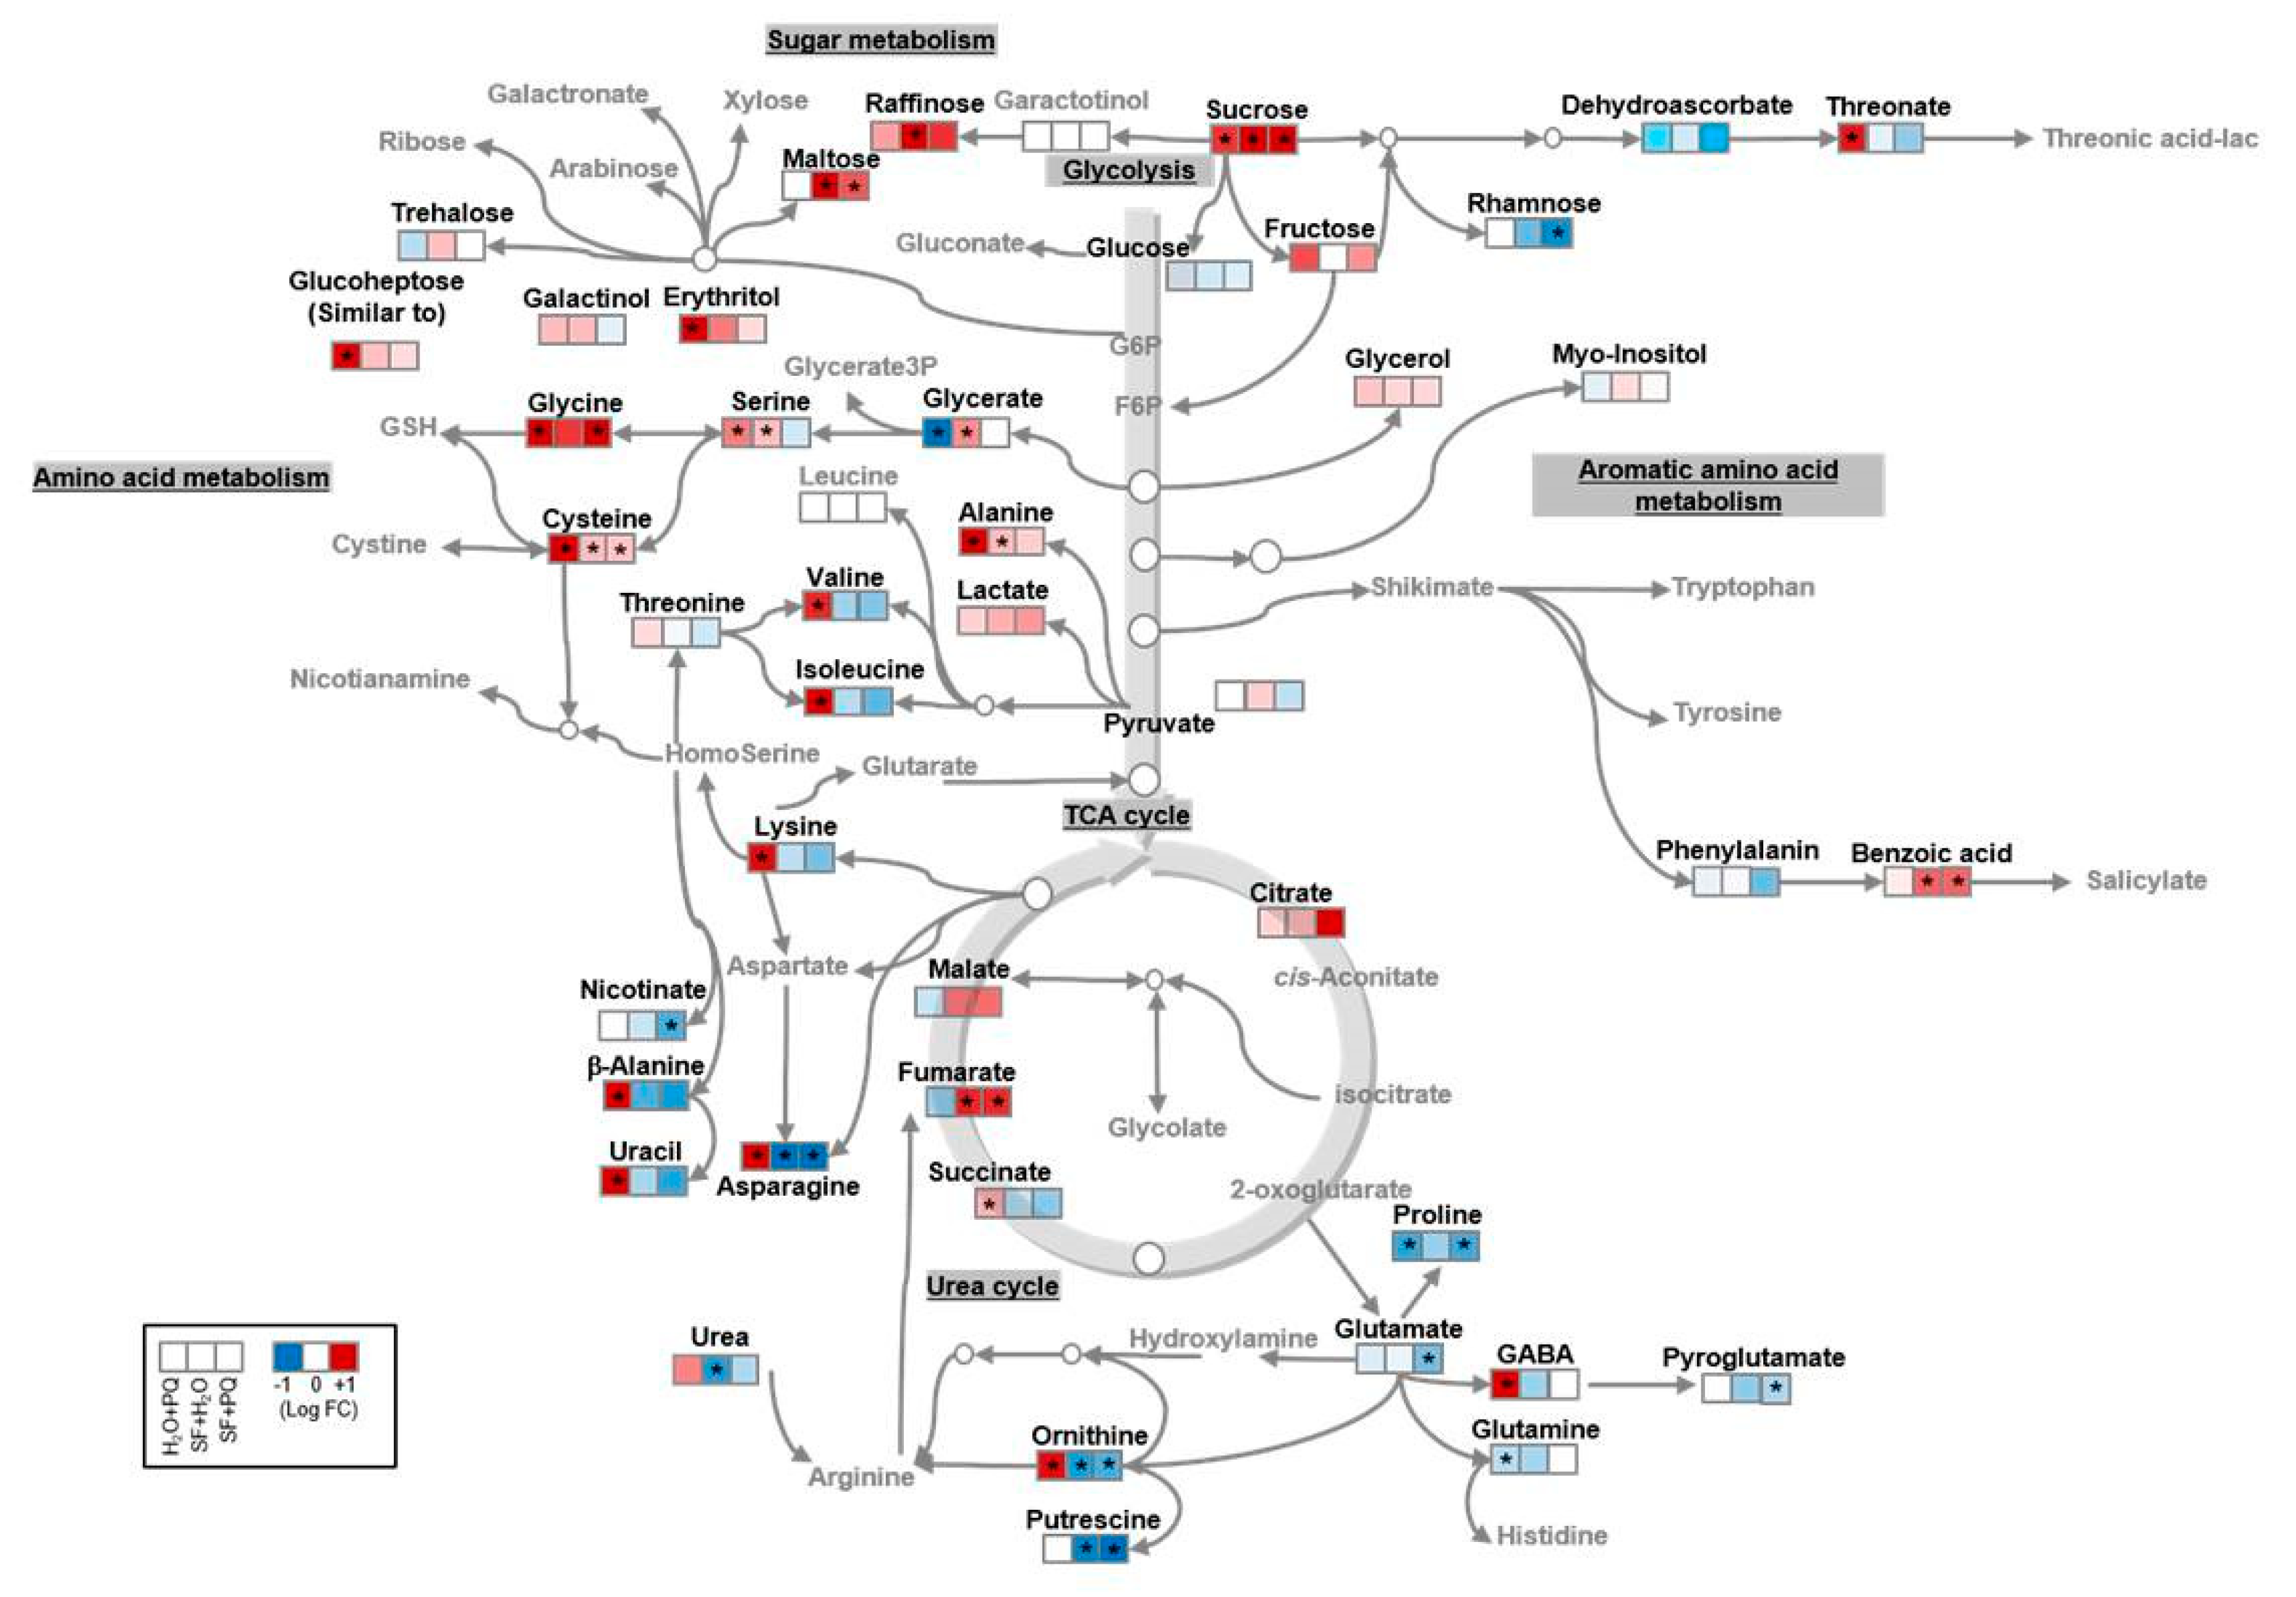
2.3. Metabolome Reconfiguration Induced by SF for Oxidative Stress Protection

To gain further insights into the effect of SF on plants, we determined the metabolic profiles under various conditions using GC-MS. We observed substantial differences in primary metabolites of oxidatively stressed plants when compared with untreated plants (Figure 5). Interestingly, application of SF prior to the PQ treatment almost completely abolished the metabolite changes observed in plants treated with only PQ (Figure 5). A detailed analysis of the metabolic profiles revealed an increase of threonate levels in PQ-treated plants compared to the untreated controls (H2O + PQ versus H2O + H2O), while threonate decreased in the other conditions (SF + PQ versus SF + H2O; Figure 5 and Figure 6). Threonate results from the degradation of ascorbate, with the ascorbate–glutathione cycle (Foyer–Halliwell–Asada pathway) representing an important system for ROS scavenging (Foyer and Noctor, 2011 [89]). The increase of threonate may suggest an impairment of the ascorbate–glutathione cycle for ascorbate regeneration in PQ-treated plants (Figure 5).
Interestingly, we observed an accumulation of various free amino acids in PQ-stressed plants, including branched chain amino acids (BCAAs), such as valine and isoleucine, as well as other amino acids such as alanine, glycine, cysteine, lysine, and asparagine. The amino acids most likely accumulate in the stressed plants as a result of protein degradation caused by PQ-induced disruption of regular metabolism rather than de novo amino acid biosynthesis, a conclusion supported by the fact that PQ causes cell death (Figure 1). Of note, an accumulation of amino acids during abiotic stresses has been observed in many different studies [21,90,91,92], and it has been suggested that metabolites accumulating under stresses might be used as building blocks for new cellular components to support recovery of growth after stress adaptation [21]. Moreover, one of the glutamate-derived compounds linked to oxidative stress responses is γ-aminobutyric acid (GABA) which is involved in pH regulation, stress responses, signaling, and other processes in plants [21,91,93]. Here, we observed that GABA over accumulates in PQ-stressed plants (Figure 5 and Figure 6).
Metabolic and mechanical disruptions during stress cause cytosolic acidification and induce an acidic pH-dependent activation of GABA synthesis [93]. A stress-specific pattern of accumulation is consistent with a physiological role of GABA in stress mitigation [21,91,93,94,95]. Interestingly, some of the metabolic effects observed in PQ-stressed plants are not only characteristic of oxidative stress, but also occur in senescing plant tissues [96]. An important result obtained here is that the metabolic changes induced by PQ are almost completely abolished when plants are pre-treated with SF and then subjected to PQ treatment. Several TCA cycle intermediates, in particular, fumarate and, to some extent, citrate and malate, increased in SF-primed plants, effects which might support cellular respiration and photosynthesis [97,98]. It has previously been suggested that an accumulation of citrate under oxidative stress conditions may control the production of ROS and, therefore, increase the plant’s tolerance to stress [99,100]. Moreover, the levels of free amino acids were reduced following SF application which may indicate their utilization during the process of inducing stress tolerance and potentially growth (Figure 6). In contrast, raffinose accumulated after SF treatment (Figure 5 and Figure 6) which might increase oxidative stress tolerance as suggested previously [76]. The soluble sugar maltose accumulated in SF-primed and primed/stressed plants (Figure 5 and Figure 6). Maltose at physiologically relevant concentrations may protect proteins, membranes, and the photosynthetic electron transport chain from stress-induced damage [101].

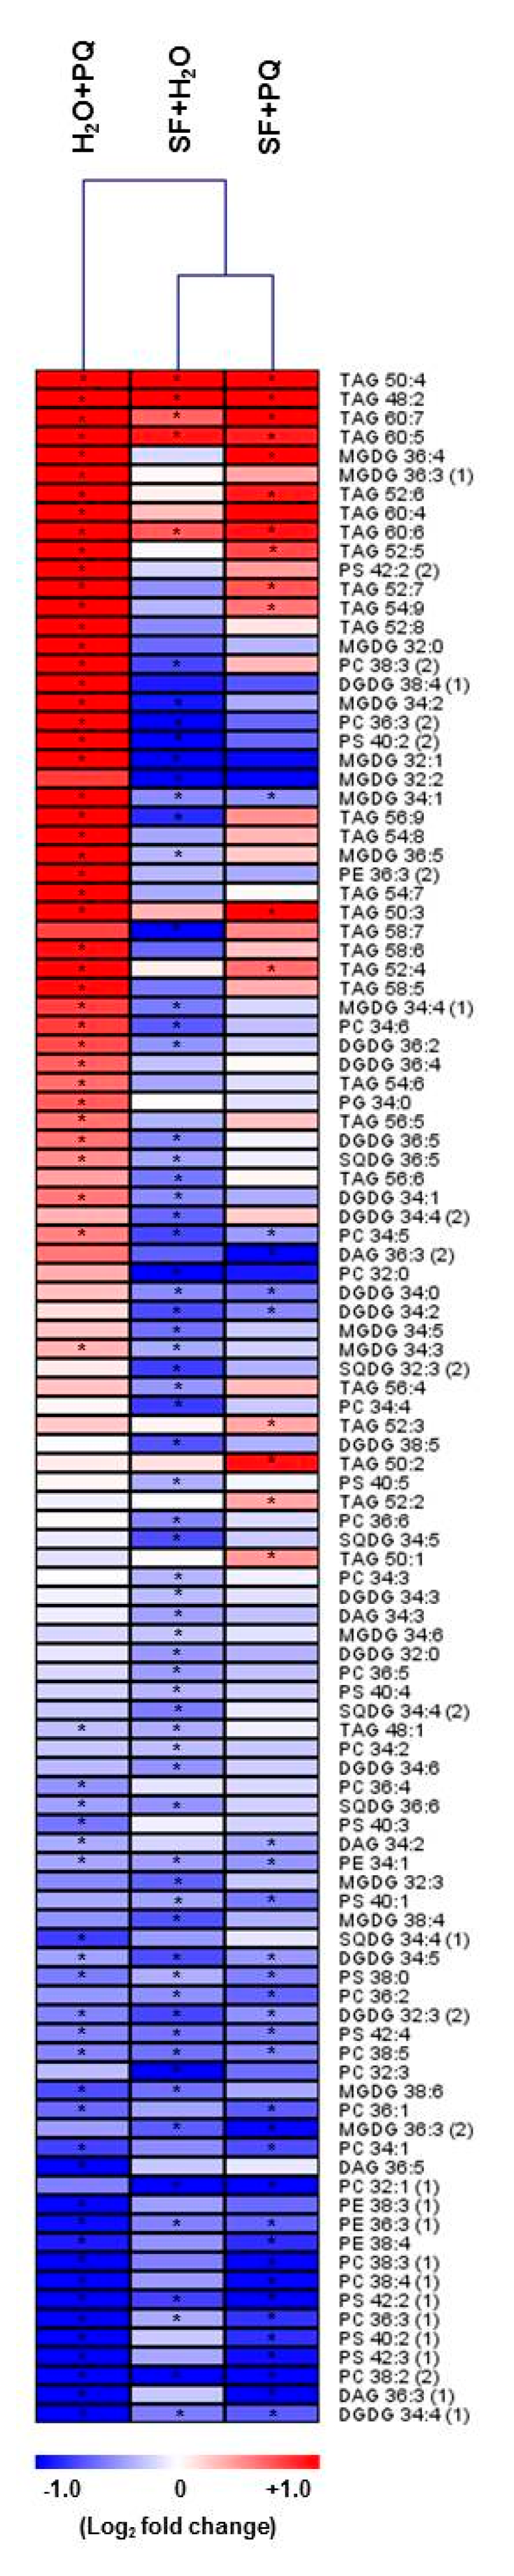
2.4. Lipidome Level Changes Induced by SF for Oxidative Stress Protection

Lipids are the main components of biological membranes and they represent important carbon and energy storage compounds in plants [102,103]. Lipids may sense extracellular signals and trigger lipid-mediated signaling and have also been shown to accumulate during several stresses, e.g., when photosynthesis is inhibited [102,103]. Here, we observed major changes in lipid profiles of plants exposed to oxidative stress (Figure 7). In total, 155 annotated lipids from ten neutral and polar lipid classes were identified. Of those, 108 lipids were significantly changed in at least one of the tested conditions in comparison with the untreated control condition (Figure 7). In our analysis, we detected different classes of lipids including neutral lipids of the diacylglyceride (DAG) and triacylglyceride (TAG) classes, as well as polar lipids including digalactosyldiacylglycerol (DGDG), monogalactosyldiacylglycerol (MGDG), phosphatidylcholine (PC), phosphatidylethanolamine (PE), phosphatidylglycerol (PG), and sulfoquinovosyldiacylglycerol (SQDG). It has been shown that under adverse conditions, neutral lipids play an important role in intracellular homeostasis and energy balance [104].
A more detailed analysis of the 108 significantly changed lipids revealed that most of the neutral TAG lipids and polar chloroplast lipids, such as, for example, galactolipids (i.e., MGDG and DGDG) which constitute the bulk of the chloroplast membrane, increased in stressed plants, likely resulting from cell death and chloroplast degradation, while they were primarily decreased in SF-treated plants (Figure 7).
Notably, the TAG class of neutral lipids (representing the main source of energy) showed divergent patterns in different conditions: the levels of some lipids (e.g., TAG 60:5 and TAG 60:6), increased while levels of others (e.g., TAG 54:0 and TAG 54:2) decreased in PQ-stressed plants. A contrasting pattern was observed in SF-primed plants. A large proportion of the observed alterations in lipid levels in stressed plants was reversed in stressed plants pre-treated with SF, which demonstrates the protective role of SF against oxidative stress. Most of the neutral lipids, namely, TAGs and DAGs, decreased when stressed plants were compared with stressed plants pre-treated with SF (Figure 7). This observation is in line with previous reports which showed that plants under adverse stress condition, such as, for example, extended darkness, usually accumulate those lipid classes [88], an effect mitigated by application of SF, as shown here.

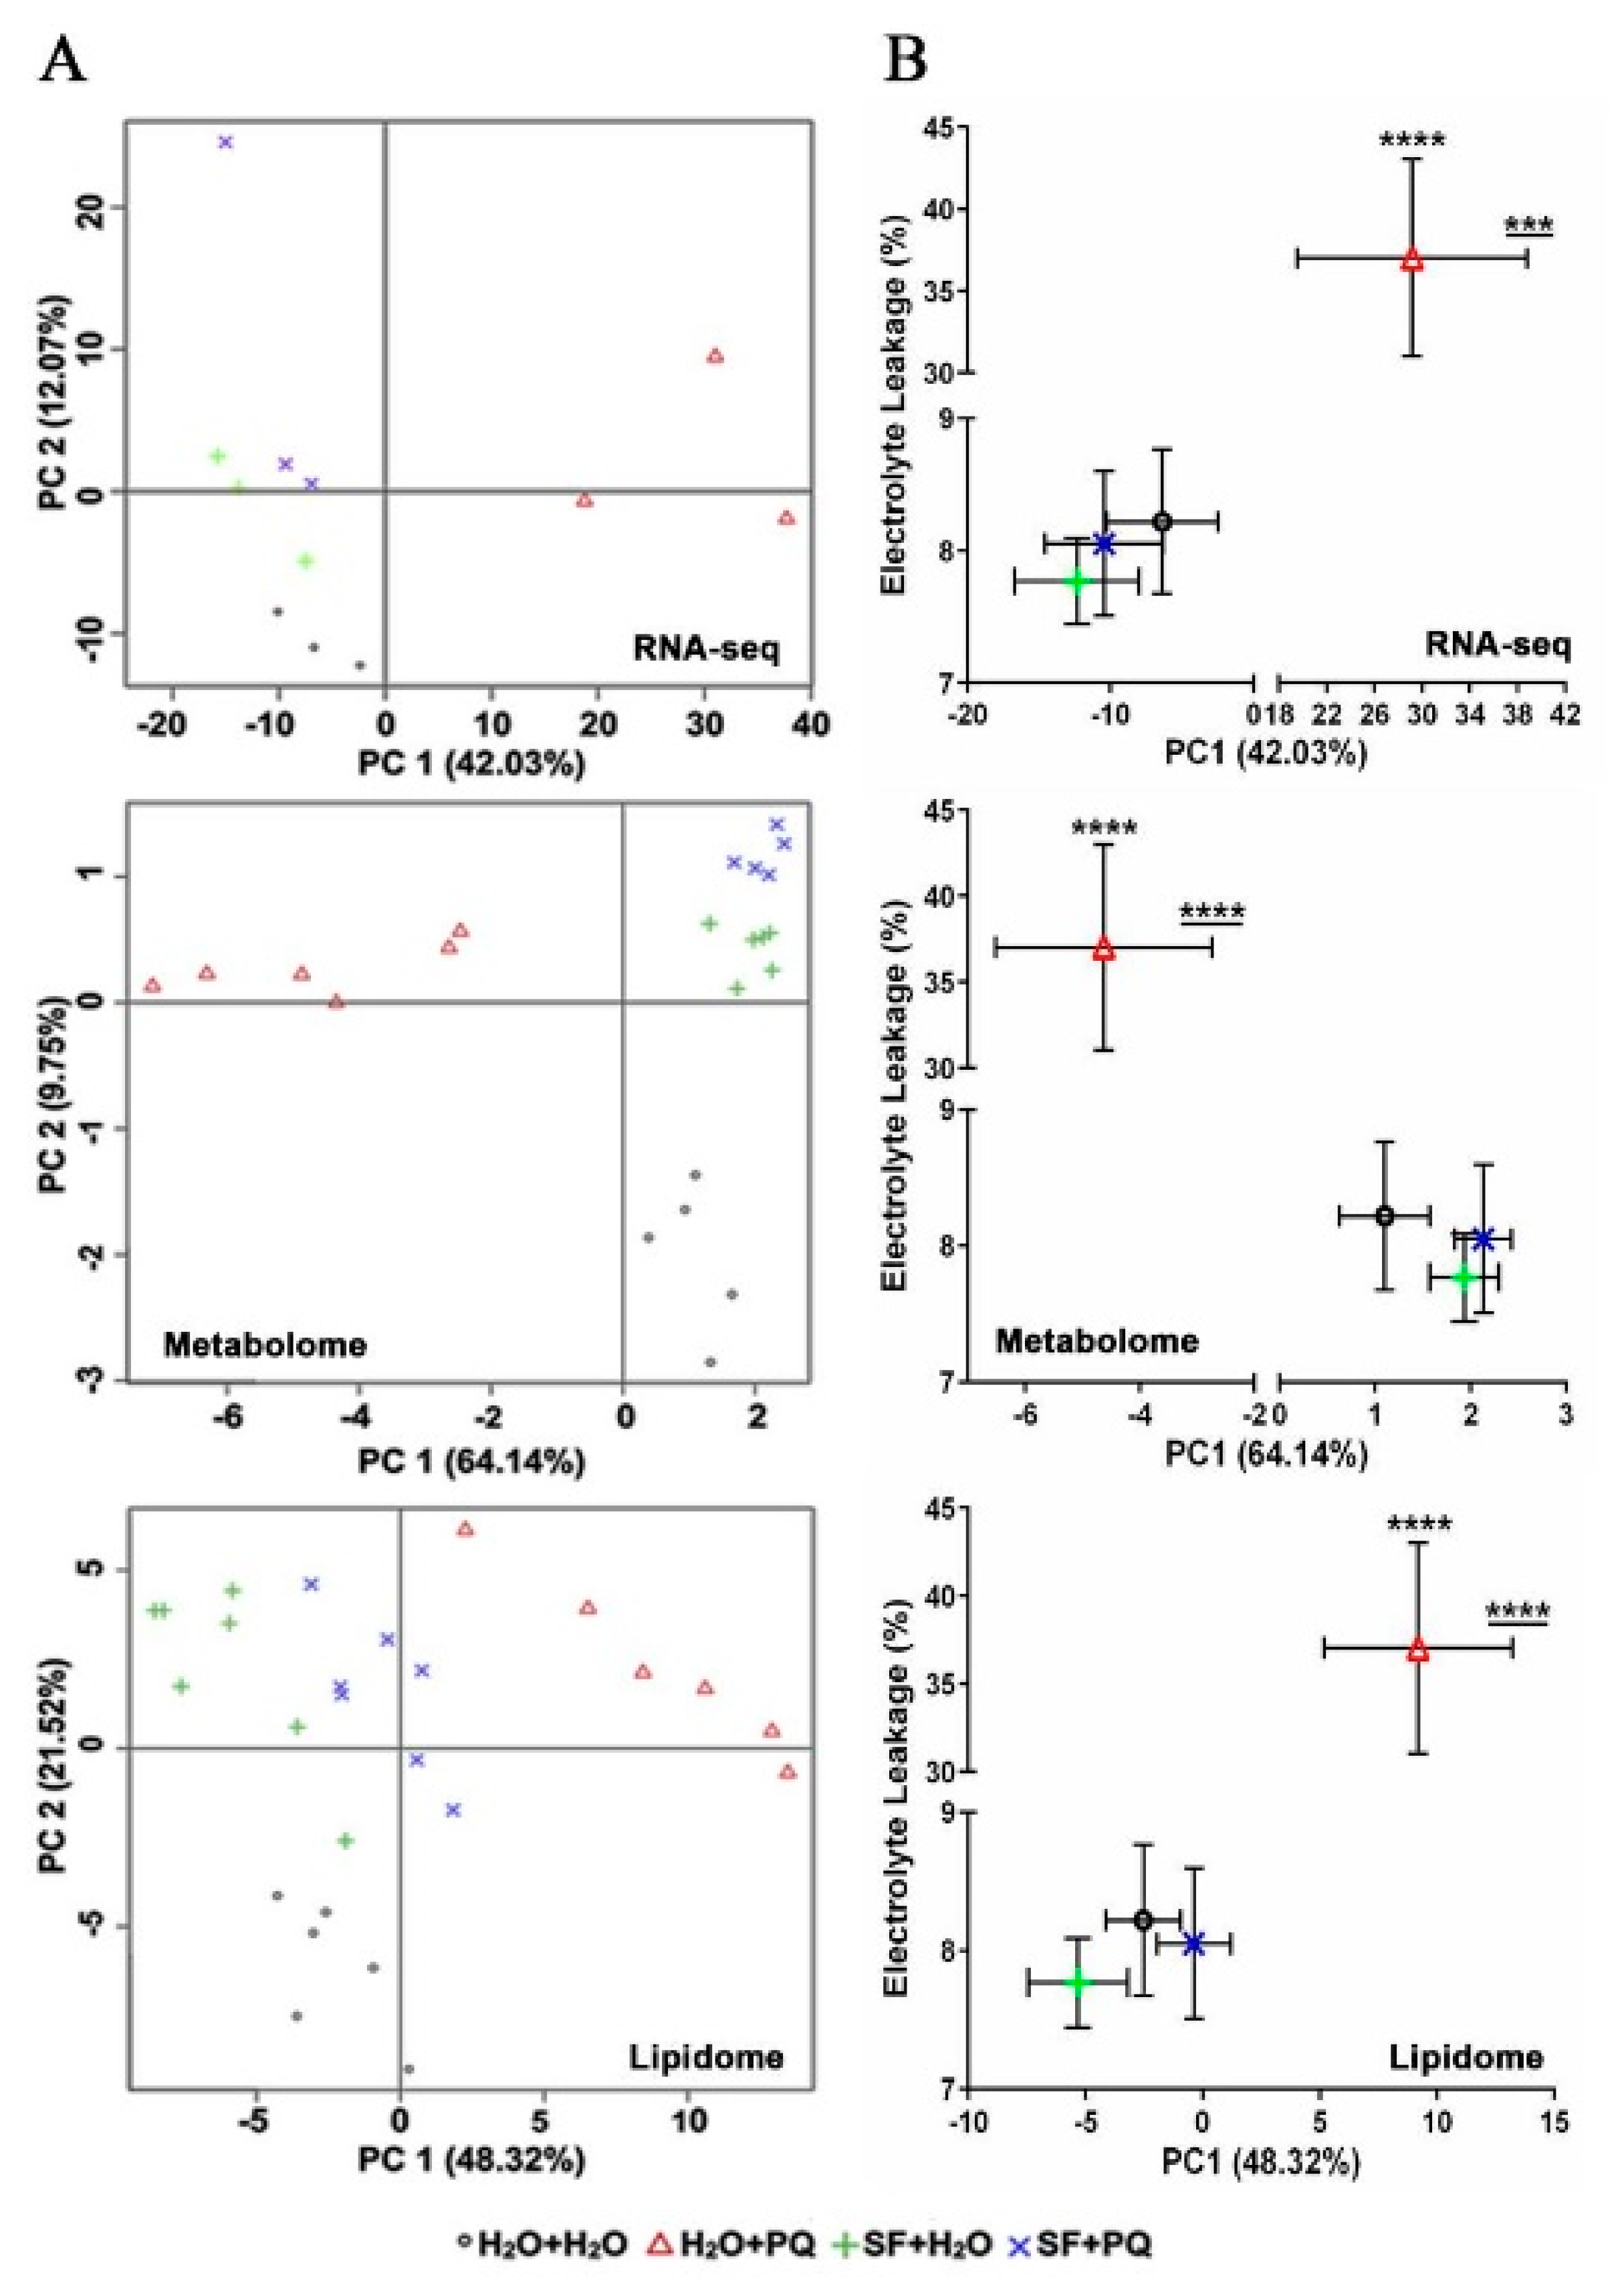
2.5. Assessment of the Relationship between Molecular and Phenotypic Changes Induced by SF

Principal component (PC) analysis (Figure 8A) demonstrates that a high level of variation in the transcriptome (42.03%), metabolome (64.14%), and lipidome (48.32%) among treatment conditions can be explained by the first component (PC1). In all cases, three of the treatment conditions (i.e., unprimed and unstressed (H2O + H2O), SF-primed and unstressed (SF + H2O), SF-primed and stressed (SF + PQ)) cluster closely together along the first component (PC1). In contrast, the unprimed but PQ-stressed group (H2O + PQ) was found to deviate significantly from the other treatment groups in all the omics approaches used (Figure 8A). This result indicates a higher similarity of H2O- and SF-treated plants at the molecular level and suggests that SF treatment induces stress adaptations by inhibiting damaging stress responses such as those induced by PQ. Furthermore, the electrolyte leakage data show a similar trend to the mean PC1 values, supporting the earlier observation (Figure 8B). This was not observed for PC2 (Figure S2 and Figure S3). Finally, the results of the PCA were strongly correlated to the visible plant phenotypes obtained (Figure 1): the two SF-treated groups are phenotypically similar to the negative control with which it clusters along PC1, whilst the oxidatively damaged plants are distant from that cluster. Thus, many of the molecular changes induced by SF and PQ manifest phenotypically.

3. Materials and Methods

3.1. Plant Material, Stress Treatments, and RNA Extraction

Arabidopsis thaliana (Columbia-0) seeds were sown in soil and the pots were kept for four days for vernalization (4 °C in darkness) for uniform seed germination. Thereafter, the pots were kept in a growth chamber in a 12 h light (150 μE m−2 s−1, 20 °C, 60% relative humidity)/12 h dark (16 °C, 70% relative humidity) cycle. At least 30 uniformly developed 23 day-old plants were used for the experiments. The Ascophyllum nodosum seaweed extract, SuperFifty (SF), was produced by and obtained from BioAtlantis Ltd. (Tralee, County Kerry, Ireland). For physiological and molecular analyses, multiple applications of 0.1% SF were performed, three times a day, starting three hours after day light by two-hour intervals, on two consecutive days. This was followed by 15 µM PQ foliar treatment, 24 h after the last SF application. Uniform spraying was achieved by spraying from a 10 cm distance and one spray/plant—the approximate volume of each spray was around 750 µL. Rosette leaves were harvested 24 h after the PQ treatment from three biological replicates for phenotypic and transcriptome analyses and from seven biological replicates for primary metabolite and lipidome analyses. Total RNA was extracted from rosette leaves of the treated plants and controls by RNeasy Plant Mini Kit (Qiagen, Hilden, Germany). Each biological replicate was a pool of at least two rosette leaves.

3.2. Electrolyte Leakage Measurements and Trypan Blue Staining

Electrolyte leakage measurements were performed at the rosette stage by checking conductivity with a HI 8733 conductivity meter (Hanna Instruments, Woonsocket, RI, USA) as described in Reference [23]. Visualization of dead cells was done using detached rosette leaves employing a slightly modified version of trypan blue staining protocol explained in Reference [105]. In short, entire detached leaves were incubated for 30 min in hot trypan blue staining solution (80–90 °C). Thereafter, leaves were de-stained by rinsing them once in water, followed by incubation in 15 M chloral hydrate for two hours. The de-staining solution was renewed when needed (two–three times) before taking photos.

3.3. Transcriptome Sequencing and Data Analysis

Transcriptome sequencing was performed by LGC Genomics (Berlin, Germany) using the Illumina HiSeq 4000 platform to obtain 75 bp-long single-end reads. The quality of raw reads was evaluated with FastQC (http://www.bioinformatics.babraham.ac.uk/projects/fastqc). Sequencing adaptors were trimmed using Cutadapt [106], and reads below 20 bp length were discarded. Ribosomal RNA contamination was assessed using SortMeRNA (v2.1) [107], and reads aligning to rRNA were filtered out. Processed reads were quantified using kallisto (v0.43.0; bootstraps: 100) [108] against Arabidopsis cDNA sequences (Araport11) [109] to obtain gene expression levels. Differential expression analysis was carried out using EdgeR package in R/Bioconductor [110]. The FDR cutoff < 0.001 and absolute log2 fold change ≥ 1 were used to identify significantly differentially expressed genes. Generation of heatmaps and clustering of genes were performed with the pheatmap R-package [111], using k-means clustering. GO enrichment of Biological Process terms and KEGG pathway enrichment analyses were carried out using GOSeq [112] and clusterProfiler [113], respectively, with FDR cutoff < 0.05. The enriched GO terms and KEGG pathways were plotted using ggplot2 R-package [114].
Sequencing data are available from the NCBI Bioproject database (www.ncbi.nlm.nih.gov/bioproject) under ID PRJNA526343.

3.4. Gas Chromatography-Mass Spectrometry (GC-MS) Analysis of Primary Metabolites

GC-MS was employed for the analysis of primary metabolites. Primary metabolites from 50 (±5) mg ground freeze-dried leaf material were extracted following extraction and derivatization procedure as described [115]. Peaks were annotated manually, and ion intensity was determined by the aid of TagFinder software [116], using a reference library from the Golm Metabolome Database [117] and following the recommended reporting format [118]. The relative abundances were normalized to fresh weight of relevant samples and were plotted as heatmap by Multiple Experiment Viewer (MeV; http://mev.tm4.org).

3.5. Lipid Profiling

Lipids were extracted from 50 (±5) mg ground freeze-dried leaf material using the methyl tert-butyl ether (MTBE) method [119]; data were analyzed as reported [23]. Raw lipid intensities were log2 transformed to bring them closer to normal distribution and to exclude the dominant effect of extreme small/large values [120]. The heatmap of fold changes was drawn using MeV.

3.6. Analysis of Differential Behavior of Metabolites and Lipids

Analysis of differential behavior was conducted on the data after the preprocessing, described above. Differential behavior between pairwise conditions (i.e., SF + PQ versus H2O + H2O, SF + H2O versus H2O + H2O, and H2O + PQ versus H2O + H2O) was inspected using a linear model. We applied the R-package limma [121]. Metabolites and lipids were considered as differentially behaving under a certain condition (SF + PQ, SF + H2O, or H2O + PQ) if their levels were significantly different from the control condition (H2O + H2O) at the significance level of 0.05 (FDR corrected).

3.7. Principal Component Analysis

Principal component analysis (PCA) from the R package pcaMethods [122] was applied to the log2 transformed metabolite/lipid data; outlier samples were removed. For transcriptome data, the log2 transformed expression levels were used for PCA analysis using the prcomp function in the R package stats.

3.8. Statistical Analysis

Statistical analysis for electrolyte leakage and PCA analysis was performed by GraphPad Prism 6.0 (GraphPad Software, San Diego, CA, USA) using one-way ANOVA followed by Tukey’s multiple comparisons test to adjust the p-values.

4. Conclusions

Our transcriptome, metabolome, and lipidome analysis provided a system-wide level understanding of the protective role induced by the Ascophyllum nodosum biostimulant SF against oxidative stress in Arabidopsis. Comparative transcriptomics identified oxidative stress mechanisms affected by SF priming. Transcription factors and genes linked to stress adaptation mechanisms, such as autophagy and reactive oxygen detoxification, were identified. Moreover, upregulation of photosynthesis, hormone signaling, and growth-related genes provided evidence for stimulation of growth induced by SF. Increased levels of several primary metabolites in SF-primed plants, including maltose and raffinose, suggest a contribution to stress protection. Lipid profiling revealed that alterations in lipids were associated with reduction of cell death and chloroplast degradation and enhancement of intracellular energy balance in SF-primed plants during oxidative stress. Collectively, our data reveal that treatment of plants with SF prior to a stress may be employed as a climate-smart strategy to alleviate oxidative stress-induced damages in crops.

Supplementary Materials

Supplementary materials can be found at https://0-www-mdpi-com.brum.beds.ac.uk/1422-0067/21/2/474/s1. Figure S1: Expression profiles of all 20 clusters obtained from k-means clustering using heatmap, Figure S2: Comparison of mean PC1 and PC2 values among treatment groups, Figure S3: Scatter plot of PC2 values versus mean electrolyte leakage (%), Table S1: Number of differentially expressed genes for each pairwise comparison, Table S2: List of 35 DEGs significantly upregulated upon SF-priming versus untreated control, Data S1: Data of Figure 1C and Figures S1 and S3, Data S2: Data of Figure 4 and Figure S1, Data S3: Data of Figure 2 and Figure 3, Data S4: Expression of known ROS marker genes, Data S5: Data of Figure 5 and Figure 6, Data S6: Data of Figure 7, Data S7: Data of Figure 8, Figures S2 and S3.

Author Contributions

T.S.G., B.M.-R., and N.S. designed the experiments, secured funding, and supervised the work; N.S. performed the original experiments that proved the priming concept of SuperFifty; M.A.O. performed most of the wet lab experiments; N.S., M.A.O., S.G., N.O., Z.N., K.J.G., Y.B., A.R.F., and T.S.G. analyzed the data; T.S.G., N.S., B.M.-R., M.A.O., and S.G. wrote the manuscript. All authors have read and agreed to the published version of the manuscript.

Funding

This work was financially supported by the European Union H2020 projects CropStrengthen (GA No. 642901) and PlantaSYST (SGA-CSA No. 739582 under FPA No. 664620).

Acknowledgments

Authors thank Christian Kappel (University of Potsdam, Germany) for providing infrastructure for bioinformatics analysis, and Karolina Garbowicz (MPI of Molecular Plant Physiology) for help in lipidome analysis.

Conflicts of Interest

N.S. and K.J.G. are scientific researchers employed by BioAtlantis Ltd. and, therefore, declare a potential conflict of interest. All other authors declare the absence of a potential conflict of interest.

References

  1. Ahmadi, H.; Corso, M.; Weber, M.; Verbruggen, N.; Clemens, S. CAX1 suppresses Cd-induced generation of reactive oxygen species in Arabidopsis halleri. Plant Cell Environ. 2018, 41, 2435–2448. [Google Scholar] [CrossRef] [PubMed]
  2. Cassia, R.; Nocioni, M.; Correa-Aragunde, N.; Lamattina, L. Climate change and the impact of greenhouse gasses: CO2 and NO, friends and foes of plant oxidative stress. Front. Plant Sci. 2018, 9, 273. [Google Scholar] [CrossRef] [PubMed]
  3. Prasad, T.K.; Anderson, M.D.; Martin, B.A.; Stewart, C.R. Evidence for chilling-induced oxidative stress in maize seedlings and a regulatory role for hydrogen peroxide. Plant Cell 1994, 6, 65–74. [Google Scholar] [CrossRef] [PubMed]
  4. Prasad, T.K.; Anderson, M.D.; Stewart, C.R. Acclimation, hydrogen peroxide, and abscisic acid protect mitochondria against irreversible chilling injury in maize seedlings. Plant Physiol. 1994, 105, 619–627. [Google Scholar] [CrossRef] [Green Version]
  5. Xu, F.J.; Jin, C.W.; Liu, W.J.; Zhang, Y.S.; Lin, X.Y. Pretreatment with H2O2 alleviates aluminum-induced oxidative stress in wheat seedlings. J. Integr. Plant Biol. 2011, 53, 44–53. [Google Scholar] [CrossRef]
  6. Gechev, T.S.; Hille, J. Molecular basis of plant stress. Cell. Mol. Life Sci. 2012, 69, 3161–3163. [Google Scholar] [CrossRef] [Green Version]
  7. Chen, R.; Sun, S.; Wang, C.; Li, Y.; Liang, Y.; An, F.; Li, C.; Dong, H.; Yang, X.; Zhang, J.; et al. The Arabidopsis PARAQUAT RESISTANT2 gene encodes an S-nitrosoglutathione reductase that is a key regulator of cell death. Cell Res. 2009, 19, 1377–1387. [Google Scholar] [CrossRef] [Green Version]
  8. Gechev, T.S.; Van Breusegem, F.; Stone, J.M.; Denev, I.; Laloi, C. Reactive oxygen species as signals that modulate plant stress responses and programmed cell death. BioEssays 2006, 28, 1091–1101. [Google Scholar] [CrossRef]
  9. Li, J.; Mu, J.; Bai, J.; Fu, F.; Zou, T.; An, F.; Zhang, J.; Jing, H.; Wang, Q.; Li, Z.; et al. PARAQUAT RESISTANT1, a golgi-localized putative transporter protein, is involved in intracellular transport of paraquat. Plant Physiol. 2013, 162, 470–483. [Google Scholar] [CrossRef] [Green Version]
  10. Luo, C.; Cai, X.T.; Du, J.; Zhao, T.L.; Wang, P.F.; Zhao, P.X.; Liu, R.; Xie, Q.; Cao, X.F.; Xiang, C. PARAQUAT TOLERANCE3 is an E3 ligase that switches off activated oxidative response by targeting histone-modifying PROTEIN METHYLTRANSFERASE4b. PLoS Genet. 2016, 12, e1006332. [Google Scholar] [CrossRef] [Green Version]
  11. Sukrong, S.; Yun, K.Y.; Stadler, P.; Kumar, C.; Facciuolo, T.; Moffatt, B.A.; Falcone, D.L. Improved growth and stress tolerance in the Arabidopsis oxt1 mutant triggered by altered adenine metabolism. Mol. Plant 2012, 5, 1310–1332. [Google Scholar] [CrossRef] [PubMed] [Green Version]
  12. Xi, J.; Xu, P.; Xiang, C. Loss of AtPDR11, a plasma membrane-localized ABC transporter, confers paraquat tolerance in Arabidopsis thaliana. Plant J. 2012, 69, 782–791. [Google Scholar] [CrossRef] [PubMed]
  13. Zhang, J.; Addepalli, B.; Yun, K.Y.; Hunt, A.G.; Xu, R.; Rao, S.; Li, Q.Q.; Falcone, D.L. A polyadenylation factor subunit implicated in regulating oxidative signaling in Arabidopsis thaliana. PLoS ONE 2008, 3, e2410. [Google Scholar] [CrossRef] [PubMed] [Green Version]
  14. Pulido, P.; Llamas, E.; Rodriguez-Concepcion, M. Both Hsp70 chaperone and Clp protease plastidial systems are required for protection against oxidative stress. Plant Signal. Behav. 2017, 12, e1290039. [Google Scholar] [CrossRef] [PubMed] [Green Version]
  15. Sharma, A.; Kumar, D.; Kumar, S.; Rampuria, S.; Reddy, A.R.; Kirti, P.B. Ectopic expression of an atypical hydrophobic group 5 LEA protein from wild peanut, Arachis diogoi confers abiotic stress tolerance in tobacco. PLoS ONE 2016, 11, e0150609. [Google Scholar] [CrossRef] [PubMed] [Green Version]
  16. Gechev, T.S.; Gadjev, I.; Van Breusegem, F.; Inzé, D.; Dukiandjiev, S.; Toneva, V.; Minkov, I. Hydrogen peroxide protects tobacco from oxidative stress by inducing a set of antioxidant enzymes. Cell. Mol. Life Sci. 2002, 59, 708–714. [Google Scholar] [CrossRef] [PubMed]
  17. Hafez, Y.M.; Bacsó, R.; Király, Z.; Künstler, A.; Király, L. Up-regulation of antioxidants in tobacco by low concentrations of H2O2 suppresses necrotic disease symptoms. Phytopathology 2012, 102, 848–856. [Google Scholar] [CrossRef] [Green Version]
  18. Martínez-Gutiérrez, R.; Mora-Herrera, M.E.; López-Delgado, H.A. Exogenous H2O2 in phytoplasma-infected potato plants promotes antioxidant activity and tuber production under drought conditions. Am. J. Potato Res. 2012, 89, 53–62. [Google Scholar] [CrossRef]
  19. Moskova, I.; Todorova, D.; Alexieva, V.; Ivanov, S.; Sergiev, I. Effect of exogenous hydrogen peroxide on enzymatic and nonenzymatic antioxidants in leaves of young pea plants treated with paraquat. Plant Growth Regul. 2009, 57, 193–202. [Google Scholar] [CrossRef]
  20. Romero-Romero, M.T.; López-Delgado, H.A. Ameliorative effects of hydrogen peroxide, ascorbate and dehydroascorbate in Solanum tuberosum infected by phytoplasma. Am. J. Potato Res. 2009, 86, 218–226. [Google Scholar] [CrossRef]
  21. Obata, T.; Fernie, A.R. The use of metabolomics to dissect plant responses to abiotic stresses. Cell. Mol. Life Sci. 2012, 69, 3225–3243. [Google Scholar] [CrossRef] [PubMed] [Green Version]
  22. Dautel, S.E.; Kyle, J.E.; Clair, G.; Sontag, R.L.; Weitz, K.K.; Shukla, A.K.; Nguyen, S.N.; Kim, Y.M.; Zink, E.M.; Luders, T.; et al. Lipidomics reveals dramatic lipid compositional changes in the maturing postnatal lung. Sci. Rep. 2017, 7, 40555. [Google Scholar] [CrossRef] [PubMed] [Green Version]
  23. Durgud, M.; Gupta, S.; Ivanov, I.; Omidbakhshfard, M.A.; Benina, M.; Alseekh, S.; Staykov, N.; Hauenstein, M.; Dijkwel, P.P.; Hörtensteiner, S.; et al. Molecular mechanisms preventing senescence in response to prolonged darkness in a desiccation-tolerant plant. Plant Physiol. 2018, 177, 1319–1338. [Google Scholar] [CrossRef] [PubMed] [Green Version]
  24. Jannin, L.; Arkoun, M.; Etienne, P.; Laîné, P.; Goux, D.; Garnica, M.; Fuentes, M.; Francisco, S.S.; Baigorri, R.; Cruz, F.; et al. Brassica napus growth is promoted by Ascophyllum nodosum (L.) Le Jol. seaweed extract: Microarray analysis and physiological characterization of N, C, and S metabolisms. J. Plant Growth Regul. 2013, 32, 31–52. [Google Scholar] [CrossRef]
  25. Khan, W.; Rayirath, U.P.; Subramanian, S.; Jithesh, M.N.; Rayorath, P.; Hodges, D.M.; Critchley, A.T.; Craigie, J.S.; Norrie, J.; Prithiviraj, B. Seaweed extracts as biostimulants of plant growth and development. J. Plant Growth Regul. 2009, 28, 386–399. [Google Scholar] [CrossRef]
  26. Rouphael, Y.; Colla, G. Synergistic biostimulatory action: Designing the next generation of plant biostimulants for sustainable agriculture. Front. Plant Sci. 2018, 9, 1655. [Google Scholar] [CrossRef] [Green Version]
  27. Yakhin, O.I.; Lubyanov, A.A.; Yakhin, I.A.; Brown, P.H. Biostimulants in plant science: A global perspective. Front. Plant Sci. 2017, 7, 2049. [Google Scholar] [CrossRef] [Green Version]
  28. Sharma, H.S.S.; Fleming, C.; Selby, C.; Rao, J.R.; Martin, T. Plant biostimulants: A review on the processing of macroalgae and use of extracts for crop management to reduce abiotic and biotic stresses. J. Appl. Phycol. 2014, 26, 465–490. [Google Scholar] [CrossRef]
  29. Guinan, K.; Sujeeth, N.; Copeland, R.; Jones, P.; O’brien, N.; Sharma, H.; Prouteau, P.F.J.; O’Sullivan, J. Discrete roles for extracts of Ascophyllum nodosum in enhancing plant growth and tolerance to abiotic and biotic stresses. In: World Congress on the Use of Biostimulants in Agriculture. Acta Hortic. 2013, 1009, 127–135. [Google Scholar] [CrossRef]
  30. Di Stasio, E.; Van Oosten, M.J.; Silletti, S.; Raimondi, G.; dell’Aversana, E.; Carillo, P.; Maggio, A. Ascophyllum nodosum-based algal extracts act as enhancers of growth, fruit quality, and adaptation to stress in salinized tomato plants. J. Appl. Phycol. 2018, 30, 2675–2686. [Google Scholar] [CrossRef]
  31. Santaniello, A.; Scartazza, A.; Gresta, F.; Loreti, E.; Biasone, A.; Di Tommaso, D.; Piaggesi, A.; Perata, P. Ascophyllum nodosum seaweed extract alleviates drought stress in Arabidopsis by affecting photosynthetic performance and related gene expression. Front. Plant Sci. 2017, 8, 1362. [Google Scholar] [CrossRef] [PubMed] [Green Version]
  32. Shukla, P.S.; Mantin, E.G.; Adil, M.; Bajpai, S.; Critchley, A.T.; Prithiviraj, B. Ascophyllum nodosum-based biostimulants: Sustainable applications in agriculture for the stimulation of plant growth, stress tolerance, and disease management. Front. Plant Sci. 2019, 10, 655. [Google Scholar] [CrossRef] [Green Version]
  33. Sharma, N.; Bhalla, P.; Singh, M. Transcriptome-wide profiling and expression analysis of transcription factor families in a liverwort, Marchantia polymorpha. BMC Genomics 2013, 14, 915. [Google Scholar] [CrossRef] [Green Version]
  34. Goñi, O.; Quille, P.; O’Connell, S. Ascophyllum nodosum extract biostimulants and their role in enhancing tolerance to drought stress in tomato plants. Plant Physiol. Biochem. 2018, 126, 63–73. [Google Scholar] [CrossRef] [PubMed]
  35. Shukla, P.S.; Borza, T.; Critchley, A.T.; Hiltz, D.; Norrie, J.; Prithiviraj, B. Ascophyllum nodosum extract mitigates salinity stress in Arabidopsis thaliana by modulating the expression of miRNA involved in stress tolerance and nutrient acquisition. PLoS ONE 2018, 13, e0206221. [Google Scholar] [CrossRef] [PubMed] [Green Version]
  36. Qureshi, M.K.; Sujeeth, N.; Gechev, T.S.; Hille, J. The zinc finger protein ZAT11 modulates paraquat-induced programmed cell death in Arabidopsis thaliana. Acta Physiol. Plant. 2013, 35, 1863–1871. [Google Scholar] [CrossRef] [Green Version]
  37. Lee, S.B.; Lee, S.J.; Kim, S.Y. AtERF15 is a positive regulator of ABA response. Plant Cell Rep. 2015, 34, 71–81. [Google Scholar] [CrossRef]
  38. Saelim, L.; Akiyoshi, N.; Tan, T.T.; Ihara, A.; Yamaguchi, M.; Hirano, K.; Matsuoka, M.; Demura, T.; Ohtani, M. Arabidopsis Group IIId ERF proteins positively regulate primary cell wall-type CESA genes. J. Plant. Res. 2019, 132, 117–129. [Google Scholar] [CrossRef]
  39. Graeff, M.; Straub, D.; Eguen, T.; Dolde, U.; Rodrigues, V.; Brandt, R.; Wenkel, S. MicroProtein-mediated recruitment of CONSTANS into a TOPLESS trimeric complex represses flowering in Arabidopsis. PLoS Genet. 2016, 12, e1005959. [Google Scholar] [CrossRef] [Green Version]
  40. Wei, G.; Pan, Y.; Lei, J.; Zhu, Y.X. Molecular cloning, phylogenetic analysis, expressional profiling and in vitro studies of TINY2 from Arabidopsis thaliana. J. Biochem. Mol. Biol. 2005, 38, 440–446. [Google Scholar] [CrossRef] [Green Version]
  41. Gong, D.; Zhang, C.; Chen, X.; Gong, Z.; Zhu, J.K. Constitutive activation and transgenic evaluation of the function of an Arabidopsis PKS protein kinase. J. Biol. Chem. 2002, 277, 42088–42096. [Google Scholar] [CrossRef] [PubMed] [Green Version]
  42. Dhonukshe, P.; Huang, F.; Galvan-Ampudia, C.S.; Mähönen, A.P.; Kleine-Vehn, J.; Xu, J.; Quint, A.; Prasad, K.; Friml, J.; Scheres, B.; et al. Plasma membrane-bound AGC3 kinases phosphorylate PIN auxin carriers at TPRXS (N/S) motifs to direct apical PIN recycling. Development 2010, 137, 3245–3255. [Google Scholar] [CrossRef] [PubMed] [Green Version]
  43. Duan, K.; Yi, K.; Dang, L.; Huang, H.; Wu, W.; Wu, P. Characterization of a sub-family of Arabidopsis genes with the SPX domain reveals their diverse functions in plant tolerance to phosphorus starvation. Plant J. 2008, 54, 965–975. [Google Scholar] [CrossRef] [PubMed]
  44. Kanehisa, M.; Goto, S. KEGG: Kyoto Encyclopedia of Genes and Genomes. Nucleic Acids Res. 2000, 28, 27–30. [Google Scholar] [CrossRef]
  45. Gechev, T.S.; Ferwerda, M.A.; Mehterov, N.; Laloi, C.; Qureshi, M.K.; Hille, J. Arabidopsis AAL-toxin-resistant mutant atr1 shows enhanced tolerance to programmed cell death induced by reactive oxygen species. Biochem. Biophys. Res. Commun. 2008, 375, 639–644. [Google Scholar] [CrossRef] [Green Version]
  46. Saibo, N.J.M.; Lourenço, T.; Oliveira, M.M. Transcription factors and regulation of photosynthetic and related metabolism under environmental stresses. Ann. Bot. 2009, 103, 609–623. [Google Scholar] [CrossRef] [Green Version]
  47. Gadjev, I.; Vanderauwera, S.; Gechev, T.S.; Laloi, C.; Minkov, I.N.; Shulaev, V.; Apel, K.; Inzé, D.; Mittler, R.; Van Breusegem, F. Transcriptomic footprints disclose specificity of reactive oxygen species signaling in Arabidopsis. Plant Physiol. 2006, 141, 436–445. [Google Scholar] [CrossRef] [Green Version]
  48. Mehterov, N.; Balazadeh, S.; Hille, J.; Toneva, V.; Mueller-Roeber, B.; Gechev, T.S. Oxidative stress provokes distinct transcriptional responses in the stress-tolerant atr7 and stress-sensitive loh2 Arabidopsis thaliana mutants as revealed by multi-parallel quantitative real-time PCR analysis of ROS markers and antioxidant genes. Plant Physiol. Biochem. 2012, 59, 20–29. [Google Scholar] [CrossRef] [Green Version]
  49. Benina, M.; Ribeiro, D.M.; Gechev, T.S.; Mueller-Roeber, B.; Schippers, J.H.M. A cell type-specific view on the translation of mRNAs from ROS-responsive genes upon paraquat treatment of Arabidopsis thaliana leaves. Plant Cell Environ. 2015, 38, 349–363. [Google Scholar] [CrossRef]
  50. Ho, L.H.M.; Giraud, E.; Uggalla, V.; Lister, R.; Clifton, R.; Glen, A.; Thirkettle-Watts, D.; Van Aken, O.; Whelan, J. Identification of regulatory pathways controlling gene expression of stress-responsive mitochondrial proteins in Arabidopsis. Plant Physiol. 2008, 147, 1858–1873. [Google Scholar] [CrossRef] [Green Version]
  51. Petrov, V.; Hille, J.; Mueller-Roeber, B.; Gechev, T.S. ROS-mediated abiotic stress-induced programmed cell death in plants. Front. Plant Sci. 2015, 6, 69. [Google Scholar] [CrossRef] [PubMed] [Green Version]
  52. Ge, X.; Dietrich, C.; Matsuno, M.; Li, G.; Berg, H.; Xia, Y. An Arabidopsis aspartic protease functions as an anti-cell-death component in reproduction and embryogenesis. EMBO Rep. 2005, 6, 282–288. [Google Scholar] [CrossRef] [PubMed] [Green Version]
  53. Xiao, D.; Cui, Y.; Xu, F.; Xu, X.; Gao, G.; Wang, Y.; Guo, Z.; Wang, D.; Wang, N.N. SENESCENCE-SUPPRESSED PROTEIN PHOSPHATASE directly interacts with the cytoplasmic domain of SENESCENCE-ASSOCIATED RECEPTOR-LIKE KINASE and negatively regulates leaf senescence in Arabidopsis. Plant Physiol. 2015, 169, 1275–1291. [Google Scholar] [CrossRef] [PubMed] [Green Version]
  54. Kamranfar, I.; Xue, G.; Tohge, T.; Sedaghatmehr, M.; Fernie, A.R.; Balazadeh, S.; Mueller-Roeber, B. Transcription factor RD26 is a key regulator of metabolic reprogramming during dark-induced senescence. New Phytol. 2018, 218, 1543–1557. [Google Scholar] [CrossRef] [Green Version]
  55. Li, S.; Gao, J.; Yao, L.; Ren, G.; Zhu, X.; Gao, S.; Qiu, K.; Zhou, X.; Kuai, B. The role of ANAC072 in the regulation of chlorophyll degradation during age- and dark-induced leaf senescence. Plant Cell Rep. 2016, 35, 1729–1741. [Google Scholar] [CrossRef]
  56. Schippers, J.H.M.; Jing, H.-C.; Hille, J.; Dijkwel, P.P. Developmental and hormonal control of leaf senescence. In Senescence Processes in Plants; Gan, S., Ed.; Blackwell Publishing Ltd.: Oxford, UK, 2007; pp. 145–164. [Google Scholar]
  57. Fujii, T.; Yokoyama, E.; Inoue, K.; Sakurai, H. The sites of electron donation of Photosystem I to methyl viologen. Biochim. Biophys. Acta Bioenerg. 1990, 1015, 41–48. [Google Scholar] [CrossRef]
  58. Váradi, G.; Darkó, E.; Lehoczki, E. Changes in the xanthophyll cycle and fluorescence quenching indicate light-dependent early events in the action of paraquat and the mechanism of resistance to paraquat in Erigeron canadensis (L.) cronq. Plant Physiol. 2000, 123, 1459–1470. [Google Scholar] [CrossRef] [Green Version]
  59. Ekmekci, Y.; Terzioglu, S. Effects of oxidative stress induced by paraquat on wild and cultivated wheats. Pestic. Biochem. Physiol. 2005, 83, 69–81. [Google Scholar] [CrossRef]
  60. Vanhoudt, N.; Vandenhove, H.; Horemans, N.; Wannijn, J.; Bujanic, A.; Vangronsveld, J.; Cuypers, A. Study of oxidative stress related responses induced in Arabidopsis thaliana following mixed exposure to uranium and cadmium. Plant Physiol. Biochem. 2010, 48, 879–886. [Google Scholar] [CrossRef]
  61. Wang, Y.-Y.; Hecker, A.G.; Hauser, B.A. The APX4 locus regulates seed vigor and seedling growth in Arabidopsis thaliana. Planta 2014, 239, 909–919. [Google Scholar] [CrossRef]
  62. Xie, Y.; Mao, Y.; Lai, D.; Zhang, W.; Zheng, T.; Shen, W. Roles of NIA/NR/NOA1-dependent nitric oxide production and HY1 expression in the modulation of Arabidopsis salt tolerance. J. Exp. Bot. 2013, 64, 3045–3060. [Google Scholar] [CrossRef] [PubMed] [Green Version]
  63. Bu, Y.; Sun, B.; Zhou, A.; Zhang, X.; Takano, T.; Liu, S. Overexpression of AtOxR gene improves abiotic stresses tolerance and vitamin C content in Arabidopsis thaliana. BMC Biotechnol. 2016, 16, 69. [Google Scholar] [CrossRef] [PubMed] [Green Version]
  64. Akram, N.A.; Shafiq, F.; Ashraf, M. Ascorbic Acid-A Potential Oxidant Scavenger and Its Role in Plant Development and Abiotic Stress Tolerance. Front. Plant Sci. 2017, 8, 613. [Google Scholar] [CrossRef] [PubMed]
  65. Anjum, N.A.; Gill, S.S.; Gill, R.; Hasanuzzaman, M.; Duarte, A.C.; Pereira, E.; Tuteja, N. Metal/metalloid stress tolerance in plants: Role of ascorbate, its redox couple, and associated enzymes. Protoplasma 2014, 251, 1265–1283. [Google Scholar] [CrossRef]
  66. De Tullio, M.; Guether, M.; Balestrini, R. Ascorbate oxidase is the potential conductor of a symphony of signaling pathways. Plant Signal. Behav. 2013, 8, e23213. [Google Scholar] [CrossRef] [Green Version]
  67. Horemans, N.; Foyer, C.H.; Asard, H. Transport and action of ascorbate at the plant plasma membrane. Trends Plant Sci. 2000, 5, 263–267. [Google Scholar] [CrossRef]
  68. Parker, S.C.J.; Margulies, E.H.; Tullius, T.D. The relationship between fine scale DNA structure, GC content, and functional elements in 1% of the human genome. Genome Inform. 2008, 20, 199–211. [Google Scholar]
  69. Nechushtai, R.; Conlan, A.R.; Harir, Y.; Song, L.; Yogev, O.; Eisenberg-Domovich, Y.; Livnah, O.; Michaeli, D.; Rosen, R.; Ma, V.; et al. Characterization of Arabidopsis NEET reveals an ancient role for NEET proteins in iron metabolism. Plant Cell 2012, 24, 2139–2154. [Google Scholar] [CrossRef] [Green Version]
  70. Asada, K. Production and scavenging of reactive oxygen species in chloroplasts and their functions. Plant Physiol. 2006, 141, 391–396. [Google Scholar] [CrossRef] [Green Version]
  71. Halliwell, B.; Gutteridge, J.M.C. Free Radicals in Biology and Medicine; Oxford University Press: Oxford, UK, 2007. [Google Scholar]
  72. Busi, R.; Vila-Aiub, M.M.; Powles, S.B. Genetic control of a cytochrome P450 metabolism-based herbicide resistance mechanism in Lolium rigidum. Heredity 2011, 106, 817–824. [Google Scholar] [CrossRef] [Green Version]
  73. Höfer, R.; Boachon, B.; Renault, H.; Gavira, C.; Miesch, L.; Iglesias, J.; Ginglinger, J.F.; Allouche, L.; Miesch, M.; Grec, S.; et al. Dual function of the cytochrome P450 CYP76 family from Arabidopsis thaliana in the metabolism of monoterpenols and phenylurea herbicides. Plant Physiol. 2014, 166, 1149–1161. [Google Scholar] [CrossRef] [PubMed] [Green Version]
  74. Giacomelli, L.; Rudella, A.; van Wijk, K.J. High light response of the thylakoid proteome in Arabidopsis wild type and the ascorbate-deficient mutant vtc2-2. A comparative proteomics study. Plant Physiol. 2006, 141, 685–701. [Google Scholar] [CrossRef] [PubMed] [Green Version]
  75. Pattanayak, G.K.; Tripathy, B.C. Overexpression of protochlorophyllide oxidoreductase C regulates oxidative stress in Arabidopsis. PLoS ONE 2011, 6, e26532. [Google Scholar] [CrossRef] [PubMed]
  76. Nishizawa, A.; Yabuta, Y.; Shigeoka, S. Galactinol and raffinose constitute a novel function to protect plants from oxidative damage. Plant Physiol. 2008, 147, 1251–1263. [Google Scholar] [CrossRef] [Green Version]
  77. Markakis, M.; De Cnodder, T.; Lewandowski, M.; Simon, D.; Boron, A.; Balcerowicz, D.; Doubbo, T.; Taconnat, L.; Renou, J.-P.; Höfte, H.; et al. Identification of genes involved in the ACC-mediated control of root cell elongation in Arabidopsis thaliana. BMC Plant Biol. 2012, 12, 208. [Google Scholar] [CrossRef] [Green Version]
  78. Urbanowicz, B.R.; Bennett, A.B.; del Campillo, E.; Catala, C.; Hayashi, T.; Henrissat, B.; Höfte, H.; McQueen-Mason, S.J.; Patterson, S.E.; Shoseyov, O.; et al. Structural organization and a standardized nomenclature for plant endo-1,4-β-glucanases (cellulases) of glycosyl hydrolase family 9. Plant Physiol. 2007, 144, 1693–1696. [Google Scholar] [CrossRef] [Green Version]
  79. Zhong, R.; Cui, D.; Ye, Z.-H. Xyloglucan O-acetyltransferases from Arabidopsis thaliana and Populus trichocarpa catalyze acetylation of fucosylated galactose residues on xyloglucan side chains. Planta 2018, 248, 1159–1171. [Google Scholar] [CrossRef]
  80. Nafisi, M.; Stranne, M.; Fimognari, L.; Atwell, S.; Martens, H.J.; Pedas, P.R.; Hansen, S.F.; Nawrath, C.; Scheller, H.V.; Kliebenstein, D.J.; et al. Acetylation of cell wall is required for structural integrity of the leaf surface and exerts a global impact on plant stress responses. Front. Plant Sci. 2015, 6, 550. [Google Scholar] [CrossRef]
  81. Xiong, Y.; Contento, A.L.; Nguyen, P.Q.; Bassham, D.C. Degradation of oxidized proteins by autophagy during oxidative stress in Arabidopsis. Plant Physiol. 2007, 143, 291–299. [Google Scholar] [CrossRef] [Green Version]
  82. Lai, Z.; Li, Y.; Wang, F.; Cheng, Y.; Fan, B.; Yu, J.-Q.; Chen, Z. Arabidopsis sigma factor binding proteins are activators of the WRKY33 transcription factor in plant defense. Plant Cell 2011, 23, 3824–3841. [Google Scholar] [CrossRef] [Green Version]
  83. Zhou, J.; Wang, J.; Yu, J.-Q.; Chen, Z. Role and regulation of autophagy in heat stress responses of tomato plants. Front. Plant Sci. 2014, 5, 174. [Google Scholar] [CrossRef] [PubMed] [Green Version]
  84. Chen, Q.; Soulay, F.; Saudemont, B.; Elmayan, T.; Marmagne, A.; Masclaux-Daubresse, C. Overexpression of ATG8 in Arabidopsis stimulates autophagic activity and increases nitrogen remobilization efficiency and grain filling. Plant Cell Physiol. 2018, 60, 343–352. [Google Scholar] [CrossRef] [PubMed]
  85. Olenieva, V.; Lytvyn, D.; Yemets, A.; Bergounioux, C.; Blume, Y. Tubulin acetylation accompanies autophagy development induced by different abiotic stimuli in Arabidopsis thaliana. Cell Biol. Int. 2017. [Google Scholar] [CrossRef] [PubMed]
  86. Louis, J.; Lorenc-Kukula, K.; Singh, V.; Reese, J.; Jander, G.; Shah, J. Antibiosis against the green peach aphid requires the Arabidopsis thaliana MYZUS PERSICAE-INDUCED LIPASE1 gene. Plant J. 2010, 64, 800–811. [Google Scholar] [CrossRef]
  87. Du, J.; Huang, Y.; Xi, J.; Cao, M.; Ni, W.; Chen, X.; Zhu, J.K.; Oliver, D.J.; Xiang, C.B. Functional gene-mining for salt-tolerance genes with the power of Arabidopsis. Plant J. 2008, 56, 653–664. [Google Scholar] [CrossRef] [Green Version]
  88. Fan, J.; Yu, L.; Xu, C. A central role for triacylglycerol in membrane lipid breakdown, fatty acid β-oxidation, and plant survival under extended darkness. Plant Physiol. 2017, 174, 1517–1530. [Google Scholar] [CrossRef] [Green Version]
  89. Foyer, C.H.; Noctor, G. Ascorbate and glutathione: The heart of the redox hub. Plant Physiol. 2011, 155, 2–18. [Google Scholar] [CrossRef] [Green Version]
  90. Lehmann, M.; Schwarzländer, M.; Obata, T.; Sirikantaramas, S.; Burow, M.; Olsen, C.E.; Tohge, T.; Frickler, M.D.; Møller, B.L.; Fernie, A.R.; et al. The metabolic response of Arabidopsis roots to oxidative stress is distinct from that of heterotrophic cells in culture and highlights a complex relationship between the levels of transcripts, metabolites, and flux. Mol. Plant 2009, 2, 390–406. [Google Scholar] [CrossRef] [Green Version]
  91. Noctor, G.; Lelarge-Trouverie, C.; Mhamdi, A. The metabolomics of oxidative stress. Phytochemistry 2015, 112, 33–53. [Google Scholar] [CrossRef]
  92. Shen, T.; Rui, B.; Zhou, H.; Zhang, X.; Yi, Y.; Wen, H.; Zheng, H.; Wu, J.; Shi, Y. Metabolic flux ratio analysis and multi-objective optimization revealed a globally conserved and coordinated metabolic response of E. coli to paraquat-induced oxidative stress. Mol. BioSyst. 2013, 9, 121–132. [Google Scholar] [CrossRef]
  93. Mei, X.; Chen, Y.; Zhang, L.; Fu, X.; Wei, Q.; Grierson, D.; Zhou, Y.; Huang, Y.; Dong, F.; Yang, Z. Dual mechanisms regulating glutamate decarboxylases and accumulation of gamma-aminobutyric acid in tea (Camellia sinensis) leaves exposed to multiple stresses. Sci. Rep. 2016, 6, 23685. [Google Scholar] [CrossRef] [PubMed] [Green Version]
  94. Bouché, N.; Fromm, H. GABA in plants: Just a metabolite? Trends Plant Sci. 2004, 9, 110–115. [Google Scholar] [CrossRef] [PubMed]
  95. Bown, A.W.; Shelp, B.J. Plant GABA: Not Just a Metabolite. Trends Plant Sci. 2016, 21, 811–813. [Google Scholar] [CrossRef] [PubMed]
  96. Watanabe, M.; Balazadeh, S.; Tohge, T.; Erban, A.; Giavalisco, P.; Kopka, J.; Mueller-Roeber, B.; Fernie, A.F.; Hoefgen, R. Comprehensive dissection of spatiotemporal metabolic shifts in primary, secondary, and lipid metabolism during developmental senescence in Arabidopsis. Plant Physiol. 2013, 162, 1290–1310. [Google Scholar] [CrossRef] [PubMed] [Green Version]
  97. Araújo, W.L.; Nunes-Nesi, A.; Nikoloski, Z.; Sweetlove, L.J.; Fernie, A.R. Metabolic control and regulation of the tricarboxylic acid cycle in photosynthetic and heterotrophic plant tissues. Plant Cell Environ. 2012, 35, 1–21. [Google Scholar] [CrossRef] [PubMed] [Green Version]
  98. Zell, M.B.; Fahnenstich, H.; Maier, A.; Saigo, M.; Voznesenskaya, E.V.; Edwards, G.E.; Andreo, C.; Schleifenbaum, F.; Zell, C.; Drincovich, M.F.; et al. Analysis of Arabidopsis with highly reduced levels of malate and fumarate sheds light on the role of these organic acids as storage carbon molecules. Plant Physiol. 2010, 152, 1251–1262. [Google Scholar] [CrossRef] [Green Version]
  99. Gupta, K.J.; Shah, J.K.; Brotman, Y.; Jahnke, K.; Willmitzer, L.; Kaiser, W.M.; Bauwe, H.; Igamberdiev, A.U. Inhibition of aconitase by nitric oxide leads to induction of the alternative oxidase and to a shift of metabolism towards biosynthesis of amino acids. J. Exp. Bot. 2012, 63, 1773–1784. [Google Scholar] [CrossRef] [Green Version]
  100. Maeda, H.; Song, W.; Sage, T.L.; DellaPenna, D. Tocopherols play a crucial role in low-temperature adaptation and phloem loading in Arabidopsis. Plant Cell 2006, 18, 2710–2732. [Google Scholar] [CrossRef] [Green Version]
  101. Kaplan, F.; Guy, C.L. β-amylase induction and the protective role of maltose during temperature shock. Plant Physiol. 2004, 135, 1674–1684. [Google Scholar] [CrossRef] [Green Version]
  102. Okazaki, Y.; Saito, K. Roles of lipids as signaling molecules and mitigators during stress response in plants. Plant J. 2014, 79, 584–596. [Google Scholar] [CrossRef]
  103. Schwarz, V.; Andosch, A.; Geretschläger, A.; Affenzeller, M.; Lütz-Meindl, U. Carbon starvation induces lipid degradation via autophagy in the model alga Micrasterias. J. Plant Physiol. 2017, 208, 115–127. [Google Scholar] [CrossRef] [PubMed]
  104. Kunz, H.H.; Scharnewski, M.; Feussner, K.; Feussner, I.; Flugge, U.I.; Fulda, M.; Gierth, M. The ABC transporter PXA1 and peroxisomal β-oxidation are vital for metabolism in mature leaves of Arabidopsis during extended darkness. Plant Cell 2009, 21, 2733–2749. [Google Scholar] [CrossRef] [PubMed] [Green Version]
  105. Koch, E.; Slusarenko, A. Arabidopsis is susceptible to infection by a downy mildew fungus. Plant Cell 1990, 2, 437–445. [Google Scholar] [PubMed] [Green Version]
  106. Martin, M. Cutadapt removes adapter sequences from high-throughput sequencing reads. EMBnet.journal 2011, 17, 10–12. [Google Scholar] [CrossRef]
  107. Kopylova, E.; Noé, L.; Touzet, H. SortMeRNA: Fast and accurate filtering of ribosomal RNAs in metatranscriptomic data. Bioinformatics 2012, 28, 3211–3217. [Google Scholar] [CrossRef] [PubMed]
  108. Bray, N.L.; Pimentel, H.; Melsted, P.; Pachter, L. Near-optimal probabilistic RNA-seq quantification. Nat. Biotechnol. 2016, 34, 525–527. [Google Scholar] [CrossRef]
  109. Cheng, C.-Y.; Krishnakumar, V.; Chan, A.P.; Thibaud-Nissen, F.; Schobel, S.; Town, C.D. Araport11: A complete reannotation of the Arabidopsis thaliana reference genome. Plant J. 2017, 89, 789–804. [Google Scholar] [CrossRef] [Green Version]
  110. Robinson, M.D.; Oshlack, A. A scaling normalization method for differential expression analysis of RNA-seq data. Genome Biol. 2010, 11, R25. [Google Scholar] [CrossRef] [Green Version]
  111. Kolde, R. Pheatmap: Pretty Heatmaps, R package Version 1.0.8; 2015. Available online: https://cran.r-project.org/web/packages/pheatmap/index.html (accessed on 5 January 2020).
  112. Young, M.D.; Wakefield, M.J.; Smyth, G.K.; Oshlack, A. Gene ontology analysis for RNA-seq: Accounting for selection bias. Genome Biol. 2010, 11, R14. [Google Scholar] [CrossRef] [Green Version]
  113. Yu, G.; Wang, L.-G.; Han, Y.; He, Q.-Y. clusterProfiler: An R Package for comparing biological themes among gene clusters. OMICS J. Integr. Biol. 2012, 16, 284–287. [Google Scholar] [CrossRef]
  114. Wickham, H. Ggplot2: Elegant Graphics for Data Analysis, 2nd ed.; Springer International Publishing: New York, NY, USA, 2016. [Google Scholar]
  115. Lisec, J.; Schauer, N.; Kopka, J.; Willmitzer, L.; Fernie, A.R. Gas chromatography mass spectrometry-based metabolite profiling in plants. Nat. Protoc. 2006, 1, 387–396. [Google Scholar] [CrossRef] [PubMed]
  116. Luedemann, A.; von Malotky, L.; Erban, A.; Kopka, J. TagFinder: Preprocessing software for the fingerprinting and the profiling of gas chromatography-mass spectrometry based metabolome analyses. Methods Mol. Biol. 2012, 860, 255–286. [Google Scholar]
  117. Kopka, J.; Schauer, N.; Krueger, S.; Birkemeyer, C.; Usadel, B.; Bergmüller, E.; Dörmann, P.; Weckwerth, W.; Gibon, Y.; Stitt, M.; et al. [email protected]: The Golm Metabolome Database. Bioinformatics 2005, 21, 1635–1638. [Google Scholar] [CrossRef] [PubMed] [Green Version]
  118. Fernie, A.R.; Aharoni, A.; Willmitzer, L.; Stitt, M.; Tohge, T.; Kopka, J.; Carroll, A.J.; Saito, K.; Fraser, P.D.; DeLuca, V. Recommendations for reporting metabolite data. Plant Cell 2011, 23, 2477–2482. [Google Scholar] [CrossRef] [PubMed] [Green Version]
  119. Giavalisco, P.; Li, Y.; Matthes, A.; Eckhardt, A.; Hubberten, H.-M.; Hesse, H.; Segu, S.; Hummel, J.; Köhl, K.; Willmitzer, L. Elemental formula annotation of polar and lipophilic metabolites using 13C, 15N and 34S isotope labelling, in combination with high-resolution mass spectrometry. Plant J. 2011, 68, 364–376. [Google Scholar] [CrossRef] [PubMed]
  120. Caldana, C.; Li, Y.; Leisse, A.; Zhang, Y.; Bartholomaeus, L.; Fernie, A.R.; Willmitzer, L.; Giavalisco, P. Systemic analysis of inducible target of rapamycin mutants reveal a general metabolic switch controlling growth in Arabidopsis thaliana. Plant J. 2013, 73, 897–909. [Google Scholar] [CrossRef] [PubMed]
  121. Smyth, G.K. Limma: Linear models for microarray data. In Bioinformatics and Computational Biology Solutions Using R and Bioconductor; Springer: New York, NY, USA, 2005; pp. 397–420. [Google Scholar]
  122. Stacklies, W.; Redestig, H.; Scholz, M.; Walther, D.; Selbig, J. PcaMethods—A bioconductor package providing PCA methods for incomplete data. Bioinformatics 2007, 23, 1164–1167. [Google Scholar] [CrossRef]
Figure 1. Arabidopsis tolerates oxidative stress upon SuperFifty (SF) priming. (A) Rosette phenotype of four-week-old plants pretreated and treated, respectively, with H2O and H2O (unprimed and unstressed), H2O and PQ (paraquat; oxidatively stressed), SF and H2O (SF-primed, but unstressed), and SF and PQ (SF-primed and oxidatively stressed); for details, see Materials and Methods. (B) Trypan blue stained leaves of the plants from panel (A). Blue-stained regions (arrows) of leaves in the top-right panel show dead cells after PQ (15 µM) treatment; such cell death areas are not visible in leaves primed with SF and then treated with PQ (bottom right panel). Leaves are representative examples from 30 plants in each condition. Scale bar is 10 mm and 5 mm in panels (A) and (B), respectively. (C) Cell death quantified by measuring electrolyte leakage from leaves. Conductivity was determined 48 h after incubation of two leaves from individual rosettes in 25 mL deionized water for 12 h. Mean values are averages of three independent experiments with each point on the graph representing individual experimental replicates. In each experiment, ten rosettes were analyzed per treatment. Mean values were compared between groups by applying one-way ANOVA followed by Tukey’s multiple comparisons test. An absence of letter sharing among the treatment groups denotes a statistically significant difference among those groups (p < 0.0001). Error bars denote standard deviation (SD). Full data are given in Supplementary Materials Data S1.
Ijms 21 00474 g001
Figure 2. Comparison of the top five enriched GO categories from all pairwise combinations. The top five (most significant) enriched biological process GO terms from all pairwise combinations are illustrated as a bubble plot. The size and color of the circle denotes the number of differentially expressed genes and FDR (false discovery rate) adjusted p-value, respectively. Unprimed and unstressed (H2O + H2O), PQ-stressed (H2O + PQ), SF-primed but unstressed (SF + H2O), and SF-primed and stressed (SF + PQ).
Ijms 21 00474 g002
Figure 3. Comparison of the top five enriched KEGG (Kyoto Encyclopedia of Genes and Genomes) pathways. The top five (i.e., most significant, enriched) KEGG pathways from all pairwise combinations are illustrated as a bubble plot. The size and color of the circle denotes the number of differentially expressed genes and FDR adjusted p-value, respectively. Unprimed and unstressed (H2O + H2O), PQ-stressed (H2O + PQ), SF-primed but unstressed (SF + H2O), and SF-primed and stressed (SF + PQ).
Ijms 21 00474 g003
Figure 4. Transcriptional regulation upon PQ stress in SF-primed and unprimed Arabidopsis plants. Heatmap of all differentially expressed genes. Color scale represents the mean centered log2 normalized TMM values (Trimmed Mean of M values) averaged across three biological replicates. Full data are given in Supplementary Materials Data S1 and S2.
Ijms 21 00474 g004
Figure 5. Primary metabolite changes induced by oxidative stress. Changes in primary metabolite abundances of Arabidopsis leaves upon foliar spray with PQ and/or SF measured by GC-MS. Blue and red depict a decrease and increase, respectively (log2 fold change), compared to the control (unprimed and unstressed, i.e., H2O + H2O). The data are averages of seven biological replicates. Samples: PQ-stressed (H2O+PQ), SF-primed, but unstressed (SF + H2O), and SF-primed and stressed (SF + PQ). Statistically significant differences to control are highlighted by asterisks (Student’s t-test, * p-value < 0.05). Full data are given in Supplementary Materials Data S5.
Ijms 21 00474 g005
Figure 6. Primary metabolism pathways affected by oxidative stress in SF-primed and -unprimed plants. Changes in primary metabolite abundances in Arabidopsis leaves upon foliar spray with PQ and/or SF measured by GC-MS. Blue and red depict decreases and increases, respectively (log2 fold change), compared to the control (unprimed and unstressed, i.e., H2O + H2O). The data are averages of seven biological replicates. Samples: PQ-stressed (H2O+PQ), SF-primed, but unstressed (SF + H2O), and SF-primed and stressed (SF + PQ). Statistically significant differences compared to the control are highlighted by asterisks (at the significance level of 0.05, FDR corrected). Full data are given in Supplementary Materials Data S5.
Ijms 21 00474 g006
Figure 7. Lipid changes induced by oxidative stress. Changes in the abundances of lipids in Arabidopsis leaves after foliar spray with PQ and/or SF. Blue and red depict decreases and increases, respectively, compared to the control (unprimed and unstressed, i.e., H2O + H2O). Data are given in log2 fold change; only lipids significantly different from control samples are shown (highlighted by an asterisk). The data are averages of seven biological replicates. Samples: PQ-stressed (H2O + PQ), SF-primed but unstressed (SF + H2O), and SF-primed and stressed (SF + PQ). Statistically significant differences to control are highlighted by asterisks (at the significance level of 0.05, FDR corrected). Full data are given in Supplementary Materials Data S6. DAG: diacylglycerol; TAG: triacylglycerol; MGDG: monogalactosyldiacylglycerol; DGDG: digalactosyldiacylglycerol; PC: phosphatidylcholine; PE: phosphatidylethanolamine; PG: phosphatidylglycerol; PI: phosphoinositol; PS: phosphoserine; and SQDG: sulfoquinovosyldiacylglycerol.
Ijms 21 00474 g007
Figure 8. Principle component analysis (PCA) of omics data. (A) PCA of RNA-seq, metabolome, and lipidome data. Plotted are three biological replicates per condition for RNA-seq, five to six biological replicates per condition for metabolome, and seven biological replicates per condition for lipidome. Samples: unprimed and unstressed (H2O + H2O), PQ-stressed (H2O + PQ), SF-primed but unstressed (SF + H2O), and SF-primed and stressed (SF + PQ). (B) Scatter plot of PC1 values versus mean electrolyte leakage (%). Mean PC1 values were compared among groups using one-way ANOVA followed by Tukey’s multiple comparisons test to correct for multiple testing. For both, PC1 and electrolyte leakage, a significant difference was observed between the H2O + PQ group (oxidatively stressed) and each of the three remaining groups. For PC1, the adjusted p-values for all three pairwise comparisons were p ≤0.0004 (***), <0.0001 (****), and <0.0001 (****) for transcriptome, metabolome, and lipidome, respectively (underlined in the graph; see Figure S2 for comparison of PC1 values by one-way ANOVA).). Horizontal error bars denote the standard deviation (SD) of PC1 values. Vertical error bars indicate the SD of electrolyte leakage. Full data are given in Supplementary Materials Data S1 and S7.
Ijms 21 00474 g008
Table 1. SuperFifty and paraquat alter the expression of genes representing fundamental biochemical pathways and physiological processes. Values are TMM (trimmed mean of M-values) values averaged across three biological replicates.
Average TMM ValuesAnnotation
Gene IDH2O + H2OH2O + PQSF + H2OSF + PQGene NameDescription/Function
ROS Inducible/Marker genes
AT2G2164019.6397.2116.9920.09 Marker for oxidative stress response protein
AT2G4351064.24214.7940.0447.11TI1Trypsin inhibitor, ROS marker
AT1G576304.0776.134.364.51 Toll-Interleukin-Resistance (TIR) domain family protein
AT1G1902036.57247.4426.2433.40 CDP-diacylglycerol-glycerol-3-phosphate 3-phosphatidyltransferase, ROS marker
AT1G053408.5583.326.725.41 Cysteine-rich stress protein, ROS marker
ROS-Dependent PCD and Senescence
AT4G251101.756.472.072.99MC2Metacaspase 2
AT1G164200.155.830.370.47MC8Metacaspase 8
AT5G021902.782.357.338.40PSC1Promotion of cell survival 1
AT5G0276011.953.3424.6916.34SSPPSenescence-suppressed protein phosphatase
AT4G2741073.77100.2027.1522.12RD26NAC (No Apical Meristem) domain transcriptional regulator superfamily protein
AT2G2935031.09395.8919.2716.05SAG13Senescence-associated gene 13
ROS Detoxification
AT4G25100459.32277.99664.81715.19FSD1Fe superoxide dismutase 1
AT4G09010378.15197.56405.53403.35APX4Ascorbate peroxidase 4
AT5G57345207.99168.40323.34337.82OXRTransmembrane OXR protein
AT4G3980090.7759.99143.09125.49MIPS1Myo-inositol-1-phosphate synthase 1
AT5G2110023.7413.6930.6524.71AOPlant L-ascorbate oxidase
AT5G5172090.3874.87122.85149.99NEET2 iron, 2 sulfur cluster binding protein
AT2G4556043.6726.9167.2367.88CYP76C1Cytochrome P450 family 76C, polypeptide 1
AT2G466601.071.122.122.39CYP78A6Cytochrome P450, family 78A, polypeptide 6
AT3G263107.034.6211.019.27CYP71B35Cytochrome P450, family 71B, polypeptide35
AT4G1232032.6228.6866.0674.88CYP706A6Cytochrome P450, family 706A, polypeptide6
Photosynthesis
AT5G384201223.01567.261376.751518.00RBCS2BRuBisCO small chain
AT3G27690799.90303.311142.161032.88LHCB2.3Photosystem II LHC protein 2.3
AT1G514001851.61886.742086.642069.37 Photosystem II 5 kD protein
AT3G089403027.191449.153533.293026.97LHCB4.2Light harvesting complex photosystem II
AT3G631602922.201632.493304.183817.24OEP6Outer envelope membrane protein
AT3G27690799.9303.311142.161032.88LHCB2.4Chlorophyll a-b binding protein 2.4
AT2G344303293.321182.93677.362958.81LHB1B1Light harvesting chlorophyll protein complex II subunit B1
AT3G089403027.191449.153533.293026.97LHCB4.2Chlorophyll a-b binding protein CP29.2
AT1G514001851.61886.742086.642069.37 Photosystem II 5kD protein
AT2G34430187.98155.10290.55340.92LHB1B1LHC II subunit B1
AT2G23670187.98155.10290.55340.92 YCF37
AT1G03630183.0899.92212.62230.60PORCProtochlorophyllide oxidoreductase C
Carbohydrate Metabolism and Cellulose Synthesis
AT1G6439059.5035.0296.3599.01 Glycosyl hydrolase 9C2
AT2G0129013.3918.8028.1533.23 Ribose-5-phosphate isomerase 2
AT1G702308.119.7316.5315.36 Trichome Birefringence-Like 27
AT1G0935024.018.3645.3536.17 Galactinol synthase 3
Growth and Hormone Signaling
AT1G2131032.88197.7933.8731.90EXT3Extensin 3
AT1G7693073.22149.2153.6860.34EXT4Extensin 4
AT1G2019059.5126.1593.8583.53EXPA11Expansin 11
AT2G207507.223.0314.9715.91EXPB1Expansin B1
AT2G4061050.5418.7899.0779.61EXPA8Expansin A8
AT5G5756077.60111.4028.6821.14TCH4Xyloglucan endotransglucosylase/hydrolase
AT2G146201.109.390.720.99XTH10Xyloglucan endotransglucosylase/hydrolase 10
AT3G4499029.1526.5873.9299.89XTH31Xyloglucan endo-transglycosylase-related 8
AT2G2121025.5515.9953.7465.71SAUR6SAUR-like auxin-responsive protein family
AT4G3886027.8411.7456.7252.80SAUR16SAUR-like auxin-responsive protein family
AT1G755804.294.938.1310.95SAUR51SAUR-like auxin-responsive protein family
AT4G3884097.4343.53134.62150.76SAUR14SAUR-like auxin-responsive protein family
AT4G388509.363.9215.9815.53SAUR15SAUR-like auxin-responsive protein family
AT3G532501.950.684.903.47SAUR57SAUR-like auxin-responsive protein family
AT1G23080 65.8632.2094.8382.05PIN7Auxin efflux carrier family protein
AT2G468704.703.639.388.47 AP2/B3-like TF, auxin response.
AT5G133203.7116.082.973.60PBS3Auxin-responsive GH3 family protein
AT4G125504.011.695.666.45AIR1Auxin-Induced in Root cultures 1
AT1G528304.591.536.794.16IAA6Indole-3-acetic acid 6
AT1G74670150.4533.60188.25141.53GASA6Gibberellin-regulated family protein
AT1G024007.1818.485.675.18GA2OX6Gibberellin 2-oxidase 6 (inactivates gibberellin)
AT1G155508.092.495.966.32GA3OX1Gibberellin 3-oxidase 1
Autophagy
AT2G3847048.75142.4026.8436.51WRKY33WRKY DNA-binding protein 33
AT2G4517082.6298.9438.5832.66ATG8EAUTOPHAGY 8E
AT3G0642018.6835.5414.2814.12ATG8HAUTOPHAGY 8H
Lipid Metabolism
AT1G1902036.57247.4426.2433.40 CDP-diacylglycerol-glycerol-3-phosphate 3-phosphatidyltransferase
AT4G3420075.62216.8776.1474.59EDA9D-3-phosphoglycerate dehydrogenase
AT4G396703.4350.872.082.82 Glycolipid transfer protein (GLTP) family protein
AT1G6780010.0523.9110.7712.32 Copine (Calcium-dependent phospholipid-binding protein) family
AT3G5547018.3357.9120.0421.00 Ca-dependent lipid-binding (CaLB domain)
AT5G141801.775.230.840.62MPL1Myzus persicae-induced lipase 1
AT2G2656045.59364.6238.4842.54PLA2APhospholipase A 2A
AT1G139302740.501898.624318.33952.83 Oleosin-B3 like protein
AT1G5108018.6711.2625.1027.68 Golgin family A proteins
AT1G250540.610.576.083.07LPXC3, LPXC4UDP-3-O-acyl N-acetylglycosamine deacetylase
Transcription Factors and Stress-Related Genes
AT1G599304.72.68.9410.58 MADS-box transcription factor
AT1G70890136.7685.38171.01170.27MLP43MLP-like protein 43
AT1G75690184.1798.65215.40223.10 DnaJ/Hsp40
AT1G7807043.0433.1377.1673.50 Transducin/WD40
AT2G2872095.9874.93131.89151.73HTB3Histone super family protein
AT2G41090300.65461.43464.31652.82CML10Calcium-binding EF-hand family protein
AT2G449407.886.3220.1728.83 Integrase-type DNA-binding

