Article

Visceral Adipose Tissue Inflammatory Factors (TNF-Alpha, SOCS3) in Gestational Diabetes (GDM): Epigenetics as a Clue in GDM Pathophysiology

1
Division of ‘Experimental Obstetrics’, Clinic of Obstetrics, Charité—Universitätsmedizin Berlin, Corporate Member of Freie Universität Berlin, Humboldt-Universität zu Berlin, and Berlin Institute of Health, Campus Virchow-Klinikum, 13353 Berlin, Germany
2
Clinic of Obstetrics, Charité—Universitätsmedizin Berlin, Corporate Member of Freie Universität Berlin, Humboldt-Universität zu Berlin, and Berlin Institute of Health, Campus Virchow-Klinikum, 13353 Berlin, Germany
*
Author to whom correspondence should be addressed.
Int. J. Mol. Sci. 2020, 21(2), 479; https://0-doi-org.brum.beds.ac.uk/10.3390/ijms21020479
Submission received: 15 December 2019 / Revised: 7 January 2020 / Accepted: 9 January 2020 / Published: 12 January 2020
(This article belongs to the Special Issue Epigenetics of Diabetes and Related Complications)

Abstract

:
Gestational diabetes (GDM) is among the most challenging diseases in westernized countries, affecting mother and child, immediately and in later life. Obesity is a major risk factor for GDM. However, the impact visceral obesity and related epigenetics play for GDM etiopathogenesis have hardly been considered so far. Our recent findings within the prospective ‘EaCH’ cohort study of women with GDM or normal glucose tolerance (NGT), showed the role, critical factors of insulin resistance (i.e., adiponectin, insulin receptor) may have for GDM pathophysiology with epigenetically modified expression in subcutaneous (SAT) and visceral (VAT) adipose tissues. Here we investigated the expression and promoter methylation of key inflammatory candidates, tumor necrosis factor-alpha (TNF-α) and suppressor of cytokine signaling 3 (SOCS3) in maternal adipose tissues collected during caesarian section (GDM, n = 19; NGT, n = 22). The mRNA expression of TNF-α and SOCS3 was significantly increased in VAT, but not in SAT, of GDM patients vs. NGT, accompanied by specific alterations of respective promoter methylation patterns. In conclusion, we propose a critical role of VAT and visceral obesity for the pathogenesis of GDM, with epigenetic alterations of the expression of inflammatory factors as a potential factor.

1. Introduction

The growing public health problem stemming from the numerous downstream harmful health conditions link to and brought about by overweight and obesity is an important issue in maternal health. The rising prevalence of gestational diabetes mellitus (GDM) is high (>10%) as is overweight and obesity in pregnancy both of which ultimately lead to increased risk for future health complications for mother and child [1,2,3,4,5,6,7,8,9]. The culmination of affluent eating patterns, increased body-mass-index (BMI), and weight gain are key risk factors of developing GDM, which is critically characterized by insulin resistance.
Visceral obesity, on the other hand, is a key risk factor for overall insulin resistance, e.g., regarding the metabolic syndrome [10,11,12]. Various studies have described a direct relationship between visceral adipose tissue (VAT) and the development of the pre-diabetic condition and diabetes. Mechanistically, this has been critically related to the inflammatory processes within adipose tissue, especially in visceral [13,14]. The particular pathophysiological role and precise mechanisms/factors within VAT for GDM are increasingly of interest.
As obesity is associated with inflammatory changes [15], we wanted to build on our previous investigations/findings on the ‘EaCH’ cohort [16,17,18] and now focused on the inflammatory markers, tumor necrosis factor-alpha (TNF-α) and suppressor of cytokine signaling 3 (SOCS3) which have been identified as key candidates of obesity-related insulin resistance [19,20,21]. Through intensified inflammation comes the promotion of cell death/apoptosis critical in restoring tissue homeostasis. Both TNF-α and SOCS3 are important components in the inflammation and apoptosis processes in the cellular composition of adipose tissue (e.g., adipocytes) [20,21,22,23] and their regulatory mechanism have been previously connected showing TNF-α regulating SOCS3 expression [24]. All of which made investigating these two targets/regulators jointly in maternal adipose tissue of high interest more specifically in GDM, as TNF-α has even been suggested as a potential early risk marker and screening parameter [15,25,26,27].
Epigenetic alterations, especially of promoter methylation patterns, have been proposed as potential causes of insulin resistance, GDM, and obesity in a variety of aspects [2,13,16,17]. Therefore, in order to contribute to a better understanding of GDM pathophysiology, we sought to investigate the potential alterations of both TNF-α and/or SOCS3 mRNA expression and methylation in adipose tissues of women with GDM compared to pregnancies with normal glucose tolerance (NGT). These findings and potential relations were further interrogated with analysis of promoter DNA methylation of both candidates to determine whether this epigenetic modifier influenced/regulated the altered gene expression.

2. Results

2.1. Study Cohort

For both study groups (NGT: n = 22 and GDM: n = 19), maternal and birth characteristics are summarized in Table 1. BMI at both prepregnancy and at the time of delivery as well as maternal age were similar between groups. Both groups were categorized as overweight according to the mean prepregnancy BMI (NGT: 26.8 ± 7.9 kg/m2 and GDM: 28.2 ± 6.7 kg/m2). For the GDM group, maternal metabolic and hormonal state remained altered at the end of pregnancy as compared to controls (e.g., hyperinsulinemia, hyperglycemia). Women with GDM exhibited higher fasting maternal blood C-peptide, insulin, glucose plasma levels and homeostatic model assessment of insulin resistance (HOMA-IR) compared to the NGT group (Table 1). Maternal plasma TNF-α levels were significantly higher according to GDM (GDM: 0.86 ± 0.35 pg/mL vs. NGT: 0.32 ± 0.35 pg/mL, P < 0.0001), this significance continued after adjusting for BMI (Prepregnancy BMI: P = 0.0001, BMI at delivery: P = 0.0001). Direct relationships were observed between maternal blood TNF-α vs. glucose and C-peptide (Table 1).

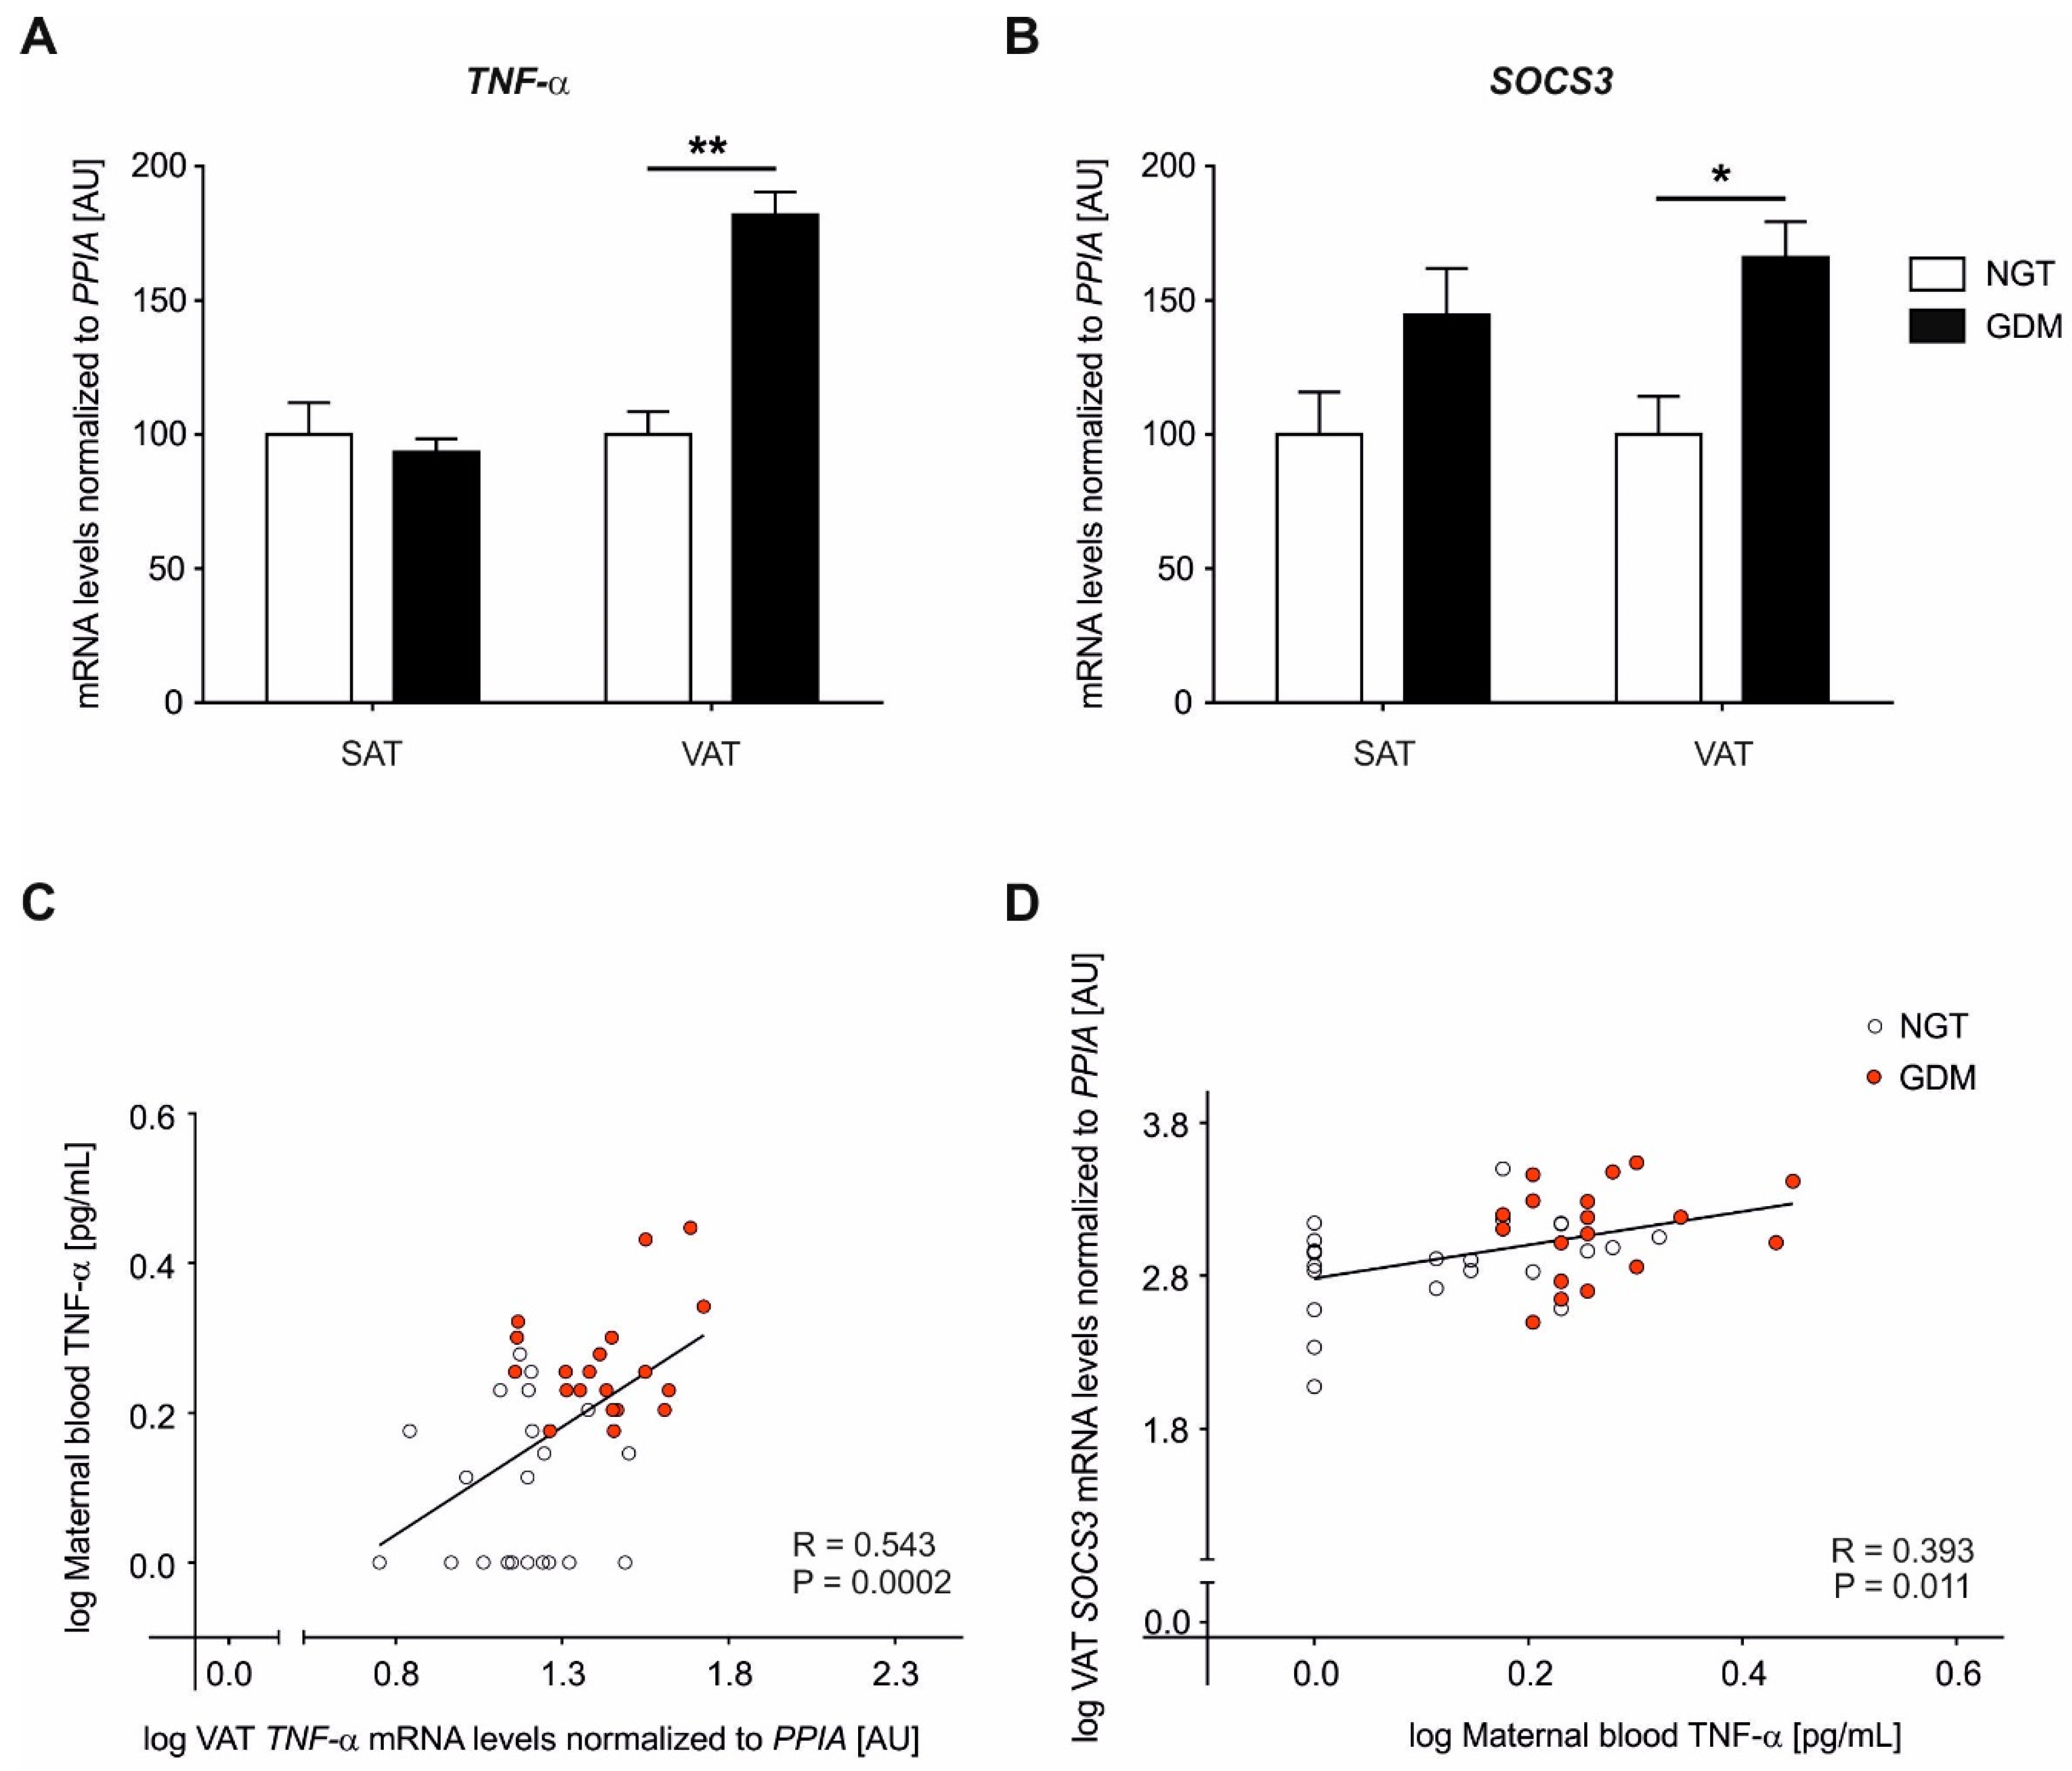
2.2. Adipose Tissue Gene Expression Analyses of TNF-α

Relative mRNA expression analyses were performed in both subcutaneous adipose tissue (SAT) and VAT for TNF-α (Figure 1A). In VAT, mRNA gene expression of TNF-α was significantly increased in women with GDM (GDM: 29.1 ± 2.4 vs. NGT: 15.9 ± 1.3, P < 0.0001) while no differences were observed in SAT (Figure 1A). VAT TNF-α significance according to GDM status remained after adjustment for BMIs and maternal age (age and prepregnancy BMI P = 0.002, B = 0.225, S.E. = 0.073; age and BMI at delivery P = 0.002, B = 0.212, S.E. = 0.068). This resulted in an overexpression of TNF-α mRNA of +82% in VAT of diabetic subjects as compared to controls.

2.3. Adipose Tissue Gene Expression Analyses of SOCS3

SOCS3 mRNA expression analyses were performed in both adipose tissues, SAT group comparisons showed higher levels in GDM although this was not statistically significant (GDM: 394.6 ± 68.6 vs. NGT: 273.0 ± 43.2, P = 0.091) however, a significant increase in the VAT of women with GDM (GDM: 445.1 ± 61.6 vs. NGT: 267.6 ± 38.2, P = 0.016) was detected (Figure 1B). VAT SOCS3 significance according to GDM status remained after adjustment for BMIs and maternal age (age and prepregnancy BMI P = 0.037, B = 0.004, S.E. = 0.002; age and BMI at delivery P = 0.034, B = 0.004, S.E. = 0.002). This overexpression of SOCS3 mRNA in VAT was at +66% for GDM subjects compared to controls.

2.4. Maternal Circulating Plasma TNF-α Levels

Across the whole cohort (n = 41), maternal circulating TNF-α levels in the blood showed strong correlations with VAT TNF-α mRNA expression (Pearson R = 0.543, P = 0.0002, Figure 1C). Additionally, positive associations were observed between maternal blood TNF-α levels and SOCS3 mRNA expression in VAT (Pearson R = 0.393, P = 0.011, Figure 1D)). The significance of correlations above continued after adjustment for prepregnancy BMI and BMI at delivery. For both genes, no significant correlations were found with maternal blood circulating TNF-α levels and the mRNA gene expression in SAT (TNF-α: Pearson R = 0.169, P = 0.300 and SOCS3: R = 0.299, P = 0.060).

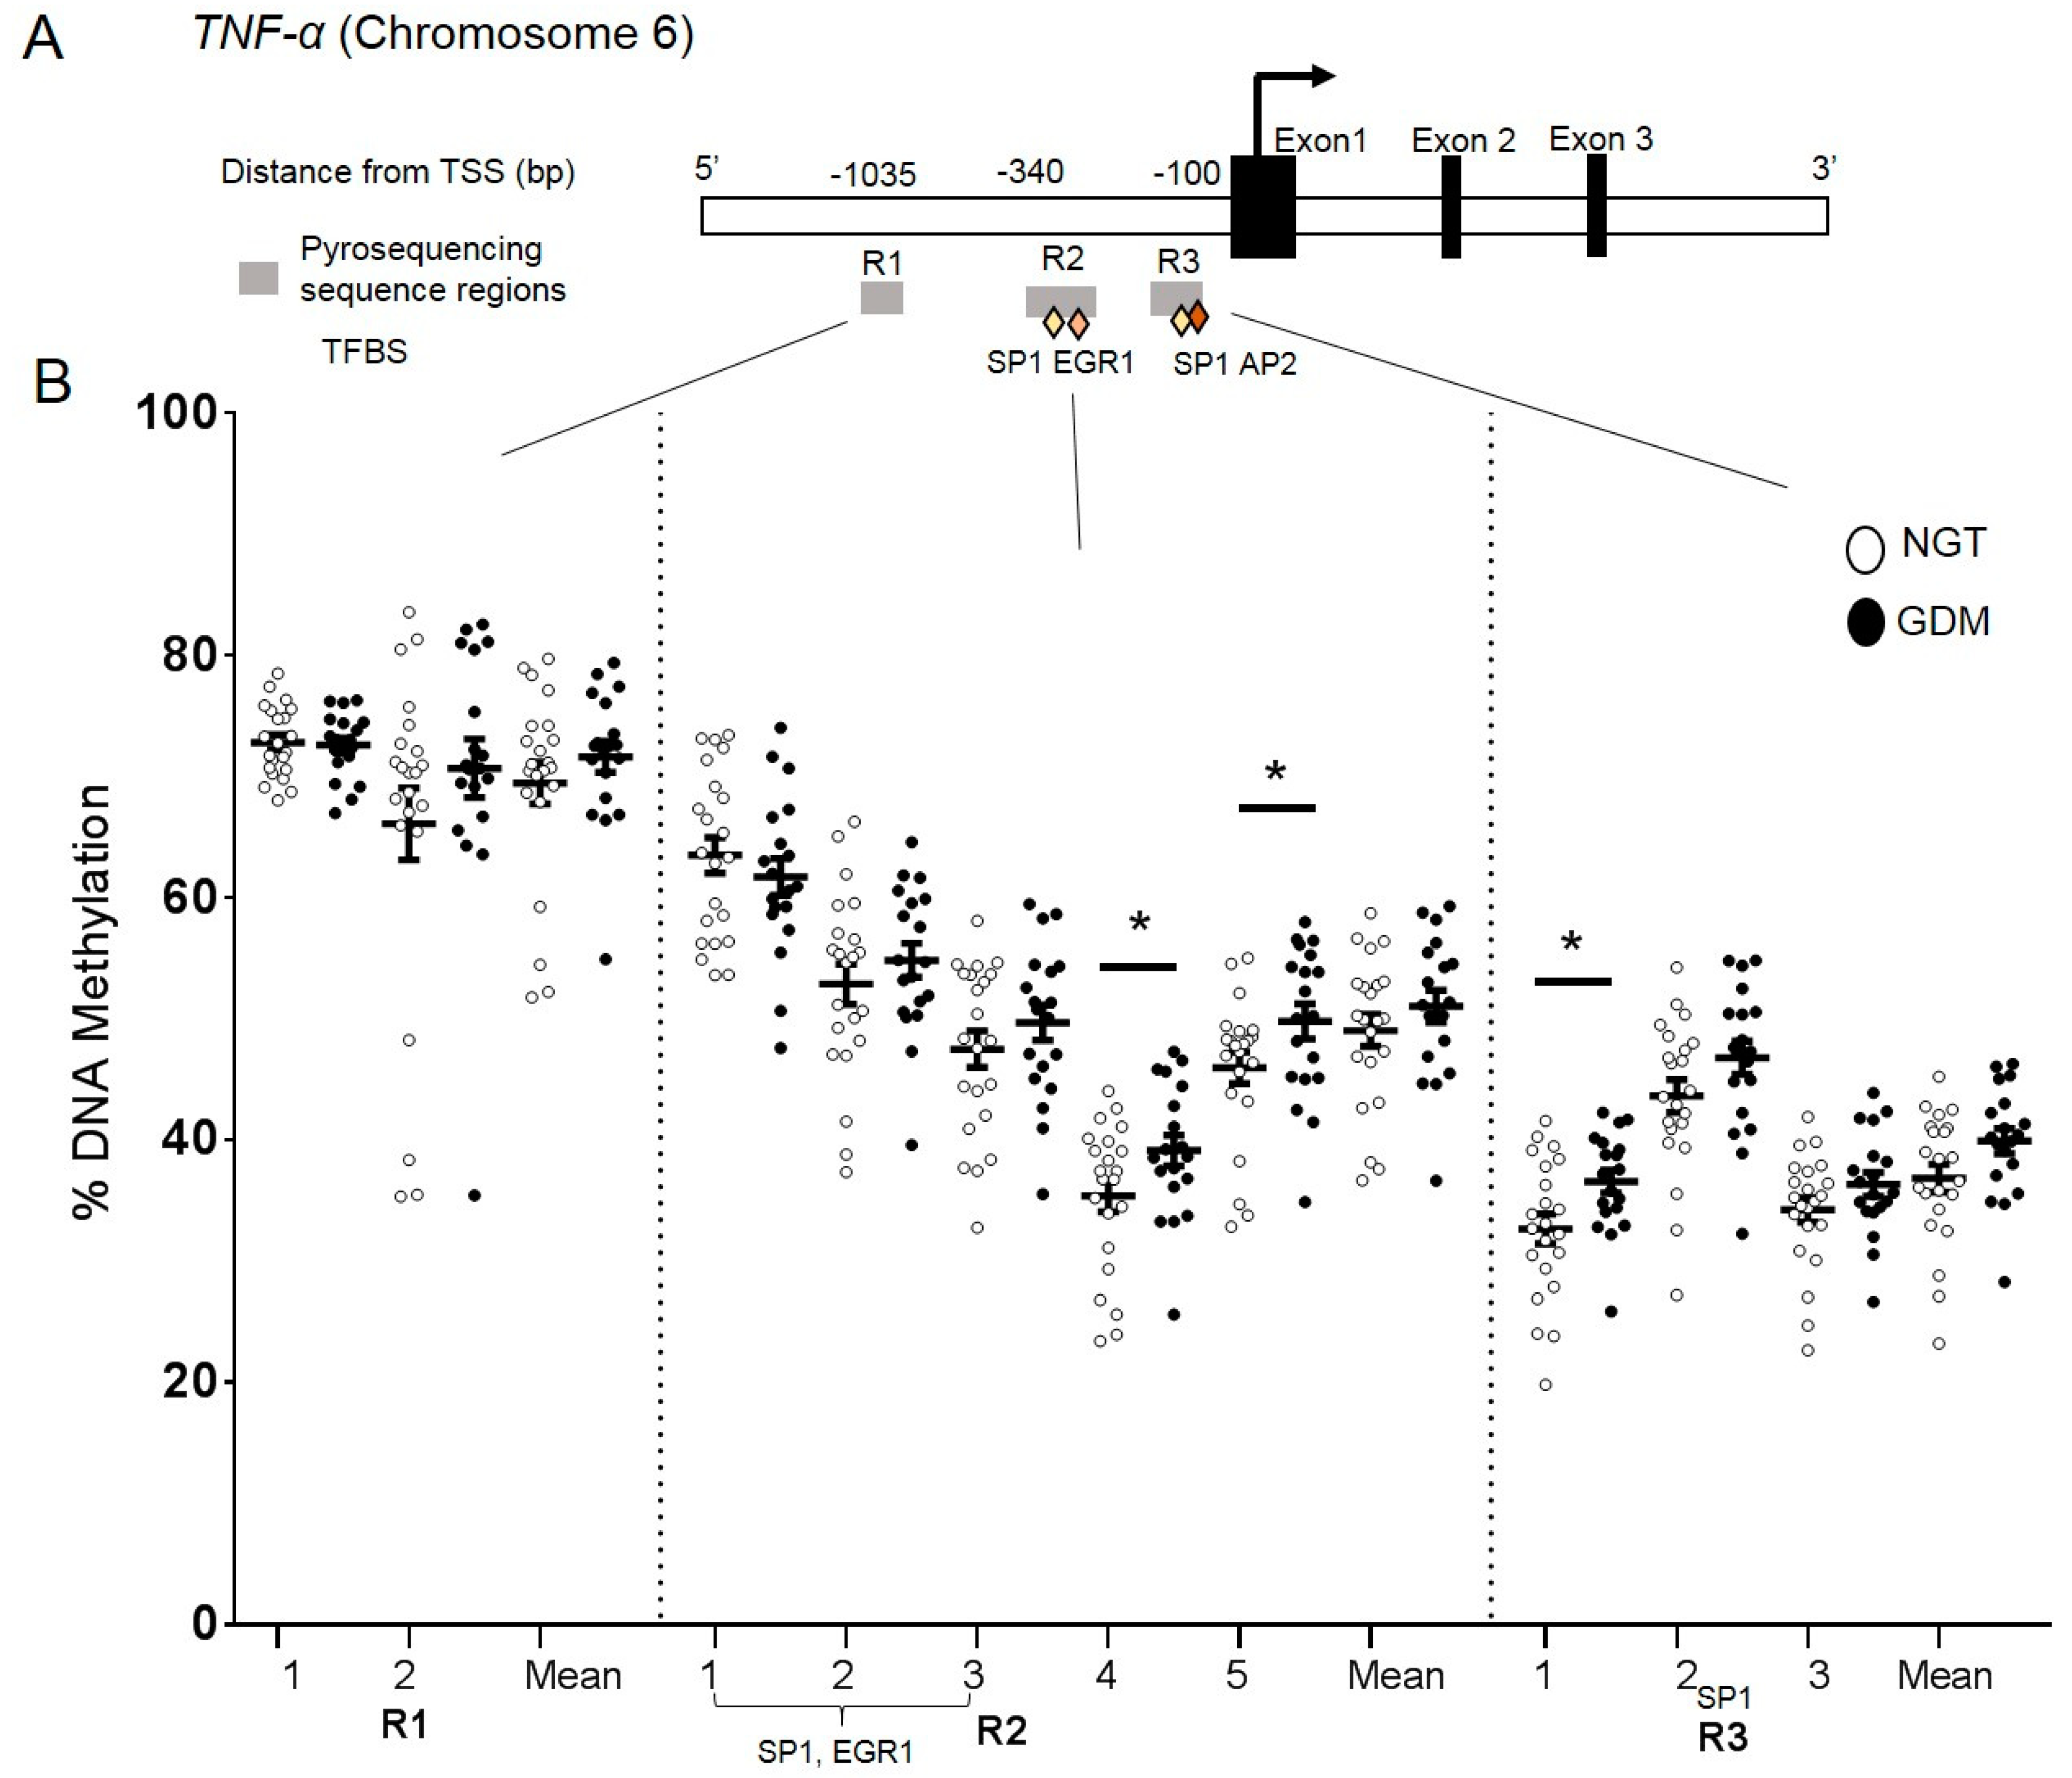
2.5. DNA Methylation at the TNF-α Promoter in Visceral Adipose Tissue

DNA methylation analysis was performed in VAT to investigate a possible epigenetic-mechanistic change (according to groups) in the promoter methylation, which could regulate the alterations in gene expression. Three regions (R1, R2, and R3) encompassing 10 CpG sites were investigated (Figure 2A) and the overall DNA methylation levels across the 10 CpG sites ranged from 30–75% at the TNF-α promoter (Figure 2B). Small yet significant differences were found between groups at two individual CpG sites in R1 sequence (CpG4; GDM: 39% vs. NGT: 35% P = 0.048 and CpG5; GDM: 49% vs. NGT: 47% P = 0.050) (Figure 2B). CpG1 in R2 region also showed small yet statistically significant differences (CpG1; GDM: 36% vs. NGT: 32% P = 0.018) (Figure 2B). TNF-α VAT mRNA expression levels did not significantly correlate with corresponding methylation levels at the individual CpG sites or the overall mean (CpG overall mean: Spearman r = 0.08, P = 0.60). These findings at R1-CpG4, R1-CpG5, and R2-CpG1 were not shown as false positives after correction for false discovery rates (FDR).

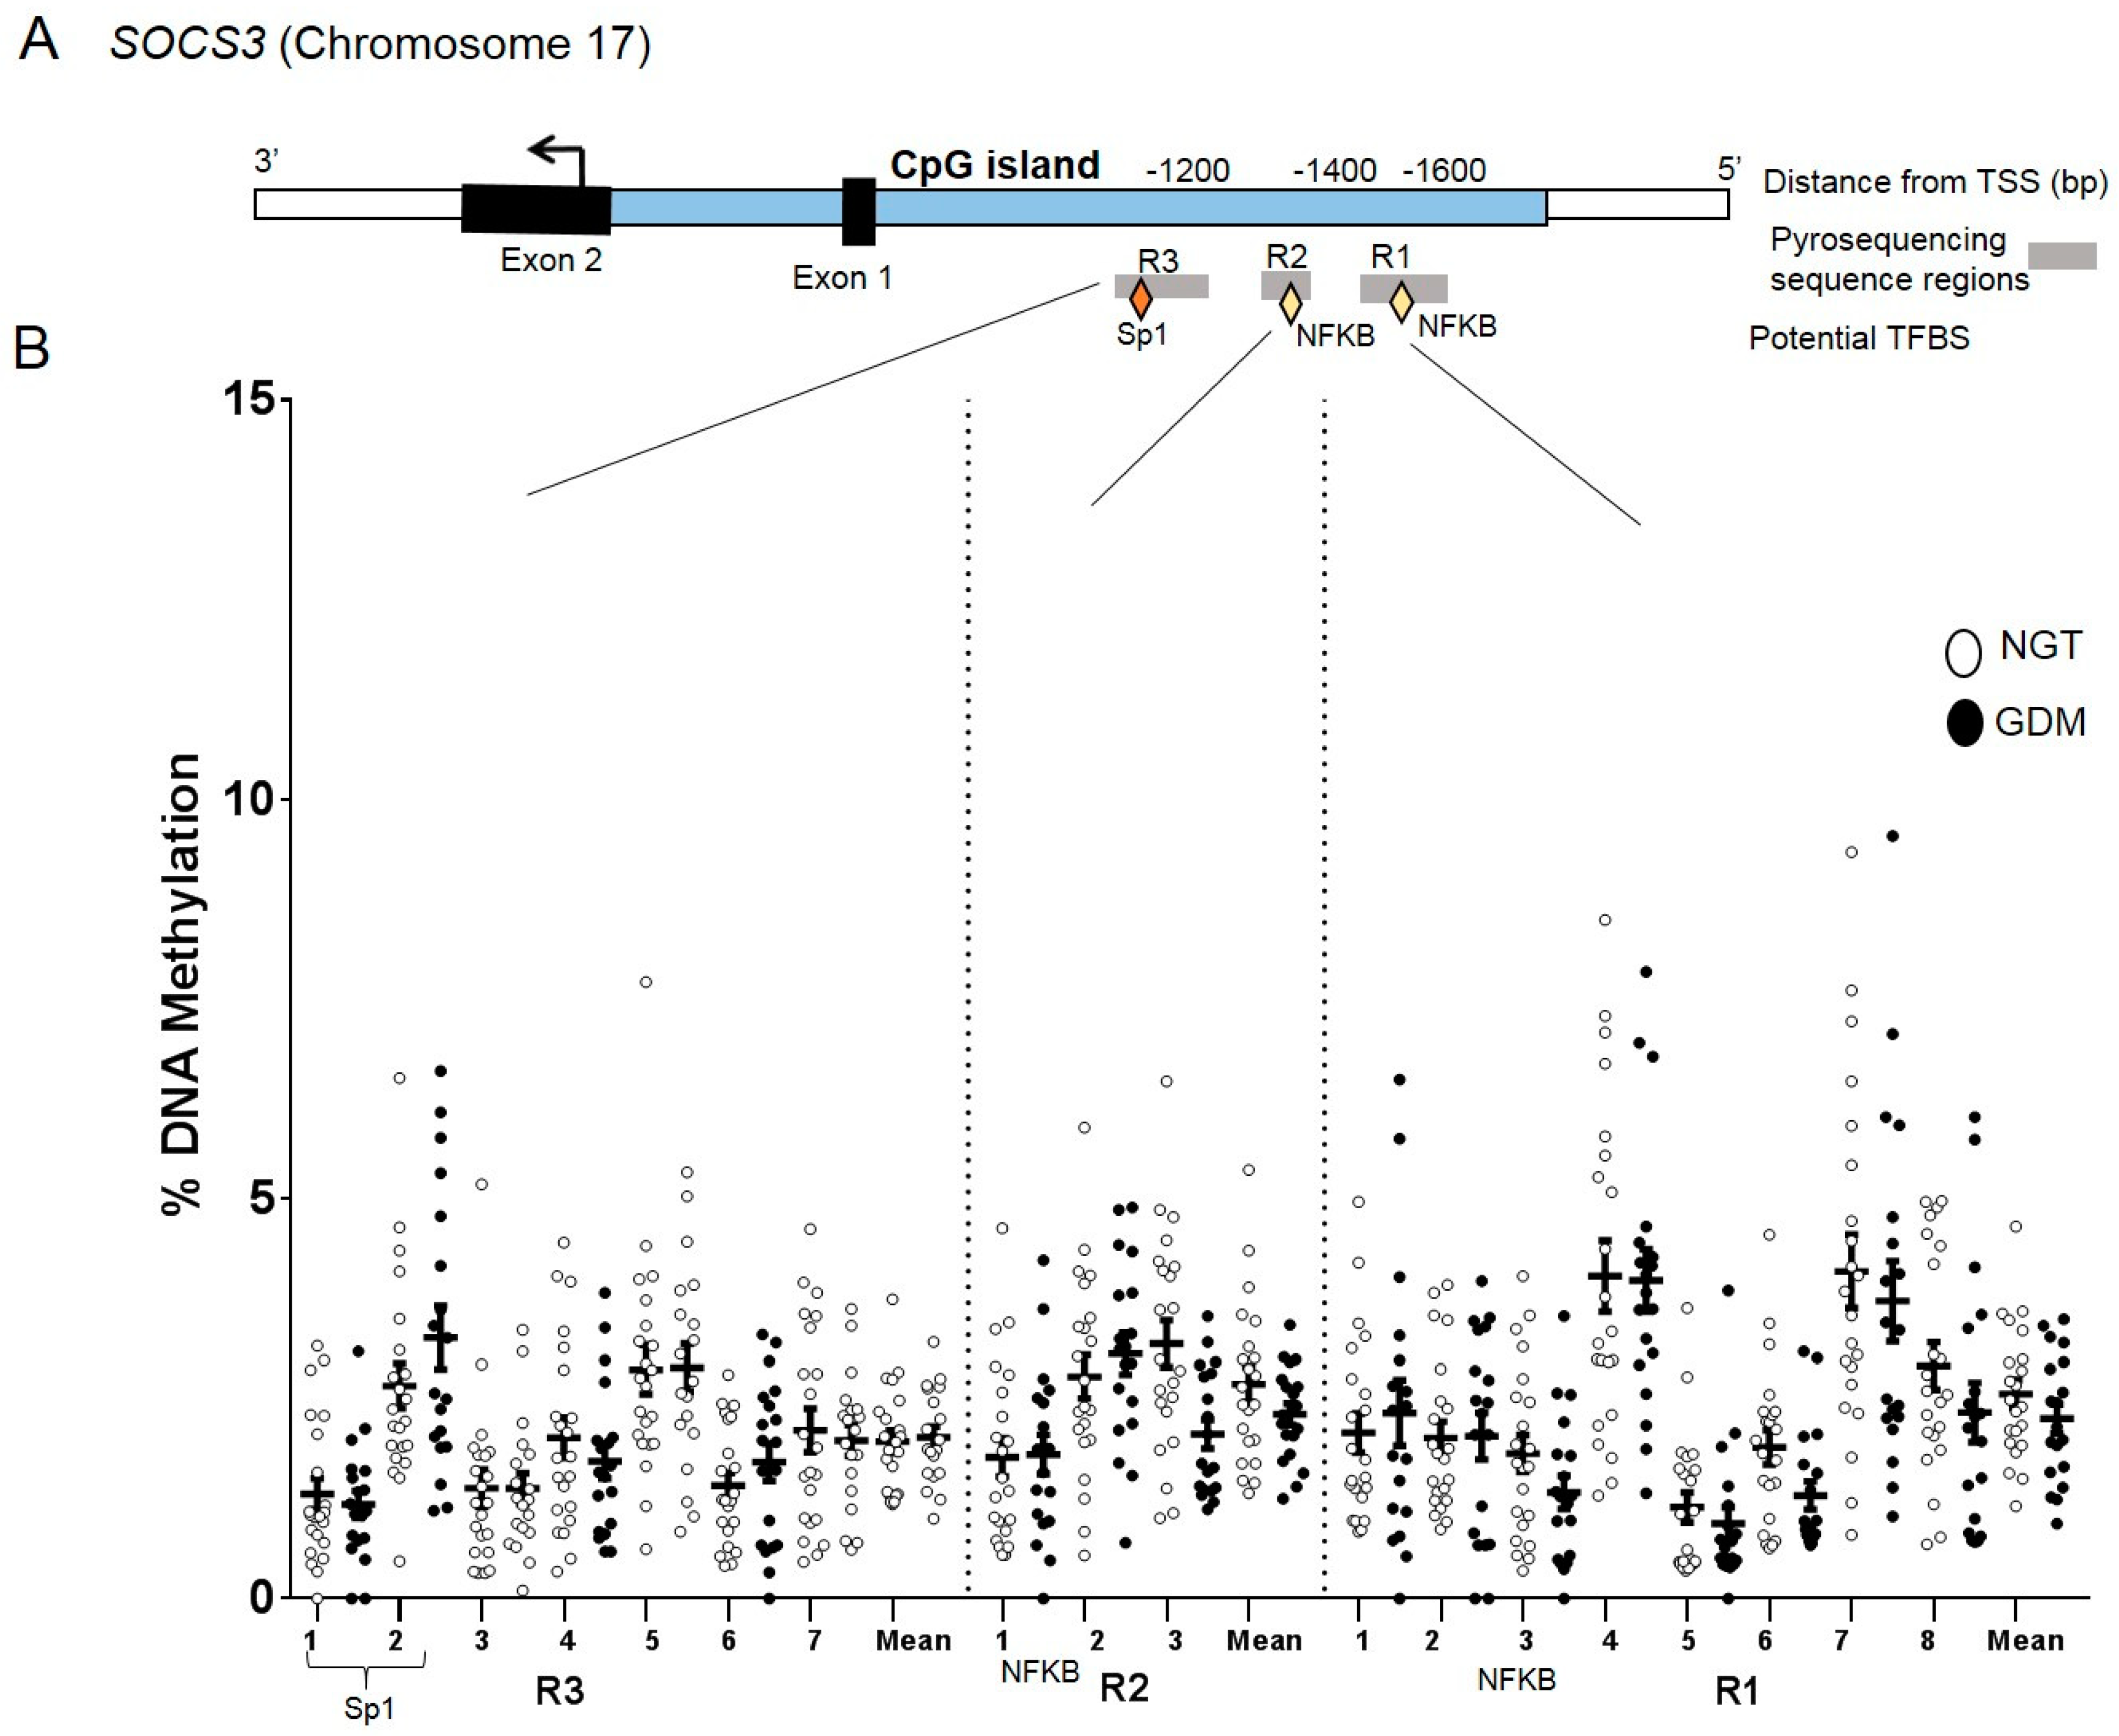
2.6. DNA Methylation at the SOCS3 Promoter in Visceral Adipose Tissue

In the promoter assays for SOCS3, three regions (R1, R2, and R3) covering 18 CpG sites were profiled (Figure 3A). The overall DNA methylation pattern at the SOCS3 promoter was similar across VAT samples with all 18 CpG sites investigated showing low methylation levels (<5%) (Figure 3B). No significant differences were found between groups at individual CpG sites or with the overall mean (GDM: 2.1% vs. NGT: 2.3%). (Figure 3B). mRNA VAT expression levels did not significantly correlate with corresponding methylation levels (CpG overall mean Spearman r = 0.07, P = 0.65).

3. Discussion

We presented the first human study describing both TNF-α and SOCS3 expression in both subcutaneous and visceral adipose tissue in pregnant women affected by overweight and/or GDM, accompanied by promoter methylation analyses of both candidate genes. Both inflammatory factors/markers were found to have increased mRNA expression specifically in VAT, in relation to the GDM phenotype, and independently of the BMI, potentially indicating a specific pathogenic role of VAT-TNF-α and VAT-SOCS3, respectively for GDM pathophysiology.
TNF-α expression is known to be increased in adipose tissue [28,29], especially in VAT. As in previous studies [26,30], we observed elevated circulating maternal (plasma) TNF-α levels in GDM women compared to NGT. Local and/or circulating TNF-α stimulates SOCS3 in adipocytes [21]. Both TNF-α and SOCS3 may increase insulin resistance via differing possible scenarios. One scenario could be a direct interaction of TNF-α affecting the insulin receptor [28,31,32,33]. Another is a more indirect scenario by way of TNF-α via stimulating SOCS3 [19,21,24,34] and in turn SOCS3 through affecting the insulin receptor substrate complex [23,35] leading to the inhibition of the insulin/insulin receptor-mediated pathway, finally resulting in increased adipocyte insulin resistance.
It is worth noting, that both TNF-α, as well as SOCS3, were found to be significantly increased in VAT of the GDM patients, accompanied by distinct methylation alterations of the TNF-α promoter in VAT. However, no significant methylation alterations were observed regarding SOCS3 nor directly at key transcription factor binding sites (e.g., SP1, NFKB) within the target regions analyzed in both genes. Accordingly, increased TNF-α (circulating and/or locally expressed) may regularly activate the SOCS3 expression, e.g., through the unaffected NFKB binding site at the SOCS3 promoter, contributing to an increase of SOCS3 expression. Significant relations (Figure 1D) seem to support this hypothesis. Ultimately, a respective alteration and activated pathway might contribute to adipose tissue insulin resistance and, in turn, overall insulin resistance in GDM.
Further research into alternative/potential regulatory elements within the gene body of TNF-α and regions within the TNF-α domain (e.g., tumor necrosis factor receptor 1) could shed insight into the molecular mechanism at play mediating TNF-α inflammatory effects on adipocyte function [28]. While methylation has been the most well-studied modifier, other mechanisms such as chromatin modifications (e.g., histones), enhancer and/or RNA elements (e.g., non-coding and miRNAs) need to be further studied as the gene expression changes in SOCS3 cannot be directly attributed to methylation at the investigated CpG sites presented here.
The observed alterations specifically in VAT appear to be particularly interesting, in aiming to better understand GDM pathophysiology. The specific, critical role that visceral adipose tissue alterations have in this pathophysiology, have hardly been addressed or not considered in great depth, thus far. However, recent data support the suggestion of an explicit part of VAT and visceral adiposity in GDM [18,36,37,38,39]. Particularly, the expression of insulin receptor and adiponectin were found to be altered in GDM patients, accompanied by altered promoter methylation [16,17]. Importantly, this has been shown to occur even independent of the BMI, which is so far the only adipogenic indicator/marker clinically considered in GDM screening/treatment but, on the other hand, hardly serves as a marker for visceral type of obesity. Reports have purposed that ultrasound could be a potential way of estimating the VAT and SAT risk factors in pregnancy [40,41,42]. In confirmation of the aforementioned observations, our data may point to a particular role visceral obesity might play in the etiopathogenesis of GDM, through altered/increased expression of inflammatory factors and/or further factors increasing insulin resistance through altered action in VAT.
Finally, limitations and critical aspects of the interpretation should be discussed one of which is that the analyses were on whole tissue samples instead of isolated adipocytes, as in other comparable studies [13,19,36,43] and due to the initially limited sample material available, protein expression analysis could not be performed here. It has been reported that in non-obese humans, macrophages can represent 10–25% of the immune cellular population in VAT, while in an obese condition this range is increased to 40–50% [26,30]. TNF-α especially from macrophages, which are enriched in adipose tissue [22,27], might possibly influence the overall expression and protein data of TNF-α. However, clinically and pathophysiologically speaking, it appears rather secondary whether the increased TNF-α results directly from adipocytes itself or considerably from an enrichment of macrophages in (increased) adipose tissue, respectively. Despite this, we remain confident in our findings of the link to GDM considering both study groups are well-matched with BMI and on average are categorized as overweight. Clinically, the question of the cell-specific origin does finally not decisively matter on/affect the critical role of increased TNF-α for visceral adipose tissue insulin resistance, the more so when additionally considering the increased circulating TNF-α plasma levels generally resulting from adiposity, which are, as shown here, particularly linked with increased VAT expression, specifically. However, to even more concretely understand the pathophysiology behind, future studies should aim to better differentiate the cells of origin of increase TNF-α, i.e., by using microdissection of adipose tissues for cell type-specific analyses.
In summary and conclusion, both the increased VAT expression and circulating TNF-α protein, as well as the accompanying increased SOCS3 expression in VAT, appear to be related to GDM, even irrespective of the BMI. Altered promoter methylation in VAT might contribute to TNF-α increase. These findings speak of a specific role visceral adipose tissue and affecting inflammatory processes might play in the pathogenesis of GDM. This should be addressed in more depth in future studies, to improve understanding of and, in turn, screening and treatment of GDM. Understanding how adipose tissue (especially visceral) acts as a diseased organ specifically in the inflammatory pathways should enable more strategic development for prediction, prevention and possible treatment measures, especially concerning GDM.

4. Materials and Methods

4.1. Subject Data

The research presented here is part of the prospective observational ‘Early CHARITÉ (EaCH)’ cohort study [16,17,19,44]. Genes involved in the inflammatory process were further investigated on the cases in which the optimal material and factors (such as transcription, metabolic and hormonal) could be measured in a complete set so as to avoid a missing data bias. Nineteen women with GDM and 22 women with NGT were prospectively recruited prior to their scheduled Cesarean section (CS) of singletons at the Clinic of Obstetrics of the Charité – Universitätsmedizin Berlin, Campus Virchow–Klinikum, Germany. Standardized procedures/methods, recruitment, exclusion criteria, analytical approaches etc. are described elsewhere in detail [44]. The study groups were matched for maternal age, socio-economic status (SES), ethnic origin, parity and specifically, prepregnancy BMI. BMIs were calculated with maternal height and weight prior to conception and the last measured weight within one week before delivery. BMIs were categorized according to the WHO criteria (normal weight: 18.5–24.9 kg/m2, overweight: 25.0–29.9 kg/m2, obese: ≥30.0 kg/m2). GDM screening was performed between gestational weeks 24 to 28 according to the national guidelines at the time of recruitment [45,46]. No oral antidiabetic drugs were administered in the GDM group, eight were treated by diet and eleven were treated with diet and additional insulin therapy to achieve glycemic control. Further clinical parameters such as plasma insulin, C-peptide, glucose and HOMA-IR were determined for these cases as described elsewhere [16,17,44,47]. The research design and methodology were conducted in accordance with the Declaration of Helsinki, revised in 2004, and approved by the local Ethics Committee (Ethikausschuss 2 am Campus Virchow–Klinikum, Charité Universitätsklinikum Berlin, EA2/026/04). Informed written consent was obtained by all participants before inclusion in the study.

4.2. Maternal Blood and Adipose Tissue Sampling

Fasting maternal venous blood was collected prior to the planned Cesarean section (CS). Plasma and blood cell fractions were stored at −80 °C for further analysis. Paired maternal biopsies of visceral adipose tissue (VAT) from the greater omentum and subcutaneous adipose tissue (SAT) from the abdominal anterior wall were obtained during planned CS delivery. Samples were immediately snap-frozen in liquid nitrogen and stored at −80 °C.

4.3. Maternal Blood TNF-α Analysis

Total plasma TNF-α was determined using a specific commercially available Ultrasensitive Human-TNF-alpha-ELISA (Cat# KHC3013, Invitrogen Corporation, Carlsbad, CA, USA). Assays were performed using 100 µL of plasma according to the manufacturer’s protocol. The intra- and inter-assay coefficients of variations were: 3.9–5.2% and 5.9–8.5% respectively in a concentration range of 47.0–459.0 pg/mL.

4.4. Gene Expression Analyses

Total RNA was isolated from adipose tissue (100 mg) using the RNeasy Lipid Tissue Mini Kit (Qiagen, Hilden, Germany) according to the manufacturer’s protocol. Assessment of purity and quantity was measured with both a spectrophotometer (NanoDrop 1000, Thermo Scientific, Wilmington, DE, USA) and with a Bioanalyzer 2100 (Agilent Technologies, Santa Clara, CA, USA). A starting sample of 300 ng of RNA was reverse transcribed for each case with the iScript kit (Bio-Rad, Hercules, CA, USA). Using TaqMan technology (Applied Biosystems, Waltham, MA, USA), quantitative real-time PCR was performed in triplicate on a 7500 instrument (Applied Biosystems) with the respective controls and quality checks included. Pre-designed exon-exon spanning TaqMan primer assays from Applied Biosystems were used (ID: TNF-α: Hs01113624_g1; SOCS3: Hs02330328_s1) and amplified in singleplex with the housekeeping gene peptidylprolyl isomerase A (PPIA: Hs99999904_m1) [48]. Gene expression was normalized using the 2−ΔCt method, including correction for amplification efficiency calculated from the standard curves for each primer set [49,50]. As in previous reports [16,17,18], gene expression of PPIA showed no group differences in both VAT and SAT.

4.5. DNA Methylation Analyses

Genomic DNA was extracted from VAT (30 mg starting material in total), using the Genomic DNA-Tissue kit and the Quick-gDNA Blood kit (Zymo Research, Irvine, CA, USA), according to manufacturer’s protocols. Bisulfite conversions were performed using the EZ DNA Methylation Gold kit (Zymo Research). The target promoter regions were selected according to literature and/or in silico analyses of genomic elements such as CpG islands and transcription factor binding sites within the sequences [34,51,52,53]. The investigated chromosomal locations for the TNF-α promoter region was chr6:31,542,413-31,543,347 and for the SOCS3 promoter region was chr17:76,356,234-76,356,871 according to the UCSC Genome browser on the human February 2009, GRCh37/hg19 assembly. Methylation assays were designed with PyroMark Assay Design Software v. 2.0 (Qiagen). Primer and assay information is available in supplemental Table S1. Pyrosequencing was performed on amplified PCR products using the PyroMark Q24 pyrosequencer (Qiagen). Percent methylation was analyzed across individual measured CpG sites (10 CpG sites, TNF-α; 18 CpG sites, SOCS3). The reproducibility and specificity of the different assays were tested and validated with duplicate samples, various tissue types, and methylation scales (0–100%).

4.6. Statistical Analyses

Data are presented as means ± SD, means ± SEM or number and percentage. Gene expression data are presented as arbitrary units. Group comparisons were analyzed by unpaired t-test or Mann-Whitney-U-test as appropriate. Normal distribution of continuous variables was evaluated by Shapiro-Wilk-tests and skewed data were transformed logarithmically to achieve normal distribution. Spearman’s correlation coefficients (r) were calculated to assess associations between clinical and/or endocrine parameters, gene expression and DNA methylation, respectively. Pearson’s correlations coefficients (R) were used to test the relationship between maternal TNF-α plasma levels and gene expression. Potential confounding effects of maternal BMI (prepregnancy and at delivery) and maternal age were checked using partial Pearson’s correlation. Binary logistic regression analysis was run to evaluate associations between mRNA expression and GDM adjusting for BMIs (prepregnancy and at delivery) and maternal age as covariates. For methylation analyses, CpG sites were additionally run through a two-stage step-up method of Benjamini, Krieger, and Yekutieli to correct for FDR and to ensure that the statistically significant findings were discoveries and not false positives [54]. Statistical analyses were performed with GraphPad Prism 7.00 (GraphPad Software, San Diego, CA, USA) and SPSS 23.0 software (IBM, Munich, Germany). Statistical significance was set at P < 0.05.

Supplementary Materials

Supplementary materials can be found at https://0-www-mdpi-com.brum.beds.ac.uk/1422-0067/21/2/479/s1. Supplementary Table S1: Primer information for DNA methylation assays: TNF-α and SOCS3.

Author Contributions

Conceptualization, R.C.R., R.O. and A.P.; methodology, R.C.R., R.O., T.Z., K.M. and A.P.; validation, R.C.R., R.O. and A.P.; formal analysis, R.C.R., R.O., K.S. and A.P.; investigation, R.C.R., R.O. and A.P.; resources, W.H. and A.P.; writing—original draft preparation, R.C.R. and A.P.; writing—review and editing, R.C.R., R.O., T.Z., K.M., W.H., K.S. and A.P.; funding acquisition, A.P. All authors have read and agreed to the published version of the manuscript.

Funding

This study was supported in part by grants of the German Research Foundation (DFG: PL-241/5-1, GRK 1208) to Dr. Plagemann. The funder had no role in study design, data collection and analysis, decision to publish, or preparation of the manuscript.

Acknowledgments

The authors acknowledge Jens Stupin, Joachim W. Dudenhausen, Thomas Harder, Andrea Loui, Elisabeth Eilers, and Sandra Schulz, for contributions to initial study cohort design, subject recruitment, and/or sample/data collection, respectively. We are very grateful to all participants of this study as well as midwifes and staff of the Clinic of Obstetrics at the Charité, Campus Virchow-Klinikum, Berlin, Germany, for the support in recruitment and sample/data collection. We acknowledge support from the German Research Foundation (DFG) and the Open Access Publication Fund of Charité – Universitätsmedizin Berlin.

Conflicts of Interest

The authors declare that they have no competing interests.

Abbreviations

BMIBody-mass-index
CSCesarean section
GDMGestational diabetes mellitus
HOMA-IRHomeostatic model assessment of insulin resistance
NGTNormal glucose tolerance
oGTTOral glucose tolerance test
PPIA Peptidylprolyl isomerase A
SATSubcutaneous adipose tissue
SOCS3Suppressor of cytokine signaling 3
TNF-αTumor necrosis factor alpha
VATVisceral adipose tissue

References

  1. Chen, C.; Xu, X.; Yan, Y. Estimated global overweight and obesity burden in pregnant women based on panel data model. PLoS ONE 2018, 13, e0202183. [Google Scholar] [CrossRef] [PubMed] [Green Version]
  2. Franzago, M.; Fraticelli, F.; Stuppia, L.; Vitacolonna, E. Nutrigenetics, epigenetics and gestational diabetes: consequences in mother and child. Epigenetics 2019, 14, 215–235. [Google Scholar] [CrossRef] [PubMed] [Green Version]
  3. Lain, K.Y.; Catalano, P.M. Metabolic changes in pregnancy. Clin. Obstet. Gynecol. 2007, 50, 938–948. [Google Scholar] [CrossRef] [PubMed]
  4. Melchior, H.; Kurch-Bek, D.; Mund, M. The prevalence of gestational diabetes—A population based analysis of a nationwide screening program. Dtsch. Ärzteblatt Int 2017, 114, 412–418. [Google Scholar] [CrossRef] [Green Version]
  5. Plagemann, A. Maternal diabetes and perinatal programming. Early Hum. Dev. 2011, 87, 743–747. [Google Scholar] [CrossRef]
  6. Sacks, D.A.; Hadden, D.R.; Maresh, M.; Deerochanawong, C.; Dyer, A.R.; Metzger, B.E.; Lowe, L.P.; Coustan, D.R.; Hod, M.; Oats, J.J.N.; et al. Frequency of Gestational Diabetes Mellitus at Collaborating Centers Based on IADPSG Consensus Panel–Recommended Criteria The Hyperglycemia and Adverse Pregnancy Outcome (HAPO) Study. Diabetes Care 2012, 35, 526–528. [Google Scholar] [CrossRef] [Green Version]
  7. Metzger, B.E.; Buchanan, T.A.; Coustan, D.R.; De Leiva, A.; Dunger, D.B.; Hadden, D.R.; Hod, M.; Kitzmiller, J.L.; Kjos, S.L.; Oats, J.N.; et al. Summary and recommendations of the Fifth International Workshop-Conference on Gestational Diabetes Mellitus. Diabetes Care 2007, 30, S251–S260. [Google Scholar] [CrossRef] [Green Version]
  8. O’Sullivan, E.P.; Avalos, G.; O’Reilly, M.; Dennedy, M.C.; Gaffney, G.; Dunne, F.; the Atlantic DIP Collaborators. Atlantic Diabetes in Pregnancy (DIP): the prevalence and outcomes of gestational diabetes mellitus using new diagnostic criteria. Diabetologia 2011, 54, 1670–1675. [Google Scholar]
  9. Catalano, P.; DeMouzon, S.H. Maternal obesity and metabolic risk to the offspring: why lifestyle interventionsmay have not achieved the desired outcomes. Int. J. Obes. (Lond.) 2015, 39, 642–649. [Google Scholar] [CrossRef] [Green Version]
  10. Tchernof, A.; Després, J.P. Pathophysiology of human visceral obesity: An update. Physiol. Rev. 2013, 93, 359–404. [Google Scholar] [CrossRef]
  11. Ghaben, A.L.; Scherer, P.E. Adipogenesis and metabolic health. Nat. Rev. Mol. Cell Biol. 2019, 20, 242–258. [Google Scholar] [CrossRef] [PubMed]
  12. De Souza, L.R.; Berger, H.; Retnakaran, R.; Maguire, J.L.; Nathens, A.B.; Connelly, P.W.; Ray, J.G. First-Trimester Maternal Abdominal Adiposity Predicts Dysglycemia and Gestational Diabetes Mellitus in Midpregnancy. Diabetes Care 2016, 39, 61–64. [Google Scholar] [CrossRef] [PubMed] [Green Version]
  13. Castellano-Castillo, D.; Moreno-Indias, I.; Sanchez-Alcoholado, L.; Ramos-Molina, B.; Alcaide-Torres, J.; Morcillo, S.; Ocaña-Wilhelmi, L.; Tinahones, F.; Queipo-Ortuño, M.I.; Cardona, F. Altered Adipose Tissue DNA Methylation Status in Metabolic Syndrome: Relationships Between Global DNA Methylation and Specific Methylation at Adipogenic, Lipid Metabolism and Inflammatory Candidate Genes and Metabolic Variables. J. Clin. Med. 2019, 8, 87. [Google Scholar] [CrossRef] [PubMed] [Green Version]
  14. Bravo-Flores, E.; Mancilla-Herrera, I.; Espino y Sosa, S.; Ortiz-Ramirez, M.; Flores-Rueda, V.; Ibargüengoitia-Ochoa, F.; Ibañez, C.A.; Zambrano, E.; Solis-Paredes, M.; Perichart-Perera, O.; et al. Macrophage Populations in Visceral Adipose Tissue from Pregnant Women: Potential Role of Obesity in Maternal Inflammation. Int. J. Mol. Sci. 2018, 19, 1074. [Google Scholar] [CrossRef] [Green Version]
  15. Reilly, S.M.; Saltiel, A.R. Adapting to obesity with adipose tissue inflammation. Nat. Rev. Endocrinol. 2017, 13, 633–643. [Google Scholar] [CrossRef]
  16. Ott, R.; Stupin, J.H.; Melchior, K.; Schellong, K.; Ziska, T.; Dudenhausen, J.W.; Henrich, W.; Rancourt, R.C.; Plagemann, A. Alterations of adiponectin gene expression and DNA methylation in adipose tissues and blood cells are associated with gestational diabetes and neonatal outcome. Clin. Epigenetics 2018, 10, 131. [Google Scholar] [CrossRef] [Green Version]
  17. Ott, R.; Melchior, K.; Stupin, J.H.; Ziska, T.; Schellong, K.; Henrich, W.; Rancourt, R.C.; Plagemann, A. Reduced insulin receptor expression and altered DNA methylation in fat tissues and blood of women with GDM and offspring. JCEM 2019, 104, 137–149. [Google Scholar] [CrossRef] [Green Version]
  18. Rancourt, R.C.; Ott, R.; Schellong, K.; Melchior, K.; Ziska, T.; Henrich, W.; Plagemann, A. Visceral adipose tissue alteration of PI3KR1 expression is associated with gestational diabetes but not promoter DNA methylation. Adipocyte 2019, 8, 339–346. [Google Scholar] [CrossRef]
  19. Ahima, R.S.; Stanley, T.L.; Khor, V.K.; Zanni, M.V.; Grinspoon, S.K. Estrogen sulfotransferase is expressed in subcutaneous adipose tissue of obese humans in association with TNF-alpha and SOCS3. J. Clin. Endocrinol. Metab. 2011, 96, E1153–E1158. [Google Scholar] [CrossRef] [Green Version]
  20. Liu, Z.; Gan, L.; Zhou, Z.; Jin, W.; Sun, C. SOCS3 promotes inflammation and apoptosis via inhibiting JAK2/STAT3 signaling pathway in 3T3-L1 adipocyte. Immunobiology 2015, 220, 947–953. [Google Scholar] [CrossRef]
  21. Emanuelli, B.; Peraldi, P.; Filloux, C.; Chavey, C.; Freidinger, K.; Hilton, D.J.; Hotamisligil, G.S.; Van Obberghen, E. SOCS-3 inhibits insulin signaling and is up-regulated in response to tumor necrosis factor-alpha in the adipose tissue of obese mice. J. Biol. Chem. 2001, 276, 47944–47949. [Google Scholar] [CrossRef] [PubMed] [Green Version]
  22. Hasan, A.; Akhter, N.; Al-Roub, A.; Thomas, R.; Kochumon, S.; Wilson, A.; Koshy, M.; Al-Ozairi, E.; Al-Mulla, F.; Ahmad, R. TNF-α in Combination with Palmitate Enhances IL-8 Production via The MyD88- Independent TLR4 Signaling Pathway: Potential Relevance to Metabolic Inflammation. Int. J. Mol. Sci. 2019, 20, 4112. [Google Scholar] [CrossRef] [PubMed] [Green Version]
  23. Tanti, J.F.; Ceppo, F.; Jager, J.; Berthou, F. Implication of inflammatory signaling pathways in obesity-induced insulin resistance. Front. Endocrinol. (Lausanne) 2013, 3, 181. [Google Scholar] [CrossRef] [PubMed] [Green Version]
  24. Ehlting, C.; Lai, W.S.; Schaper, F.; Brenndörfer, E.D.; Matthes, R.J.; Heinrich, P.C.; Ludwig, S.; Blackshear, P.J.; Gaestel, M.; Häussinger, D.; et al. Regulation of suppressor of cytokine signaling 3 (SOCS3) mRNA stability by TNF-alpha involves activation of the MKK6/p38MAPK/MK2 cascade. J. Immunol. 2007, 178, 2813–2826. [Google Scholar] [CrossRef] [Green Version]
  25. Abell, S.; De Courten, B.; Boyle, J.; Teede, H. Inflammatory and other biomarkers: Role in pathophysiology and prediction of gestational diabetes mellitus. Int. J. Mol. Sci. 2015, 16, 13442–13473. [Google Scholar] [CrossRef]
  26. Lekva, T.; Norwitz, E.R.; Aukrust, P.; Ueland, T. Impact of Systemic Inflammation on the Progression of Gestational Diabetes Mellitus. Curr. Diabetes Rep. 2016, 16, 26. [Google Scholar] [CrossRef]
  27. Dong, Y.; Chauhan, M.; Betancourt, A.; Belfort, M.; Yallampalli, C. Adipose Tissue Inflammation and Adrenomedullin Overexpression Contribute to Lipid Dysregulation in Diabetic Pregnancies. J. Clin. Endocrinol. Metab. 2018, 103, 3810–3818. [Google Scholar] [CrossRef] [Green Version]
  28. Cawthorn, W.P.; Sethi, J.K. TNF-α and adipocyte biology. FEBS Lett. 2008, 582, 117–131. [Google Scholar] [CrossRef] [Green Version]
  29. Makki, K.; Froguel, P.; Wolowczuk, I. Adipose tissue in obesity-related inflammation and insulin resistance: Cells, cytokines, and chemokines. ISRN Inflamm. 2013, 2013, 139239. [Google Scholar] [CrossRef] [Green Version]
  30. Pantham, P.; Aye, I.L.; Powell, T.L. Inflammation in maternal obesity and gestational diabetes mellitus. Placenta 2015, 36, 709–715. [Google Scholar] [CrossRef] [Green Version]
  31. Moller, D.E. Potential role of TNF-alpha in the pathogenesis of insulin resistance and type 2 diabetes. Trends Endocrinol. Metab. 2000, 11, 212–217. [Google Scholar] [CrossRef]
  32. Hotamisligil, G.S.; Peraldi, P.; Budavari, A.; Ellis, R.; White, M.F.; Spiegelman, B.M. IRS-1-Mediated Inhibition of Insulin Receptor Tyrosine Kinase Activity in TNF-α- and Obesity-Induced Insulin Resistance. Science 1996, 271, 665–668. [Google Scholar] [CrossRef] [PubMed]
  33. Kanety, H.; Feinstein, R.; Papa, M.Z.; Hemi, R.; Karasik, A. Tumor necrosis factor alpha-induced phosphorylation of insulin receptor substrate-1 (IRS-1). Possible mechanism for suppression of insulin-stimulated tyrosine phosphorylation of IRS-1. J. Biol. Chem. 1995, 270, 23780–23784. [Google Scholar] [CrossRef] [PubMed] [Green Version]
  34. Dhar, K.; Rakesh, K.; Pankajakshan, D.; Agrawal, D.K. SOCS3 promotor hypermethylation and STAT3-NF-κB interaction downregulate SOCS3 expression in human coronary artery smooth muscle cells. Am. J. Physiol. Heart Circ. Physiol. 2013, 304, H776–H785. [Google Scholar] [CrossRef] [Green Version]
  35. Ronn, S.G.; Billestrup, N.; Mandrup-Poulsen, T. Diabetes and Suppressors of Cytokine Signaling Proteins. Diabetes 2007, 56, 541–548. [Google Scholar] [CrossRef] [Green Version]
  36. Kleiblova, P.; Dostalova, I.; Bartlova, M.; Lacinova, Z.; Ticha, I.; Krejci, V.; Springer, D.; Kleibl, Z.; Haluzik, M. Expression of adipokines and estrogen receptors in adipose tissue and placenta of patients with gestational diabetes mellitus. Mol. Cell. Endocrinol. 2010, 314, 150–156. [Google Scholar] [CrossRef] [Green Version]
  37. Tsiotra, P.C.; Halvatsiotis, P.; Patsouras, K.; Maratou, E.; Salamalekis, G.; Raptis, S.A.; Dimitriadis, G.; Boutati, E. Circulating adipokines and mRNA expression in adipose tissue and the placenta in women with gestational diabetes mellitus. Peptides 2018, 101, 157–166. [Google Scholar] [CrossRef]
  38. Santangelo, C.; Filardi, T.; Perrone, G.; Mariani, M.; Mari, E.; Scazzocchio, B.; Masella, R.; Brunelli, R.; Lenzi, A.; Zicari, A.; et al. Cross-talk between fetal membranes and visceral adipose tissue involves HMGB1-RAGE and VIP-VPAC2 pathways in human gestational diabetes mellitus. Acta Diabetol. 2019, 56, 681–689. [Google Scholar] [CrossRef]
  39. Deng, X.; Yang, Y.; Sun, H.; Qi, W.; Duan, Y.; Qian, Y. Analysis of whole genome-wide methylation and gene expression profiles in visceral omental adipose tissue of pregnancies with gestational diabetes mellitus. J. Chin. Med. Assoc. 2018, 81, 623–630. [Google Scholar] [CrossRef]
  40. Qian, Y.; Sun, H.; Xiao, H.; Ma, M.; Xiao, X.; Qu, Q. Microarray analysis of differentially expressed genes and their functions in omental visceral adipose tissues of pregnant women with vs. without gestational diabetes mellitus. Biomed. Rep. 2017, 6, 503–512. [Google Scholar] [CrossRef] [Green Version]
  41. D’Ambrosi, F.; Crovetto, F.; Colosi, E.; Fabietti, I.; Carbone, F.; Tassis, B.; Motta, S.; Bulfoni, A.; Fedele, L.; Rossi, G.; et al. Maternal Subcutaneous and Visceral Adipose Ultrasound Thickness in Women with Gestational Diabetes Mellitus at 24–28 Weeks’ Gestation. Fetal Diagn. Ther. 2018, 43, 143–147. [Google Scholar] [CrossRef] [Green Version]
  42. Gur, E.B.; Ince, O.; Turan, G.A.; Karadeniz, M.; Tatar, S.; Celik, E.; Yalcin, M.; Guclu, S. Ultrasonographic visceral fat thickness in the first trimester can predict metabolic syndrome and gestational diabetes mellitus. Endocrine 2014, 47, 478–484. [Google Scholar] [CrossRef]
  43. Kelstrup, L.; Hjort, L.; Houshmand-Oeregaard, A.; Clausen, T.D.; Hansen, N.S.; Broholm, C.; Borch-Johnsen, L.; Mathiesen, E.R.; Vaag, A.A.; Damm, P. Gene Expression and DNA Methylation of PPARGC1A in Muscle and Adipose Tissue From Adult Offspring of Women With Diabetes in Pregnancy. Diabetes 2016, 65, 2900–2910. [Google Scholar] [CrossRef] [PubMed] [Green Version]
  44. Ott, R.; Stupin, J.H.; Loui, A.; Eilers, E.; Melchior, K.; Rancourt, R.C.; Schellong, K.; Ziska, T.; Dudenhausen, J.W.; Henrich, W.; et al. Maternal overweight is not an independent risk factor for increased birth weight, leptin and insulin in newborns of gestational diabetic women: Observations from the prospective “EaCH” cohort study. BMC Pregnancy Childbirth 2018, 18, 250. [Google Scholar] [CrossRef] [PubMed] [Green Version]
  45. Deutsche Gesellschaft für Gynäkologie und Geburtshilfe. Diabetes und Schwangerschaft [Internet] 2008. Available online: https://www.awmf.org/uploads/tx_szleitlinien/057-008l_S3_Gestationsdiabetes-mellitus-GDM-Diagnostik-Therapie-Nachsorge_2019-06.pdf (accessed on 19 November 2019).
  46. Kleinwechter, H. Gestationsdiabetes mellitus (GDM). Dtsch. Med. Wochenschr. 2012, 137, 999–1002. [Google Scholar] [CrossRef] [PubMed]
  47. Matthews, D.R.; Hosker, J.R.; Rudenski, A.S.; Naylor, B.A.; Treacher, D.F.; Turner, R.C. Homeostasis model assessment: insulin resistance and β-cell function from fasting plasma glucose and insulin concentrations in man. Diabetologia 1985, 28, 412–419. [Google Scholar] [CrossRef] [Green Version]
  48. Neville, M.J.; Collins, J.M.; Gloyn, A.L.; McCarthy, M.I.; Karpe, F. Comprehensive human adipose tissue mRNA and microRNA endogenous control selection for quantitative real-time-PCR normalization. Obesity 2011, 19, 888–892. [Google Scholar] [CrossRef]
  49. Pfaffl, M.W. A new mathematical model for relative quantification in real-time RT–PCR. Nucleic Acids Res. 2001, 29, e45. [Google Scholar] [CrossRef]
  50. Stahlberg, A.; Kubista, M.; Pfaffl, M. Comparison of reverse transcriptases in gene expression analysis. Clin. Chem. 2004, 50, 1678–1680. [Google Scholar] [CrossRef]
  51. Sato, H.; Watanabe, A.; Tanaka, T.; Koitabashi, N.; Arai, M.; Kurabayashi, M.; Yokoyama, T. Regulation of the human tumor necrosis factor-alpha promoter by angiotensin II and lipopolysaccharide in cardiac fibroblasts: different cis-acting promoter sequences and transcriptional factors. J. Mol. Cell. Cardiol. 2003, 35, 1197–1205. [Google Scholar] [CrossRef]
  52. Tsai, E.Y.; Falvo, J.V.; Tsytsykova, A.V.; Barczak, A.K.; Reimold, A.M.; Glimcher, L.H.; Fenton, M.J.; Gordon, D.C.; Dunn, I.F.; Goldfeld, A.E. A lipopolysaccharide-specific enhancer complex involving Ets, Elk-1, Sp1, and CREB binding protein and p300 is recruited to the tumor necrosis factor alpha promoter in vivo. Mol. Cell. Biol. 2000, 20, 6084–6094. [Google Scholar] [CrossRef] [PubMed] [Green Version]
  53. Gowers, I.R.; Walters, K.; Kiss-Toth, E.; Read, R.C.; Duff, G.W.; Wilson, A.G. Age-related loss of CpG methylation in the tumour necrosis factor promoter. Cytokine 2011, 56, 792–797. [Google Scholar] [CrossRef] [PubMed] [Green Version]
  54. Benjamini, Y.; Krieger, A.M.; Yekutieli, D. Adaptive linear step-up procedures that control the false discovery rate. Biometrika 2006, 93, 491–507. [Google Scholar] [CrossRef]
Figure 1. Relative mRNA levels of TNF-α and suppressor of cytokine signaling 3 (SOCS3) in subcutaneous adipose tissue (SAT) and visceral adipose tissue (VAT) of women with GDM vs. NGT. Relative gene expression of TNF-α (A) and SOCS3 (B) was normalized to peptidylprolyl isomerase A (PPIA) in abdominal SAT and omental VAT, of women with GDM (n = 19, black) vs. NGT women (n = 22, white). Data are means ± SEM, shown as percentage to NGT levels. A.U., arbitrary units. TNF-α VAT ** P < 0.0001, SOCS3-VAT * P = 0.01. (CD) Pearson’s correlation coefficients (R) calculating the relationship between maternal blood TNF-α levels and VAT gene expression data. NGT: open circles, GDM: red circles. Statistical significance between groups (A,B) and for correlations (C,D) remained after adjustment for prepregnancy body-mass-index (BMI) and BMI at delivery.
Ijms 21 00479 g001
Figure 2. DNA methylation analysis in the TNF-α promoter region. CpG site-specific DNA methylation analyses at the TNF-α promoter region in visceral adipose tissue from mothers with NGT vs. GDM. (A) Schematic illustration of the DNA methylation assays (R1, R2, and R3) for the TNF-α promoter region, including transcription factor binding sites (TFBS) Sp1, EGR1, AP2 (diamonds). (B) Percent DNA methylation at each individual CpG site investigated (10 CpG sites) in VAT of normal glucose tolerant (NGT; white; n = 22) vs. GDM group (GDM; black; n = 19). Overall mean across CpG sites is also included. Data are means ± S.E.M. * P < 0.05. TSS: Transcriptional start site, bp: basepairs.
Ijms 21 00479 g002
Figure 3. DNA methylation analysis in the SOCS3 promoter region. CpG site-specific DNA methylation analyses at SOCS3 within the promoter region in visceral adipose tissue from mothers with NGT vs. GDM. (A) Schematic illustration of the DNA methylation assays (R1, R2, and R3) for the SOCS3 promoter region, including potential transcription factor binding sites (TFBS) Sp1, NFKB (diamonds) and within the CpG island (blue). (B) Percent DNA methylation at each individual CpG site investigated (18 CpG sites) in VAT of NGT (white; n = 22) vs. GDM group (GDM; black; n = 19). The overall mean across CpG sites is also included. Data are means ± S.E.M. TSS: Transcriptional start site, bp: base pairs.
Ijms 21 00479 g003
Table 1. General and specific cohort characteristics according to groups, gestational diabetes mellitus (GDM) and normal glucose tolerance (NGT) [18], and relations with maternal blood tumor necrosis factor alpha (TNF-α) at delivery.
NGT n = 22 [18]GDM n = 19p-Value *Spearman’s vs. MB TNF-α r (p-Value *)
Maternal age (years)32.0 ± 5.332.5 ± 4.20.720.043 (0.78)
Prepregnancy BMI (kg/m2)26.8 ± 7.928.2 ± 6.70.320.107 (0.50)
BMI at delivery (kg/m2)33.1 ± 9.233.2 ± 6.60.500.099 (0.53)
Blood glucose at oGTT (mg/dL)
Fasting79.5 ± 8.1100 ± 30.9<0.00040.380 (0.01)
 1-h120.9 ± 29.3213 ± 36.8<0.00010.505 (0.0007)
 2-h90.3 ± 19.9167 ± 49.5<0.00010.516 (0.0006)
Area under the curve (mg/dL*h)205.8 ± 38.3346 ± 71.9<0.00010.516 (0.0006)
Maternal fasting plasma levels at delivery:
 Glucose (mg/dL)71.1 ± 10.782.8 ± 8.40.0010.319 (0.04)
 Insulin (µU/mL)21.5 ± 16.140.9 ± 36.80.050.111 (0.48)
 HOMA-IR3.2 ± 1.38.4 ± 7.40.0060.208 (0.19)
 C-peptide (ng/mL)2.0 ± 0.85.0 ± 3.1<0.00010.338 (0.03)
 TNF-α (pg/mL)0.32 ± 0.350.86 ± 0.35<0.0001n.a.
Infant parameters:
 Birth weight (g)3365 ± 495.93585 ± 454.40.060.064 (0.68)
 Relative Birth weight (g/cm)66.4 ± 6.870.16 ± 8.10.100.029 (0.85)
Data are means ± SD, * Statistically significant (p-value < 0.05). Normal glucose tolerance, (NGT); gestational diabetes mellitus, (GDM); maternal blood, (MB); body-mass-index, (BMI); Oral glucose tolerance test, (oGTT); homeostatic model assessment of insulin resistance, (HOMA-IR); tumor necrosis factor alpha, (TNF-α); not applicable, (n.a.). Statistically significant differences between groups and correlations remained after adjustment for prepregnancy BMI and BMI at delivery.

