Aggregation of Omic Data and Secretome Prediction Enable the Discovery of Candidate Plasma Biomarkers for Beef Tenderness


Abstract
:1. Introduction
2. Results
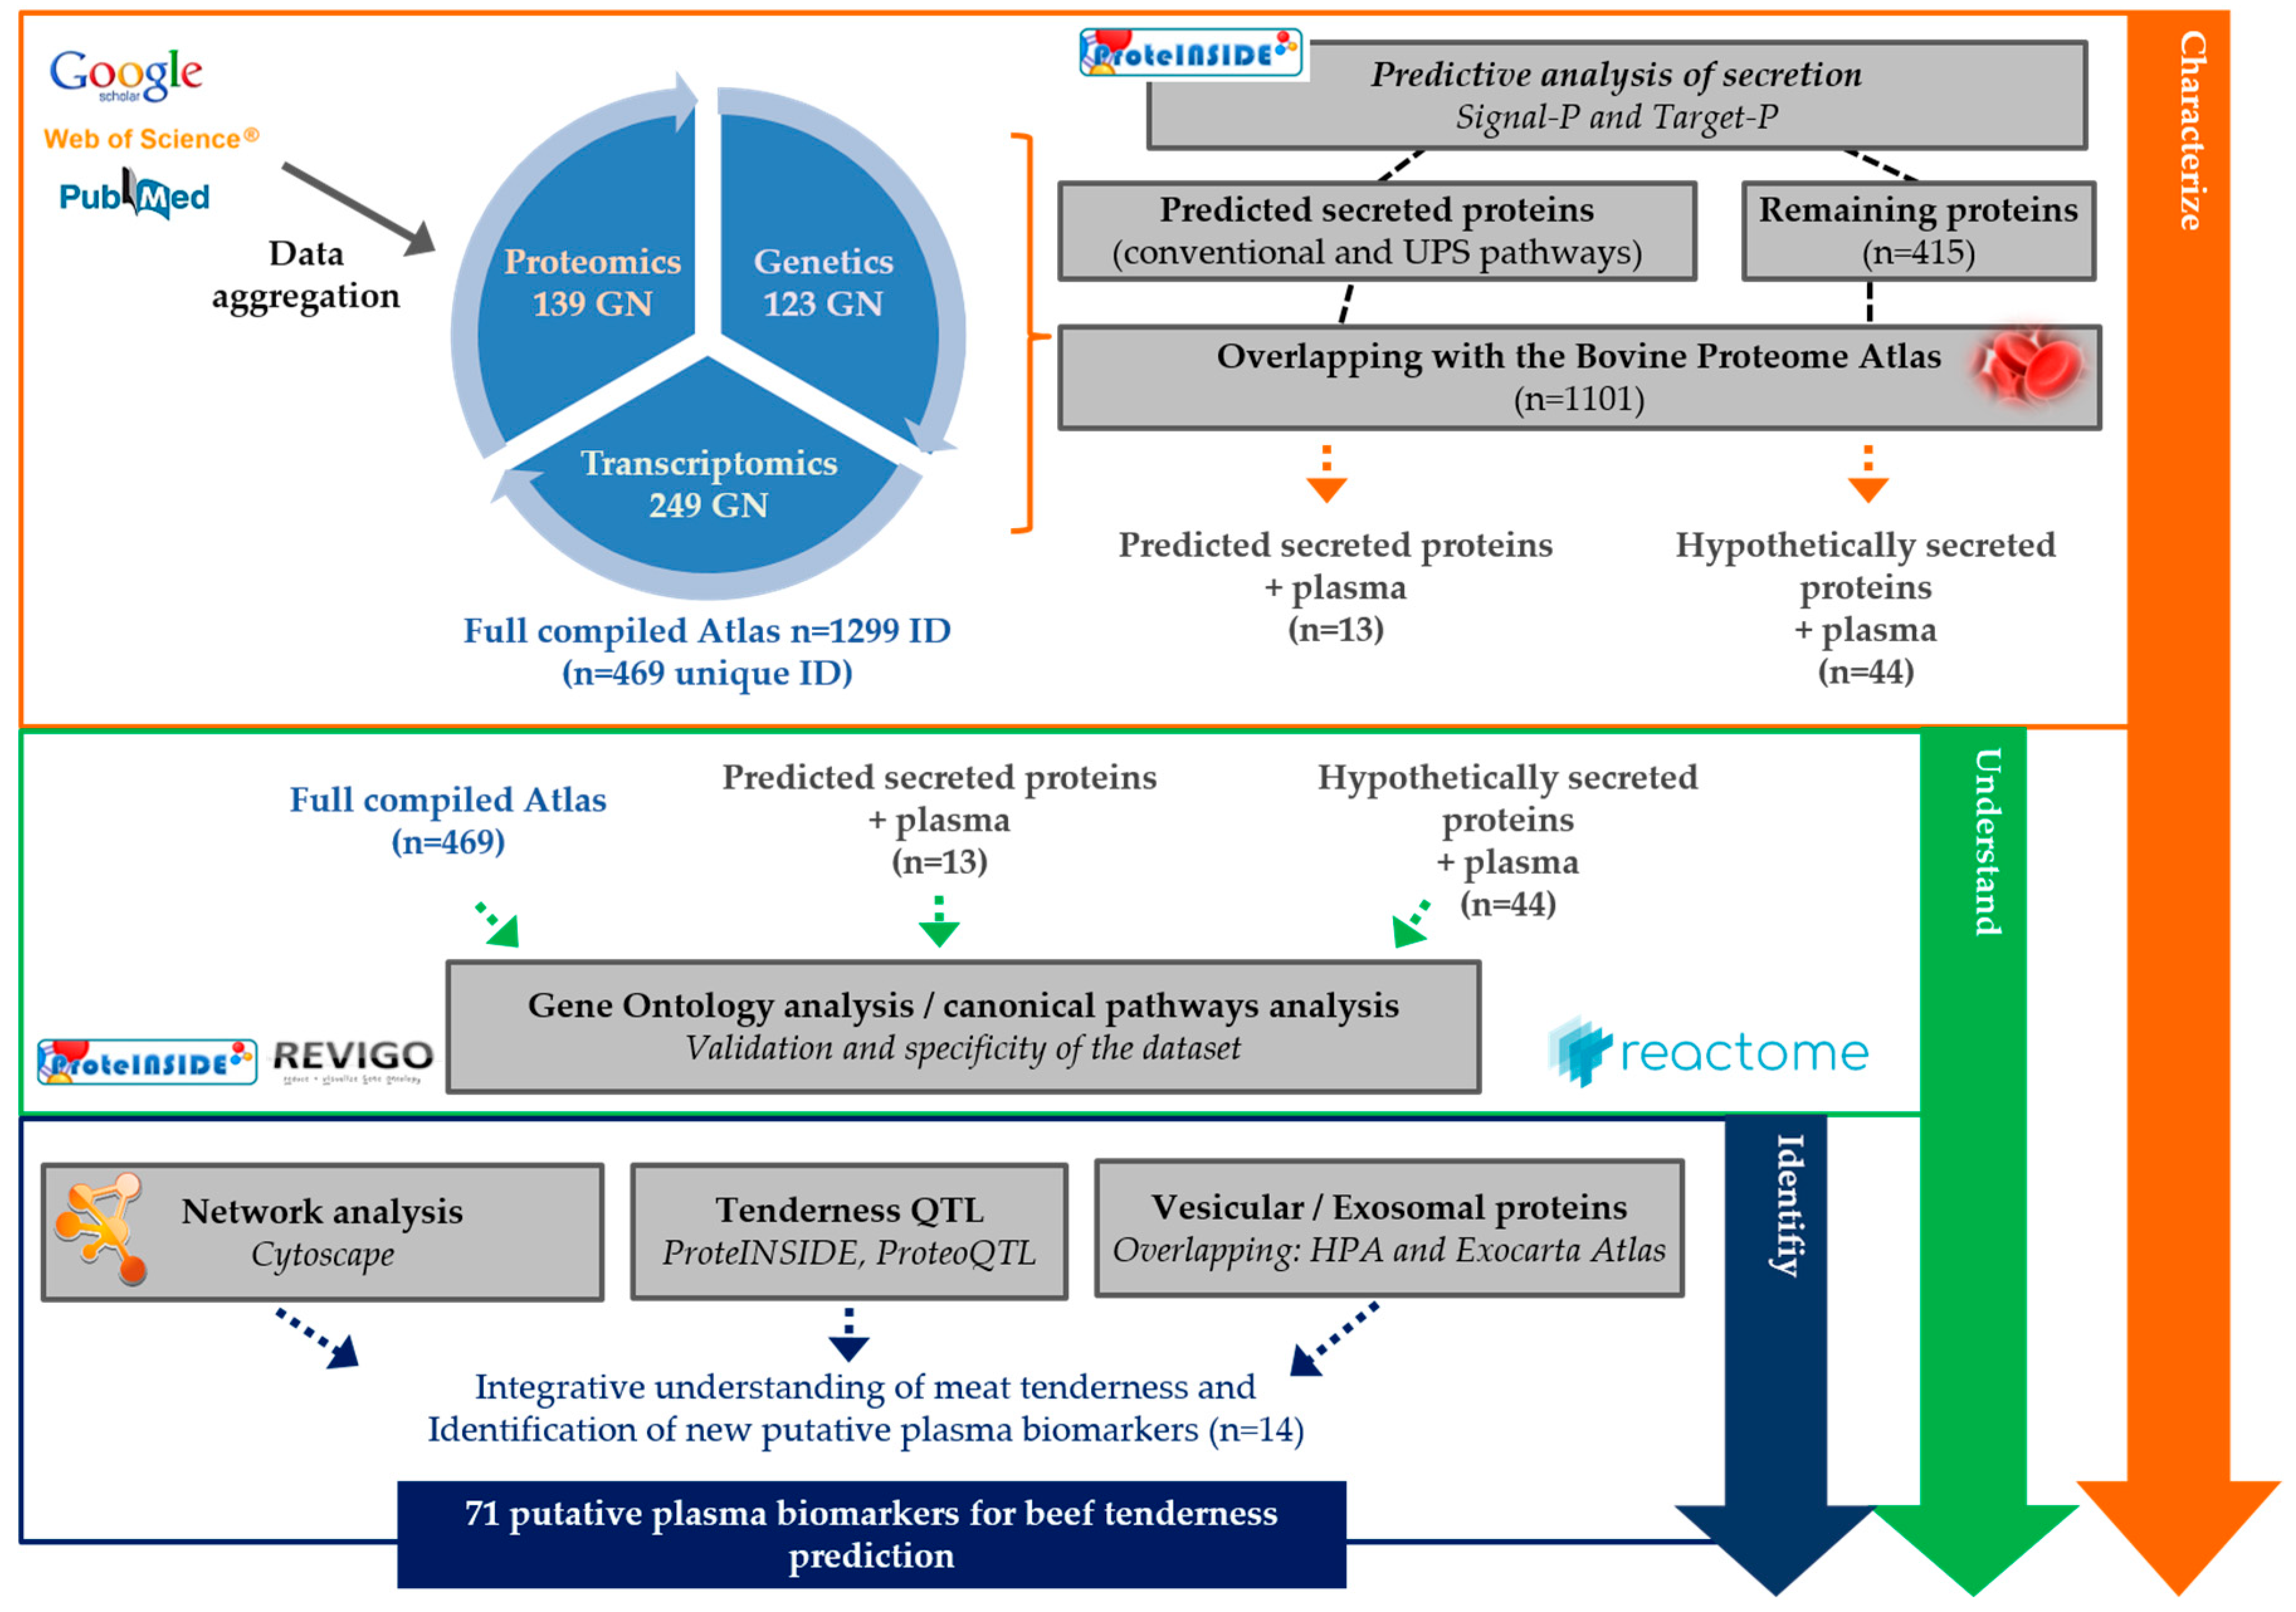
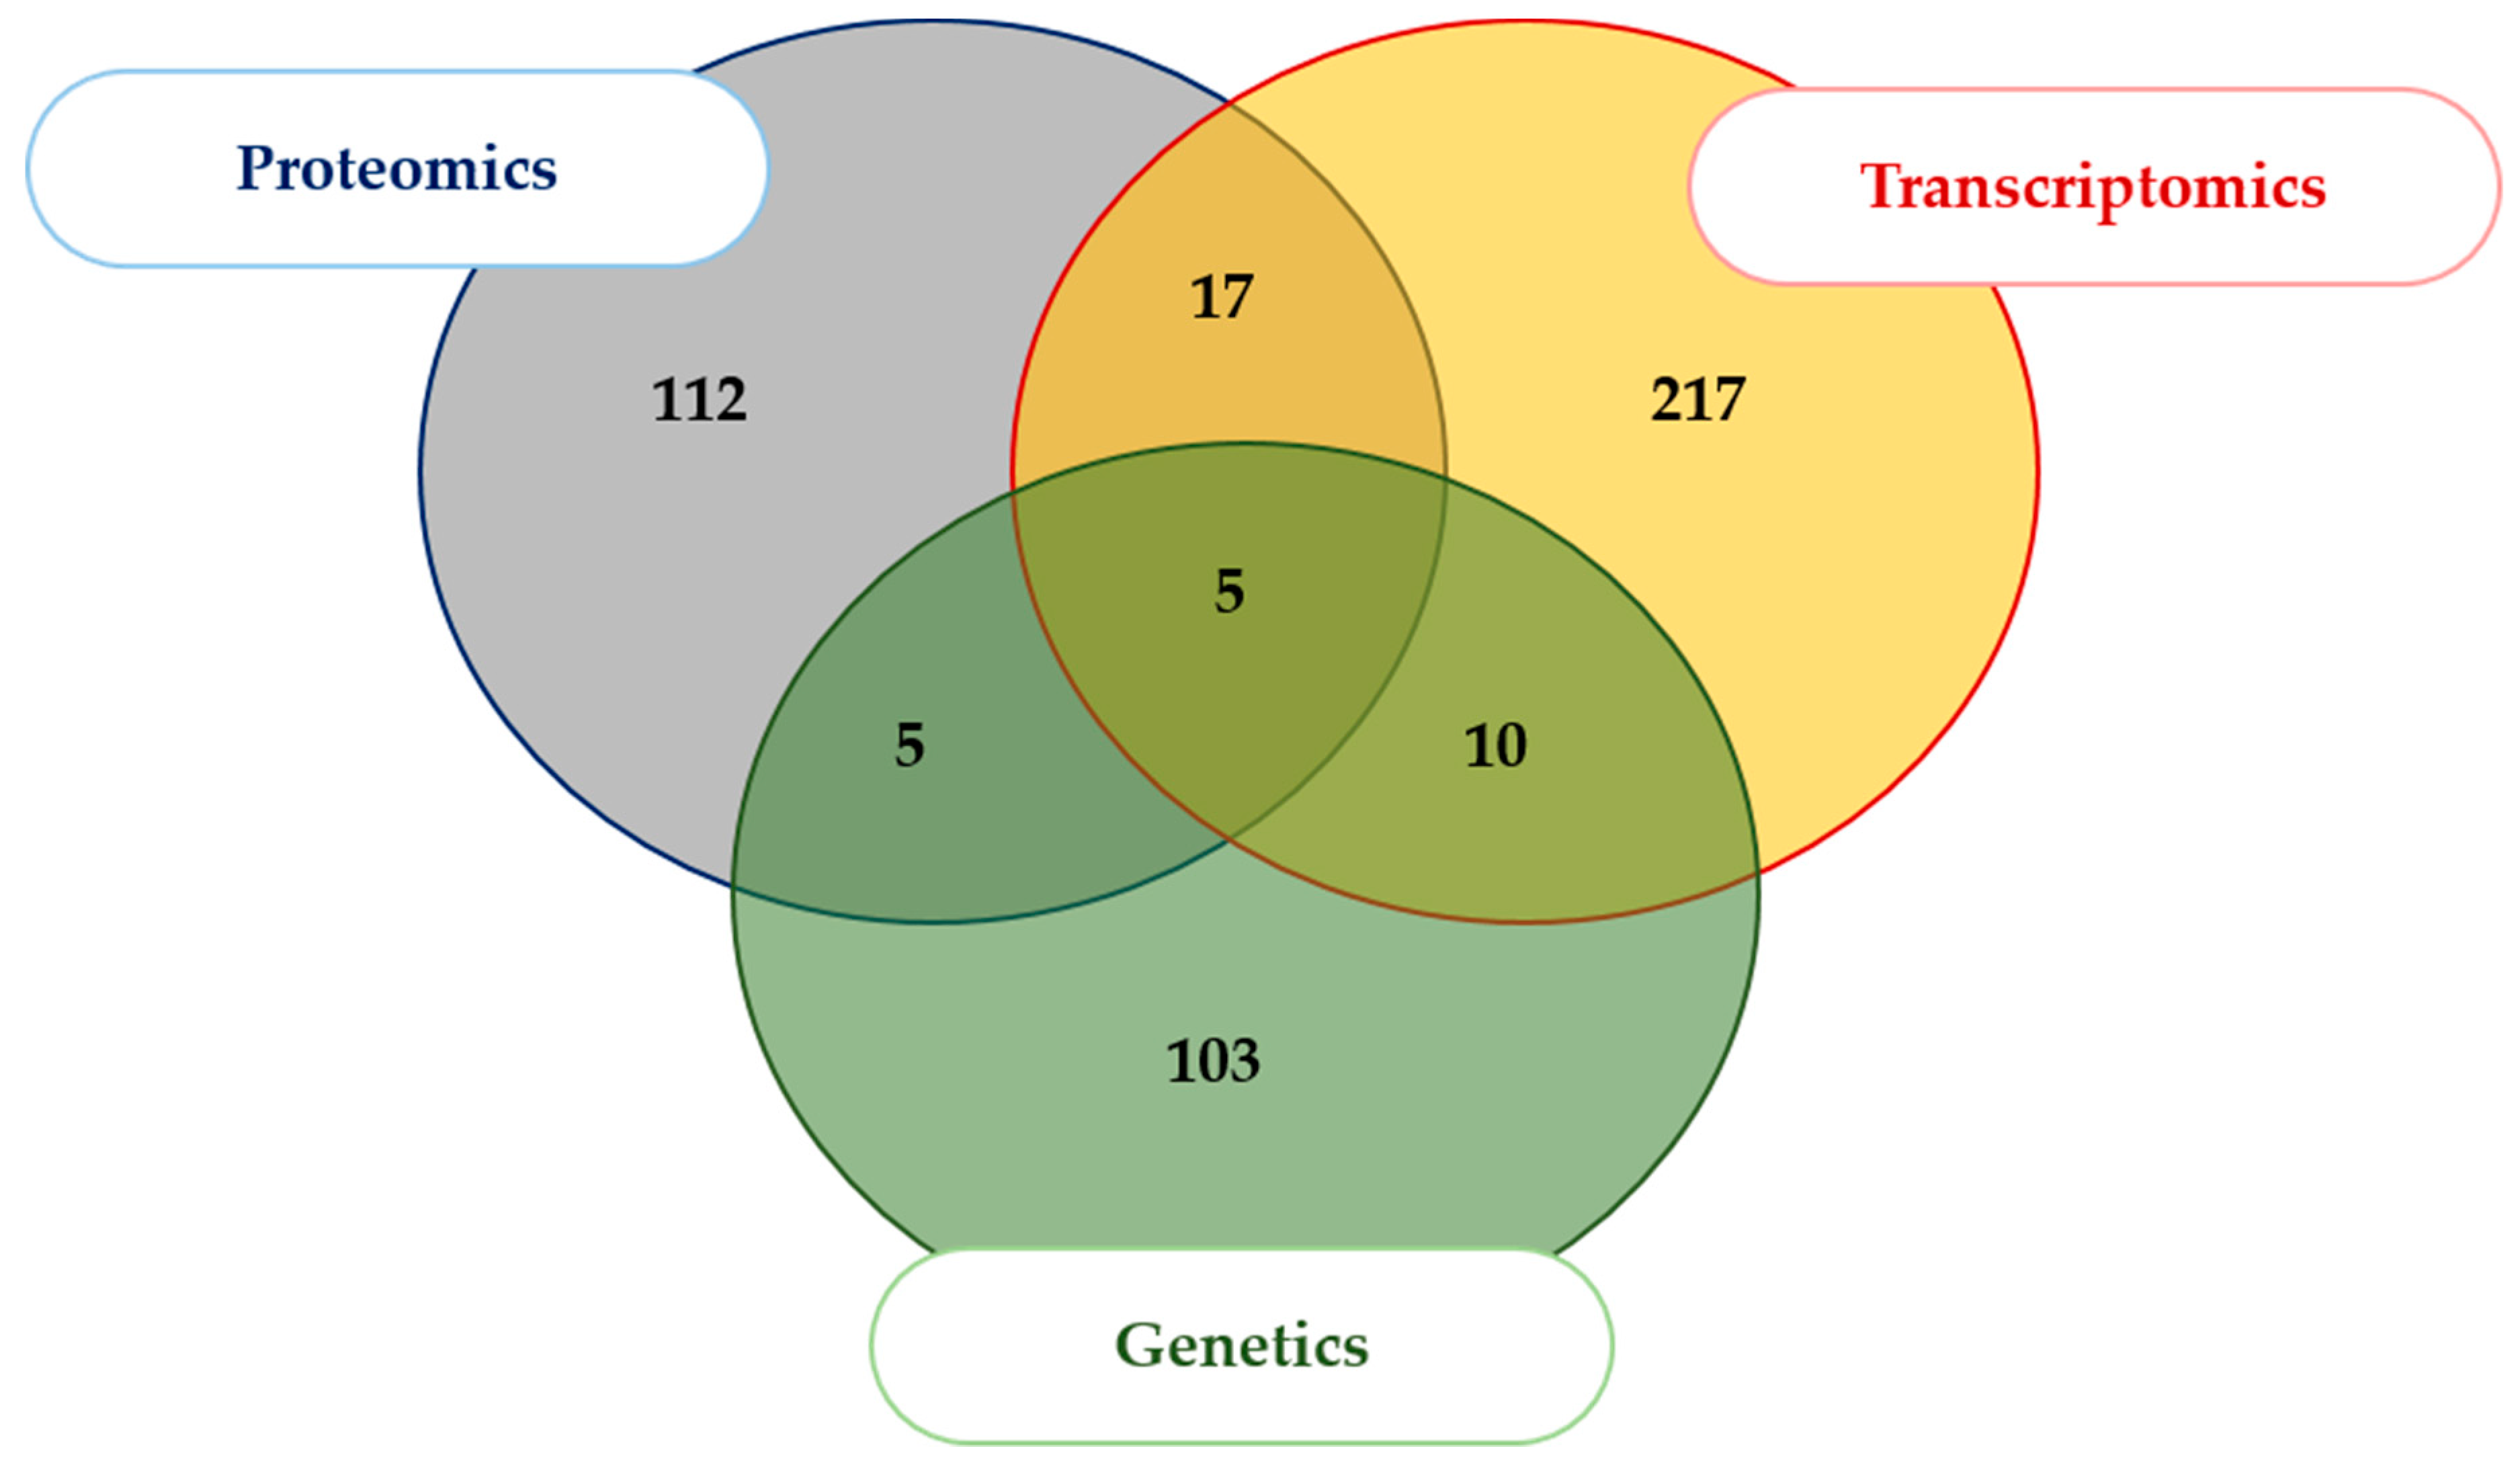
2.1. Literature Search and Data Aggregation
2.2. Computational Prediction
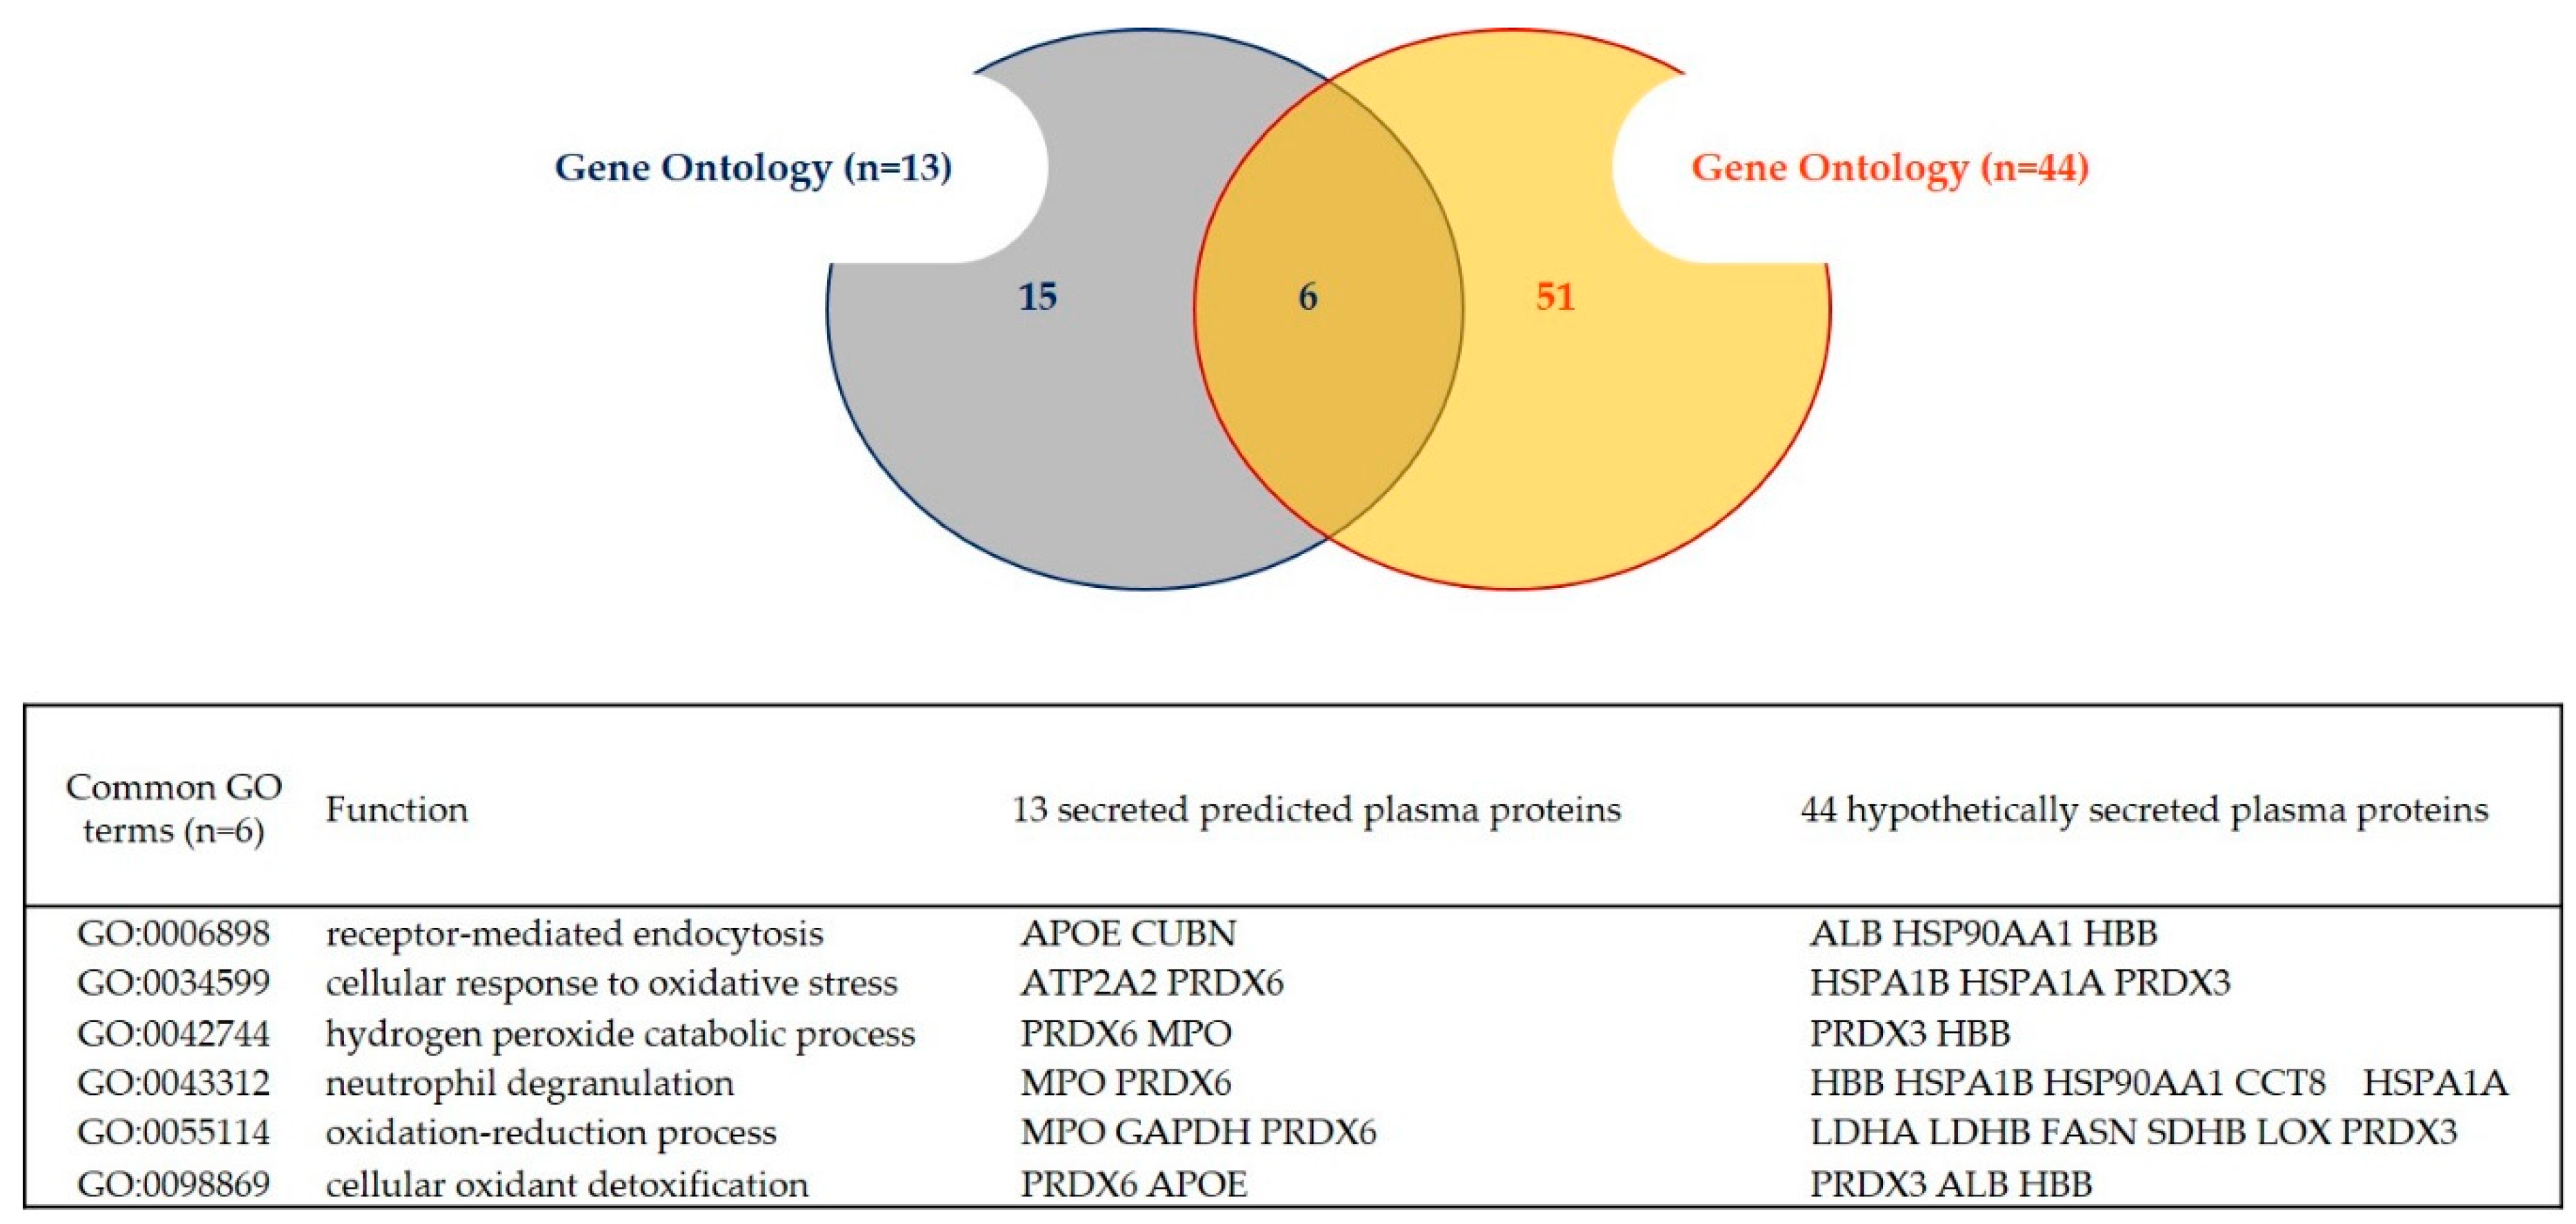
2.3. Gene Ontology
2.4. Network Analysis and Plasma PPi Identification
2.5. Identification of the Extracellular Vesicles (EVs) Proteins
2.6. QTL Investigation
3. Discussion
3.1. Relevance of the Aggregated Dataset
3.2. Reconstruction of the Secretome Linked to Tenderness and Identification of Secreted Proteins in Plasma
3.2.1. Proteins Predicted to Be Secreted through Conventional and Unconventional Pathways of Secretion (UPS)
3.2.2. Proteins Hypothetically Secreted in the Plasma
3.3. Extracellular Vesicle Proteins as a Sub Repertoire of Tenderness Proteins Secreted in Plasma
Relevance of the Secreted Proteins in Plasma for Tenderness Biomarkers Studies
4. Materials and Methods
4.1. Data Origin and Literature Search Strategy
4.1.1. Review of the Literature
4.1.2. Parameters of Inclusion
4.2. Aggregation of Collected Data
4.2.1. Data Extraction
4.2.2. Protein Identifiers Standardization
4.3. Gene Ontology
4.4. Computational Prediction for the Plasma Secreted Proteins Identification
4.4.1. Prediction of the Secreted Proteins
4.4.2. Prediction of Plasma Location
4.5. Network Analysis and Protein-Protein Interactions
4.6. Search for QTL
4.7. Identification of the EVs Proteins
4.8. Dataset Descriptors
5. Conclusions
Supplementary Materials
Author Contributions
Funding
Acknowledgments
Conflicts of Interest
Abbreviations
| BP | Biological process |
| BPA | Bovine proteome atlas |
| EVs | Extracellular vesicles |
| GN | Gene name |
| GO | Gene ontology |
| HPA | Human protein atlas |
| ID | Identifiers |
| PPi | Protein-protein interaction |
| QTL | Quantitative trait loci |
| UPS | Unconventional pathways of secretion |
References
- Gerber, P.J.; Mottet, A.; Opio, C.I.; Falcucci, A.; Teillard, F. Environmental impacts of beef production: Review of challenges and perspectives for durability. Meat Sci. 2015, 109, 2–12. [Google Scholar] [CrossRef] [PubMed]
- O’Quinn, T.G.; Legako, J.F.; Brooks, J.C.; Miller, M.F. Evaluation of the contribution of tenderness, juiciness, and flavor to the overall consumer beef eating experience1. Transl. Anim. Sci. 2018, 2, 26–36. [Google Scholar] [CrossRef] [Green Version]
- Gagaoua, M.; Terlouw, C.; Micol, D.; Boudjellal, A.; Hocquette, J.-F.; Picard, B. Proteomic Biomarkers of Meat Colour of Blonde D’Aquitaine Young Bulls: Towards a Better Comprehension of the Biological Mechanisms, 61th Int. Congr. Meat Sci. Technol. (ICoMST). In Proceedings of the 61st International Congress of Meat Science and Meat Technology, Clermont-Ferrand, France, 23–28 August 2015; p. 93. Available online: http://agris.fao.org/agris-search/search.do?recordID=FR2016209911 (accessed on 31 October 2019).
- McCormick, C. Applied Muscle Biology and Meat Science; Du, M., McCormick, R.J., Eds.; CRC Press: New York, NY, USA, 2009; pp. 128–148. [Google Scholar]
- Dransfield, E.; Martin, J.-F.; Bauchart, D.; Abouelkaram, S.; Lepetit, J.; Culioli, J.; Jurie, C.; Picard, B. Meat quality and composition of three muscles from French cull cows and young bulls. Anim. Sci. 2003, 76, 387–399. [Google Scholar] [CrossRef]
- Sinclair, K.D.; Lobley, G.E.; Horgan, G.W.; Kyle, D.J.; Porter, A.D.; Matthews, K.R.; Warkup, C.C.; Maltin, C.A. Factors influencing beef eating quality 1. Effects of nutritional regimen and genotype on organoleptic properties and instrumental texture. Anim. Sci. 2001, 72, 269–277. [Google Scholar] [CrossRef]
- Hansen, S.; Therkildsen, M.; Byrne, D.V. Effects of a compensatory growth strategy on sensory and physical properties of meat from young bulls. Meat Sci. 2006, 74, 628–643. [Google Scholar] [CrossRef]
- Soulat, J.; Picard, B.; Léger, S.; Monteils, V. Prediction of beef carcass and meat quality traits from factors characterising the rearing management system applied during the whole life of heifers. Meat Sci. 2018, 140, 88–100. [Google Scholar] [CrossRef]
- Gagaoua, M.; Picard, B.; Soulat, J.; Monteils, V. Clustering of sensory eating qualities of beef: Consistencies and differences within carcass, muscle, animal characteristics and rearing factors. Livest. Sci. 2018, 214, 245–258. [Google Scholar] [CrossRef]
- Terlouw, C. Stress Reactivity, Stress at Slaughter and Meat Quality. In Meat Quality: Genetic and Environmental Factors; CRC Press: New York, NY, USA, 2015; p. 105. Available online: http://agris.fao.org/agris-search/search.do?recordID=LV2016025540 (accessed on 22 October 2019).
- Ouali, A. Sensory quality of meat as affected by muscle biochemistry and modern technologies. In Animal Biotechnology and the Quality of Meat Production; Elsevier: Amsterdam, The Netherlands, 1991; pp. 85–105. [Google Scholar] [CrossRef]
- Shackelford, S.D.; Wheeler, T.L.; Koohmaraie, M. Tenderness classification of beef: I. Evaluation of beef longissimus shear force at 1 or 2 days postmortem as a predictor of aged beef tenderness. J. Anim. Sci. 1997, 75, 2417–2422. [Google Scholar] [CrossRef] [Green Version]
- Miller, R.K. The Eating Quality of Meat: V-Sensory Evaluation of Meat. In Lawrie´ s Meat Science, 8th ed.; Elsevier: Amsterdam, The Netherlands, 2017; pp. 461–499. [Google Scholar] [CrossRef]
- Sensory and Tenderness Evaluation Guidelines, (n.d.). Available online: https://meatscience.org/publications-resources/printed-publications/sensory-and-tenderness-evaluation-guidelines (accessed on 15 January 2020).
- Hocquette, J.-F.; Lehnert, S.; Barendse, W.; Cassar-Malek, I.; Picard, B. Recent advances in cattle functional genomics and their application to beef quality. Animal 2007, 1, 159–173. [Google Scholar] [CrossRef] [Green Version]
- Taye, M.; Kim, J.; Yoon, S.H.; Lee, W.; Hanotte, O.; Dessie, T.; Kemp, S.; Mwai, O.A.; Caetano-Anolles, K.; Cho, S.; et al. Whole genome scan reveals the genetic signature of African Ankole cattle breed and potential for higher quality beef. BMC Genet. 2017, 18, 11. [Google Scholar] [CrossRef]
- Bernard, C.; Cassar-Malek, I.; le Cunff, M.; Dubroeucq, H.; Renand, G.; Hocquette, J.F. New indicators of beef sensory quality revealed by expression of specific genes. J. Agric. Food Chem. 2007, 55, 5229–5237. [Google Scholar] [CrossRef] [PubMed] [Green Version]
- Hocquette, J.-F.; Bernard-Capel, C.; Vidal, V.; Jesson, B.; Levéziel, H.; Renand, G.; Cassar-Malek, I. The GENOTEND chip: A new tool to analyse gene expression in muscles of beef cattle for beef quality prediction. BMC Vet. Res. 2012, 8, 135. [Google Scholar] [CrossRef] [PubMed] [Green Version]
- Lametsch, R.; Karlsson, A.; Rosenvold, K.; Andersen, H.J.; Roepstorff, P.; Bendixen, E. Postmortem Proteome Changes of Porcine Muscle Related to Tenderness. J. Agric. Food Chem. 2003, 51, 6992–6997. Available online: http://0-pubs-acs-org.brum.beds.ac.uk/doi/abs/10.1021/jf034083p (accessed on 2 March 2017). [CrossRef] [PubMed]
- Przybylski, W.; Hopkins, D. Meat Quality: Genetic and Environmental Factors; Przybylski, W., Hopkins, D., Eds.; CRC Press: New York, NY, USA, 2015. [Google Scholar]
- Picard, B.; Gagaoua, M. Proteomic Investigations of Beef Tenderness. Proteom. Food Sci. 2017, 177–197. [Google Scholar] [CrossRef]
- Gagaoua, M.; Terlouw, E.M.C.; Micol, D.; Hocquette, J.-F.; Moloney, A.P.; Nuernberg, K.; Bauchart, D.; Boudjellal, A.; Scollan, N.D.; Richardson, R.I.; et al. Sensory quality of meat from eight different types of cattle in relation with their biochemical characteristics. J. Integr. Agric. 2016, 15, 1550–1563. [Google Scholar] [CrossRef] [Green Version]
- Picard, B.; Gagaoua, M.; Micol, D.; Cassar-Malek, I.; Hocquette, J.-F.; Terlouw, C.E.M. Inverse Relationships between Biomarkers and Beef Tenderness According to Contractile and Metabolic Properties of the Muscle. J. Agric. Food Chem. 2014, 62, 9808–9818. [Google Scholar] [CrossRef]
- Cassar-Malek, I.; Picard, B. Expression Marker-Based Strategy to Improve Beef Quality. Sci. World J. 2016, 2016, 1–11. [Google Scholar] [CrossRef] [Green Version]
- Jia, X.; Veiseth-Kent, E.; Grove, H.; Kuziora, P.; Aass, L.; Hildrum, K.I.; Hollung, K. Peroxiredoxin-6 A potential protein marker for meat tenderness in bovine longissimus thoracis muscle. J. Anim. Sci. 2009, 87, 2391–2399; [Google Scholar] [CrossRef] [Green Version]
- Kim, G.-D.; Yang, H.-S.; Jeong, J.-Y. Comparison of Characteristics of Myosin Heavy Chain-based Fiber and Meat Quality among Four Bovine Skeletal Muscles. Korean J. Food Sci. Anim. Resour. 2016, 36, 819–828. [Google Scholar] [CrossRef] [Green Version]
- Lana, A.; Longo, V.; Dalmasso, A.; D’Alessandro, A.; Bottero, M.T.; Zolla, L. Omics integrating physical techniques: Aged Piedmontese meat analysis. Food Chem. 2015, 172, 731–741. [Google Scholar] [CrossRef]
- Laville, E.; Sayd, T.; Morzel, M.; Blinet, S.; Chambon, C.; Lepetit, J.; Renand, G.; Hocquette, J.F.F. Proteome changes during meat aging in tough and tender beef suggest the importance of apoptosis and protein solubility for beef aging and tenderization. J. Agric. Food Chem. 2009, 57, 10755–10764. [Google Scholar] [CrossRef] [PubMed]
- Picard, B.; Guillemin, N.; Bonnet, M.; Champanelle, S.G.; Cassar-Malek, I.; Guillemin, N.; Bonnet, M. 4.32-Quest for Novel Muscle Pathway Biomarkers by Proteomics in Beef Production. Compr. Biotechnol. 2011, 1, 395–405. [Google Scholar] [CrossRef]
- Thornton, K.J.; Chapalamadugu, K.C.; Eldredge, E.M.; Murdoch, G.K. Analysis of Longissimus thoracis Protein Expression Associated with Variation in Carcass Quality Grade and Marbling of Beef Cattle Raised in the Pacific Northwestern United States. J. Agric. Food Chem. 2017, 65, 1434–1442. [Google Scholar] [CrossRef] [PubMed]
- Bowker, B.C.; Eastridge, J.S.; Solomon, M.B. Measurement of Muscle Exudate Protein Composition as an Indicator of Beef Tenderness. J. Food Sci. 2014, 79, C1292–C1297. [Google Scholar] [CrossRef] [PubMed]
- Zhao, C.; Zan, L.; Wang, Y.; Updike, M.S.; Liu, G.; Bequette, B.J.; Vi, R.L.B.; Song, J. Functional proteomic and interactome analysis of proteins associated with beef tenderness in Angus cattle. Livest. Sci. 2014, 161, 201–209. [Google Scholar] [CrossRef]
- D’Alessandro, A.; Rinalducci, S.; Marrocco, C.; Zolla, V.; Napolitano, F.; Zolla, L. Love me tender: An Omics window on the bovine meat tenderness network. J. Proteom. 2012, 75, 4360–4380. [Google Scholar] [CrossRef]
- Morzel, M.; Terlouw, C.; Chambon, C.; Micol, D.; Picard, B. Muscle proteome and meat eating qualities of Longissimus thoracis of “Blonde d’Aquitaine” young bulls: A central role of HSP27 isoforms. Meat Sci. 2008, 78, 297–304. [Google Scholar] [CrossRef]
- Kim, N.K.; Cho, S.; Lee, S.H.; Park, H.R.; Lee, C.S.; Cho, Y.M.; Choy, Y.H.; Yoon, D.; Im, S.K.; Park, E.W. Proteins in longissimus muscle of Korean native cattle and their relationship to meat quality. Meat Sci. 2008, 80, 1068–1073. [Google Scholar] [CrossRef]
- Bouley, J.; Chambon, C.; Picard, B. Mapping of bovine skeletal muscle proteins using two-dimensional gel electrophoresis and mass spectrometry. Proteomics 2004, 4, 1811–1824. [Google Scholar] [CrossRef]
- Bjarnadottir, S.G.; Hollung, K.; Høy, M.; Bendixen, E.; Codrea, M.C.; Veiseth-Kent, E. Changes in protein abundance between tender and tough meat from bovine Longissimus thoracis muscle assessed by isobaric Tag for Relative and Absolute Quantitation (iTRAQ) and 2-dimensional gel electrophoresis analysis. J. Anim. Sci. 2012, 90, 2035–2043. [Google Scholar] [CrossRef] [Green Version]
- Carvalho, M.E.; Gasparin, G.; Poleti, M.D.; Rosa, A.F.; Balieiro, J.C.C.; Labate, C.A.; Nassu, R.T.; Tullio, R.R.; Regitano, L.C.D.; Mourão, G.B.; et al. Heat shock and structural proteins associated with meat tenderness in Nellore beef cattle, a Bos indicus breed. Meat Sci. 2014, 96, 1318–1324. [Google Scholar] [CrossRef] [PubMed]
- Chaze, T.; Hocquette, J.-F.; Meunier, B.; Renand, G.; Jurie, C.; Chambon, C.; Journaux, L.; Rousset, S.; Denoyelle, C.; Lepetit, J.; et al. Biological Markers for Meat Tenderness of the Three Main French Beef Breeds Using 2-DE and MS Approach. In Proteomics in Foods; Springer US: Boston, MA, USA, 2013; pp. 127–146. [Google Scholar] [CrossRef]
- Guillemin, N.P.; Jurie, C.; Renand, G.; Hocquette, J.-F.; Micol, D.; Lepetit, J.; Picard, B. Different phenotypic and proteomic markers explain variability of beef tenderness across muscles. Int. J. Biol. 2012, 4, 26–38. [Google Scholar] [CrossRef] [Green Version]
- Guillemin, N.; Meunier, B.; Jurie, C.; Cassar-Malek, I.; Hocquette, J.-F.; Leveziel, H.; Picard, B. Validation of a Dot-Blot quantitative technique for large scale analysis of beef tenderness biomarkers. J. Physiol. Pharmacol. 2009, 60, 91–97. Available online: http://0-www-ncbi-nlm-nih-gov.brum.beds.ac.uk/pubmed/19996488 (accessed on 23 October 2019). [PubMed]
- Baldassini, W.A.; Braga, C.P.; Chardulo, L.A.L.; Silva, J.A.I.V.; Malheiros, J.M.; de Albuquerque, L.G.; Fernandes, T.T.; Padilha, P.d. Bioanalytical methods for the metalloproteomics study of bovine longissimus thoracis muscle tissue with different grades of meat tenderness in the Nellore breed (Bos indicus). Food Chem. 2015, 169, 65–72. [Google Scholar] [CrossRef]
- Boudida, Y.; Gagaoua, M.; Becila, S.; Picard, B.; Boudjellal, A.; Herrera-Mendez, C.H.; Sentandreu, M.; Ouali, A. Serine Protease Inhibitors as Good Predictors of Meat Tenderness: Which Are They and What Are Their Functions? Crit. Rev. Food Sci. Nutr. 2016, 56, 957–972. [Google Scholar] [CrossRef]
- Chulayo, A.Y.; Bradley, G.; Muchenje, V. Effects of transport distance, lairage time and stunning efficiency on cortisol, glucose, HSPA1A and how they relate with meat quality in cattle. Meat Sci. 2016, 117, 89–96. [Google Scholar] [CrossRef]
- Franco, D.; Mato, A.; Salgado, F.J.; López-Pedrouso, M.; Carrera, M.; Bravo, S.; Parrado, M.; Gallardo, J.M.; Zapata, C. Tackling proteome changes in the longissimus thoracis bovine muscle in response to pre-slaughter stress. J. Proteom. 2015, 122, 73–85. [Google Scholar] [CrossRef] [Green Version]
- Grabež, V.; Kathri, M.; Phung, V.; Moe, K.M.; Slinde, E.; Skaugen, M.; Saarem, K.; Egelandsdal, B. Protein expression and oxygen consumption rate of early postmortem mitochondria relate to meat tenderness. J. Anim. Sci. 2015, 93, 1967–1979. [Google Scholar] [CrossRef] [Green Version]
- Guillemin, N.; Jurie, C.; Cassar-Malek, I.; Hocquette, J.F.; Renand, G.; Picard, B. Variations in the abundance of 24 protein biomarkers of beef tenderness according to muscle and animal type. Animal 2011, 5, 885–894. [Google Scholar] [CrossRef] [Green Version]
- Fonseca, L.F.S.; Gimenez, D.F.J.; dos Santos Silva, D.B.; Barthelson, R.; Baldi, F.; Ferro, J.A.; Albuquerque, L.G. Differences in global gene expression in muscle tissue of Nellore cattle with divergent meat tenderness. BMC Genom. 2017, 18, 945. [Google Scholar] [CrossRef] [Green Version]
- Kee, H.J.; Park, E.W.; Lee, C.K. Characterization of beef transcripts correlated with tenderness and moisture. Mol. Cells 2008, 25, 428–437. [Google Scholar] [PubMed]
- Bongiorni, S.; Gruber, C.E.M.; Bueno, S.; Chillemi, G.; Ferre, F.; Failla, S.; Moioli, B.; Valentini, A. Transcriptomic investigation of meat tenderness in two Italian cattle breeds. Anim. Genet. 2016, 47, 273–287. [Google Scholar] [CrossRef] [PubMed]
- Zhang, X.H.; Qi, Y.X.; Gao, X.; Li, J.Y.; Xu, S.Z. Expression of ADAMTS4 and ADAMTS5 in longissimus dorsi muscle related to meat tenderness in Nanyang cattle. Genet. Mol. Res. 2013, 12, 4639–4647. [Google Scholar] [CrossRef] [PubMed]
- Zhao, C.; Tian, F.; Yu, Y.; Luo, J.; Hu, Q.; Bequette, B.J.; Vi, R.L.B.; Liu, G.; Zan, L.; Updike, M.S.; et al. Muscle transcriptomic analyses in Angus cattle with divergent tenderness. Mol. Biol. Rep. 2012, 39, 4185–4193. [Google Scholar] [CrossRef] [PubMed]
- Malheiros, J.M.; Enríquez-Valencia, C.E.; da Silva Duran, B.O.; de Paula, T.G.; Curi, R.A.; de Vasconcelos Silva, J.A.I.; Dal-Pai-Silva, M.; de Oliveira, H.N.; Chardulo, L.A.L. Association of CAST2, HSP90AA1, DNAJA1 and HSPB1 genes with meat tenderness in Nellore cattle. Meat Sci. 2018, 138, 49–52. [Google Scholar] [CrossRef] [PubMed]
- Gurgul, A.; Szmatoła, T.; Ropka-Molik, K.; Jasielczuk, I.; Pawlina, K.; Semik, E.; Bugno-Poniewierska, M. Identification of genome-wide selection signatures in the Limousin beef cattle breed. J. Anim. Breed. Genet. 2016, 133, 264–276. [Google Scholar] [CrossRef] [PubMed]
- Hou, G.-Y.; Yuan, Z.-R.; Gao, X.; Li, J.-Y.; Gao, H.-J.; Chen, J.-B.; Xu, S.-Z. Genetic Polymorphisms of the CACNA2D1 Gene and Their Association with Carcass and Meat Quality Traits in Cattle. Biochem. Genet. 2010, 48, 751–759. [Google Scholar] [CrossRef]
- Pinto, L.F.; Ferraz, J.B.; Pedrosa, V.B.; Eler, J.P.; Meirelles, F.V.; Bonin, M.D.N.; Rezende, F.M.D.; Carvalho, M.E.; Cucco, D.D.C.; Silva, R.C. Single nucleotide polymorphisms in CAPN and leptin genes associated with meat color and tenderness in Nellore cattle. Genet. Mol. Res. 2011, 10, 2057–2064. [Google Scholar] [CrossRef] [Green Version]
- Ramayo-Caldas, Y.; Renand, G.; Ballester, M.; Saintilan, R.; Rocha, D. Multi-breed and multi-trait co-association analysis of meat tenderness and other meat quality traits in three French beef cattle breeds. Genet. Sel. Evol. 2016, 48, 37. [Google Scholar] [CrossRef] [Green Version]
- Fan, Y.Y.; Zan, L.S.; Fu, C.Z.; Tian, W.Q.; Wang, H.B.; Liu, Y.Y.; Xin, Y.P. Three novel SNPs in the coding region of PPARγ gene and their associations with meat quality traits in cattle. Mol. Biol. Rep. 2011, 38, 131–137. [Google Scholar] [CrossRef]
- Allais, S.; Journaux, L.; Levéziel, H.; Payet-Duprat, N.; Raynaud, P.; Hocquette, J.F.; Lepetit, J.; Rousset, S.; Denoyelle, C.; Bernard-Capel, C.; et al. Effects of polymorphisms in the calpastatin and μ-calpain genes on meat tenderness in 3 French beef breeds. J. Anim. Sci. 2011, 89, 1–11. [Google Scholar] [CrossRef] [PubMed] [Green Version]
- Avilés, C.; Peña, F.; Polvillo, O.; Barahona, M.; Campo, M.M.; Sañudo, C.; Juárez, M.; Horcada, A.; Alcalde, M.J.; Molina, A. Association between functional candidate genes and organoleptic meat traits in intensively-fed beef. Meat Sci. 2015, 107, 33–38. [Google Scholar] [CrossRef] [PubMed]
- Gui, L.; Wang, H.; Wei, S.; Zhang, Y.; Zan, L. Molecular characterization, expression profiles, and analysis of Qinchuan cattle SIRT1 gene association with meat quality and body measurement traits (Bos taurus). Mol. Biol. Rep. 2014, 41, 5237–5246. [Google Scholar] [CrossRef] [PubMed]
- Rexroad Iii, C.E.; Bennett, G.L.; Stone, R.T.; Keele, J.W.; Fahrenkrug, S.C.; Freking, B.A.; Kappes, S.M.; Smith, T.P. Comparative mapping of BTA15 and HSA11 including a region containing a QTL for meat tenderness. Mamm. Genome 2001, 12, 561–565. [Google Scholar] [CrossRef] [PubMed]
- Tizioto, P.C.; Decker, J.E.; Taylor, J.F.; Schnabel, R.D.; Mudadu, M.A.; Silva, F.L.; Mourão, G.B.; Coutinho, L.L.; Tholon, P.; Sonstegard, T.S.; et al. Genome scan for meat quality traits in Nelore beef cattle. Physiol. Genom. 2013, 45, 1012–1020. [Google Scholar] [CrossRef] [PubMed] [Green Version]
- Boudon, S.; Cassar-Malek, I. Dataset of Proteins Related to Beef Tenderness. Portail Data INRAE, V1. 2019. Available online: https://0-doi-org.brum.beds.ac.uk/10.15454/7DKRQD (accessed on 16 January 2020).
- Stastna, M.; van Eyk, J.E. Secreted proteins as a fundamental source for biomarker discovery. Proteomics 2012, 12, 722–735. [Google Scholar] [CrossRef] [Green Version]
- Rifai, N.; Gillette, M.A.; Carr, S.A. Protein biomarker discovery and validation: The long and uncertain path to clinical utility. Nat. Biotechnol. 2006, 24, 971–983. [Google Scholar] [CrossRef]
- Bonnet, M.; Tournayre, J.; Cassar-Malek, I. Integrated data mining of transcriptomic and proteomic datasets to predict the secretome of adipose tissue and muscle in ruminants. Mol. Biosyst. 2016, 12, 2722–2734. [Google Scholar] [CrossRef]
- Picard, B.; Gagaoua, M. Meta-proteomics for the discovery of protein biomarkers of beef tenderness: An overview of integrated studies. Food Res. Int. 2020, 127, 108739. [Google Scholar] [CrossRef]
- Caccia, D.; Dugo, M.; Callari, M.; Bongarzone, I. Bioinformatics tools for secretome analysis. Biochim. Biophys. Acta Proteins Proteom. 2013, 1834, 2442–2453. [Google Scholar] [CrossRef]
- Keerthikumar, S. A catalogue of human secreted proteins and its implications. AIMS Biophys. 2016, 3, 563–570. [Google Scholar] [CrossRef]
- Uhlén, M.; Fagerberg, L.; Hallström, B.M.; Lindskog, C.; Oksvold, P.; Mardinoglu, A.; Sivertsson, Å.; Kampf, C.; Sjöstedt, E.; Asplund, A.; et al. Tissue-based map of the human proteome. Science 2015, 347, 1260419. [Google Scholar] [CrossRef] [PubMed]
- Rabouille, C. Pathways of Unconventional Protein Secretion. Trends Cell Biol. 2017, 27, 230–240. [Google Scholar] [CrossRef] [PubMed]
- Dean, M.; Annilo, T. Evolution of the Atp-Binding Cassette (ABC) Transporter Superfamily in Vertebrates. Annu. Rev. Genom. Hum. Genet. 2005, 6, 123–142. [Google Scholar] [CrossRef] [PubMed]
- Repa, J.J.; Mangelsdorf, D.J. The Role of Orphan Nuclear Receptors in the Regulation of Cholesterol Homeostasis. Annu. Rev. Cell Dev. Biol. 2000, 16, 459–481. [Google Scholar] [CrossRef] [PubMed]
- Robelin, J.; Casteilla, L. Différenciation, croissance et développement du tissu adipeux. Prod. Anim. 1990, 3, 243–252. Available online: http://0-scholar-google-com.brum.beds.ac.uk/scholar?hl=en&btnG=Search&q=intitle:d?veloppement+du+tissu+adipeux#0 (accessed on 17 January 2020).
- Picard, B.; Jurie, C.; Duris, M.P.; Renand, G. Consequences of selection for higher growth rate on muscle fibre development in cattle. Livest. Sci. 2006, 102, 107–120. [Google Scholar] [CrossRef]
- Bonny, S.P.F.; Gardner, G.E.; Pethick, D.W.; Legrand, I.; Polkinghorne, R.J.; Hocquette, J.F. Biochemical measurements of beef are a good predictor of untrained consumer sensory scores across muscles. Animal 2015, 9, 179–190. [Google Scholar] [CrossRef] [Green Version]
- Wallingford, J.B.; Mitchell, B. Strange as it may seem: The many links between Wnt signaling, planar cell polarity, and cilia. Genes Dev. 2011, 25, 201–213. [Google Scholar] [CrossRef] [Green Version]
- Satir, P.; Pedersen, L.B.; Christensen, S.T. The primary cilium at a glance. J. Cell Sci. 2010, 123, 499–503. [Google Scholar] [CrossRef] [Green Version]
- Marican, N.H.J.; Cruz-Migoni, S.B.; Borycki, A.G. Asymmetric distribution of primary cilia allocates satellite cells for self-renewal. Stem Cell Rep. 2016, 6, 798–805. [Google Scholar] [CrossRef] [PubMed] [Green Version]
- Tian, G.; Ropelewski, P.; Nemet, I.; Lee, R.; Lodowski, K.H.; Imanishi, Y. An unconventional secretory pathway mediates the cilia targeting of peripherin/rds. J. Neurosci. 2014, 34, 992–1006. [Google Scholar] [CrossRef] [Green Version]
- Ribeiro, M.F.; Zhu, H.; Millard, R.W.; Fan, G.-C. Exosomes Function in Pro- and Anti-Angiogenesis. Curr. Angiogenes. 2013, 2, 54–59. [Google Scholar] [CrossRef] [PubMed]
- Meldolesi, J. Exosomes and Ectosomes in Intercellular Communication. Curr. Biol. 2018, 28, R435–R444. [Google Scholar] [CrossRef] [PubMed] [Green Version]
- Kharaziha, P.; Ceder, S.; Li, Q.; Panaretakis, T. Tumor cell-derived exosomes: A message in a bottle. Biochim. Biophys. Acta Rev. Cancer 2012, 1826, 103–111. [Google Scholar] [CrossRef] [PubMed]
- Raposo, G.; Stoorvogel, W. Extracellular vesicles: Exosomes, microvesicles, and friends. J. Cell Biol. 2013, 200, 373–383. [Google Scholar] [CrossRef] [PubMed] [Green Version]
- Yáñez-Mó, M.; Siljander, P.R.M.; Andreu, Z.; Bedina Zavec, A.; Borràs, F.E.; Buzas, E.I.; Buzas, K.; Casal, E.; Cappello, F.; Carvalho, J.; et al. Biological properties of extracellular vesicles and their physiological functions. J. Extracell. Vesicles 2015, 4, 27066. [Google Scholar] [CrossRef] [Green Version]
- Vasconcelos, M.H.; Caires, H.R.; Ābols, A.; Xavier, C.P.R.; Linē, A. Extracellular vesicles as a novel source of biomarkers in liquid biopsies for monitoring cancer progression and drug resistance. Drug Resist. Updates 2019, 47, 100647. [Google Scholar] [CrossRef]
- Romancino, D.P.; Paterniti, G.; Campos, Y.; de Luca, A.; di Felice, V.; d’Azzo, A.; Bongiovanni, A. Identification and characterization of the nano-sized vesicles released by muscle cells. FEBS Lett. 2013, 587, 1379–1384. [Google Scholar] [CrossRef] [Green Version]
- Forterre, A.; Jalabert, A.; Berger, E.; Baudet, M.; Chikh, K.; Errazuriz, E.; De Larichaudy, J.; Chanon, S.; Weiss-Gayet, M.; Hesse, A.M.; et al. Proteomic Analysis of C2C12 Myoblast and Myotube Exosome-Like Vesicles: A New Paradigm for Myoblast-Myotube Cross Talk? PLoS ONE 2014, 9, e84153. [Google Scholar] [CrossRef]
- Canet-Avilés, R.M.; Wilson, M.A.; Miller, D.W.; Ahmad, R.; McLendon, C.; Bandyopadhyay, S.; Baptista, M.J.; Ringe, D.; Petsko, G.A.; Cookson, M.R. The Parkinson’s disease protein DJ-1 is neuroprotective due to cysteine-sulfinic acid-driven mitochondrial localization. Proc. Natl. Acad. Sci. USA 2004, 101, 9103–9108. [Google Scholar] [CrossRef] [PubMed] [Green Version]
- Eldh, M.; Ekström, K.; Valadi, H.; Sjöstrand, M.; Olsson, B.; Jernås, M.; Lötvall, J. Exosomes Communicate Protective Messages during Oxidative Stress; Possible Role of Exosomal Shuttle RNA. PLoS ONE 2010, 5, e15353. [Google Scholar] [CrossRef] [PubMed] [Green Version]
- Cruz-Garcia, D.; Curwin, A.J.; Popoff, J.-F.; Bruns, C.; Duran, J.M.; Malhotra, V. Remodeling of secretory compartments creates CUPS during nutrient starvation. J. Cell Biol. 2014, 207, 695–703. [Google Scholar] [CrossRef] [PubMed] [Green Version]
- Rome, S.; Forterre, A.; Mizgier, M.L.; Bouzakri, K. Skeletal Muscle-Released Extracellular Vesicles: State of the Art. Front. Physiol. 2019, 10, 929. [Google Scholar] [CrossRef]
- Le Bihan, M.C.; Bigot, A.; Jensen, S.S.; Dennis, J.L.; Rogowska-Wrzesinska, A.; Lainé, J.; Gache, V.; Furling, D.; Jensen, O.N.; Voit, T.; et al. In-depth analysis of the secretome identifies three major independent secretory pathways in differentiating human myoblasts. J. Proteom. 2012, 77, 344–356. [Google Scholar] [CrossRef]
- Chauhan, S.S.; England, E.M. Postmortem glycolysis and glycogenolysis: Insights from species comparisons. Meat Sci. 2018, 144, 118–126. [Google Scholar] [CrossRef]
- Stahl, P.D.; Raposo, G. Extracellular Vesicles: Exosomes and Microvesicles, Integrators of Homeostasis. Physiology (Bethesda) 2019, 34, 169–177. [Google Scholar] [CrossRef]
- Parolini, I.; Federici, C.; Raggi, C.; Lugini, L.; Palleschi, S.; De Milito, A.; Coscia, C.; Iessi, E.; Logozzi, M.; Molinari, A.; et al. Microenvironmental pH is a key factor for exosome traffic in tumor cells. J. Biol. Chem. 2009, 284, 34211–34222. [Google Scholar] [CrossRef] [Green Version]
- Vega, V.L.; Rodríguez-Silva, M.; Frey, T.; Gehrmann, M.; Diaz, J.C.; Steinem, C.; Multhoff, G.; Arispe, N.; De Maio, A. Hsp70 Translocates into the Plasma Membrane after Stress and Is Released into the Extracellular Environment in a Membrane-Associated Form that Activates Macrophages. J. Immunol. 2008, 180, 4299–4307. [Google Scholar] [CrossRef] [Green Version]
- Gastpar, R.; Gehrmann, M.; Bausero, M.A.; Asea, A.; Gross, C.; Schroeder, J.A.; Multhoff, G. Heat Shock Protein 70 Surface-Positive Tumor Exosomes Stimulate Migratory and Cytolytic Activity of Natural Killer Cells. Cancer Res. 2005, 65, 5238–5247. [Google Scholar] [CrossRef] [Green Version]
- Clayton, A.; Turkes, A.; Navabi, H.; Mason, M.D.; Tabi, Z. Induction of heat shock proteins in B-cell exosomes. J. Cell Sci. 2005, 118, 3631–3638. [Google Scholar] [CrossRef] [PubMed] [Green Version]
- McCready, J.; Sims, J.D.; Chan, D.; Jay, D.G. Secretion of extracellular hsp90α via exosomes increases cancer cell motility: A role for plasminogen activation. BMC Cancer 2010, 10, 294. [Google Scholar] [CrossRef] [PubMed] [Green Version]
- Bamburg, J.R.; Bernstein, B.W. Roles of ADF/cofilin in actin polymerization and beyond. F1000 Biol. Rep. 2010, 2, 62. [Google Scholar] [CrossRef] [PubMed] [Green Version]
- Dunner, S.; Sevane, N.; Garcia, D.; Levéziel, H.; Williams, J.L.; Mangin, B.; Valentini, A. Genes involved in muscle lipid composition in 15 European Bos taurus breeds. Anim. Genet. 2013, 44, 493–501. [Google Scholar] [CrossRef]
- Jia, X.; Hollung, K.; Therkildsen, M.; Hildrum, K.I.; Bendixen, E. Proteome analysis of early post-mortem changes in two bovine muscle types:M. longissimus dorsi andM. Semitendinosis. Proteomics 2006, 6, 936–944. [Google Scholar] [CrossRef]
- Svitkina, T.M.; Verkhovsky, A.B.; Borisy, G.G. Plectin sidearms mediate interaction of intermediate filaments with microtubules and other components of the cytoskeleton. J. Cell Biol. 1996, 135, 991–1007. [Google Scholar] [CrossRef] [Green Version]
- Zernig, G.; Wiche, G. Morphological integrity of single adult cardiac myocytes isolated by collagenase treatment: Immunolocalization of tubulin, microtubule-associated proteins 1 and 2, plectin, vimentin, and vinculin. Eur. J. Cell Biol. 1985, 38, 113–122. Available online: http://0-www-ncbi-nlm-nih-gov.brum.beds.ac.uk/pubmed/2992982 (accessed on 14 November 2019).
- Jaka, O.; Casas-Fraile, L.; de Munain, A.L.; Sáenz, A. Costamere proteins and their involvement in myopathic processes. Expert Rev. Mol. Med. 2015, 17, e12. [Google Scholar] [CrossRef]
- Thornell, I.M.; Bevensee, M.O. Regulators of Slc4 bicarbonate transporter activity. Front. Physiol. 2015, 6, 166. [Google Scholar] [CrossRef] [Green Version]
- Kaspric, N.; Picard, B.; Reichstadt, M.; Tournayre, J.; Bonnet, M. ProteINSIDE to easily investigate proteomics data from ruminants: Application to mine proteome of adipose and muscle tissues in bovine foetuses. PLoS ONE 2015, 10, e0128086. [Google Scholar] [CrossRef] [Green Version]
- Supek, F.; Bošnjak, M.; Škunca, N.; Šmuc, T. REVIGO Summarizes and Visualizes Long Lists of Gene Ontology Terms. PLoS ONE 2011, 6, e21800. [Google Scholar] [CrossRef] [PubMed] [Green Version]
- Nickel, W.; Rabouille, C. Mechanisms of regulated unconventional protein secretion. Nat. Rev. Mol. Cell Biol. 2009, 10, 148–155. [Google Scholar] [CrossRef] [PubMed]
- Shannon, P.; Markiel, A.; Ozier, O.; Baliga, N.S.; Wang, J.T.; Ramage, D.; Amin, N.; Schwikowski, B.; Ideker, T. Cytoscape: A software Environment for integrated models of biomolecular interaction networks. Genome Res. 2003, 13, 2498–2504. [Google Scholar] [CrossRef] [PubMed]
- PSICQUIC Registry, (n.d.). Available online: http://www.ebi.ac.uk/Tools/webservices/psicquic/registry/registry?action=STATUS (accessed on 18 January 2020).


| Dataset | Number of ID Gene Names | Predicted Secreted Proteins (Conventional Pathways) | Predicted Secreted Proteins (Unconventional Pathways, or UPS) | Remaining Proteins | Predicted Secreted Proteins (Conventional and UPS) + Plasma | Hypothetically Secreted Proteins + Plasma |
|---|---|---|---|---|---|---|
| Proteomics (26 Articles) | 139 | 8 | 8 | 123 | 2 | 27 |
| Transcriptomics (11 Articles) | 249 | 29 | 18 | 202 | 6 | 19 |
| Genetics (12 Articles) | 123 | 19 | 14 | 90 | 5 | 6 |
| General Bilan (Unique ID) | 511 (469) | 56 (54) | 40 (36) | 415 (379) | 13 (13) | 52 (44) |
| ID Gene Name | QTL | EVs Proteins (HPA, n = 1998) | Exosomal Proteins (Exocarta, n = 100) |
|---|---|---|---|
| 13 predicted secreted proteins + plasma (conventional and UPS) | |||
| APOE | X | ||
| ATP2A2 | Shear force (Ch. 17) | ||
| CDH13 | |||
| COL11A1 | |||
| CUBN | |||
| EPHA7 | |||
| GAPDH | X | X | |
| GLG1 | |||
| LGALS3BP | X | ||
| MPO | X | ||
| PCDH7 | |||
| PRDX6 | |||
| TG | |||
| 44 hypothetically secreted proteins + plasma | |||
| ACTA1 | |||
| ACTB | X | ||
| ACTC1 | Tenderness score (Chr.10) | ||
| ALB | X | ||
| ATP5B | |||
| BPGM | |||
| CAPN2 | |||
| CASP8 | |||
| CCT8 | |||
| CENPF | |||
| CKM | |||
| COL13A1 | |||
| DES | |||
| ENO3 | |||
| FASN | X | ||
| FGF12 | |||
| FLNA | X | ||
| GBP1 | |||
| HBB | Shear force (Ch.15) | ||
| HSP90AA1 | Shear force (Chr.21) | X | |
| HSPA1A | X | X | |
| HSPA1B | X | ||
| IGF1R | X | ||
| LAMC1 | Shear force (Chr.22) | ||
| LDHA | Shear force (Ch.29) | X | X |
| LDHB | Shear force (Ch.5) | X | |
| LOX | |||
| LRRC16A | |||
| MYH2 | |||
| MYH3 | |||
| MYH7 | |||
| NID1 | |||
| PGAM2 | |||
| PGK1 | X | ||
| PPARG | Shear force (Chr.22) | X | |
| PRDX3 | |||
| PSMB2 | |||
| PVALB | Shear force (Chr.5) | ||
| RGS2 | |||
| SDHB | |||
| TPM1 | Tenderness score (Chr.10) | ||
| TPM3 | |||
| TUFM | |||
| YWHAG | X | ||
| 14 plasma proteins from Network/QTL | |||
| CASP8AP2 | Tenderness score (Chr.9) | ||
| ACTN1 | Tenderness score (Chr.10) | ||
| CAT | Shear force (Chr.15) | X | |
| CCNB2 | Tenderness score (Chr.10) | ||
| CFL1 | Tenderness score and Shear force (Chr.29) | X | |
| GSS | Shear force (Chr.13) | ||
| MAPK1 | Shear force (Chr.17) | ||
| NEFL | Shear force (Chr.8) | ||
| PRKACB | Shear force (Chr.3) | ||
| PSMA7 | Shear force (Chr.13) | ||
| USP8 | Tenderness score (Chr.10) | ||
| YWHAB | Shear force (Chr.13) | X | |
| YWHAZ | Shear force (Chr.14) | X | |
| ZBTB21 | Shear force (Chr.1) | ||
| GO Term | Description | ID Gene Name | Enrichment in Dataset (%) | Enrichment in Genome Database (%) | p-value Adjusted |
|---|---|---|---|---|---|
| Inflammatory Response | |||||
| GO:0043312 | neutrophil degranulation | GDI2 ASAH1 PNP HSP90AA1 PGM1 PSMC2 PKM MPO PLAC8 HSPA1A PRDX6 PGAM1 CCT8 ALDOA HSPA1B ATP8B4 CLEC12A SERPINA3 HSPA6 GSTP1 HBB HSPA8 DNAJC3 ATP11ADGAT1 | 6.14 | 5.17 | 1.98 × 10⁻²² |
| GO:0042493 | response to drug | ADA CASP3 SOD1 NPPC PPARG LOX ENO3 VAV3 ABCG5 LGALS1 CENPF AQP1 ACTC1 PNP CTNNB1 KCNK3 SST FABP3 LDHALCK | 4.91 | 5.39 | 2.53 × 10⁻¹⁸ |
| GO:0055085 | transmembrane transport | SLC6A9 ABCA12 VDAC2 CACNA1C SLC25A12 ABCG5 ANKH ITPR1 VDAC1 PSMB2 SLC6A20 HCN1 KCND2 SLCO3A1 SLC39A11 TRPM3 PSMC2 SLC9A9 AQP1 SLC9A7SLC25A48 | 5.16 | 2.9 | 3.38 × 10⁻¹⁴ |
| GO:0098869 | cellular oxidant detoxification | PARK7 APOE ALB TXN PRDX3 PRDX6 GSTP1HBB | 1.97 | 50 | 3.99 × 10⁻¹⁴ |
| GO:0042542 | response to hydrogen peroxide | MB SIRT1 LDHA ADA PRDX3 PARK7 CAPN2 HBB CASP3 CRYAB HMOX1 SOD1 | 2.95 | 11.11 | 1.71 × 10⁻¹⁴ |
| GO:0045471 | response to ethanol | GSTP1 MSTN LEP RGS2 CASP8 CA3 NQO1 ACTC1 TUFM NPPCSOD1 | 2.7 | 9.32 | 1.38 × 10⁻¹² |
| GO:0071356 | cellular response to tumor necrosis factor | BAG4 SIRT1 GPD1 FABP4 CCL25 MYOD1 ZFP36L1 GBP1 GBP3ASAH1 | 2.46 | 9.01 | 2.31 × 10⁻¹¹ |
| > GO:0071346 | cellular response to interferon-gamma | GBP7 GBP3 CCL25 GBP6 GBP1 GBP5GAPDH | 1.72 | 12.5 | 5.78 x 10⁻⁹ |
| GO:0032355 | response to estradiol | LEP GSTP1 CTNNB1 CRYAB OXT PTGFR CASP3 NQO1 CASP8 GHR | 2.46 | 7.87 | 7.59 × 10⁻¹¹ |
| GO:0006811 | ion transport | VDAC2 KCND2 ATP2A2 CACNA1C KCNK3 SLCO3A1 HCN1 VDAC1 ITPR1 KCNJ3 CACNA2D1 SLC9A9 SLC9A7 TRPM3 ATP5PD SLC39A11 SCN2B CLCA3P KCNJ15 CHRNE | 4.91 | 1.87 | 2.33 × 10⁻¹⁰ |
| GO:0034620 | cellular response to unfolded protein | HSPA6 HSPA9 HSPA1A HSPA8 HSPA1B | 1.23 | 83.33 | 1.09 × 10⁻⁹ |
| > GO:0006986 | response to unfolded protein | HSPA9 HSPB1 HSPA1B HSPA8 DNAJC3 DNAJA1 DNAJB5 HSPA6 HSP90AA1 HSPH1 HSPB2 HSPA1A | 2.95 | 25 | 3.40 × 10⁻¹⁸ |
| GO:1900034 | regulation of cellular response to heat | BAG4 HSPA1B HSPA8 CRYAB SIRT1 HSPA1A HSPH1 HSP90AA1 | 1.97 | 10.26 | 1.44 × 10⁻⁹ |
| GO:0032869 | cellular response to insulin stimulus | GCLC PKM PPARG ZFP36L1 GOT1 YWHAG GSTP1 LEP | 1.97 | 10.13 | 1.54 × 10⁻⁹ |
| GO:0009409 | response to cold | CASP8 CXCL10 PPARG METRNL PLAC8 HSP90AA1 ACADVL | 1.72 | 14.89 | 2.03 × 10⁻⁹ |
| > GO:0034605 | cellular response to heat | HSP90AA1 HMOX1 HSPA8 CXCL10 HSPA1B HSPA6 HSPA9 HSPA1A ATP2A2 | 2.21 | 19.57 | 6.79 × 10⁻¹³ |
| GO:0001666 | response to hypoxia | CASP3 HMOX1 CRYAB PKM MB ADA NPPC LEP CAPN2 ITPR1 LDHA | 2.7 | 4.17 | 3.16 × 10⁻⁹ |
| GO:0006979 | response to oxidative stress | PRDX6 MPO SGK2 HMOX1 SIRT1 CA3 NQO1 APOE PRDX3 GCLC NDUFB4 SOD1 | 2.95 | 3.48 | 3.35 × 10⁻⁹ |
| GO:0006954 | inflammatory response | IDO1 NFATC3 CSRP3 CCR5 CCR3 CCL25 CXCL10 FOLR2 SERPINA3 PTGFR RPS6KA4 PARK7 GBP5 | 3.19 | 2.97 | 3.66 × 10⁻⁹ |
| Gluconeogenesis | |||||
| GO:0055114 | oxidation-reduction process | PTGR1 LDHB GAPDH NDUFV2 SOD1 TXN PRDX6 NDUFB4 HGD VAT1L LOX NDUFS3 NDUFV1 MDH1 MDH2 ME2 ALDH2 LDHA UQCRC1 MPO NQO1 ACADVL BCKDHB PDHB NDUFS1 DMGDH IDH3A NDUFA10 SOD2 WWOX UQCRH IDO1 PRDX3 HMOX1 ALDH1B1 SDHB GPD1 FASN | 9.34 | 8.48 | 2.82 × 10−41 |
| GO:0006094 | gluconeogenesis | ENO1 ENO3 PGAM2 SLC25A12 GOT1 TPI1 MDH1 PGAM1 PGM1 PGK1 SDS GPD1 GAPDH ALDOA MDH2 | 3.69 | 34.09 | 2.02 × 10⁻²⁴ |
| GO:0061621 | canonical glycolysis | PKM ENO1 PGAM1 TPI1 PGAM2 BPGM PGK1 PFKM ENO3 ALDOA GAPDH | 2.7 | 40.74 | 1.40 × 10⁻¹⁸ |
| GO:0046034 | ATP metabolic process | MYH4 MYH7 ATP5PD NDUFS1 MYH8 HSPA1B HSPA1A ATP5B ENPP3 MYH3 AK1 HSPA8 | 2.95 | 10.26 | 3.83 × 10⁻¹⁴ |
| > GO:0006096 | glycolytic process | PGM1 PRKAG3 GAPDH PGK1 ENO1 BPGM PGAM1 PFKM PKM PGAM2 ALDOA ENO3 TPI1 LDHA | 3.44 | 35.9 | 4.62 × 10⁻²³ |
| GO:0006099 | tricarboxylic acid cycle | IDH3A DLST ME2 PDHB IREB2 MDH2 MDH1 SDHB | 1.97 | 26.67 | 2.12 × 10⁻¹² |
| Protein Stabilization | |||||
| GO:0050821 | protein stabilization | HSPA1A GAPDH PFN1 PARK7 SAXO1 PHB HSP90AA1 HSPA1B CRYAB CCT8 PPIB FLNA | 2.95 | 7.89 | 6.22 × 10⁻¹³ |
| GO:0045944 | positive regulation of transcription from RNA polymerase II promoter | NFATC3 EBF1 PARK7 RPS6KA4 MYOD1 CSRP3 SMAD1 PLAC8 SOX5 SIRT1 MYT1 TBX15 WWOX PAX7 NLRC5 CTNNB1 CDH13 CXCL10 PFKM PPARG SIM1 | 5.16 | 2.22 | 3.70 × 10⁻¹² |
| > GO:0000122 | negative regulation of transcription from RNA polymerase II promoter | PPARG WWOX DNAJB5 TBX15 LEP PHB CUX2 CXXC5 AURKB TENM2 STRAP EHMT1 SIRT1 CTNNB1 COPS2 TXN RORC ENO1 | 4.42 | 2.65 | 1.15 × 10⁻¹¹ |
| GO:1904706 | negative regulation of vascular smooth muscle cell proliferation | HMOX1 GSTP1 PPARG TPM1 SOD2 | 1.23 | 55.56 | 4.17 × 10⁻⁹ |
| GO:0008285 | negative regulation of cell proliferation | SPRY1 CTNNB1 CGREF1 CDH13 NPPC PPARG FABP3 SOD2 SST HMOX1 HSPA1A PTPRK PHB HSPA1B CLDN19 | 3.69 | 2.29 | 4.81 × 10⁻⁹ |
| GO:0030308 | negative regulation of cell growth | NDUFS3 ENO1 CRYAB HSPA1B PHB HSPA1A SIRT1 MYL2 PPARG APBB2 | 2.46 | 6.25 | 5.75 × 10⁻¹⁰ |
| GO:0046716 | muscle cell cellular homeostasis | PFKM CFL2 ALDOA MSTN SOD1 LOX | 1.47 | 31.58 | 9.74 × 10⁻¹⁰ |
| Chaperone-Mediated Protein Complex Assembly | |||||
| GO:0051085 | chaperone mediated protein folding requiring cofactor | HSPA1B HSPA9 HSPA8 HSPH1 HSPA1A DNAJB5 HSPA6 | 1.72 | 53.85 | 1.52 × 10⁻¹² |
| GO:0042026 | protein refolding | PPIB HSPA8 HSPA6 HSPA1A HSPA1B HSPA9 HSP90AA1 | 1.72 | 33.33 | 1.94 × 10⁻¹¹ |
| Carbohydrate Metabolism | |||||
| GO:0005975 | carbohydrate metabolic process | PYGM ALDH2 PGM1 LCT PDK4 GPD1 MDH1 LDHB LDHA ALDH1B1 BPGM POFUT2 PDHB MDH2 IDH3A | 3.69 | 3.25 | 5.93 × 10⁻¹¹ |
| Aging | |||||
| GO:0045214 | sarcomere organization | TPM1 FHOD3 WDR1 TNNT1 MYH3 TNNT3 CFL2 KLHL41 CSRP3 | 2.21 | 23.68 | 1.59 × 10⁻¹³ |
| > GO:0007517 | muscle organ development | MYOD1 CSRP3 PAX7 CRYAB MYH3 FHL3 CENPF CXCL10 MSTN SIRT1 | 2.46 | 9.62 | 1.31 × 10⁻¹¹ |
| GO:0007568 | aging | PBEF1 GCLC ENO3 AURKB SOD1 CNP CRYAB CTNNA1 ADA MPO NQO1 | 2.7 | 4.45 | 1.67 × 10⁻⁹ |
| Muscle Contraction and Development | |||||
| GO:0006936 | muscle contraction | CHRNE CRYAB DES MYH8 MYH1 TNNT3 MYL6B MYH7 MYH4 TNNI2 ACTA1 MYLPF TNNT1 MYL1 MYH2 TPM1 TPM3 CKMT2 | 4.42 | 8.45 | 1.09 × 10⁻¹⁹ |
| > GO:0003009 | skeletal muscle contraction | MYH3 TNNT1 TNNI2 MYH8 ATP2A2 MYH7 TNNT3 | 1.72 | 25.93 | 8.00 × 10⁻¹¹ |
| > GO:0030049 | muscle filament sliding | DES MYL3 TPM1 TNNT1 MYL1 MYH3 TNNT3 MYL2 ACTN3 MYH8 MYH4 MYH2 TPM3 ACTC1 MYH7 ACTA1 TNNI2 MYL6B | 4.42 | 47.37 | 2.23 × 10⁻³¹ |
| > GO:0060048 | cardiac muscle contraction | CSRP3 TPM1 TNNT3 MYL1 TNNT1 MYH7 TNNI2 MYL2 MYL3 SCN2B ACTC1 | 2.7 | 24.44 | 2.28 × 10⁻¹⁶ |
| GO:0007275 | multicellular organism development | NFATC3 TAPT1 SEMA3E COL13A1 RECQL4 SIM1 SIRT1 TNP1 EBF1 SPRY1 PRRX2 PPARG MYOD1 CSRP3 LRP4 CENPF PAX7 ZFP36L1 MYT1 RORC CYLC1 EPHA7 TPI1 | 5.65 | 3.36 | 8.30 × 10⁻¹⁷ |
| > GO:0007507 | heart development | FGF12 PPARG CASP3 RBM20 CACNA1C CTNNB1 OXT LOX ZFP36L1 MB MYL2 CSRP3 | 2.95 | 6.86 | 2.74 × 10⁻¹² |
| Cell Adhesion | |||||
| GO:0007155 | cell adhesion | TROAP NID1 CTNNA3 TENM2 LYVE1 NTM CCR3 LAMA3 ADA CTNNA1 CDH13 MYBPH ATP2A2 CGREF1 COL13A1 PCDH7 LAMC1 MPDZ PTPRK DDR2 DSCAML1 LGALS3BP CTNNB1 | 5.65 | 2.74 | 5.07 × 10⁻¹⁵ |
| Protein Folding | |||||
| GO:0006457 | protein folding | HSPA9 DNAJA1 CRYAB NPPC CCT8 PPIB HSP90AA1 DNAJB11 DNAJB5 BAG4 HSPA8 | 2.7 | 4.85 | 7.57 × 10⁻¹⁰ |
| Apoptotic Process | |||||
| GO:0006915 | apoptotic process | SHC4 TMEM14A ZFP36L1 PRDX3 AVEN BCL2L14 GAPDH NSG1 EPHA7 LGALS1 CASP3 CASP8 HMOX1 SIRT1 ITPR1 HINT1 VDAC1 WWOX | 4.42 | 3.01 | 1.67 × 10⁻¹² |
| > GO:0043066 | negative regulation of apoptotic process | CTNNB1 DNAJC3 HSPB1 NQO1 AQP1 TMEM14A ACTC1 HSPA9 HSPA1B MPO GSTP1 AVEN GCLC SOD1 PARK7 CRYAB ADA IGF1R CASP3 BAG4 PLAC8 SIRT1 DNAJA1 PTGFR PKHD1 HSPA1A CTNNA1 ALB FLNA PRDX3 PAX7 LEP APBB2 | 8.11 | 4.02 | 3.58 × 10⁻²⁶ |
| GO Term | Description | ID Gene Name | Enrichment in Dataset (%) | Enrichment in Genome Database (%) | p-Value Adjusted |
|---|---|---|---|---|---|
| Cell Adhesion | |||||
| GO:0007155 | cell adhesion | PCDH7 LGALS3BP ATP2A2 CDH13 | 30.77 | 0.48 | 4.00 × 10⁻⁵ |
| > GO:0007156 | homophilic cell adhesion via plasma membrane adhesion molecules | CDH13 PCDH7 | 15.38 | 1.28 | 1.17 × 10⁻³ |
| Apoptotic Process | |||||
| GO:0006874 | cellular calcium ion homeostasis | APOE ATP2A2 | 15.38 | 0.55 | 1.98 × 10⁻³ |
| > GO:0045454 | cell redox homeostasis | PRDX6 MPO | 15.38 | 2.78 | 3.38 × 10⁻⁴ |
| GO:0006915 | apoptotic process | EPHA7 GAPDH | 15.38 | 0.33 | 3.04 × 10⁻³ |
| Endocytosis | |||||
| GO:0002576 | platelet degranulation | PCDH7 LGALS3BP | 15.38 | 1.63 | 7.81 × 10⁻⁴ |
| > GO:0043312 | neutrophil degranulation | MPO PRDX6 | 15.38 | 0.41 | 2.54 × 10⁻³ |
| GO:0034599 | cellular response to oxidative stress | ATP2A2 PRDX6 | 15.38 | 1.03 | 1.32 × 10⁻³ |
| GO:0006898 | receptor-mediated endocytosis | APOE CUBN | 15.38 | 0.86 | 1.44 × 10⁻³ |
| GO:0006897 | endocytosis | LGALS3BP CUBN | 15.38 | 0.49 | 2.19 × 10⁻³ |
| Response to Oxidative Stress | |||||
| GO:0098869 | cellular oxidant detoxification | PRDX6 APOE | 15.38 | 12.5 | 3.70 × 10⁻⁵ |
| GO:0006979 | response to oxidative stress | APOE MPO PRDX6 | 23.08 | 0.87 | 9.90 × 10⁻⁵ |
| GO:0050832 | defense response to fungus | MPO GAPDH | 15.38 | 4.44 | 1.54 × 10⁻⁴ |
| GO:0055114 | oxidation-reduction process | MPO GAPDH PRDX6 | 23.08 | 0.67 | 1.78 × 10⁻⁴ |
| Hydrogen Peroxide Metabolism | |||||
| GO:0042744 | hydrogen peroxide catabolic process | PRDX6 MPO | 15.38 | 10.53 | 4.40 × 10⁻⁵ |
| Lipid Metabolism | |||||
| GO:0034384 | high-density lipoprotein particle clearance | CUBN APOE | 15.38 | 22.22 | 2.20 × 10⁻⁵ |
| > GO:0034374 | low-density lipoprotein particle remodeling | APOE MPO | 15.38 | 15.38 | 3.00 x 10⁻⁵ |
| GO:0008203 | cholesterol metabolic process | CUBN APOE | 15.38 | 1.82 | 6.70 × 10⁻⁴ |
| GO:0006629 | lipid metabolic process | APOE CUBN PRDX6 | 23.08 | 0.27 | 1.32 × 10⁻³ |
| GO:0008202 | steroid metabolic process | CUBN APOE | 15.38 | 0.8 | 1.44 × 10⁻³ |
| GO:0032496 | response to lipopolysaccharide | MPO ATP2A2 | 15.38 | 0.72 | 1.56 × 10⁻³ |
| GO Term | Function | ID Gene Name | Enrichment in Dataset (%) | Enrichment in Genome Database (%) | p-Value Adjusted |
|---|---|---|---|---|---|
| Muscle Contraction, Structure and Development | |||||
| GO:0030049 | muscle filament sliding | DES ACTC1 ACTA1 MYH7 TPM3 TPM1 MYH3 MYH2 | 18.18 | 21.05 | 1.80 × 10⁻¹⁸ |
| GO:0006936 | muscle contraction | MYH2 TPM3 ACTA1 DES TPM1 MYH7 | 13.64 | 2.82 | 2.32 × 10⁻⁹ |
| GO:0050821 | protein stabilization | HSPA1B CCT8 FLNA HSPA1A HSP90AA1 | 11.36 | 3.29 | 3.27 × 10⁻⁸ |
| GO:0090063 | positive regulation of microtubule nucleation | HSPA1A HSPA1B | 4.55 | 50 | 1.40 × 10⁻⁵ |
| GO:0030240 | skeletal muscle thin filament assembly | ACTC1 ACTA1 | 4.55 | 40 | 1.82 × 10⁻⁵ |
| GO:0030198 | extracellular matrix organization | LAMC1 COL13A1 LOX NID1 | 9.09 | 1.34 | 1.97 × 10⁻⁵ |
| GO:0007507 | heart development | LOX PPARG FGF12 | 6.82 | 1.71 | 1.43 × 10⁻⁴ |
| GO:0007015 | actin filament organization | TPM3 TPM1 ACTC1 | 6.82 | 1.54 | 1.87 × 10⁻⁴ |
| GO:0003009 | skeletal muscle contraction | MYH7 MYH3 | 4.55 | 7.41 | 2.22 × 10⁻⁴ |
| GO:0045214 | sarcomere organization | MYH3 TPM1 | 4.55 | 5.26 | 3.97 × 10⁻⁴ |
| GO:0021762 | substantia nigra development | LDHA ACTB | 4.55 | 4.76 | 4.57 × 10⁻⁴ |
| GO:0055010 | ventricular cardiac muscle tissue morphogenesis | MYH7 TPM1 | 4.55 | 4.26 | 5.43 × 10⁻⁴ |
| Muscle Energy Metabolism | |||||
| GO:0006096 | glycolytic process | PGAM2 LDHA PGK1 BPGM ENO3 | 11.36 | 12.82 | 8.64 × 10⁻¹¹ |
| GO:0061621 | canonical glycolysis | PGAM2 BPGM PGK1 ENO3 | 9.09 | 14.81 | 6.04 × 10⁻⁹ |
| GO:0046034 | ATP metabolic process | HSPA1A MYH3 HSPA1B MYH7 ATP5B | 11.36 | 4.27 | 1.02 × 10⁻⁸ |
| GO:0055114 | oxidation-reduction process | LDHA LDHB FASN SDHB LOX PRDX3 | 13.64 | 1.34 | 1.25 × 10⁻⁷ |
| GO:0006094 | gluconeogenesis | PGK1 ENO3 PGAM2 | 6.82 | 6.82 | 4.83 × 10⁻⁶ |
| GO:0060048 | cardiac muscle contraction | MYH7 TPM1 ACTC1 | 6.82 | 6.67 | 5.06 × 10⁻⁶ |
| Apoptosis, Death Cell and Proteolysis | |||||
| GO:0043066 | negative regulation of apoptotic process | HSPA1A FLNA ALB IGF1R PRDX3 HSPA1B ACTC1 | 15.91 | 0.85 | 1.38 × 10⁻⁷ |
| GO:1903265 | positive regulation of tumor necrosis factor-mediated signaling pathway | HSPA1A HSPA1B | 4.55 | 33.33 | 2.19 × 10⁻⁵ |
| GO:0038096 | Fc-gamma receptor signaling pathway involved in phagocytosis | ACTB MYH2 HSP90AA1 | 6.82 | 2.27 | 7.01 × 10⁻⁵ |
| GO:1900740 | positive regulation of protein insertion into mitochondrial membrane involved in apoptotic signaling pathway | CASP8 YWHAG | 4.55 | 6.67 | 2.67 × 10⁻⁴ |
| GO:0006898 | receptor-mediated endocytosis | ALB HSP90AA1 HBB | 6.82 | 1.29 | 2.99 × 10⁻⁴ |
| GO:2001240 | negative regulation of extrinsic apoptotic signaling pathway in absence of ligand | HSPA1B HSPA1A | 4.55 | 5.71 | 3.46 × 10⁻⁴ |
| GO:0032757 | positive regulation of interleukin-8 production | HSPA1A HSPA1B | 4.55 | 4.44 | 5.11 × 10⁻⁴ |
| Oxidative Stress and HSP Proteins | |||||
| GO:0098869 | cellular oxidant detoxification | PRDX3 ALB HBB | 6.82 | 18.75 | 4.68 × 10⁻⁷ |
| GO:0042542 | response to hydrogen peroxide | LDHA HBB CAPN2 PRDX3 | 9.09 | 3.7 | 7.05 × 10⁻⁷ |
| GO:0090084 | negative regulation of inclusion body assembly | HSPA1A HSPA1B | 4.55 | 18.18 | 5.46 × 10⁻⁵ |
| GO:0042744 | hydrogen peroxide catabolic process | PRDX3 HBB | 4.55 | 10.53 | 1.25 × 10⁻⁴ |
| GO:0034599 | cellular response to oxidative stress | HSPA1B HSPA1A PRDX3 | 6.82 | 1.55 | 1.86 × 10⁻⁴ |
| GO:0045429 | positive regulation of nitric oxide biosynthetic process | HBB HSP90AA1 | 4.55 | 4.88 | 4.40 × 10⁻⁴ |
| Metabolism, Transport and Cell Signaling | |||||
| GO:0042493 | response to drug | PPARG CENPF LDHA LOX ACTC1 ENO3 | 13.64 | 1.62 | 4.29 × 10⁻⁸ |
| GO:0042026 | protein refolding | HSPA1A HSP90AA1 HSPA1B | 6.82 | 14.29 | 8.17 × 10⁻⁷ |
| GO:0045471 | response to ethanol | RGS2 ACTC1 CASP8 TUFM | 9.09 | 3.39 | 8.78 × 10⁻⁷ |
| GO:0034605 | cellular response to heat | HSPA1A HSPA1B HSP90AA1 | 6.82 | 6.52 | 5.30 × 10⁻⁶ |
| GO:0009409 | response to cold | HSP90AA1 PPARG CASP8 | 6.82 | 6.38 | 5.55 × 10⁻⁶ |
| GO:0006986 | response to unfolded protein | HSPA1B HSP90AA1 HSPA1A | 6.82 | 6.25 | 5.80 × 10⁻⁶ |
| GO:0070370 | cellular heat acclimation | HSPA1B HSPA1A | 4.55 | 66.67 | 9.89 × 10⁻⁶ |
| GO:0070434 | positive regulation of nucleotide-binding oligomerization domain containing 2 signaling pathway | HSPA1B HSPA1A | 4.55 | 66.67 | 9.89 × 10⁻⁶ |
| GO:0090131 | mesenchyme migration | ACTC1 ACTA1 | 4.55 | 40 | 1.82 × 10⁻⁵ |
| GO:1900034 | regulation of cellular response to heat | HSPA1A HSPA1B HSP90AA1 | 6.82 | 3.85 | 1.88 × 10⁻⁵ |
| GO:0034620 | cellular response to unfolded protein | HSPA1A HSPA1B | 4.55 | 33.33 | 2.19 × 10⁻⁵ |
| GO:0010389 | regulation of G2/M transition of mitotic cell cycle | YWHAG CENPF HSP90AA1 | 6.82 | 2.56 | 5.37 × 10⁻⁵ |
| GO:0051085 | chaperone cofactor-dependent protein refolding | HSPA1A HSPA1B | 4.55 | 15.38 | 7.01 × 10⁻⁵ |
| GO:0051092 | positive regulation of NF-kappaB transcription factor activity | PRDX3 HSPA1B HSPA1A | 6.82 | 2.24 | 7.18 × 10⁻⁵ |
| GO:1901673 | regulation of mitotic spindle assembly | HSPA1A HSPA1B | 4.55 | 13.33 | 8.55 × 10⁻⁵ |
| GO:0051131 | chaperone-mediated protein complex assembly | HSPA1A HSP90AA1 | 4.55 | 12.5 | 9.52 × 10⁻⁵ |
| GO:0030308 | negative regulation of cell growth | HSPA1A HSPA1B PPARG | 6.82 | 1.88 | 1.14 × 10⁻⁴ |
| GO:0046718 | viral entry into host cell | HSPA1A HSPA1B | 4.55 | 9.09 | 1.61 × 10⁻⁴ |
| GO:0031396 | regulation of protein ubiquitination | HSPA1A HSPA1B HSP90AA1 | 6.82 | 1.14 | 4.03 × 10⁻⁴ |
| GO:0001895 | retina homeostasis | ACTB ALB | 4.55 | 5 | 4.23 × 10⁻⁴ |
| GO:0046677 | response to antibiotic | CASP8 HSP90AA1 | 4.55 | 4.08 | 5.85 × 10⁻⁴ |
| Immune System and Blood Coagulation | |||||
| GO:0070527 | platelet aggregation | HBB FLNA ACTB | 6.82 | 7.14 | 4.46 × 10⁻⁶ |
| GO:0043312 | neutrophil degranulation | HBB HSPA1B HSP90AA1 CCT8 HSPA1A | 11.36 | 1.03 | 4.83 × 10⁻⁶ |
| GO:1904706 | negative regulation of vascular smooth muscle cell proliferation | PPARG TPM1 | 4.55 | 22.22 | 4.11 × 10⁻⁵ |
| GO:0030224 | monocyte differentiation | FASN PPARG | 4.55 | 11.76 | 1.05 × 10⁻⁴ |
| GO:0045648 | positive regulation of erythrocyte differentiation | HSPA1B HSPA1A | 4.55 | 8.7 | 1.72 × 10⁻⁴ |
| ID Gene Name | QTL | Overlapping (Picard & Gagaoua 2019) | Promising Candidates |
|---|---|---|---|
| 31 plasma candidate biomarkers identify through this study | |||
| ATP2A2 | Shear force (Ch. 17) | X | |
| GAPDH | X | X | |
| ACTA1 | X | X | |
| ACTC1 | Tenderness score (Chr.10) | X | |
| ALB | X | X | |
| ENO3 | X | X | |
| HBB | Shear force (Ch.15) | X | |
| HSP90AA1 | Shear force (Chr.21) | X | |
| LAMC1 | Shear force (Chr.22) | X | |
| LDHA | Shear force (Ch.29) | X | |
| LDHB | Shear force (Ch.5) | X | |
| MYH7 | X | X | |
| PPARG | Shear force (Chr.22) | X | |
| PVALB | Shear force (Chr.5) | X | |
| TPM1 | Tenderness score (Chr.10) | X | |
| CASP8AP2 | Tenderness score (Chr.9) | X | |
| ACTN1 | Tenderness score (Chr.10) | X | |
| CAT | Shear force (Chr.15) | X | |
| CCNB2 | Tenderness score (Chr.10) | X | |
| CFL1 | Tenderness score and Shear force (Chr.29) | X | |
| GSS | Shear force (Chr.13) | X | |
| MAPK1 | Shear force (Chr.17) | X | |
| NEFL | Shear force (Chr.8) | X | |
| PRKACB | Shear force (Chr.3) | X | |
| PSMA7 | Shear force (Chr.13) | X | |
| USP8 | Tenderness score (Chr.10) | X | |
| YWHAB | Shear force (Chr.13) | X | |
| YWHAZ | Shear force (Chr.14) | X | |
| ZBTB21 | Shear force (Chr.1) | X | |
| 4 putative plasma candidates identify from Picard and Gagaoua, 2020 | |||
| COL4A1 | X | X | |
| HSPA5 | X | X | |
| ORM1 | X | X | |
| PDIA3 | X | X | |
© 2020 by the authors. Licensee MDPI, Basel, Switzerland. This article is an open access article distributed under the terms and conditions of the Creative Commons Attribution (CC BY) license (http://creativecommons.org/licenses/by/4.0/).
Share and Cite
Boudon, S.; Henry-Berger, J.; Cassar-Malek, I. Aggregation of Omic Data and Secretome Prediction Enable the Discovery of Candidate Plasma Biomarkers for Beef Tenderness. Int. J. Mol. Sci. 2020, 21, 664. https://0-doi-org.brum.beds.ac.uk/10.3390/ijms21020664
Boudon S, Henry-Berger J, Cassar-Malek I. Aggregation of Omic Data and Secretome Prediction Enable the Discovery of Candidate Plasma Biomarkers for Beef Tenderness. International Journal of Molecular Sciences. 2020; 21(2):664. https://0-doi-org.brum.beds.ac.uk/10.3390/ijms21020664
Chicago/Turabian StyleBoudon, Sabrina, Joelle Henry-Berger, and Isabelle Cassar-Malek. 2020. "Aggregation of Omic Data and Secretome Prediction Enable the Discovery of Candidate Plasma Biomarkers for Beef Tenderness" International Journal of Molecular Sciences 21, no. 2: 664. https://0-doi-org.brum.beds.ac.uk/10.3390/ijms21020664