Article

DNA Methylation Is Correlated with Gene Expression during Diapause Termination of Early Embryonic Development in the Silkworm (Bombyx mori)

1
School of Life Sciences, Anhui Agricultural University, Hefei 230036, Anhui, China
2
Institute of Sericulture, Anhui Academy of Agricultural Sciences, Hefei 230061, Anhui, China
3
Anhui International Joint Research and Developmental Center of Sericulture Resources Utilization, Hefei 230036, Anhui, China
*
Authors to whom correspondence should be addressed.
These authors contributed equally to this work.
Int. J. Mol. Sci. 2020, 21(2), 671; https://0-doi-org.brum.beds.ac.uk/10.3390/ijms21020671
Submission received: 2 November 2019 / Revised: 16 January 2020 / Accepted: 16 January 2020 / Published: 20 January 2020

Abstract

:
DNA modification is a naturally occurring DNA modification in prokaryotic and eukaryotic organisms and is involved in several biological processes. Although genome-wide methylation has been studied in many insects, the understanding of global and genomic DNA methylation during insect early embryonic development, is lacking especially for insect diapause. In this study, we analyzed the relationship between DNA methylomes and transcriptomes in diapause-destined eggs compared to diapause-terminated eggs in the silkworm, Bombyx mori (B. mori). The results revealed that methylation was sparse in this species, as previously reported. Moreover, methylation levels in diapause-terminated eggs (HCl-treated) were 0.05% higher than in non-treated eggs, mainly due to the contribution of CG methylation sites. Methylation tends to occur in the coding sequences and promoter regions, especially at transcription initiation sites and short interspersed elements. Additionally, 364 methylome- and transcriptome-associated genes were identified, which showed significant differences in methylation and expression levels in diapause-destined eggs when compared with diapause-terminated eggs, and 74% of methylome and transcriptome associated genes showed both hypermethylation and elevated expression. Most importantly, Kyoto Encyclopaedia of Genes and Genomes (KEGG) analyses showed that methylation may be positively associated with Bombyx mori embryonic development, by regulating cell differentiation, metabolism, apoptosis pathways and phosphorylation. Through analyzing the G2/M phase-specific E3 ubiquitin-protein ligase (G2E3), we speculate that methylation may affect embryo diapause by regulating the cell cycle in Bombyx mori. These findings will help unravel potential linkages between DNA methylation and gene expression during early insect embryonic development and insect diapause.

1. Introduction

DNA methylation is an important epigenetic modification in plants and animals [1,2,3,4]. It has been shown to play key roles in a broad range of biological processes, including embryonic development [5], histone modification [6], X chromosome inactivation [7] and brain development [8]. In mammals, a primary function of DNA methylation is to suppress gene expression through increased promoter DNA methylation [9]. The roles of methylation include regulation of transcriptional activities [1], alternative exon splicing [10] and developmental activities [11]. DNA methylation in animals is accomplished by two types of DNA methyltransferases (DNMTs), de novo and maintenance DNMTs [12]. De novo DNMTs are responsible for establishing new methylation patterns by the Dnmt3 family of proteins, and maintenance DNMTs maintain previously established methylation patterns and are represented by the Dnmt1 family of proteins [13]. In contrast to these DNMTs, Dnmt2 shows a weak methyltransferase activity towards DNA and has been characterized as an active RNA methyltransferase [12,14]. Although Drosophila melanogaster possesses only a single DNMT (Dnmt2), the DNA methylation rate in the genome is at a low detectable level [15].
In insects, DNA methylation is found at appreciable levels in the genomes of many, but not all, insects [16] and is primarily targeted to genes that are broadly expressed in the genome [17]. The presence of a functional DNA methylation system across the insect class with conserved patterns of methylation [18,19,20], suggests an important role for this epigenetic marker in insect biology. The importance of DNA methylation in insect development has been strikingly demonstrated in Apis mellifera, which is capable of influencing developmental plasticity [21,22,23]. Chen et al. provided evidence for a functional DNA methylation system in Plutellaxylostella and its possible role in adaptation during host transfer [24]. However, fundamental questions remain on the patterning of DNA methylation during insect development; in particular, how DNA methylation affects the functional mechanism of early insect embryonic development and insect diapause.
Advances in whole-genome sequencing, coupled with bisulfite DNA treatment (WGBS) have led to single-nucleotide resolution methylation maps in a wide range of invertebrates [10,25,26]. Most recently, Jones et al. used WGBS and behavioural assays in a detailed analysis of the Helicoverpaarmigera methylome to investigate potential methylation differences in a subset of genes, demonstrating distinct flight performances in insects [27]. Similarly, Guan et al. examined the effects of Cd exposure on global DNA methylation using WGBS in Drosophila melanogaster [15]. In the silkworm, WGBS was used to investigate the silkworm mid-gut, identifying 0.11% methylcytosine levels across genomic cytosines [28]. Recently, Wu et al. used WGBS to demonstrate that epigenetic regulation may play roles in host–virus interactions in the silkworm [29]. As a robust and effective technique, WGBS is becoming more and more popular for insect DNA methylation research, including in the silkworm.
The silkworm is an economically important model insect of the lepidopteran order. Previous silkworm studies have shown that ~0.11% of their DNA is methylated [28], with only Bombyx moriDnmt1 (BmDnmt1) and Bombyx moriDnmt2 (BmDnmt2) proteins being reported [28,30], and BmDnmt1 retains the function as maintenance DNMT, but its sensitivity to metal ions is different from mammalian Dnmt1 [31]. Silkworm, like Polistes canadensis [32], has lost orthologs of Dnmt3 [28], and BmDnmt1 preferentially methylates hemimethylated DNA [31]. Kay et al. suggests that Dnmt1 functions primarily as a maintenance DNMT in B. mori, despite a putative secondary role in de novo methylation [33]. By contrast, Dnmt2 has been characterized as an active RNA methyltransferase [14], and the function of BmDnmt2 is unclear. Silkworms can revert to a diapause state, which arrests development in early embryonic development stages. The state is used to survive unfavourable environments such as low temperatures, drought and/or food shortages [34,35]. Diapause occurs at specific embryonic stages, i.e., after formation of cephalic lobes and telson and sequential mesoderm segmentation [36,37]. Diapause-destined eggs completely enter diapause three days after oviposition when non-HCl treated. If diapause-destined eggs are treated with 1.075 g/L HCl 24 h after oviposition, the eggs will terminate diapause 48 h after HCl treatment [34]. The development of diapause-destined embryos is arrested during the G2 cell cycle stage, immediately after mesoderm formation [38]. During sericulture, hydrochloric acid (HCl) is often used to treat silkworm eggs to disrupt diapause [39]. Once diapause terminates, the embryos resume development at 25 °C, they enter M phase, and cell division resumes [38]. The silkworm is an ideal model for studying relationships between DNA methylation, embryonic development and insect diapause.
Currently, functional analyses of DNA methylation during insect embryogenesis, especially insect diapause, are limited. Our previous study provided functional insights into BmDnmt1 and BmDnmt2 in the regulation of silkworm embryonic development; we showed that the expression of BmDnmt1 and BmDnmt2 was elevated in diapause-terminated eggs that were HCl-treated when compared with diapause-destined eggs [40].
In this study, we investigate DNA methylation patterns using WGBS and RNA sequencing (RNA-seq) technologies in diapause-terminated eggs compared with diapause-destined eggs in B. mori. We explore different methylation patterns and methylation modification genes and pathways associated with embryonic development. Based on our findings, DNA methylation appears to be essential during B. mori diapause and embryogenesis.

2. Results

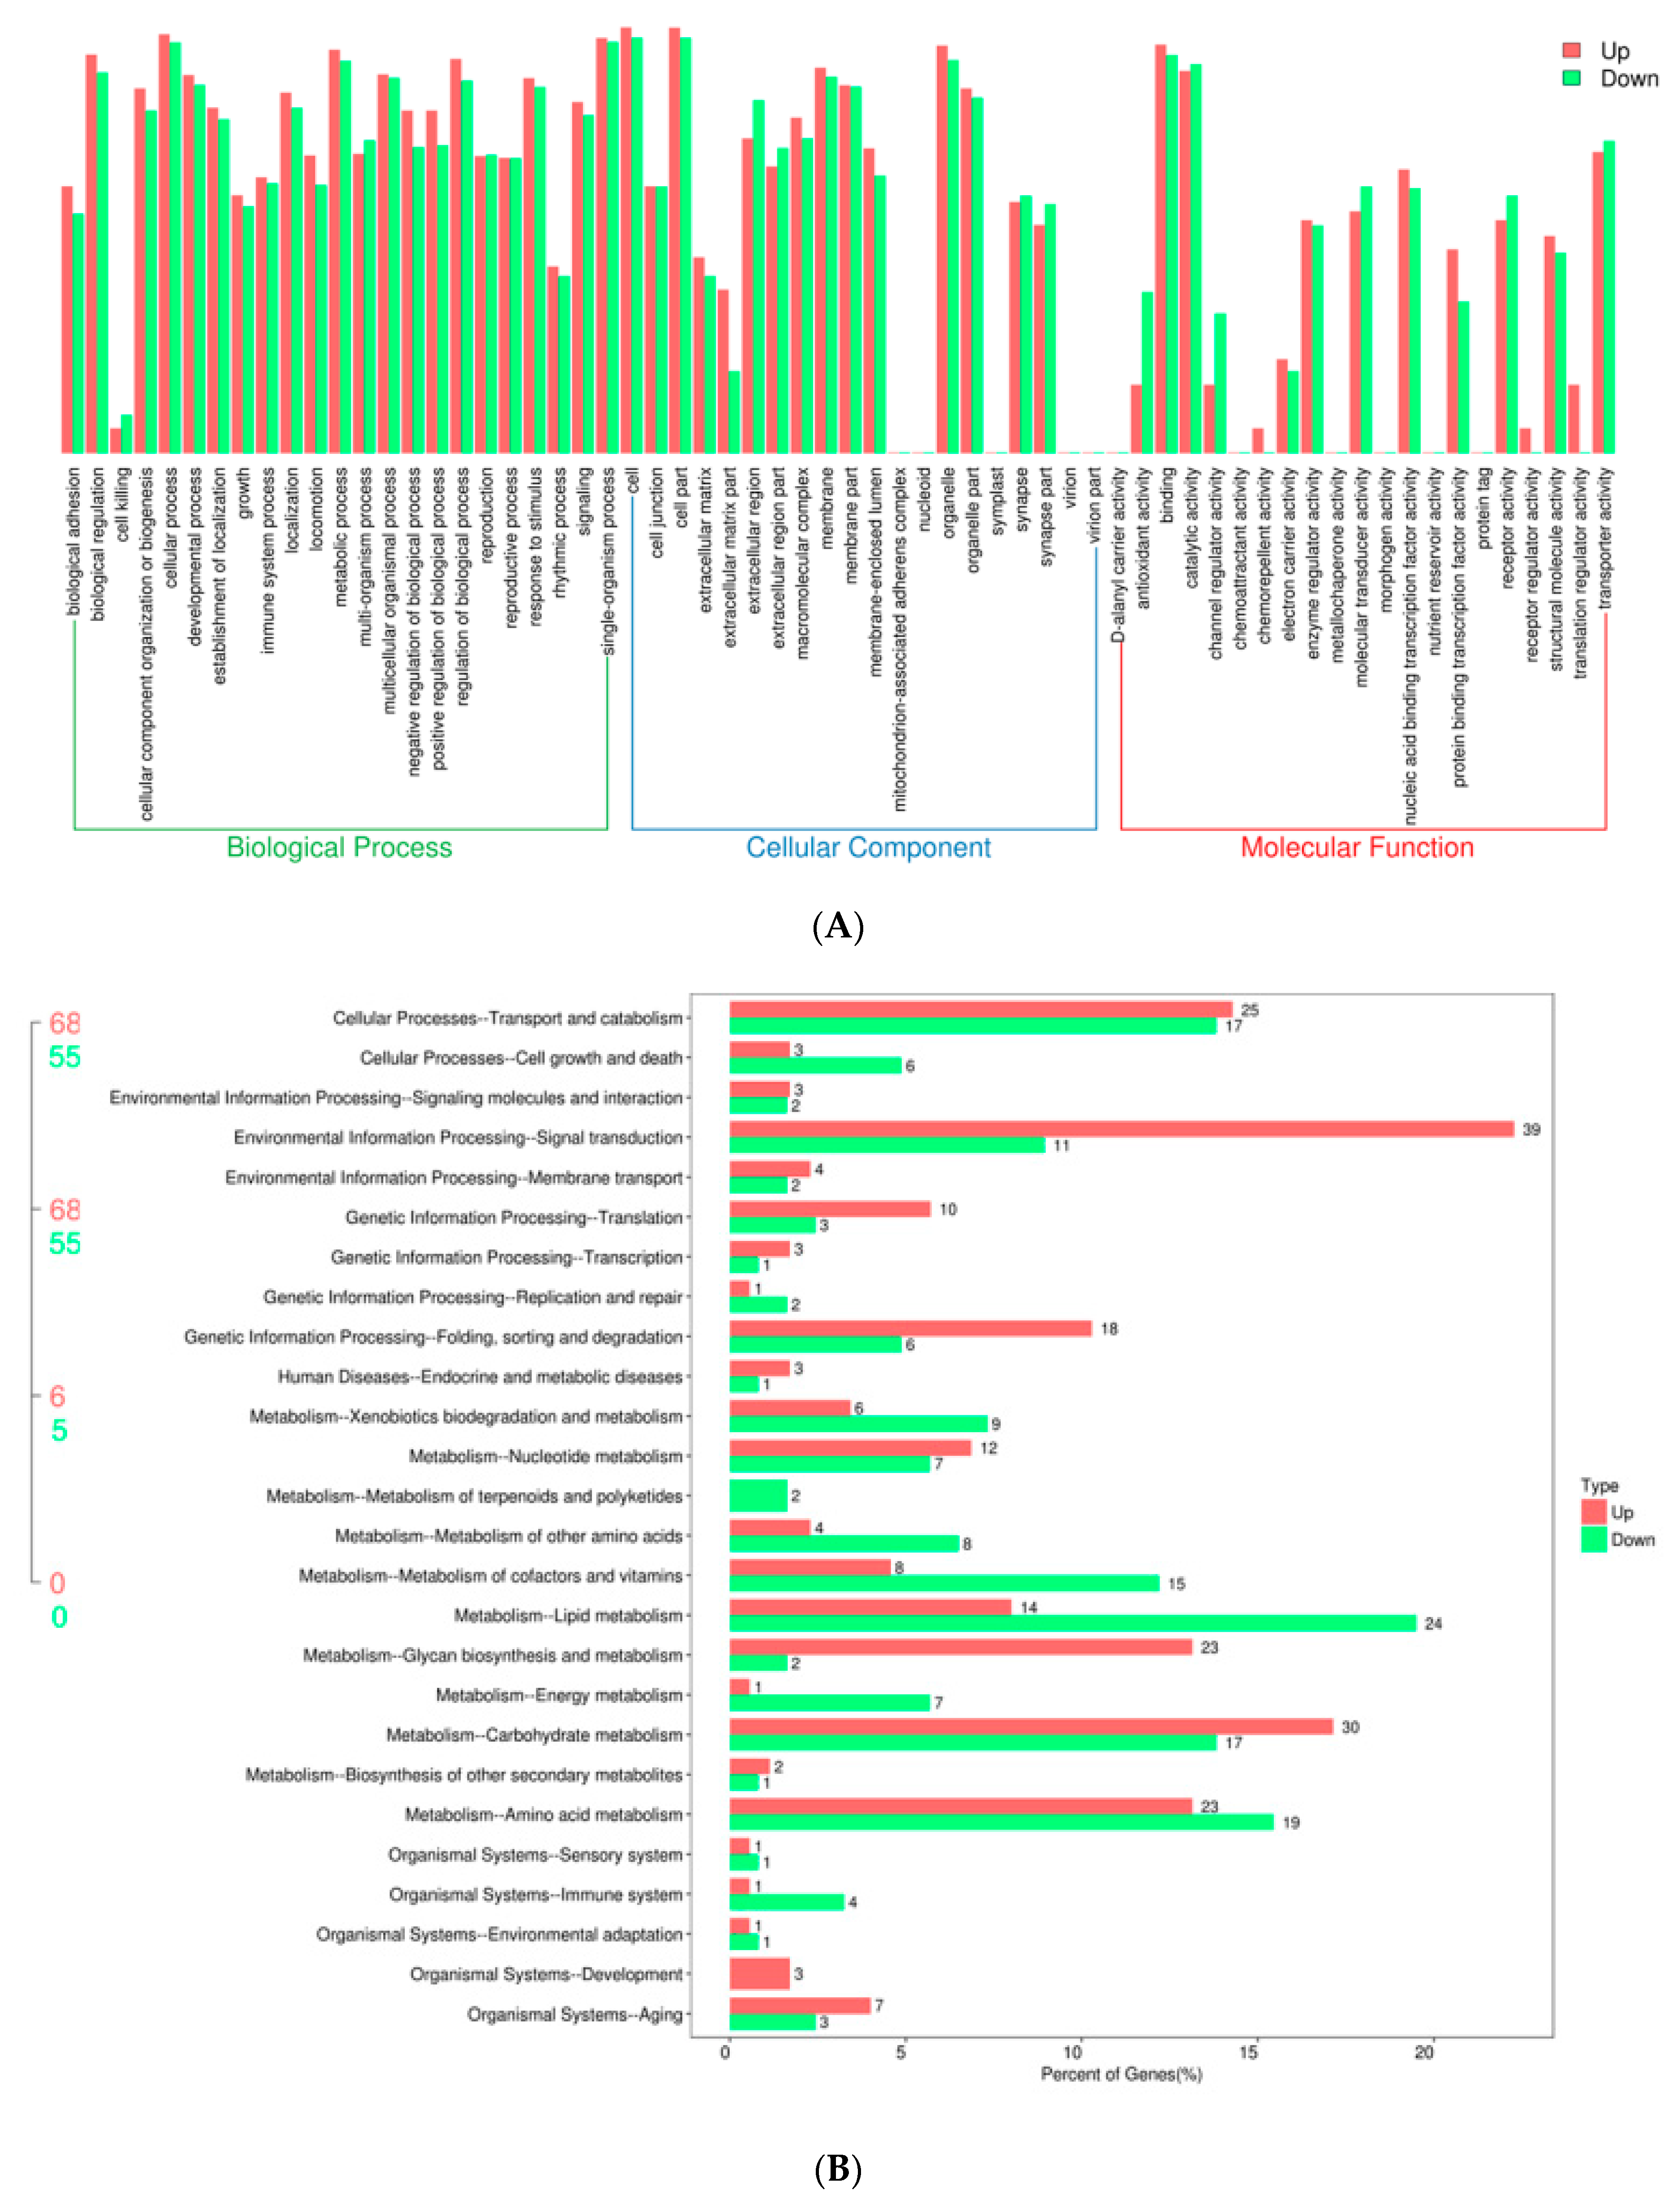
2.1. Transcriptional Profiles of Silkworm Diapause-Destined Eggs and Diapause-Terminated Eggs

To explore gene expression mechanisms during early embryonic development in the silkworm, we compared the transcriptional profiles of diapause-terminated eggs treated with HCl (HCl-treated) and diapause-destined eggs (non-HCl-treated) using RNA-seq, and the raw sequencing data are available from the repository of NCBI Sequence Read Archive (SRA) with the accession No. PRJNA598980. More than 48 million clean reads were obtained from each sample. The CG content of each of the six libraries was approximately 44%, and CycleQ30 was >94% for each library. The proportion of total reads that mapped to the reference genome reached approximately 95% coverage. In addition, 1732 differentially expressed genes (DEGs) were identified, with 856 genes upregulated and 876 genes downregulated (Table 1). The details of DEGs are shown in supplementary Table S2. Gene Ontology (GO) analysis showed that common DEGs were mainly distributed to binding, transporter activity, locomotion, catalytic activity (Figure 1A). Kyoto Encyclopaedia of Genes and Genomes (KEGG) pathway analyses showed that DEGs were involved in cellular processes, environmental information processing, genetic information processing and metabolism and organismal systems pathways (Figure 1B). It is noteworthy that the most upregulated genes were enriched for signal transduction and carbohydrate metabolism pathways, with 39 and 30 DEGs, respectively. In addition, the most downregulated genes were enriched for lipid metabolism and amino acid metabolism pathways, with 24 and 19 DEGs, respectively.
The expression of BmDnmt1 (and BmDnmt2 to a lesser extent) was upregulated in diapause-terminated eggs after HCl-treatment. This was consistent with our previous findings [40] and consistent with RNA-seq data generated in this study (Figure 2). These changes in DNA methyltransferase expression suggest that genomic DNA methylation patterns may be associated with diapause initiation and termination in silkworm embryonic development.

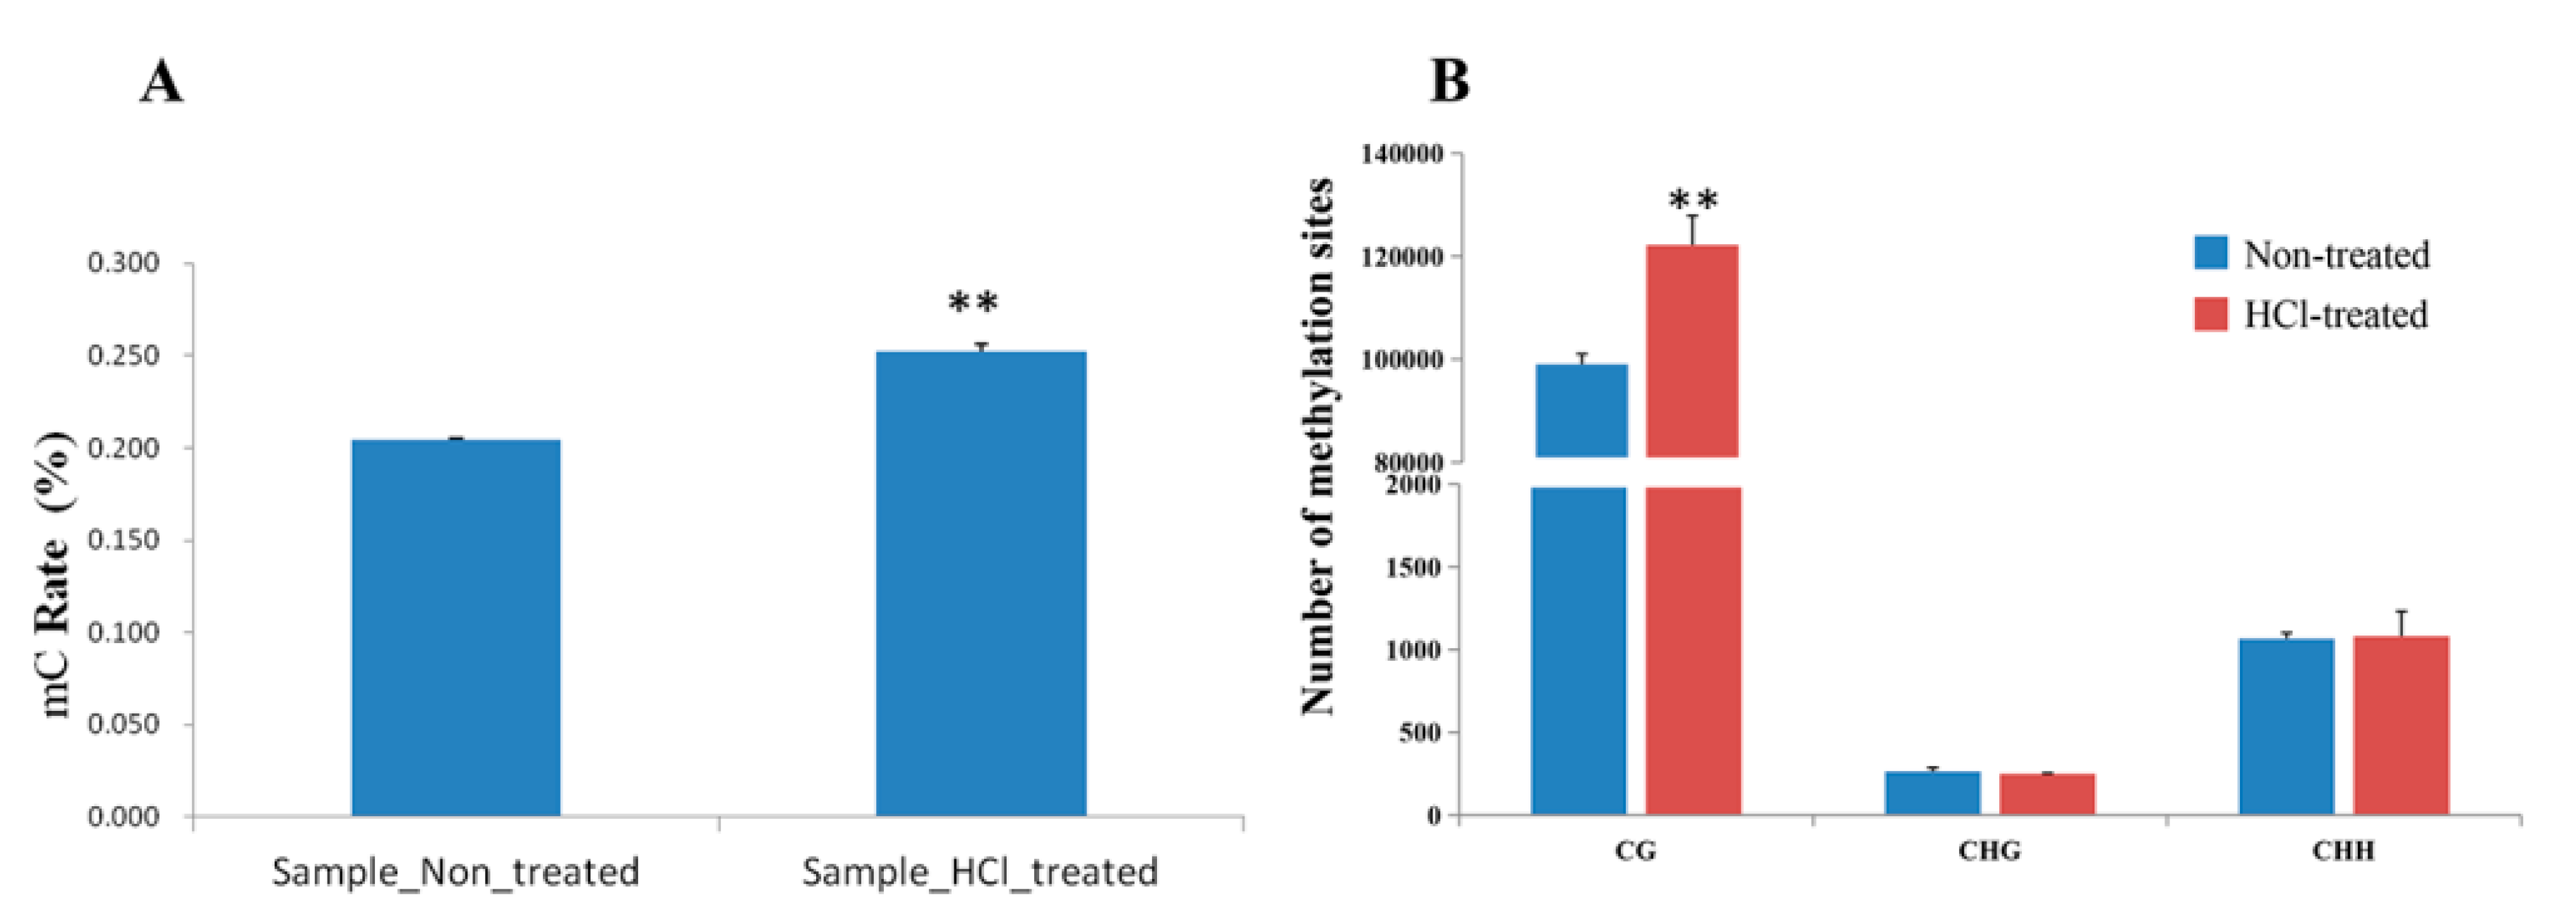
2.2. Overview of Methylation Landscapes of Silkworm Diapause-Destined Eggs and Diapause-Terminated Eggs

To investigate methylation patterns in silkworm embryonic development, WGBS was conducted in diapause termination eggs treated with HCl (HCl-treated) and diapause-destined eggs (non-HCl-treated). Three repeats were performed for each of the two groups, and the raw sequencing data are available from the repository of NCBI Sequence Read Archive (SRA) with the accession No. PRJNA598995. Up to ~9000 million sequencing reads were generated for each replicate, yielding ~12 Gb of data representing >30× the NCBI reference genome for silkworm. Nearly 98% of the reads (bases) were retained and were high-quality clean reads (bases) (Table 2). The non-HCl sample (control) genome presented ~0.21% mC on the total sequenced C sites, which reflected the methylation level percentage in the genome. It contained ~98.55% (mCG), 0.27% (mCHG) and 1.18% (mCHH) on the total sequenced mC sites. Accordingly, the HCl-treated sample presented ~0.26% of the total sequenced C sites, and 98.94%, 0.21% and 0.85% of the CG, CHG and CHH sites, respectively (Supplementary Table S3). It was observed that the mC rate of the total sequenced C sites was significantly increased in diapause-terminated eggs when compared with diapause-destined eggs (Figure 3A). In addition, our results showed that mCG sites were significantly increased in diapause-terminated eggs when compared with diapause-destined eggs, while others were not significantly changed (Figure 3B).

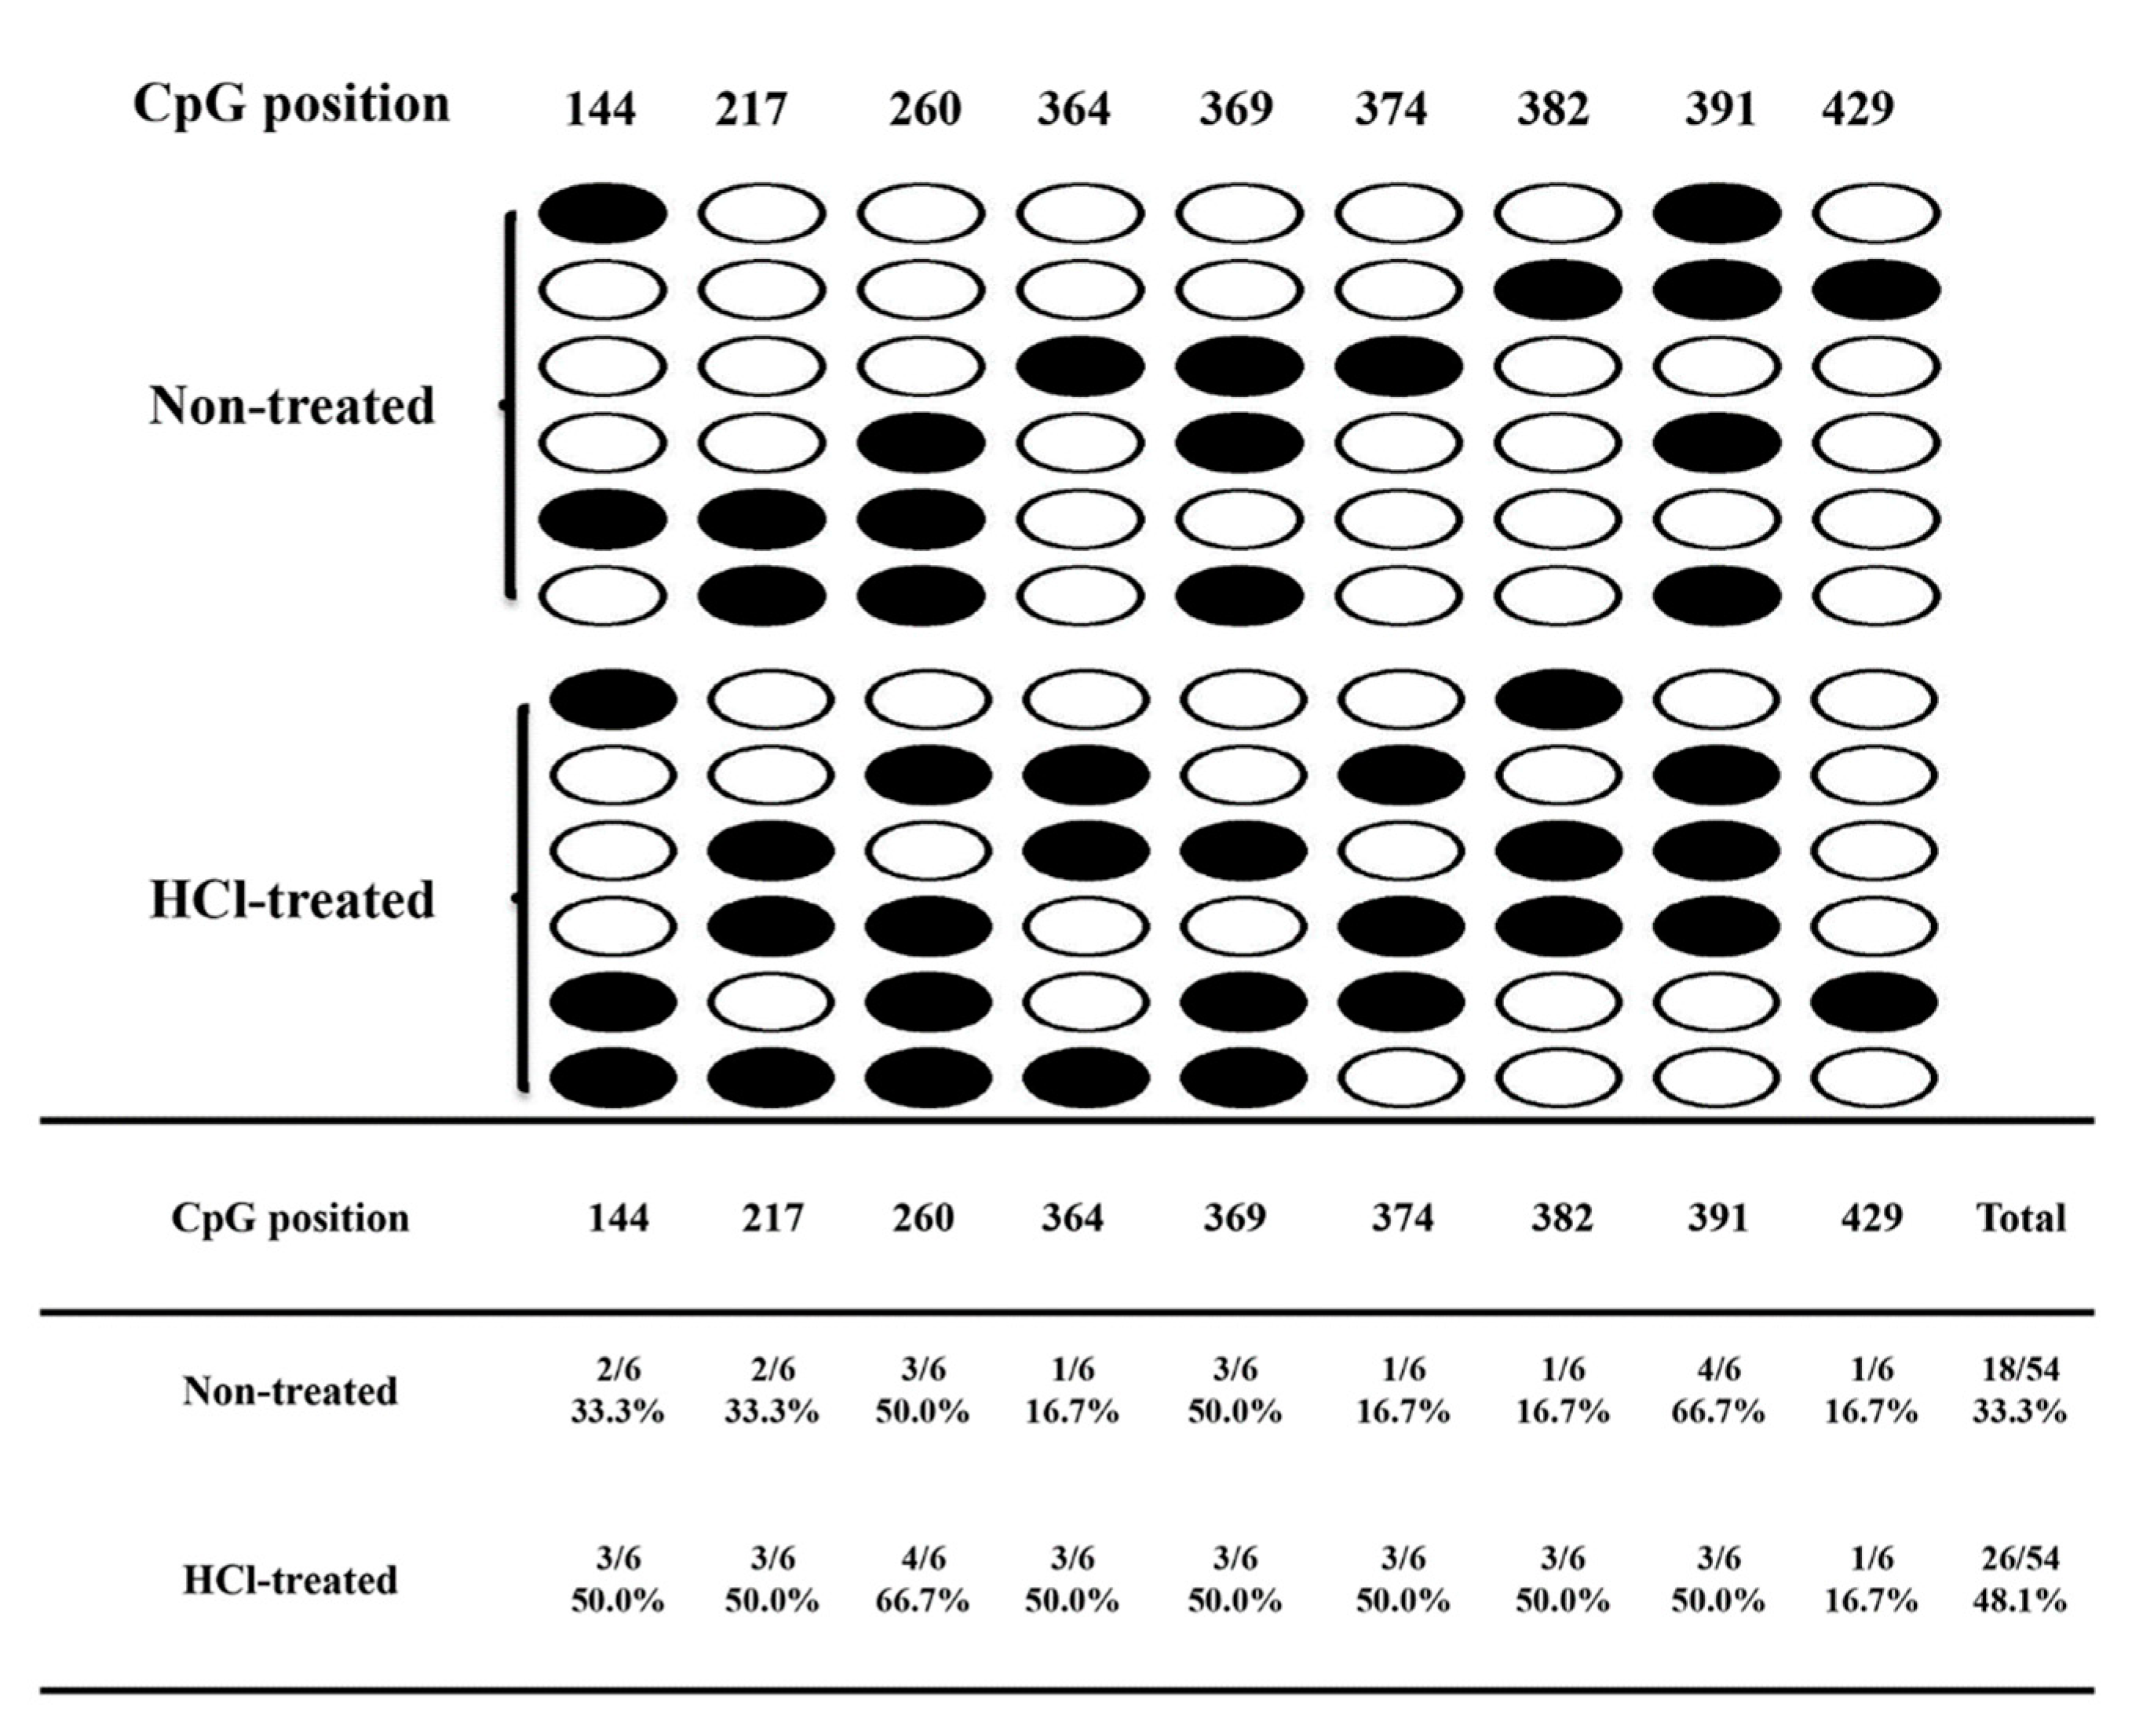
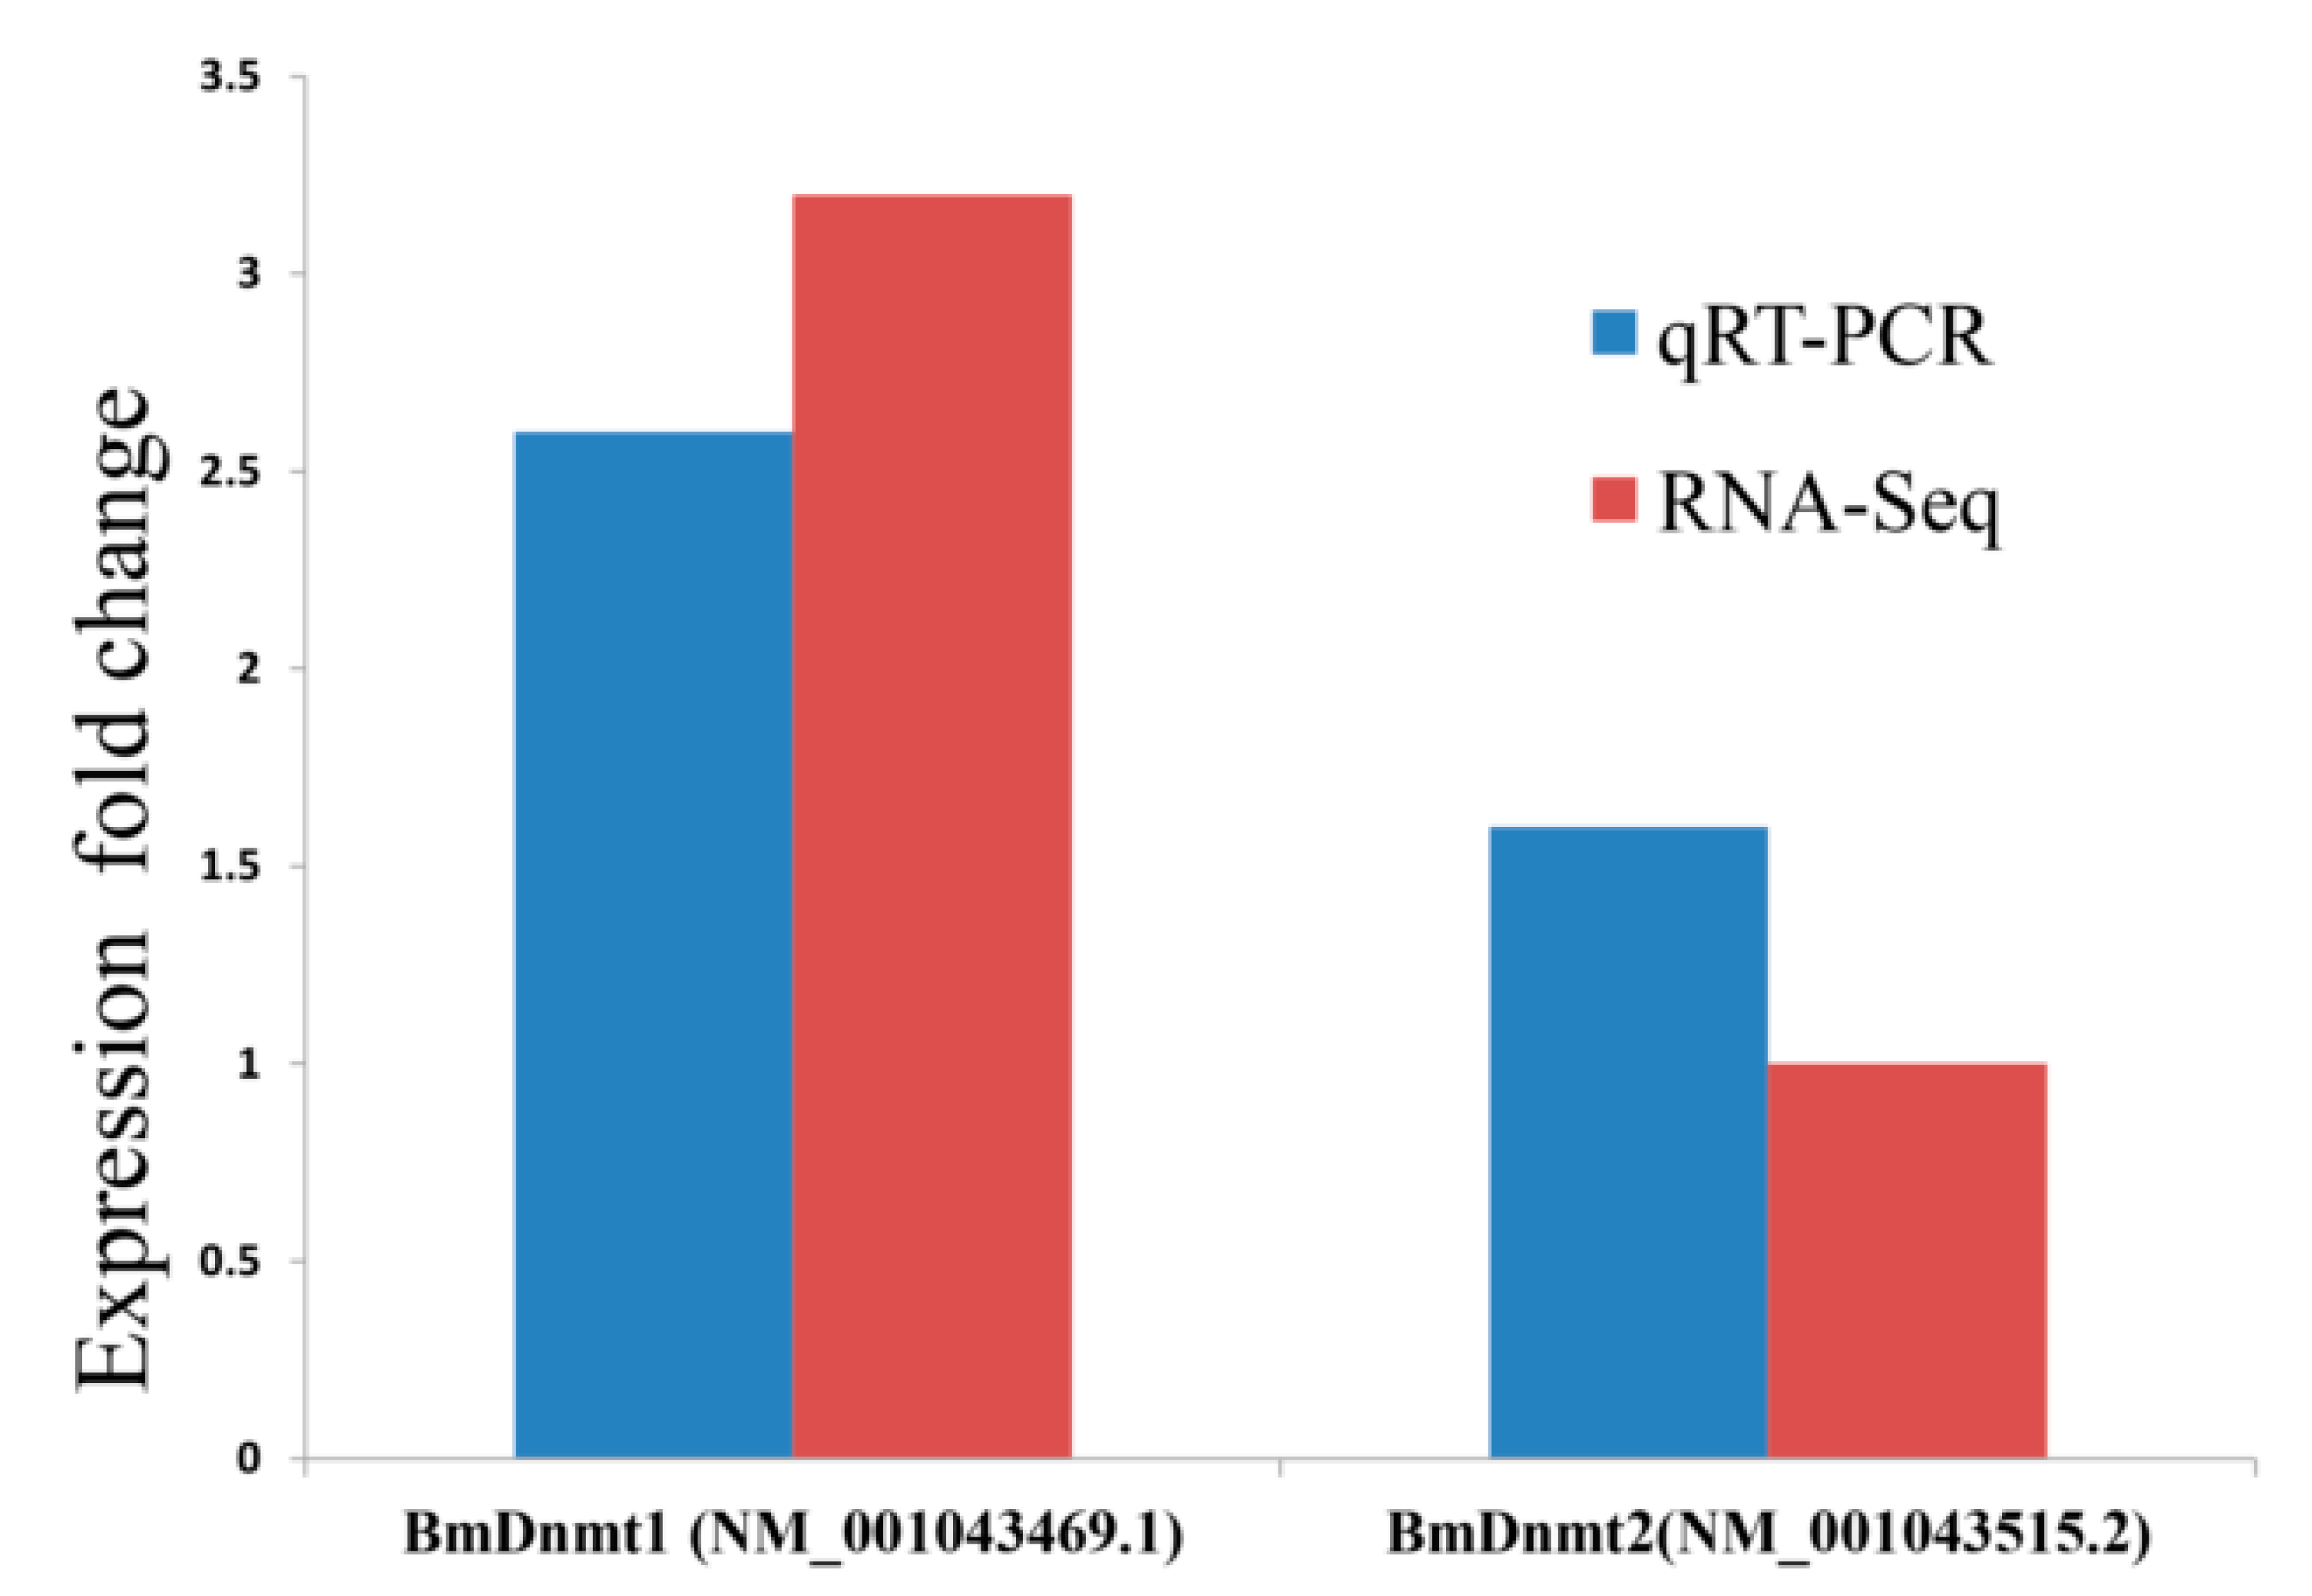
2.3. Validation of RNA-seq and WGBS

For the validation of RNA-seq results, three genes that were significantly upregulated and three genes that were significantly downregulated were selected for mRNA quantification using RT-qPCR. The results were consistent with RNA-seq (Figure 4A). McrBC is a restriction enzyme that cuts methylated, but not unmethylated, DNA. McrBC-qPCR has been routinely used for DNA methylation testing and marker validation [41,42]. For WGBS validation, we assayed DNA methylation levels of two genomic regions using methylation-sensitive McrBC-qPCR. The gene LOC101739208 is hypermethylated, and we determined that its methylation levels increased by 28% in HCl-treated samples when compared with non-treated samples. In another experiment using the gene LOC110385781, which is hypomethylated, we observed that methylation levels decreased by 25% in HCl-treated samples when compared with non-treated samples. Methylated DNA can be digested by McrBC; thus, higher qPCR signals indicate lower methylation levels, suggesting our McrBC-qPCR assay was consistent with our WGBS data (Figure 4B).

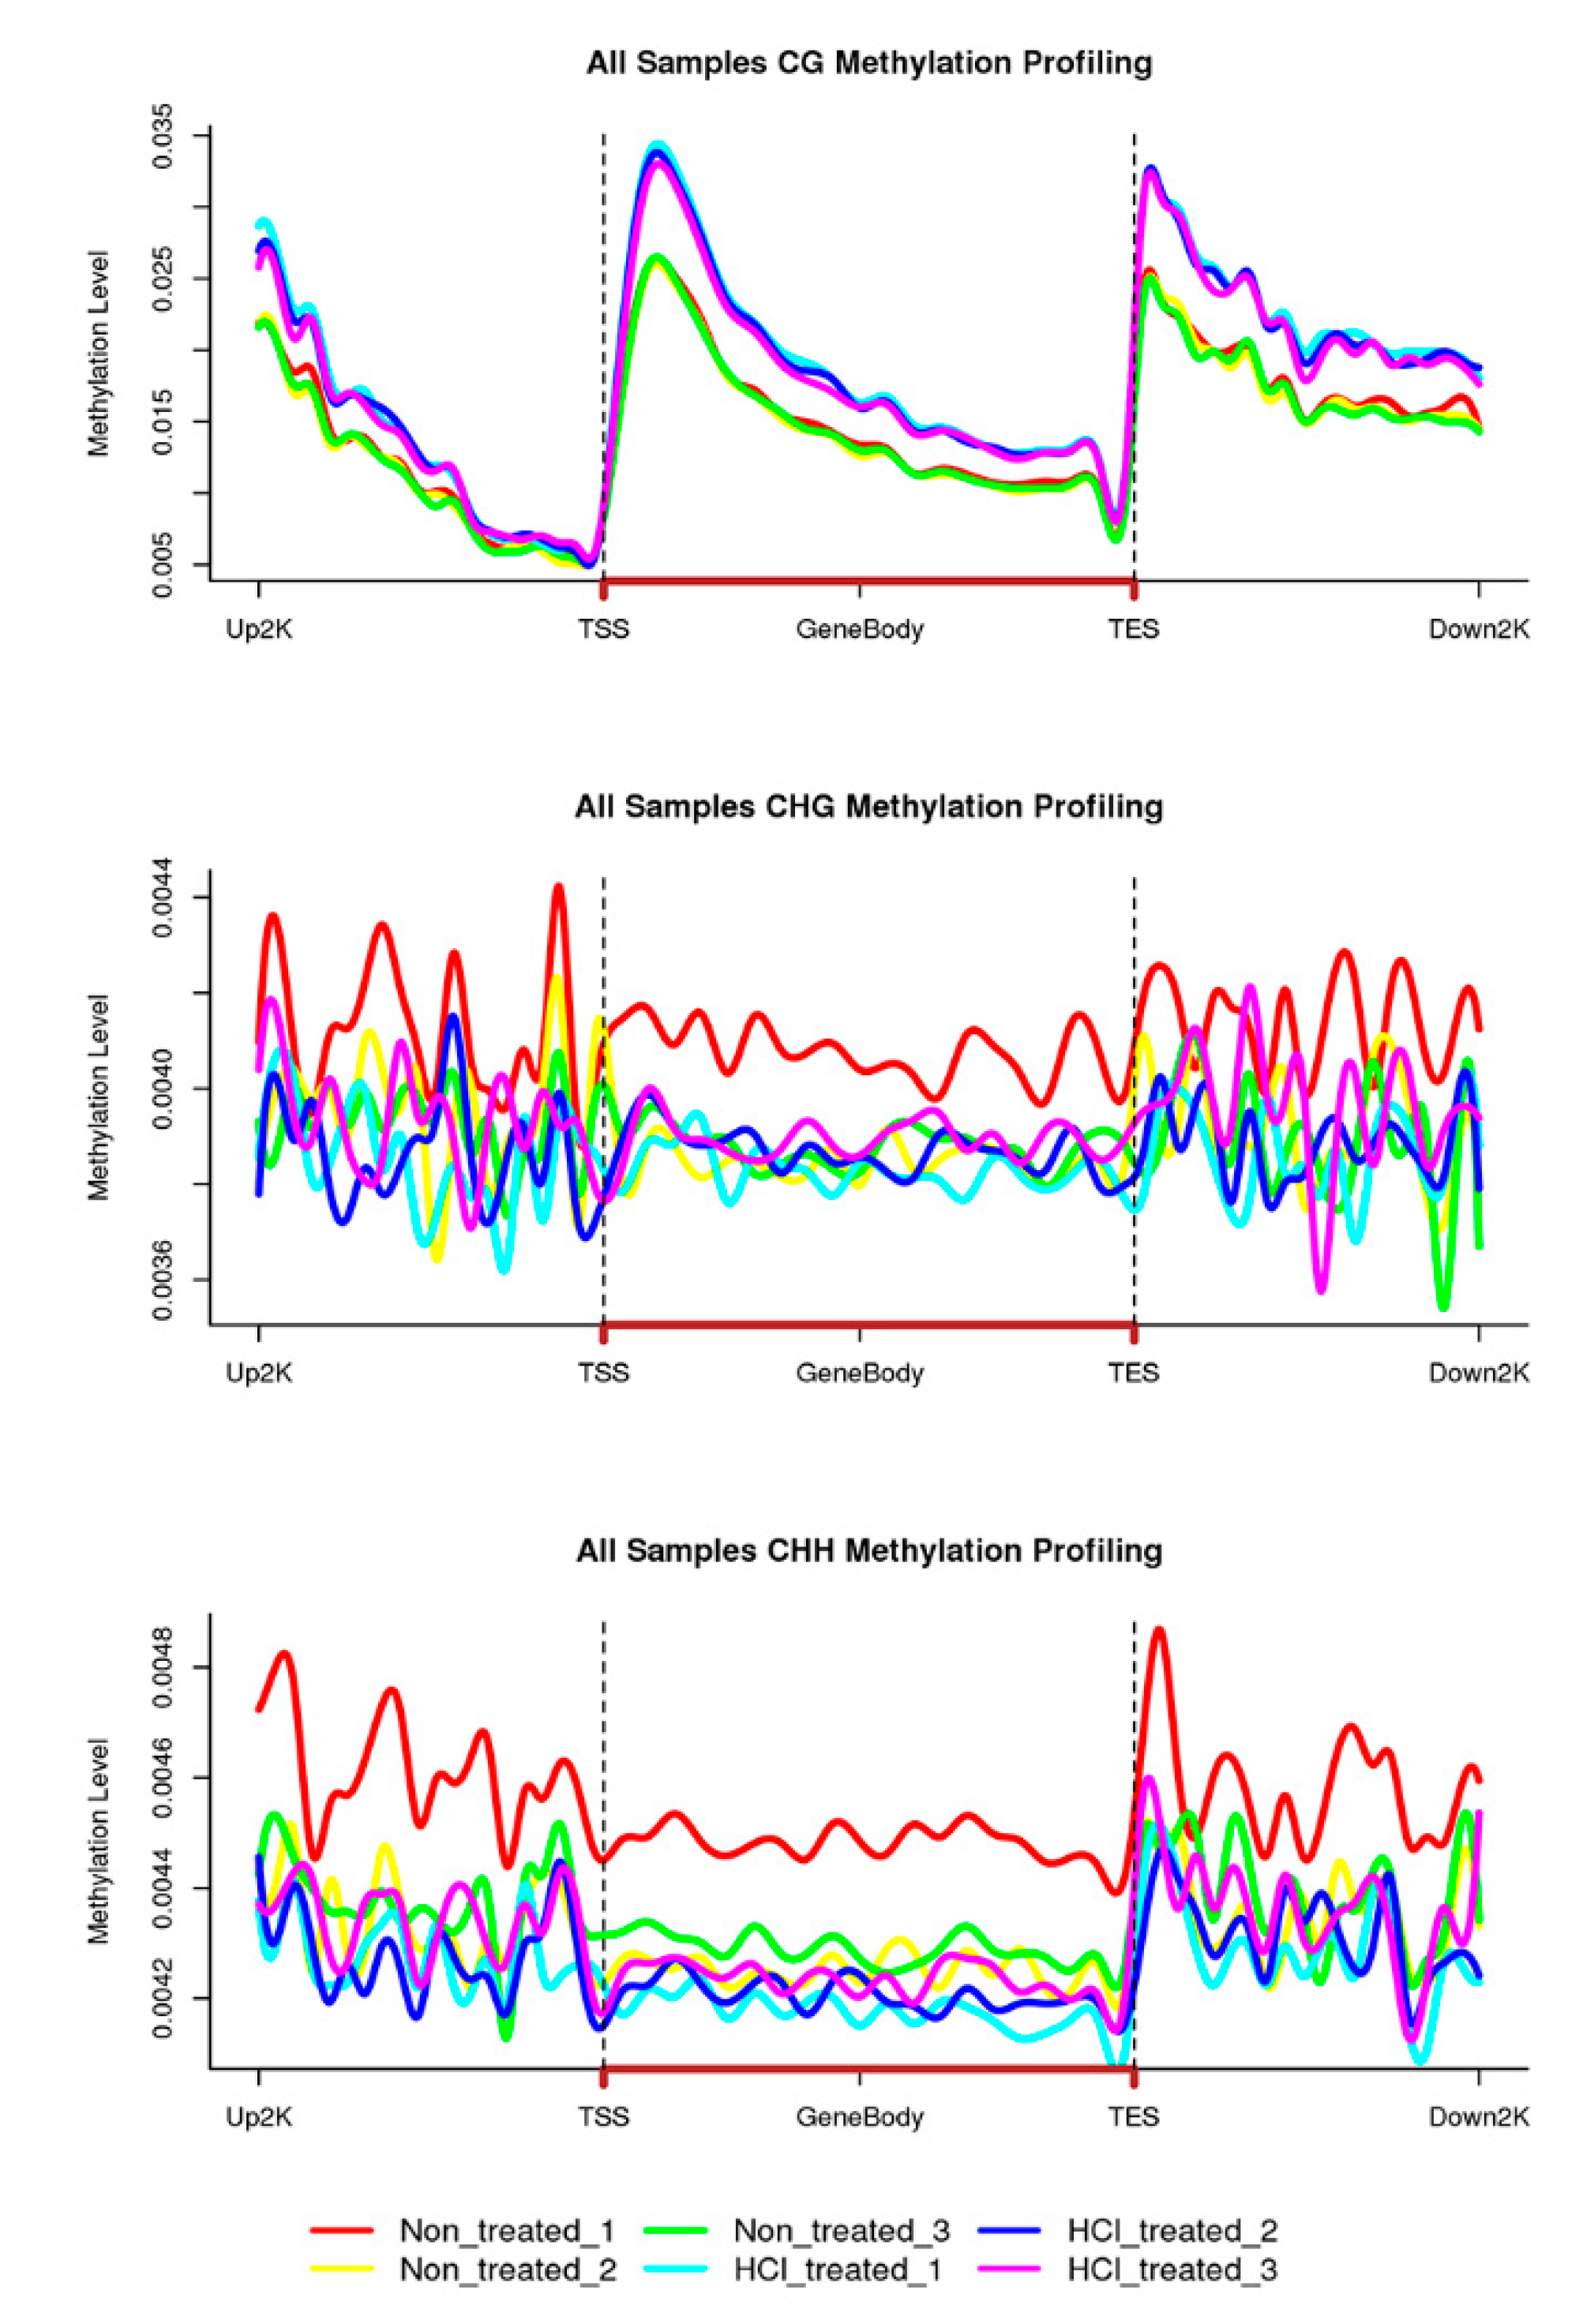
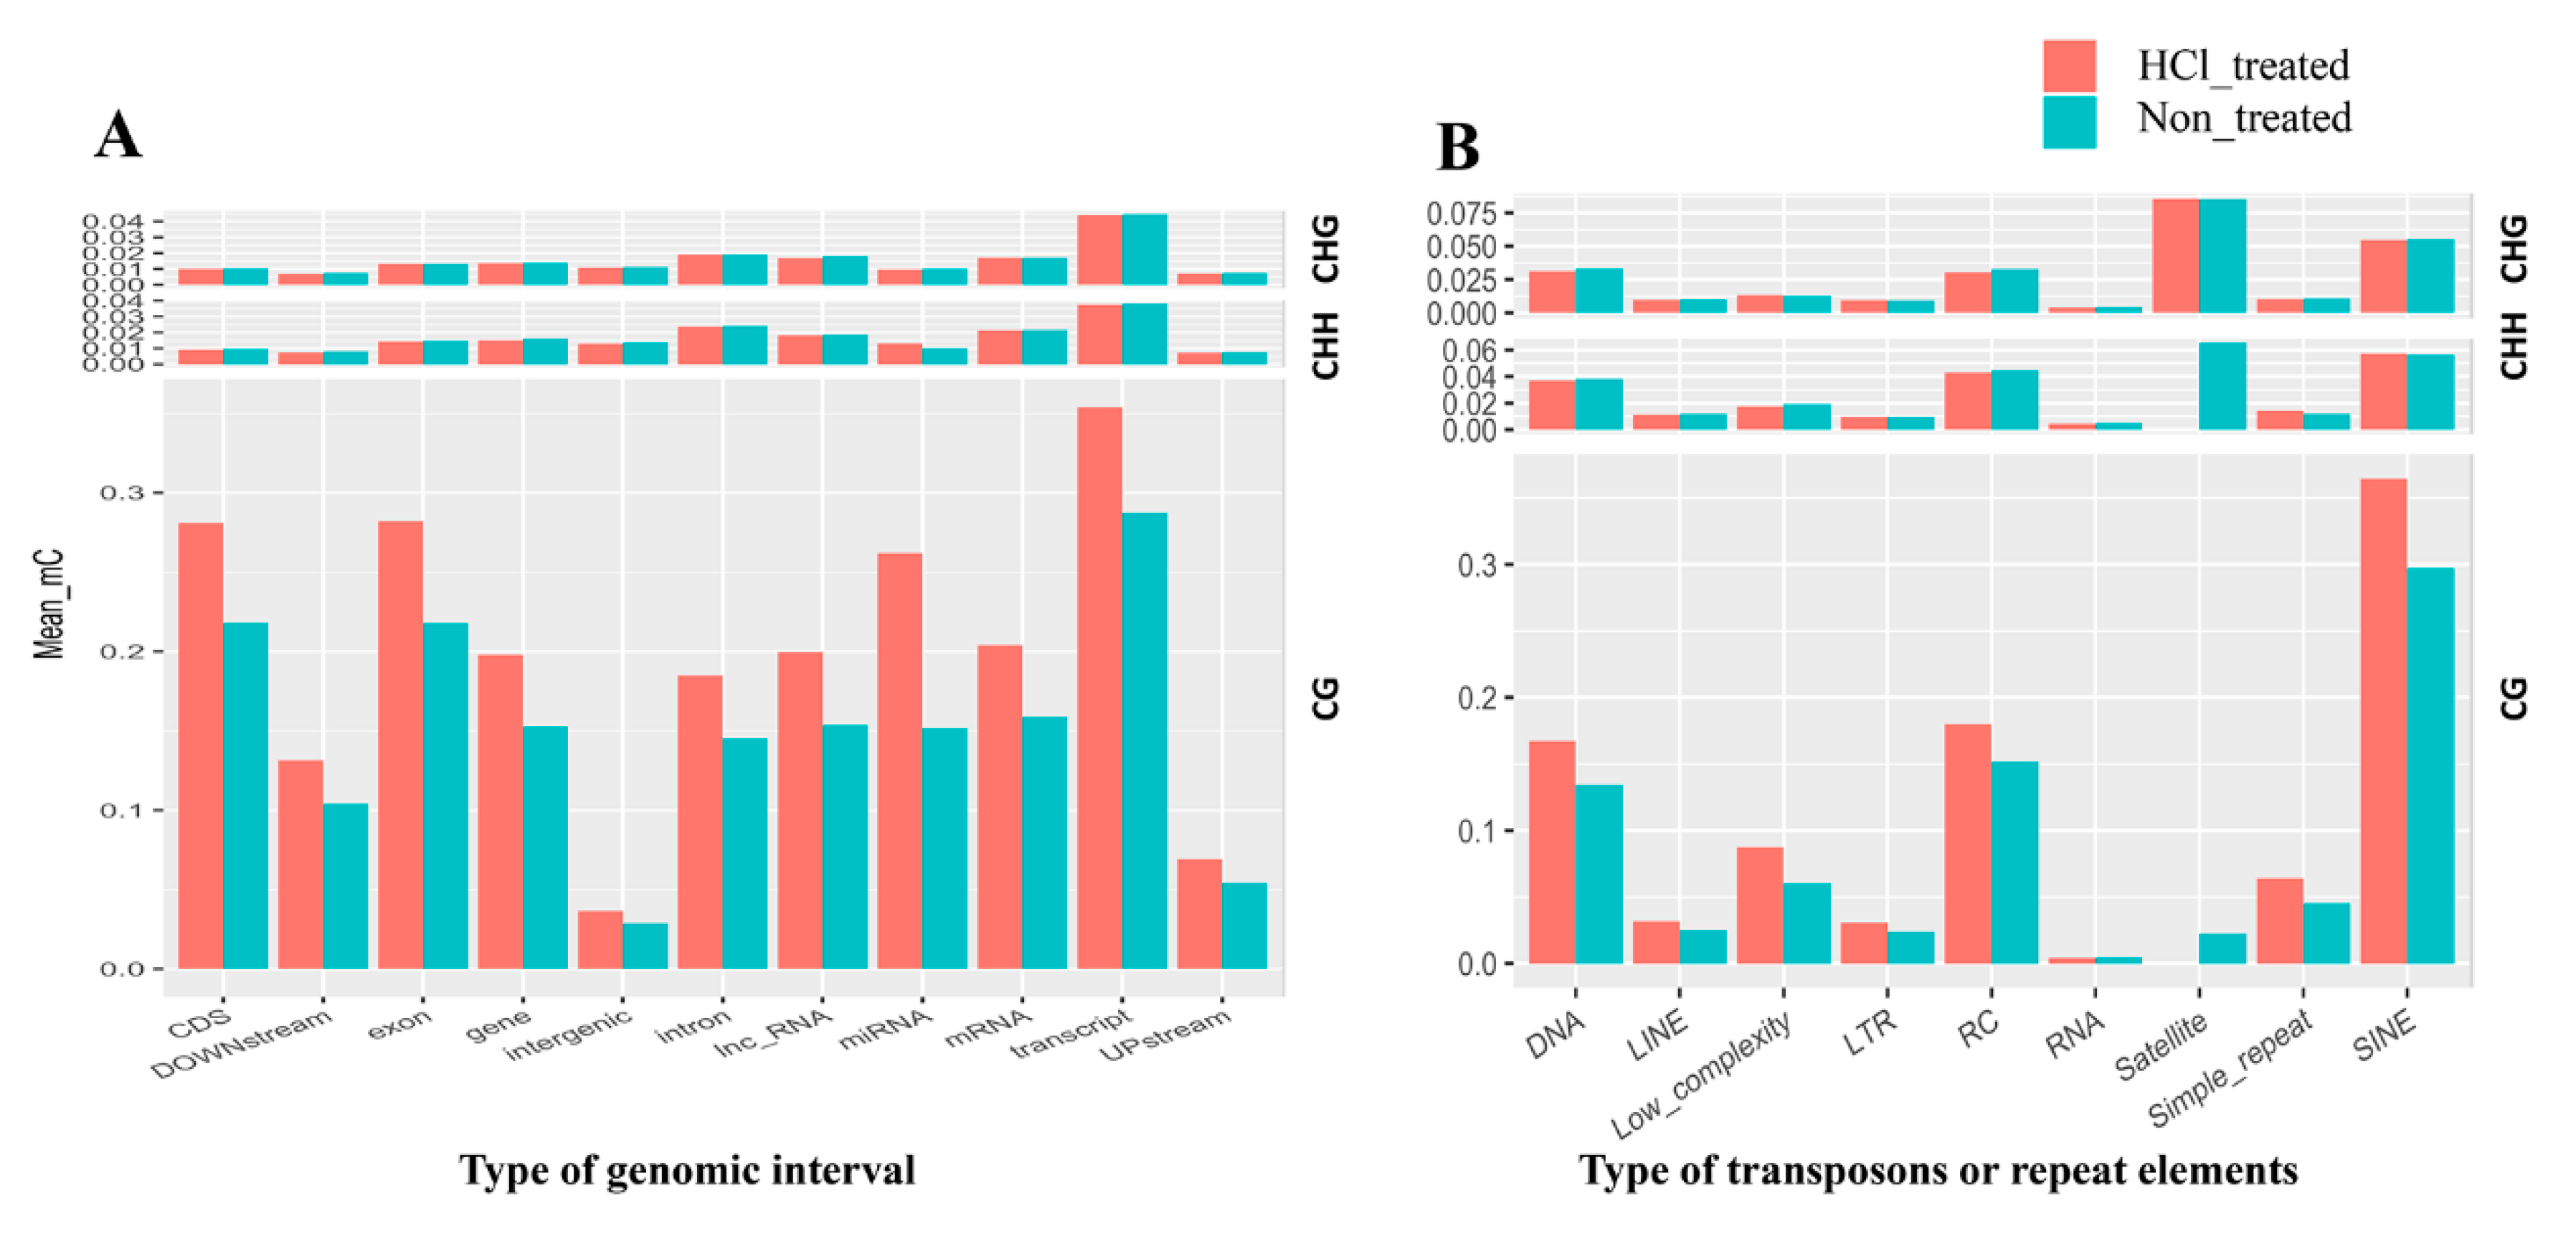
2.4. DNA Methylation Patterns in Genomic Regions of Diapause-Destined Eggs and Diapause-Terminated Eggs

From our data, we observed that DNA methylation patterns varied at different genomic intervals. To understand these patterns in silkworms, we analyzed methylation profiles within genes, including Coding sequence (CDS), downstream, exons, intergenic areas, introns, lnc-RNAs, miRNAs, mRNAs, transcripts and upstream (Figure 5A). When compared with the non-treated group, CG methylation levels increased in the HCl-treated group for all types of genomic intervals, with the highest methylation levels found in transcript elements. Methylation profiles were also analyzed in transposon elements (TEs) and repeat elements (REs) using RepeatMasker software (GIRI, v4.0.4). Transposons include DNA segments, long interspersed nuclear elements (LINE), short interspersed nuclear elements (SINE), retrotransposons (RC) and long terminal repeats (LTRs), and repeat elements include simple_repeat, low_complexity, satellites and RNArepeats (Figure 5B); in particular, satellites of HCl treated were not detected. The results suggest that CG context methylation sites are mainly concentrated in SINE repeats, DNA transposons and RC transposons.
To understand the relationship between DNA methylation profiles and gene expression, DNA methylation profiles were divided into ~2 kb upstream and downstream transcribed regions to study methylation changes (Figure 6). The distribution of CG methylation sites in three distinct genomic functional regions showed strong bias, and CG methylation showed high enrichment levels in ~2 kb upstream, transcription initiation sites (TSS) downstream and transcription termination sites (TTS) downstream regions. In addition, CG methylation levels in HCl-treated samples were elevated among gene features when compared with non-treated samples, except for regions near TSS and TTS.

2.5. Differentially Methylated Regions (DMRs) and Differentially Methylated Promoters (DMPs) Responding to Embryonic Development

To investigate the influence of embryonic development and insect diapause on methylation, we analyzed DMRs in diapause-terminated eggs when compared with diapause-destined eggs. In total, 43,781 DMRs were identified (methylation difference ≥ 10%, Q value ≤ 0.05) containing 42,877 hypermethylated DMRs and 904 hypomethylated DMRs. In addition, 4449 different methylation genes (DMGs) located in DMRs were identified. To investigate the biological functions of DMGs, a KEGG pathway enrichment analysis was performed. As shown in Figure 7A, DMGs were mainly assigned to pathways related to protein processing in endoplasmic, cell cycle, RNA transport, etc. functions.
The promoter region of a gene is closely related to transcriptional regulation. Differentially methylated modifications located in the promoter region may change a gene’s transcriptional expression. To characterize such methylation alterations in promoter regions during early embryonic development, 99 differentially methylated promoters (DMPs) located in DMRs were identified (Supplementary Table S4). KEGG pathway analyses showed that DMPs were involved in hippo-signalling, Wnt-signalling, mTOR-signalling, etc. pathways. (Figure 7B).

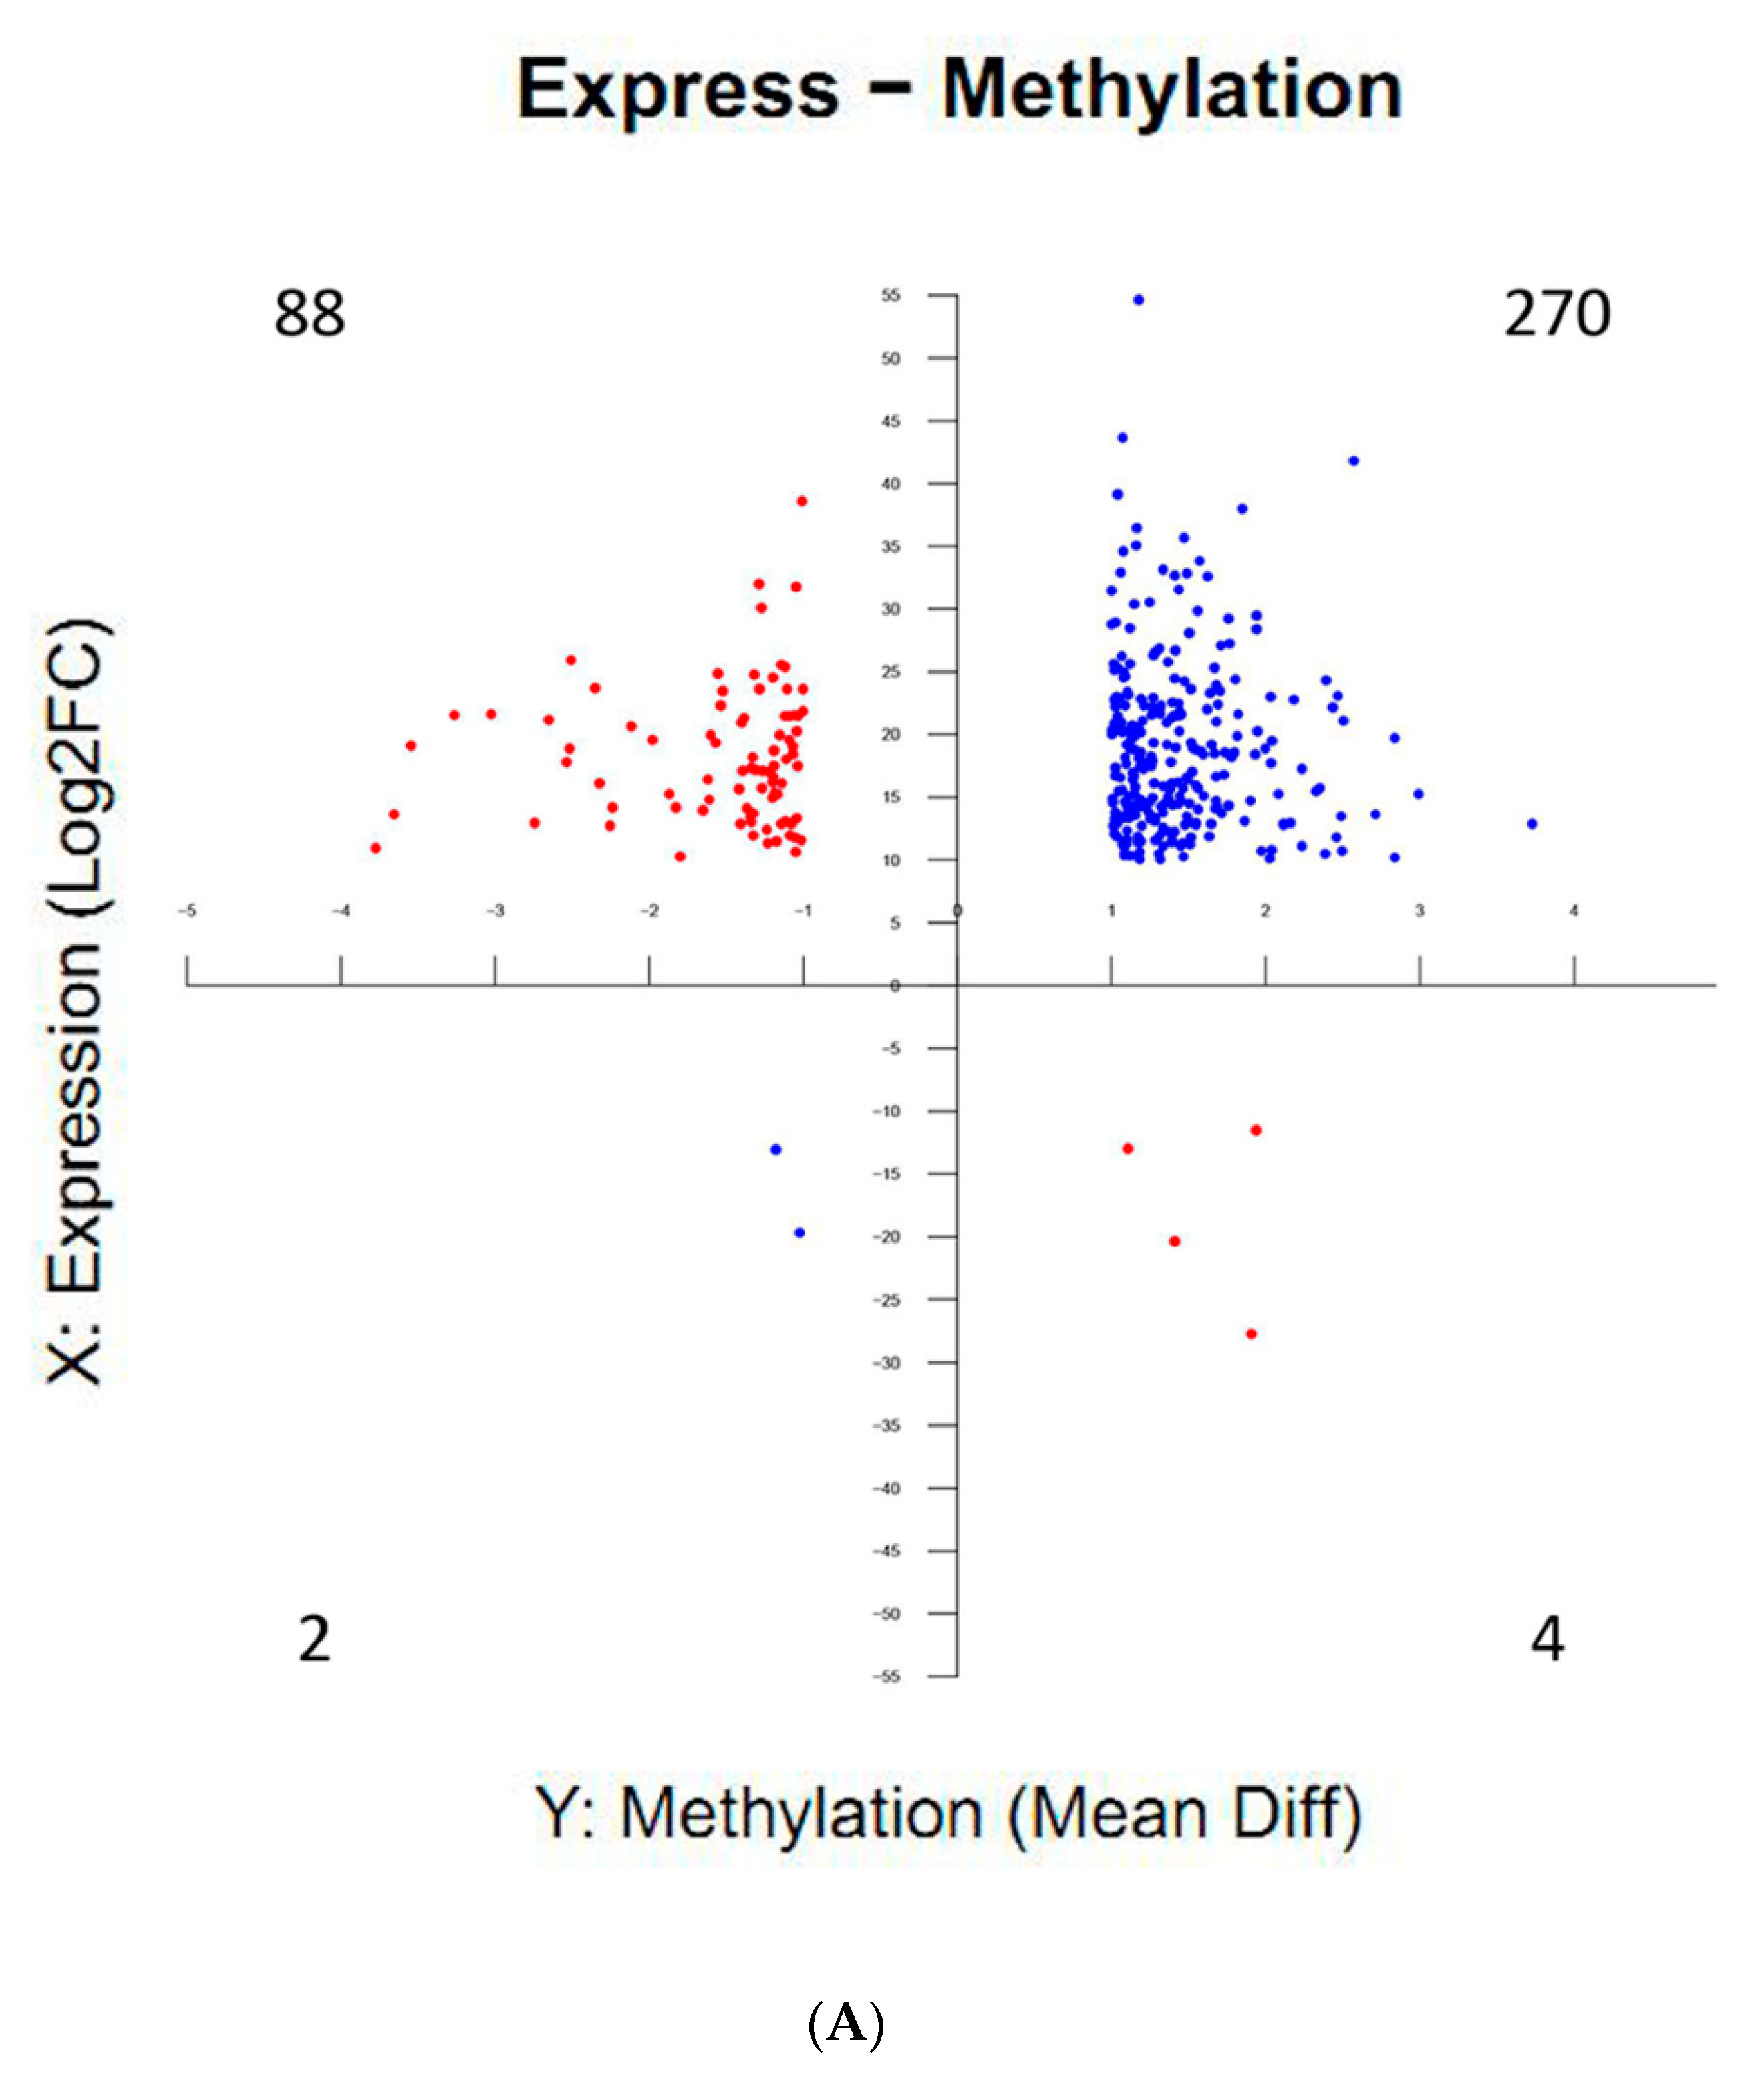
2.6. Correlations Between DNA Methylation and Gene Expression during Silkworm Early Embryonic Development

To investigate whether changes in CG methylation observed during silkworm early embryonic development altered gene expression, we synthetically analyzed DEG and DMG data. As a result, there were 364 methylome- and transcriptome-associated genes (MTGs) with significant differences in methylation and expression levels in diapause-terminated eggs when compared with diapause-destined eggs (Supplementary Table S5). More than 98% of genes showed hypermethylation, and more than 74% of genes showed both hypermethylation and upregulated protein expression. To be specific, 270 hypermethylated genes were positively correlated with expression changes in the first quartile, and 88 hypermethylated genes were negatively correlated with expression changes in the second quartile (Figure 8A), indicating a strong positive correlation between DNA methylation and gene expression for first quadrant genes. Meanwhile, percentage methylation levels in gene body, 2 kb upstream and downstream regions for positively and negatively correlated genes, were detected, to understand the relationship between DNA methylation profiles and gene expression (Supplementary Figure S1). The results showed that CG methylation sites of 270 hypermethylated-upregulated genes showed strong bias. The CG methylation levels in HCl-treated samples were strongly elevated in 2 kb downstream and weakly elevated near the TSS of gene body when compared with non-treated samples. By contrast, there is no obvious change trend for the 88 hypermethylated-downregulated genes. Moreover, GO analysis showed that MTGs were highly enriched for phosphatidylinositol dephosphorylation, G1/S transition in the mitotic cell cycle, RNA polymerase II transcription corepressor activities etc., (Figure 8B), and related genes with changes in methylation levels or methylation patterns may be closely correlated with embryonic development. KEGG pathway analyses showed that MTGs were involved in signalling pathways regulating stem cell pluripotency, phosphatidylinositol signalling system, different types of N−glycan biosynthesis, insulin-signalling pathways etc. (Figure 8C), suggesting that DNA methylation variations appear to regulate gene expression in multiple pathways during early embryonic development.

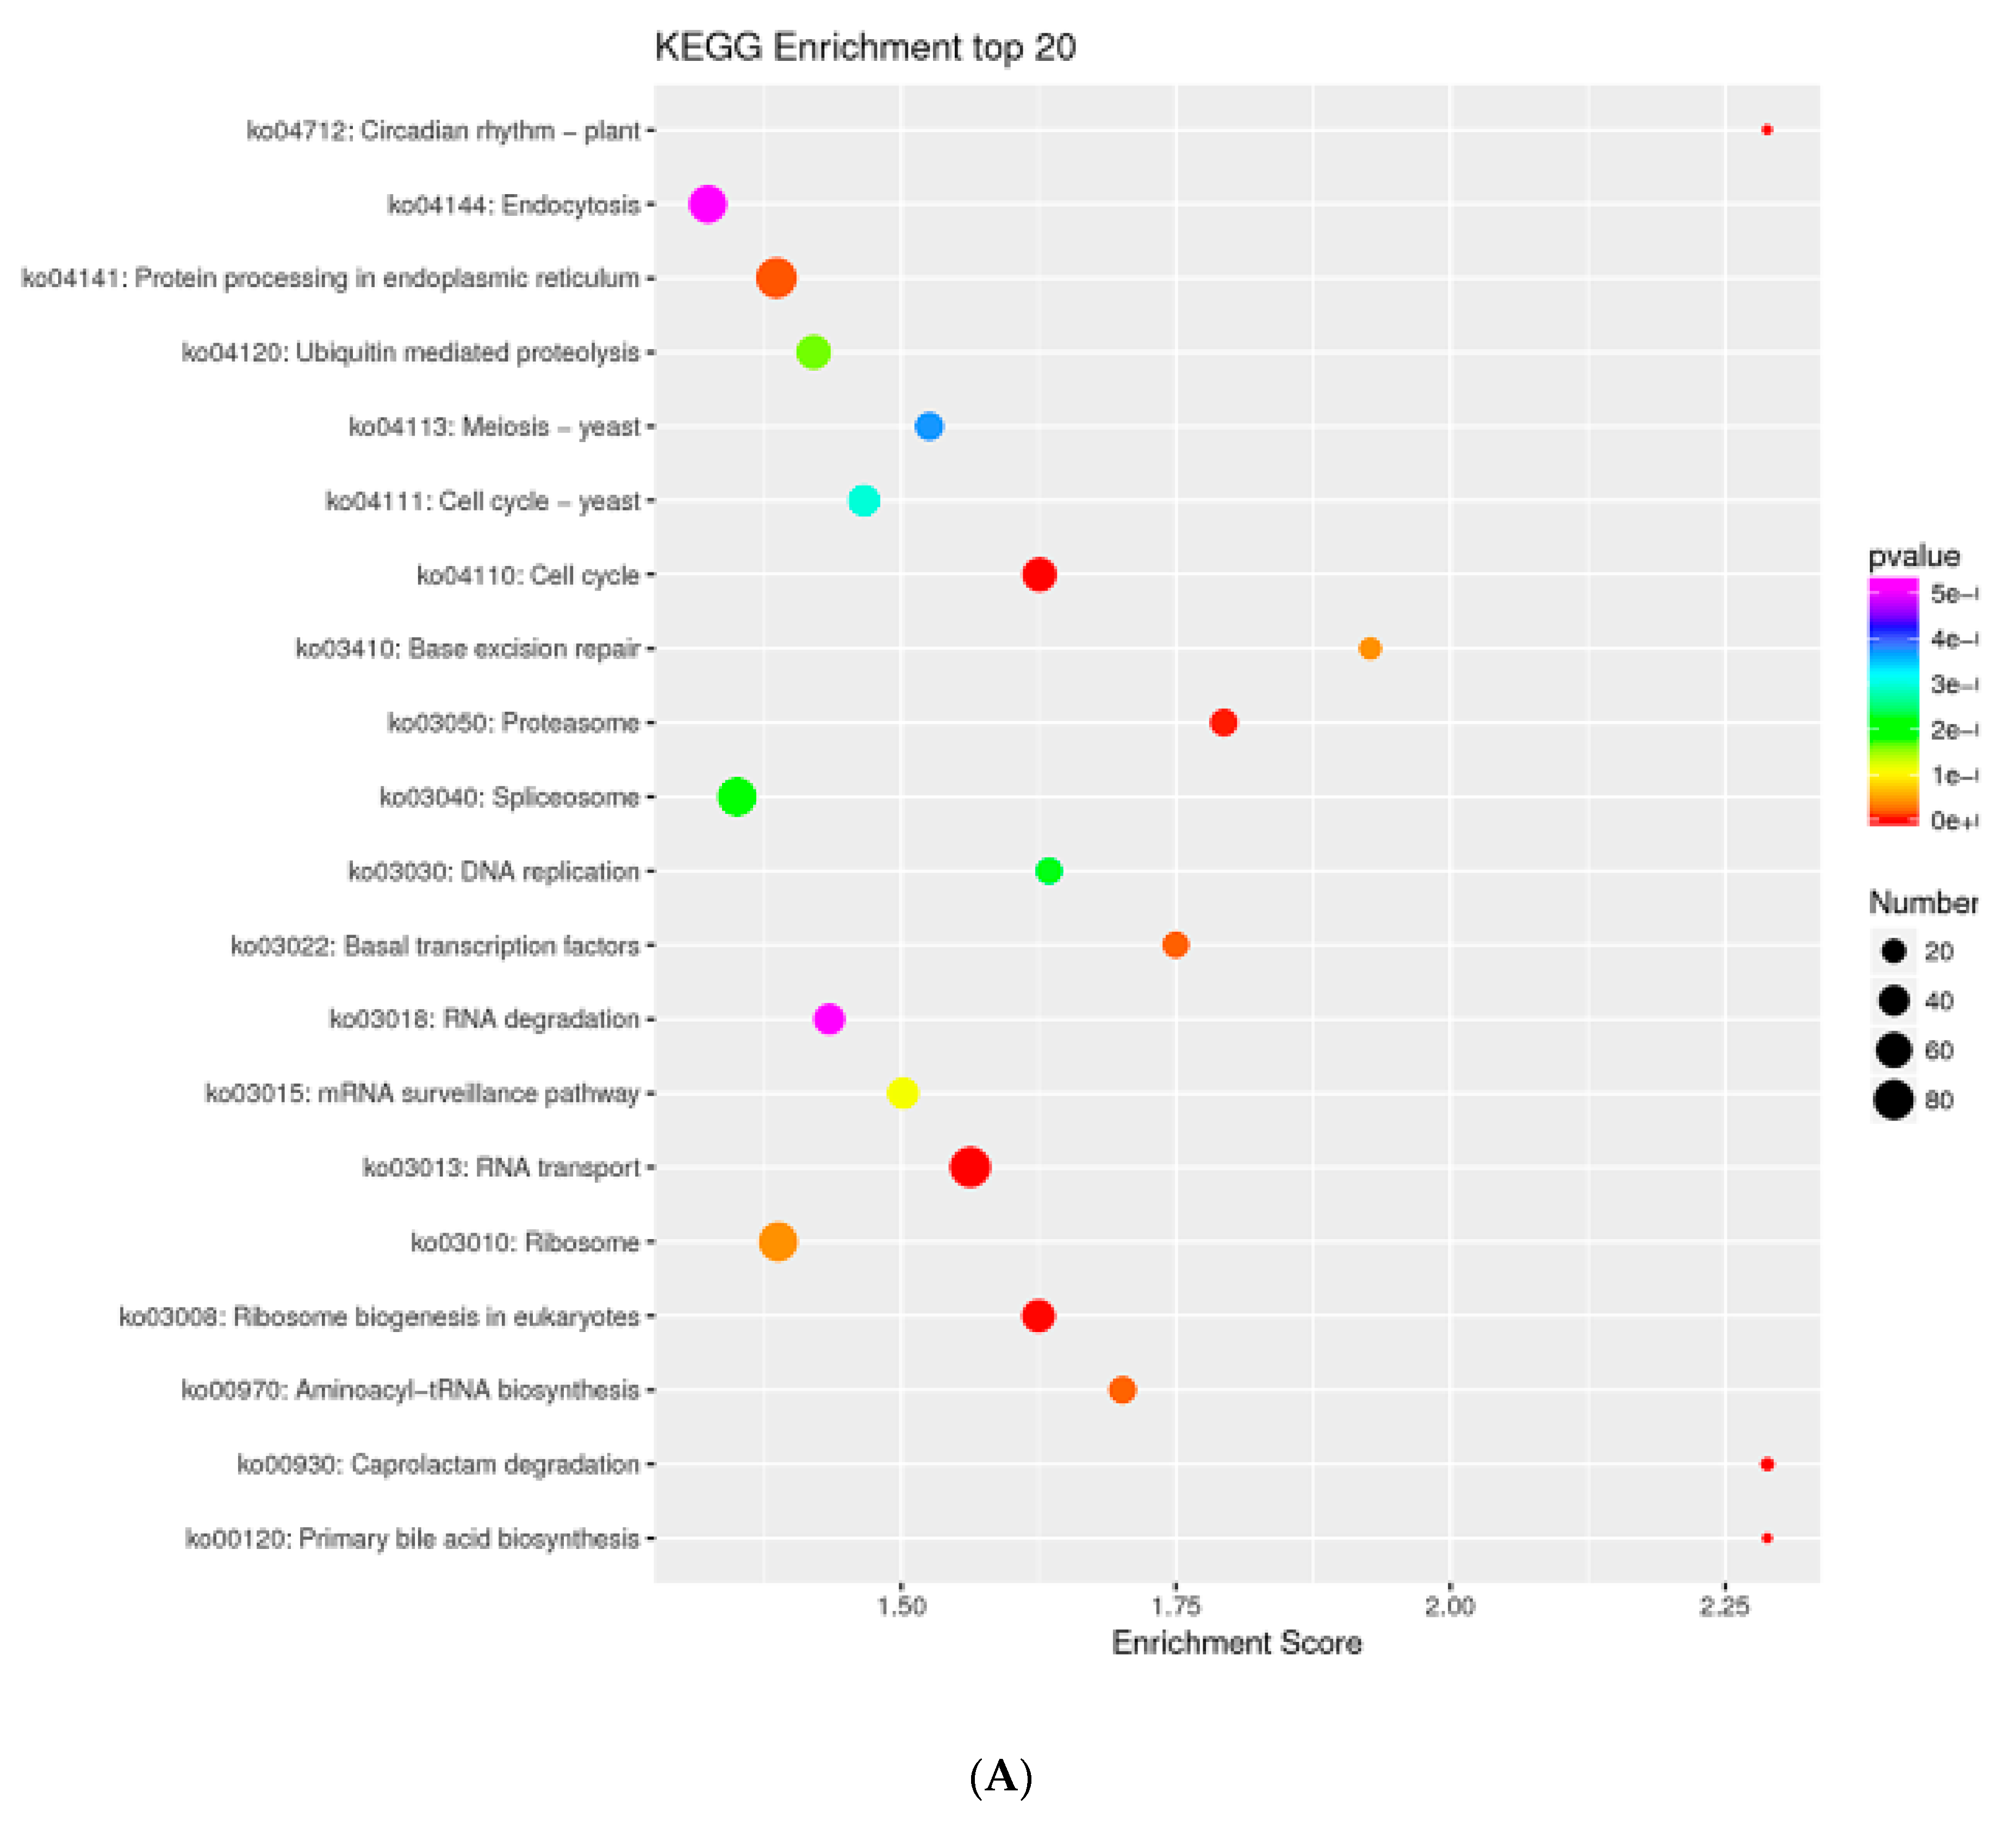
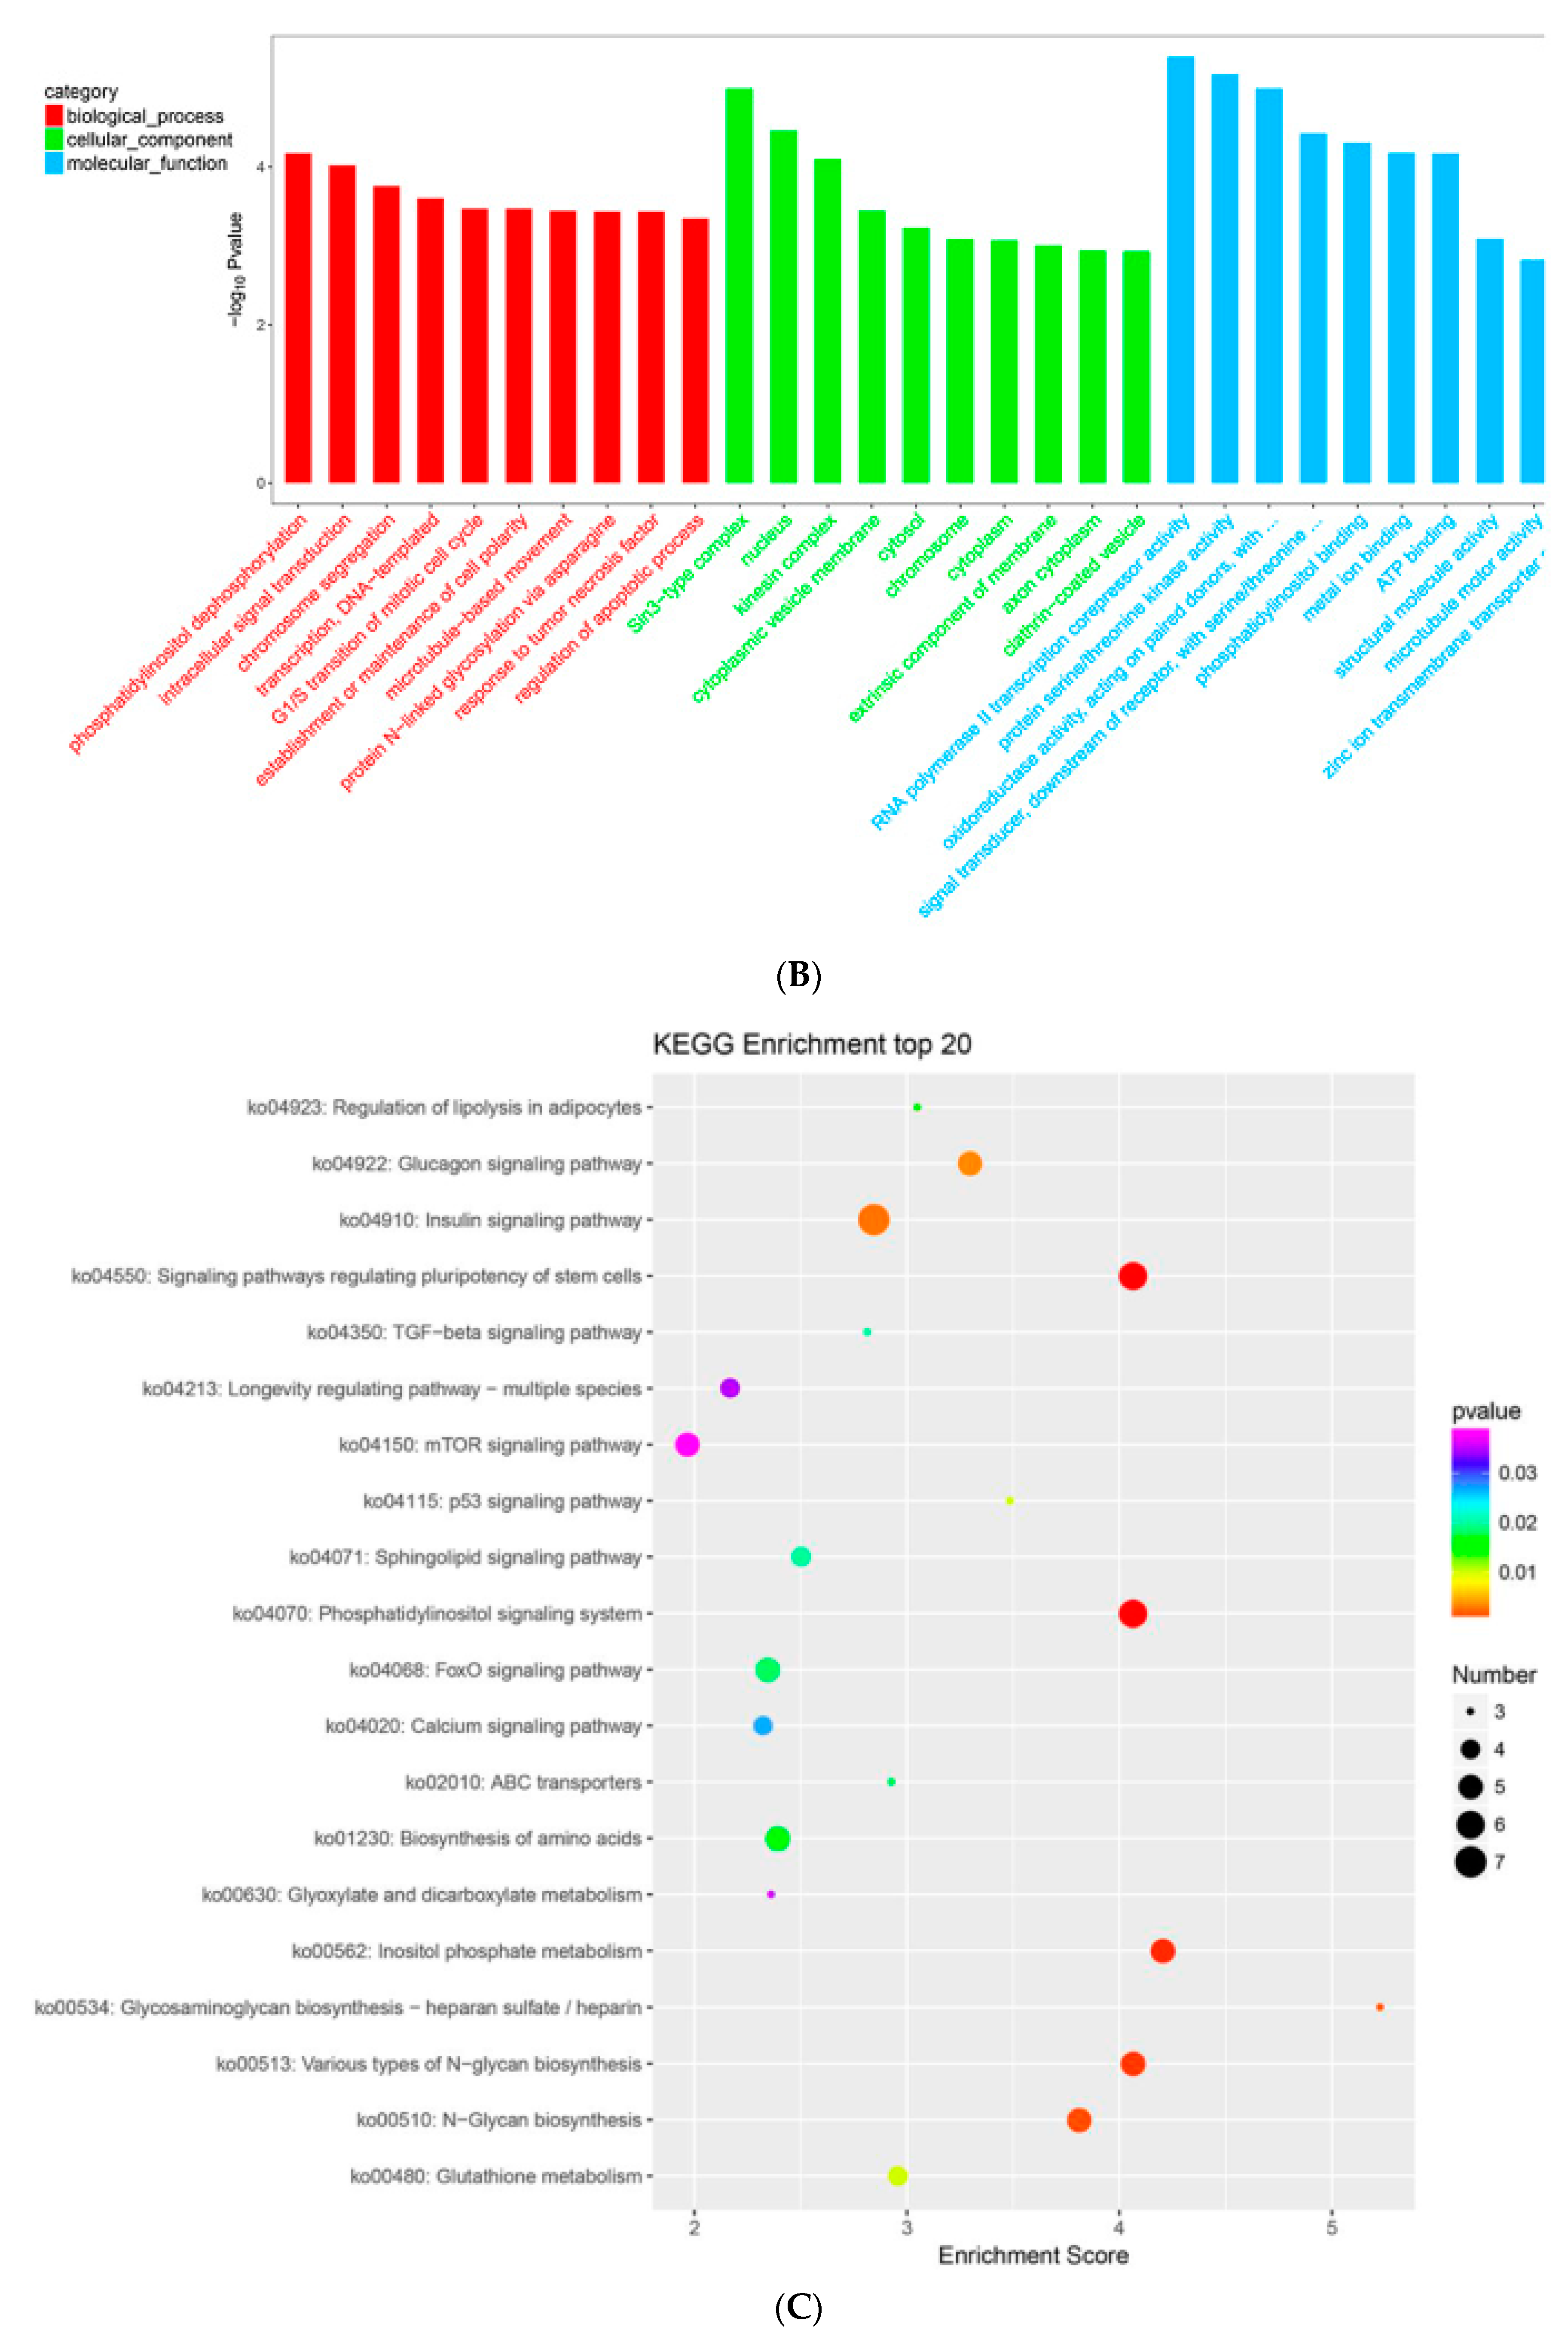
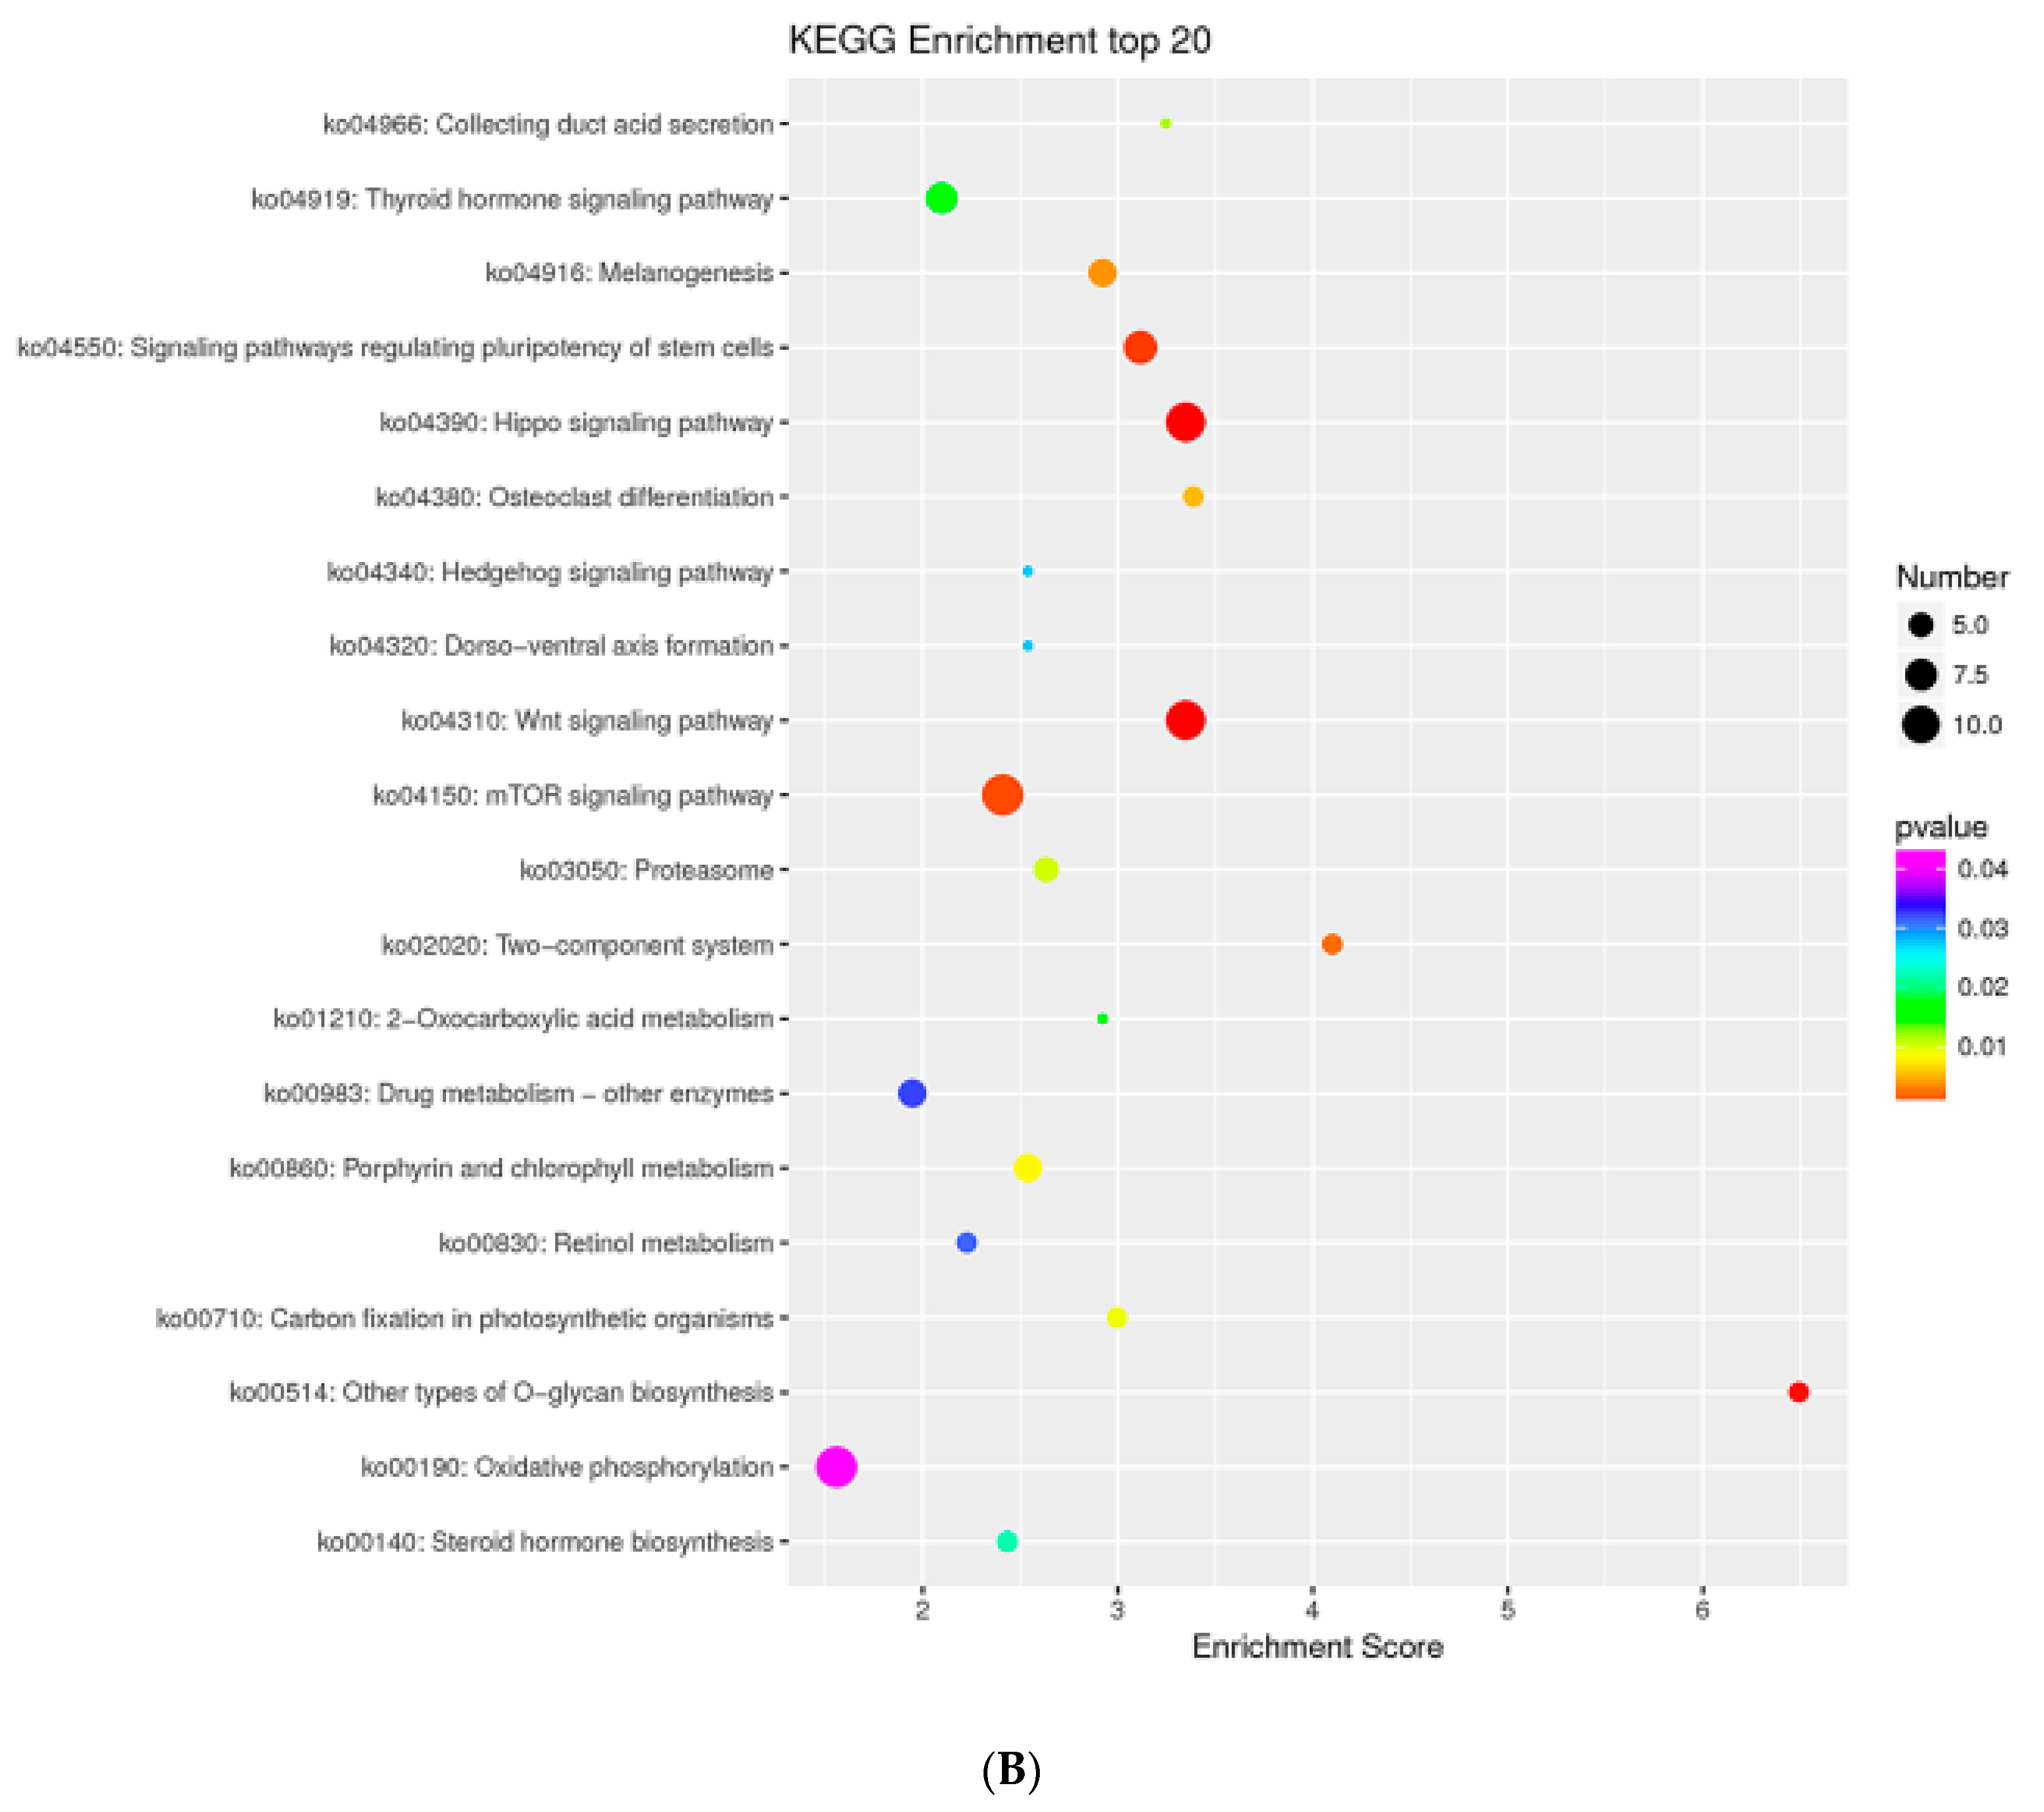
2.7. MTGs Are Involved in Metabolic Biosynthesis

In embryonic development, when the diapause eggs have terminated the diapause, energy metabolism and material synthesis begin to be activated. Here, KEGG pathway analyses showed that 23 MTGs related to metabolic biosynthesis were identified for pathways involved in N-glycan biosynthesis, glycosaminoglycan biosynthesis, glutathione metabolism, regulation of lipolysis in adipocytes, biosynthesis of amino acids and glyoxylate and dicarboxylate metabolism (Table 3). These pathways were associated with metabolism and synthesis of glycogenolysis, protein synthesis and lipolysis. Moreover, the most gene-enriched pathway was the protein-synthesis-related pathway, in which 16 MTGs were identified. Previous studies have shown that glycogen synthesis and tricarboxylic acid cycle dynamics are enhanced during embryonic development [43]. Here, four MTGs were involved in glycogen synthesis and three MTGs in the tricarboxylic acid cycle. Three MTGs involved in lipid metabolism were also identified; it is worth noting that a homologue of adenylate cyclase type 2 (Gene ID: LOC101737606) had a sevenfold increase in protein expression. Thus, KEGG analyses demonstrated that methylation modification was related to embryonic metabolic biosynthesis.

2.8. MTGs Are Involved in Phosphorylation

A previous study has shown that some key enzymes in silkworm embryo development regulate their activities through protein phosphorylation and dephosphorylation to sustain embryonic metabolism [44]. Our KEGG pathway analyses showed that six MTGs were involved in phosphatidylinositol-signalling pathways (Table 4), with all genes showing increased methylation and expression levels in diapause-terminated eggs when compared with diapause-destined eggs. It is noteworthy that three INPP-family genes of the six MTGs were identified, and that INPP genes regulate many cellular activities, including vesicle transport, cytoskeletal dynamics, protein synthesis, cell proliferation and survival [45]. Based on these observations, our data indicate that methylation may play a role in embryonic development by regulating phosphorylation.

2.9. MTGs are Involved in the Cell Cycle, Apoptosis and Stem Cell Pluripotency

Silkworm embryonic cells are arrested in G2 at diapause, and cell cycles become slower in proportion to an increasing length of G1. Once diapause terminates, the embryos are competent to resume development at 25 °C, cells enter the M phase, and cell division then resumes in the embryos [38]. Based on this evidence, we hypothesized that embryonic development and diapause were related to cell cycle regulation. Here, KEGG pathway analyses showed that 16 MTGs were involved in G1/S transition of the mitotic cell cycle, regulation of apoptotic processes and signalling pathways regulating stem cell pluripotency (Table 5). Moreover, six MTGs were enriched in the G1/S transition of the mitotic cell cycle, and we observed that 101739208, a homologue of the G2/M phase-specific E3 ubiquitin-protein ligase (G2E3), was upregulated and hypermethylated. Alternately, diapause-destined embryos are arrested at gastrulation, which occurs two days after the germ-band formation stage (24 h after oviposition). At this stage, cell differentiation gradually ceases, and the embryo gradually forms [46]. KEGG analyses revealed that six MTGs were enriched in signalling pathways regulating stem cell pluripotency, which increased gene expression. Those MTGs can promote cell differentiation and organ formation in diapause-terminated eggs. Based on this evidence, these data suggest that diapause-destined eggs may regulate the cell cycle, apoptosis and stem cell pluripotency to terminate diapause via methylation.

3. Discussion

DNA methylation is one of the most widespread epigenetic markers in the genome and has been linked to insect development, specifically embryonic development [16,47]. Our previous study showed that BmDNMTs were highly expressed during embryonic development, especially at early embryonic stages; its expression was significantly upregulated in diapause-terminated eggs after HCl-treatment [40]. However, DNA methylation regulation in silkworm embryonic development and diapause still remains unclear. This study provided insights into the potential cytosine methylation in diapause-destined eggs and diapause-terminated eggs using WGBS in relation to methylation and embryonic development.
Overall, the levels of DNA methylation in most insects is <1% [28,48,49]. This research has shown ~0.21%–0.26% mC methylation levels on the total sequenced C sites, and more than ~98.5% mC methylation in CG sequences. Based on previous methylome studies in the silkworm, the average methylation levels in the mid-gut and fat body at mC methylation in the genome were approximately 1% [29], and ~0.11% for silk glands [28]. When comparing eggs, the mid-gut, fat body and silk gland, it has been shown that DNA methylation levels have tissue specificity in the silkworm. Moreover, mC rates in sequenced C sites were significantly increased in diapause-terminated eggs (HCl-treated) when compared with diapause-destined eggs (non-treated), and change in methylation levels mainly comes from CG sites but not from CHG and CHH sites. It is suggested that when compared with other plants and animals which have higher methylation levels at CHG and CHH sites [50,51], DNA methylation works primarily through CGs site in the silkworm.
DNA methylation generally functions as a repressive transcriptional signal, but it is also known to activate gene expression [52,53]. Here, we calculated methylation levels in the context of gene regions and ~2 kb upstream and downstream regions. Consistently, CG sites showed more regularity than CHG and CHH sites. CG methylation, but not CHG or CHH methylation, exhibited a characteristic peak in the body of protein-coding genes and showed significant increases after TSS and TES, which maintain low methylation levels. These results are similar to those previously reported for other species [54]. Moreover, CG methylation levels in the HCl-treated group were generally higher than those in the non-treated group. Thus, we speculate that CG methylation occurs in gene body regions, enhancing gene transcription for embryonic development.
To investigate the specific modification regions of DNA methyl groups in the silkworm genome, methylation profiles of genetic elements were analyzed, including CDS, downstream, upstream, exons, etc. Notably, methylation levels in all genetic elements were increased in HCl-treated samples when compared with non-treated samples, and methylation mainly occurred in coding sequences such as transcript, CDS and exons. Previous studies in silkworms have shown that CG methylation is substantially enriched in gene bodies and is positively correlated with gene expression levels, suggesting positive roles in gene transcription [26,28]. Therefore, hypermethylation of coding sequences may be positively associated with the terminating of diapause in silkworm embryos.
DNA methylation patterns are prevalent in TEs and REs [17]. Our results show that methylation in TEs, especially SINEs, DNA transposable, and RC are higher than in others. SINEs are an abundant class of TEs found in a wide variety of eukaryotes, mainly integrate into hypomethylated DNA regions and are targeted by methylases for de novo methylation [55,56,57]. Previous studies have shown that SINEs promote the amplification of gene enrichment region fragments or stress-induced gene expression, which increase gene expression [58]. Based on these analyses, hypermethylated SINEs may promote gene transcription and expression during embryo development.
Differentiation and organogenesis are two key phases of embryogenesis in the silkworm. Metabolic biosynthesis is also an essential activity during this period. Metabolic pathways were significantly activated after HCl-treatment, especially for glycogenolysis, protein synthesis and lipolysis. It is worth noting that HS6ST2 homologous gene (GeneID: LOC101737390) regulates energy metabolism and promoted embryonic development in Drosophila [59,60]. Moreover, the Pi3k60 homologous gene (GeneID: LOC100158253), which was upregulated and hypermethylated, reportedly promotes the decomposition of lipids into energy for embryonic development [61,62]. Thus, these results suggest that methylation modification may influence embryo development by regulating metabolic biosynthesis phases.
Enzyme inactivation via protein phosphorylation regulates embryo development during embryogenesis [44]. Here, six MTGs were identified as being involved in phosphatidylinositol signalling. These genes showed increased methylation and expression level in diapause-terminated eggs when compared with diapause-destined eggs. Ponnuvel et al. reported that enzyme inactivation via protein phosphorylation during early silkworm embryogenesis was followed by dephosphorylation in later stages [44]. On the other hand, INPP genes are important in regulating many cellular activities, including vesicle transport, cytoskeletal dynamics, protein synthesis, cell proliferation and survival and phosphatidylinositol signalling [45]. Here, Inpp5j, Inpp5e and Inpp3a, three of the six MTGs involved in the phosphatidylinositol dephosphorylation pathway, showed increased expression and methylation levels. It was also reported that Inpp5e promotes fundamental metabolism in fat body via phosphorylation [63]. These results indicate that phosphorylation pathways are activated after gene methylation, thereby promoting embryonic signal transduction, material synthesis and other key activities during embryo development.
Our previous data showed that embryonic cells are arrested in G2 at diapause, and cell cycles become slower in proportion to increasing G1 length. Once diapause terminates, the embryos resume development at 25 °C, cells enter M phase, and cell division resumes in the embryos [38]. GO analysis revealed that six MTGs were enriched in the G1/S transition of the mitotic cell cycle. It was interesting that gene 101739208, one of the six MTGs, was a homologue of the G2/M phase-specific E3 ubiquitin-protein ligase (G2E3) and was upregulated and hypermethylated by HCl-treatment. BS-PCR results showed that non-treated and HCl-treated sample methylation levels were 33.3% and 48.1%, respectively for G2E3 (Figure 9), consistent with WGBS data. Previous research has shown that G2E3 is essential for early embryonic development in preventing apoptotic death, and it strengthens the synthesis and transport of genetic material and energy in the M phase [64]. This indicates that hypermethylation is associated with embryonic diapause and may be regulated through the cell cycle and apoptosis inhibition.

4. Materials and Methods

4.1. Silkworm Feeding and Artificial Diapause Termination

Bivoltine silkworm strain P50 was maintained in the School of Life Sciences, Anhui Agricultural University, Hefei, China. Instar larvae were reared on fresh mulberry leaves at 25 ± 1 °C, 75 ± 5 % relative humidity, with a 12 h day/night cycle. Female moths were mated with males for more than five hours and then separated to allow the females to lay eggs. For artificial diapause termination, diapause-destined eggs were treated with 1.075 g/L HCl at 46 °C for 5 min, 24 h after oviposition. Eggs for incubation were maintained at 25 °C, and a 12 h light/12 h dark period was observed.

4.2. Sample Preparation for RNA-seq and WGBS

Diapause-destined eggs were collected 3 days after oviposition (non-HCl treated control group). Diapause-terminated eggs were treated with 1.075 g/L HCl at 46 °C for 5 min, 24 h after oviposition, which terminated the diapause at 48 h after HCl treatment (3 days after oviposition, experimental group). Each sample was taken from five individuals, and three duplicate samples were taken after mixing. Both experimental and control group eggs were collected on Day 3 following oviposition and quickly frozen in liquid nitrogen and subsequently powdered. Half of the samples from each powdered group were treated with Trizol reagent (Invitrogen, Carlsbad, CA, USA) to extract RNA for RNA-seq assay, and DNA was isolated from the other half using the DNeasy Blood and Tissue Kit (Qiagen, Dusseldorf, Germany) for WGBS assay.

4.3. WGBS

For WGBS, analyses were conducted by OE Biotech Co. Ltd. (Shanghai, China). DNA was fragmented by sonication in a Bioruptor (Diagenode, Brussels, Belgium) to a mean approximate size of 250 bp. This was followed by adding dA to the 3′ end by blunt-end cloning and methylated adaptor ligation. Ligated DNA was bisulfite-converted using the EZ DNA Methylation-Gold kit (ZYMO, Tustin, CA, USA). Different DNA fragment lengths were excised from a 2% agarose gel and purified and amplified by PCR. Finally, sequencing was performed using the Illumina Hiseq 4000 platform (Illumina, San Diego, CA, USA). After filtering, the clean data were mapped to the silkworm genome (B. mori assembly ASM15162v1) using the whole-genome bisulfite sequencing mapping program (BSMAP, v2.74) [65]. Then, mapping rates and bisulfite conversion rates were calculated for each sample.
Differentially methylated regions (DMRs) were identified by swDMR online software (http://122.228.158.106/swDMR/), which used a sliding-window approach. The window was 1000 bp, and the step length was 100 bp. The Fisher test was applied to detect significant DMRs, and the screened criteria as methylation differences ≥10%, Q value ≤ 0.05. After DMRs were identified, differentially methylated genes (DMGs) located in DMRs were characterized.

4.4. Transcriptome Analysis

Transcriptome sequencing and analyses were conducted by OE Biotech Co. Ltd. (Shanghai, China). Briefly, mRNA was enriched using oligonucleotide (dT) magnetic beads and fragmented at an elevated temperature. Double-stranded cDNA was synthesised and purified for each targeted fragment (200–500 bp). Libraries were constructed using TruSeq Stranded mRNA LTSample Prep Kit (Illumina, San Diego, CA, USA) according to manufacturer’s instructions. These libraries were then sequenced on the Illumina HiSeq X Ten sequencing platform, generating 125 bp/150 bp paired-end reads. Raw data (raw reads) were processed using Trimmomatic [66]. Reads containing poly-N tails and low-quality reads were removed to derive clean reads. These were then mapped to silkworm mRNA (B. mori assembly ASM15162v1) using HISAT2 (version 2.2.5, Johns Hopkins University, Washington, DC, USA) [67]. Differentially expressed genes (DEGs) were identified by EBseq (version 1.4.0, Bioconductor, Madison, Wisconsin, USA), with screened criteria as fold change ≥ 2 and p-values ≤ 0.05.

4.5. GO and KEGG Enrichment Analysis

Gene Ontology (GO) enrichment analyses of DMGs and DEGs were implemented by the GO-seq R package [68], where gene length biases was corrected. GO terms with corrected p-values < 0.05 were considered significantly enriched by DMGs and DEGs. The Kyoto Encyclopaedia of Genes and Genomes (KEGG: http://www.genome.jp/kegg/) [69] is a database that provides high-level function annotation for a diverse range of biological systems. The KOBAS software (version 3.0, Chinese Academy of Sciences, Beijing, China) was used to test for statistical enrichment of DMGs and DEGs in KEGG pathways [70]. KEGG pathway annotation and enrichment analyses were performed similar to GO analysis.

4.6. RT-qPCR and McrBC-qPCR Analysis

Total RNA for RNA-seq analyses was also used for RT-qPCR. The primers for RT-qPCR are shown (Supplementary Table S1). RT-qPCR reactions were performed in 25 μL reaction volumes containing SYBR Premix Ex Taq (TaKaRa, Dalian, China) according to manufacturer’s instructions. The reaction was performed in a CFX96TM Real-Time System (Bio-Rad, Hercules, CA, USA). Thermal cycling profiles consisted of an initial denaturation at 95 °C for the 30s and 40 cycles at 95 °C for 5 s and 60 °C for 30 s. GO and KEGG pathway analysis identified some important pathways that may be related to diapause; we then selected genes from these pathways for verification from the list of DEGs presented in Supplementary Table S2, based on their functions: CG14226 (101742044), CG7766 (101739131), DDX5 (101736027), ZFP39 (110385781), MBD4 (101740063), HIGD1A (101741941), G2E3 (101739208). For McrBC-qPCR, 1 µg of genomic DNA for WGBS was digested overnight with McrBC (New England Biolabs, MA, USA). The negative control was performed without GTP for digestion of the standard. qPCR was performed using 20 ng DNA as template. The qPCR process was the same as described earlier, and primers used are shown (Supplementary Table S1). Three independent experiments, with three technical replicates, were performed. All assays were performed in triplicate, and relative expression levels were calculated using the 2−ΔΔCt method [71]. Statistical analyses were conducted using analysis of variance (ANOVA) and a least significant difference (LSD) posteriori test using SPSS software (version 19.0, IBM, Chicago, USA).

4.7. Bisulfite Sequencing Validation of Different Methylation Genes

Genomic DNA was bisulfite-converted using the EZ DNA Methylation-Gold kit (ZYMO, Tustin, CA, USA) according to manufacturer’s instructions. Bisulfite-converted DNA was amplified by PCR using Premix Ex Taq™ Hot Start Version (TaKaRa, Dalian, China) according to manufacturer’s instructions. Primers for BS-PCR were designed using the online MethPrimer program (http://www.urogene.org/cgibin/methprimer2/Meth Primer.cgi) (Supplementary Table S1). PCR products were purified and cloned into the pMD19-T vector (TaKaRa, Dalian, China), and six clones, selected from each sample, were sent to Sangon Biotech Co. Ltd. (Shanghai, China) for sequencing. The sequencing results were analyzed using the online Quma software (http://quma.cdb.riken.jp/) for individual CG sites and DNA methylation levels.

5. Conclusions

In conclusion, epigenetic modification is a significant dimension to embryonic development in insects. Our findings revealed that methylation levels in diapause-terminated eggs were higher than in diapause-destined eggs in silkworm and that methylation sites in diapause-terminated eggs tended to be in coding sequences and promoter regions when compared with diapause-destined eggs. Most importantly, our result indicated that methylation was positively associated with embryonic development in silkworm, by regulating cell differentiation, cell cycle, metabolism, apoptosis and phosphorylation. These data will be useful in understanding molecular mechanisms underlying DNA methylation and gene expression changes during embryonic development and insect diapause.

Supplementary Materials

The following are available online at https://0-www-mdpi-com.brum.beds.ac.uk/1422-0067/21/2/671/s1. Figure S1: Percentage methylation levels of positively and negatively correlated genes in gene bodies, 2 kb upstream and downstream regions. Table S1: Primers used for PCR studies. Table S2: Details of 1733 differentially expressed genes (DEGs). Table S3: Bisulfite sequencing summary. Table S4: DMPs located in DMRs. Table S5: 364 genes showing significant differences in methylation and protein expression levels in diapause-terminated eggs when compared with diapause-destined eggs.

Author Contributions

Conceptualization, J.-P.X. and S.-J.H.; methodology, P.H.; software, L.-B.Z.; validation, L.-L.Y., H.-H.C. and J.W.; formal analysis, S.-Z.Z.; investigation, S.T.; resources, M.-H.L.; data curation, B.L.; writing—original draft preparation, B.L.; writing—review and editing, B.L.; visualization, B.L.; supervision, B.L.; project administration, P.H.; funding acquisition, P.H. All authors have read and agreed to the published version of the manuscript.

Funding

This research was funded by National Natural Science Foundation of China grant numbers (31973002,31472148), International Cooperation Project of Anhui Province grant numbers [1804b06020345], and Innovation Team Project of Anhui Academy of Agricultural Sciences grant numbers [2019YL030].

Conflicts of Interest

The authors declare no conflict of interest.

References

  1. Suzuki, M.M.; Bird, A. DNA methylation landscapes: Provocative insights from epigenomics. Nat. Rev. Genet. 2008, 9, 465–476. [Google Scholar] [CrossRef] [PubMed]
  2. Jones, P.A. Functions of DNA methylation: Islands, start sites, gene bodies and beyond. Nat. Rev. Genet. 2012, 13, 484–492. [Google Scholar] [CrossRef] [PubMed]
  3. Klose, R.J.; Bird, A.P. Genomic DNA methylation: The mark and its mediators. Trends Biochem. Sci. 2006, 31, 89–97. [Google Scholar] [CrossRef] [PubMed]
  4. Xu, Y.; Fu, Q.; Li, S.; He, N. Silkworm egg proteins at the germ-band formation stage and a functional analysis of BmEP80 protein. Insect Biochem. Mol. Biol. 2011, 41, 572–581. [Google Scholar] [CrossRef]
  5. Paulsen, M.; Ferguson-Smith, A.C. DNA methylation in genomic imprinting, development, and disease. J. Pathol. 2001, 195, 97–110. [Google Scholar] [CrossRef] [PubMed]
  6. Allen, M.L.; Koch, C.M.; Clelland, G.K.; Dunham, I.; Antoniou, M. DNA methylation-histone modification relationships across the desmin locus in human primary cells. BMC Mol. Biol. 2009, 10, 51. [Google Scholar] [CrossRef] [PubMed] [Green Version]
  7. Hellman, A.; Chess, A. Gene body-specific methylation on the active X chromosome. Science 2007, 315, 1141–1143. [Google Scholar] [CrossRef] [PubMed]
  8. Lister, R.; Mukamel, E.A.; Nery, J.R.; Urich, M.; Puddifoot, C.A.; Johnson, N.D.; Lucero, J.; Huang, Y.; Dwork, A.J.; Schultz, M.D. Global Epigenomic Reconfiguration during Mammalian Brain Development. Science 2013, 341, 1237905. [Google Scholar] [CrossRef] [PubMed] [Green Version]
  9. Bell, A.C.; Felsenfeld, G. Methylation of a CTCF-dependent boundary controls imprinted expression of the Igf2 gene. Nature 2000, 405, 482–485. [Google Scholar] [CrossRef]
  10. Lyko, F.; Foret, S.; Kucharski, R.; Wolf, S.; Falckenhayn, C.; Maleszka, R. The honey bee epigenomes: Differential methylation of brain DNA in queens and workers. PLoS Biol. 2011, 9, e1000506. [Google Scholar] [CrossRef]
  11. Rivière, G.; Wu, G.-C.; Fellous, A.; Goux, D.; Sourdaine, P.; Favrel, P. DNA Methylation Is Crucial for the Early Development in the Oyster, C. gigas. Mar. Biotechnol. 2013, 15, 739–753. [Google Scholar] [CrossRef] [PubMed]
  12. Jurkowska, R.Z.; Ceccaldi, A.; Zhang, Y.; Arimondo, P.B.; Jeltsch, A. DNA methyltransferase assays. Methods Mol. Biol. 2011, 791, 157–177. [Google Scholar] [PubMed]
  13. Goll, M.G.; Bestor, T.H. Eukaryotic cytosine methyltransferases. Annu. Rev. Biochem. 2005, 74, 481–514. [Google Scholar] [CrossRef] [PubMed] [Green Version]
  14. Goll, M.G.; Kirpekar, F.; Maggert, K.A.; Yoder, J.A.; Hsieh, C.L.; Zhang, X.; Golic, K.G.; Jacobsen, S.E.; Bestor, T.H. Methylation of tRNAAsp by the DNA methyltransferase homolog Dnmt2. Science 2006, 311, 395–398. [Google Scholar] [CrossRef] [PubMed] [Green Version]
  15. Guan, D.L.; Ding, R.R.; Hu, X.Y.; Yang, X.R.; Xu, S.Q.; Gu, W.; Zhang, M. Cadmium-induced genome-wide DNA methylation changes in growth and oxidative metabolism in Drosophila melanogaster. BMC Genom. 2019, 20, 356. [Google Scholar] [CrossRef] [PubMed] [Green Version]
  16. Glastad, K.M.; Hunt, B.G.; Goodisman, M.A. Evolutionary insights into DNA methylation in insects. Curr. Opin. Insect Sci. 2014, 1, 25–30. [Google Scholar] [CrossRef]
  17. Glastad, K.M.; Hunt, B.; Yi, S.; Goodisman, M. DNA methylation in insects: On the brink of the epigenomic era. Insect Mol. Biol. 2011, 20, 553–565. [Google Scholar] [CrossRef]
  18. Sarda, S.; Zeng, J.; Hunt, B.; Yi, S. The Evolution of Invertebrate Gene Body Methylation. Mol. Biol. Evol. 2012, 29, 1907–1916. [Google Scholar] [CrossRef] [Green Version]
  19. Hunt, B.G.; Glastad, K.M.; Yi, S.V.; Goodisman, M.A. The Function of Intragenic DNA Methylation: Insights from Insect Epigenomes. Integr. Comp. Biol. 2013, 53, 319–328. [Google Scholar] [CrossRef] [Green Version]
  20. Bewick, A.; Vogel, K.; Moore, A.; Schmitz, R. Evolution of DNA Methylation across Insects. Mol. Biol. Evol. 2016, 34, 654–665. [Google Scholar] [CrossRef] [Green Version]
  21. Wang, Y.; Jorda, M.; Jones, P.L.; Maleszka, R.; Ling, X.; Robertson, H.M.; Mizzen, C.A.; Peinado, M.A.; Robinson, G.E. Functional CpG Methylation System in a Social Insect. Science 2006, 314, 645–647. [Google Scholar] [CrossRef] [PubMed]
  22. Patalano, S.; Hore, T.A.; Reik, W.; Sumner, S. Shifting behaviour: Epigenetic reprogramming in eusocial insects. Curr. Opin. Cell Biol. 2012, 24, 367–373. [Google Scholar] [CrossRef] [PubMed]
  23. Li-Byarlay, H.; Li, Y.; Stroud, H.; Feng, S.; Newman, T.C.; Kaneda, M.; Hou, K.K.; Worley, K.C.; Elsik, C.G.; Wickline, S.A.; et al. RNA interference knockdown of DNA methyl-transferase 3 affects gene alternative splicing in the honey bee. Proc. Natl. Acad. Sci. USA 2013, 110, 12750–12755. [Google Scholar] [CrossRef] [PubMed] [Green Version]
  24. Chen, W.; Dong, Y.; Lin, L.; Saqib, H.S.A.; Ma, X.; Xu, X.; Zhang, L.; Jing, X.; Peng, L.; Wang, Y.; et al. Implication for DNA methylation involved in the host transfer of diamondback moth, Plutellaxylostella (L.). Arch. Insect Biochem. Physiol. 2019, 102, e21600. [Google Scholar]
  25. Wang, X.; Wheeler, D.; Avery, A.; Rago, A.; Werren, J.H. Function and Evolution of DNA Methylation in Nasonia vitripennis. PLoS Genet. 2013, 9, e1003872. [Google Scholar] [CrossRef] [Green Version]
  26. Xiang, H.; Li, X.; Dai, F.; Xu, X.; Tan, A.; Chen, L.; Zhang, G.; Ding, Y.; Li, Q.; Lian, J. Comparative methylomics between domesticated and wild silkworms implies possible epigenetic influences on silkworm domestication. BMC Genom. 2013, 14, 646. [Google Scholar] [CrossRef] [Green Version]
  27. Jones, C.M.; Lim, K.S.; Chapman, J.W.; Bass, C. Genome-Wide Characterisation of DNA Methylation in an Invasive Lepidopteran Pest, the Cotton Bollworm Helicoverpa armigera. G3 2018, 8, 779–787. [Google Scholar] [CrossRef] [Green Version]
  28. Xiang, H.; Zhu, J.D.; Chen, Q.; Dai, F.Y.; Li, X.; Li, M.W.; Zhang, H.Y.; Zhang, G.J.; Li, D.; Yang, D. Single base-resolution methylome of the silkworm reveals a sparse epigenomic map. Nat. Biotechnol. 2010, 28, 516–520. [Google Scholar] [CrossRef]
  29. Wu, P.; Jie, W.; Shang, Q.; Annan, E.; Jiang, X.; Hou, C.; Chen, T.; Guo, X. DNA methylation in silkworm genome may provide insights into epigenetic regulation of response to Bombyx moricypovirus infection. Sci. Rep. 2017, 7, 16013. [Google Scholar] [CrossRef] [Green Version]
  30. Uno, T.; Nomura, Y.; Nakamura, M.; Nakao, A.; Tajima, S.; Kanamaru, K.; Yamagata, H.; Iwanaga, Y. Expression, purification, and characterization of methyl DNA binding protein from Bombyx mori. J. Insect Sci. 2005, 5, 8. [Google Scholar]
  31. Mitsudome, T.; Mon, H.; Xu, J.; Li, Z.; Lee, J.M.; Patil, A.A.; Masuda, A.; Iiyama, K.; Morokuma, D.; Kusakabe, T. Biochemical characterization of maintenance DNA methyltransferase DNMT-1 from silkworm, Bombyx mori. Insect Biochem. Mol. Biol. 2015, 58, 55–65. [Google Scholar] [CrossRef]
  32. Patalano, S.; Vlasova, A.; Wyatt, C.; Ewels, P.; Camara, F.; Ferreira, P.; Asher, C.; Jurkowski, T.; Segonds-Pichon, A.; Bachman, M.; et al. Molecular signatures of plastic phenotypes in two eusocial insect species with simple societies. Proc. Natl. Acad. Sci. USA 2015, 112, 13970–13975. [Google Scholar] [CrossRef] [Green Version]
  33. Kay, S.; Skowronski, D.; Hunt, B.G. Developmental DNA methyltransferase expression in the fire ant Solenopsis invicta. Insect Sci. 2018, 25, 57–65. [Google Scholar] [CrossRef]
  34. Tauber, M.J.; Tauber, C.A. Insect Seasonality: Diapause Maintenance, Termination, and Postdiapause Development. J. Ann. Rev. Ent. 1976, 21, 81–107. [Google Scholar] [CrossRef]
  35. Kostál, V. Eco-physiological phases of insect diapause. J. Insect Physiol. 2006, 52, 113–127. [Google Scholar] [CrossRef]
  36. Ohtsuki, Y. Silkworm Eggs. In Japanese Society of Sericultural Science Ageneral Text Book of Sericulture Nihon SansiShinbun-Sha; Toyo Co. LTD: Tokyo, Japan, 1979; pp. 156–173. (In Japanese) [Google Scholar]
  37. Yamashita, O.; Yaginuma, T. Silkworm Eggs at Low Temperatures: Implications for Sericulture. In Insects at Low Temperature; Jieisha Corporation: Tokyo, Japan, 1991; pp. 424–445. [Google Scholar]
  38. Nakagaki, M.; Takei, R.; Nagashima, E.; Yaginuma, T. Cell cycles in embryos of the silkworm, Bombyx mori: G2-arrest at diapause stage. Dev. Genes Evol. 1991, 200, 223–229. [Google Scholar] [CrossRef] [PubMed]
  39. Sonobe, H.; Matsumoto, A.; Fukuzaki, Y.; Fujiwara, S. Carbohydrate metabolism and restricted oxygen supply in the eggs of the silkworm, Bombyx mori. J. Insect Physiol. 1979, 25, 381–388. [Google Scholar] [CrossRef]
  40. Li, B.; Hu, P.; Zhang, S.Z.; Toufeeq, S.; Wang, J.; Zhao, K.; Xu, X.; Xu, J.; Huang, S. DNA methyltransferase BmDnmt1 and BmDnmt2 in silkworm (Bombyx mori) and the regulation of silkworm embryonic development. Arch. Insect Biochem. Physiol. 2018, 100, e201529. [Google Scholar]
  41. Egger, G.; Wielscher, M.; Pulverer, W.; Kriegner, A.; Weinhäusel, A. DNA methylation testing and marker validation using PCR: Diagnostic applications. Expert Rev. Mol. Diagn. 2012, 12, 75–92. [Google Scholar] [CrossRef] [PubMed]
  42. Huang, H.; Liu, R.; Niu, Q.; Tang, K.; Zhang, B.; Zhang, H.; Chen, K.; Zhu, J.-K.; Lang, Z. Global increase in DNA methylation during orange fruit development and ripening. Proc. Natl. Acad. Sci. USA 2019, 116, 1430–1436. [Google Scholar] [CrossRef] [Green Version]
  43. Yamashita, O.; Yaginuma, T.; Hasegawa, K. Hormonal and metabolic control of egg diapause of the silkworm, Bombyx mori (Lepidoptera: Bombycidae). Entomol. Gen. 1981, 7, 195–211. [Google Scholar]
  44. Ponnuvel, K.M.; Murthy, G.N.; Awasthi, A.K.; Rao, G.; Vijayaprakash, N.B. Differential gene expression during early embryonic development in diapause and non-diapause eggs of multivoltine silkworm Bombyx mori. Indian J. Exp. Biol. 2010, 48, 1143–1151. [Google Scholar]
  45. Conduit, S.; Dyson, J.; Mitchell, C. Inositol polyphosphate 5-phosphatases; New players in the regulation of cilia and ciliopathies. FEBS Lett. 2012, 586, 2846–2857. [Google Scholar] [CrossRef] [PubMed] [Green Version]
  46. Nagy, L.; Riddiford, L.; Kiguchi, K. Morphogenesis in the Early Embryo of the Lepidopteran Bombyx mori. Dev. Biol. 1994, 165, 137–151. [Google Scholar] [CrossRef]
  47. Bewick, A.; Sanchez, Z.; Mckinney, E.; Moore, A.; Moore, P.; Schmitz, R. Gene-regulatory independent functions for insect DNA methylation. bioRxiv 2018. [Google Scholar] [CrossRef]
  48. Bonasio, R.; Li, Q.; Lian, J.; Mutti, N.S.; Jin, L.; Zhao, H.; Zhang, P.; Wen, P.; Xiang, H.; Ding, Y.; et al. Genome-wide and Caste-Specific DNA Methylomes of the Ants Camponotus floridanus and Harpegnathos saltator. Curr. Biol. 2012, 22, 1755–1764. [Google Scholar] [CrossRef] [Green Version]
  49. Mandrioli, M.; Volpi, N. The Genome of the Lepidopteran Mamestra brassicae has a Vertebrate-like Content of Methyl-cytosine. Genetica 2003, 119, 187–191. [Google Scholar] [CrossRef]
  50. Xu, J.; Zhou, S.; Gong, X.; Song, Y.; Van Nocker, S.; Ma, F.; Guan, Q. Single-Base Methylome Analysis Reveals Dynamic Epigenomic Differences Associated with Water Deficit in Apple. Plant Biotechnol. J. 2017, 16, 672–687. [Google Scholar] [CrossRef]
  51. Guo, H.; Zhu, P.; Yan, L.; Li, R.; Hu, B.; Lian, Y.; Yan, J.; Ren, X.; Lin, S.; Li, J.; et al. The DNA methylation landscape of human early embryos. Nature 2014, 511, 606–610. [Google Scholar] [CrossRef]
  52. Harris, C.J.; Scheibe, M.; Wongpalee, S.P.; Liu, W.; Cornett, E.M.; Vaughan, R.M.; Li, X.; Chen, W.; Xue, Y.; Zhong, Z.; et al. A DNA methylation reader complex that enhances gene transcription. Science 2018, 362, 1182. [Google Scholar] [CrossRef] [Green Version]
  53. Wang, X.; Li, Z.; Zhang, Q.; Li, B.; Lu, C.; Li, W.; Cheng, T.; Xia, Q.; Zhao, P. DNA methylation on N6-adenine in lepidopteran Bombyx mori. Biochim. Biophys. Acta 2018, 1861, 815–825. [Google Scholar] [CrossRef] [PubMed]
  54. Feng, S.; Shawn, C.; Zhang, X.; Chen, P.-Y.; Bostick, M.; Mary, G.; Hetzel, J.; Jain, J.; Steven, S.; Marnie, H. Conservation and divergence of methylation patterning in plants and animals. Proc. Natl. Acad. Sci. USA 2010, 107, 8689–8694. [Google Scholar] [CrossRef] [PubMed] [Green Version]
  55. Arnaud, P.; Goubely, C.; Pélissier, T.; Deragon, J.M. SINE retroposons can be used in vivo as nucleation centers for de novo methylation. Mol. Cell. Biol. 2000, 20, 3434–3441. [Google Scholar] [CrossRef] [PubMed]
  56. Hasse, A.; Schulz, W.A. Enhancement of reporter gene de novo methylation by DNA fragments from the alpha-fetoprotein control region. J. Biol. Chem. 1994, 269, 1821–1826. [Google Scholar] [PubMed]
  57. Yates, P.A.; Burman, R.W.; Mummaneni, P.; Krussel, S.; Turker, M.S. Tandem B1 elements located in a mouse methylation center provide a target for de novo DNA methylation. J. Biol. Chem. 1999, 274, 36357–36361. [Google Scholar] [CrossRef] [Green Version]
  58. Bailey, J.A.; Ge, L.; Eichler, E.E. An Alu transposition model for the origin and expansion of human segmental duplications. J. Am. J. Hum. Genet. 2003, 73, 823–834. [Google Scholar] [CrossRef] [Green Version]
  59. Zhang, C.X.; Lee, M.P.; Chen, A.D.; Brown, S.D.; Hsieh, T.S. Isolation and characterization of a Drosophila gene essential for early embryonic development and formation of cortical cleavage furrows. J. Cell Biol. 1996, 134, 923–934. [Google Scholar] [CrossRef] [Green Version]
  60. Loncar, D.; Singer, S. Tyrosine phosphorylation accompanying the cellularization of the syncytial blastoderm of Drosophila. Proc. Natl. Acad. Sci. USA 1995, 92, 8154–8157. [Google Scholar] [CrossRef] [Green Version]
  61. Denisenko, O.N.; Bomsztyk, K. The product of the murine homolog of the Drosophila extra sex combs gene displays transcriptional repressor activity. Mol. Cell. Biol. 1997, 17, 4707–4717. [Google Scholar] [CrossRef] [Green Version]
  62. Schlitt, T.; Brazma, A. Current approaches to gene regulatory network modeling. BMC Bioinform. 2007, 8, S9. [Google Scholar] [CrossRef] [Green Version]
  63. Song, L.; Wang, F.; Dong, Z.; Hua, X.; Xia, Q. Label-free quantitative phosphoproteomic profiling of cellular response induced by an insect cytokine paralytic peptide. J. Proteom. 2016, 154, 49–58. [Google Scholar] [CrossRef] [PubMed]
  64. Brooks, W.; Helton, E.; Banerjee, S.; Venable, M.; Johnson, L.; Schoeb, T.R.; Kesterson, R.F.; Crawford, D. G2E3 Is a Dual Function Ubiquitin Ligase Required for Early Embryonic Development. J. Biol. Chem. 2008, 283, 22304–22315. [Google Scholar] [CrossRef] [PubMed] [Green Version]
  65. Xi, Y.; Li, W. BSMAP: Whole genome bisulfite sequence MAP ping program. BMC Bioinform. 2009, 10, 232. [Google Scholar] [CrossRef] [PubMed] [Green Version]
  66. Bolger, A.M.; Marc, L.; Bjoern, U. Trimmomatic: A flexible trimmer for Illumina sequence data. Bioinformatics 2014, 30, 2114–2120. [Google Scholar] [CrossRef] [PubMed] [Green Version]
  67. Kim, D.; Langmead, B.; Salzberg, S.L. HISAT: A fast spliced aligner with low memory requirements. Nat. Methods 2015, 12, 357–360. [Google Scholar] [CrossRef] [PubMed] [Green Version]
  68. Young, M.D.; Wakefield, M.J.; Smyth, G.K.; Oshlack, A. Gene ontology analysis for RNA-seq: Accounting for selection bias. Genome Biol. 2010, 11, R14. [Google Scholar] [CrossRef] [PubMed] [Green Version]
  69. Kanehisa, M.; Araki, M.; Goto, S.; Hattori, M.; Hirakawa, M.; Itoh, M.; Katayama, T.; Kawashima, S.; Okuda, S.; Tokimatsu, T.; et al. KEGG for linking genomes to life and the environment. Nucleic Acids Res. 2007, 36, D480–D484. [Google Scholar] [CrossRef] [PubMed]
  70. Mao, X.; Cai, T.; Olyarchuk, J.G.; Wei, L. Automated genome annotation and pathway identification using the KEGG Orthology (KO) as a controlled vocabulary. Bioinformatics 2005, 21, 3787–3793. [Google Scholar] [CrossRef]
  71. Yu, S.; Liu, H.; Luo, L. Analysis of relative gene expression using different real-time quantitative PCR. Acta Agron. Sin. 2007, 12, 1214–1218. [Google Scholar]
Figure 1. Enrichment analysis of differentially expressed genes (DEGs) following HCl treatment. (A) Annotation of DEGs with GO enrichment. Gene numbers and percentages are listed for each category. (B) Kyoto Encyclopaedia of Genes and Genomes (KEGG) pathway enrichment of DEGs. The red and green bars represent upregulated and downregulated genes, respectively, and the number represents the percentage of genes.
Ijms 21 00671 g001
Figure 2. Analysis of methyltransferase expression. The expression fold change of BmDnmt1 and BmDnmt2 by qRT-PCR and RNA-seq, respectively, comparing diapause-terminated eggs with diapause-destined eggs.
Ijms 21 00671 g002
Figure 3. Analysis of methylation levels and methylation sites of different samples. Percentage methylation in different samples (A) and the numbers of different methylation sites (B). Three biological replicates comprised each sample type. Significant differences are indicated by ** p < 0.01.
Ijms 21 00671 g003
Figure 4. Validation of RNA-seq and whole-genome sequencing coupled with bisulfite DNA treatment (WGBS). Three genes that were significantly upregulated (101742044, 101739131 and 101739208) and three genes that were significantly downregulated (110385781, 101740063 and 101741941) from RNA-seq analyses were selected for mRNA quantification using RT-qPCR (A). DNA methylation levels of the hypermethylated gene, (101739208) and the hypomethylated gene, (110385781) from our WGBS were analyzed using methylation-sensitive McrBC-qPCR (B). Methylated DNA was digested by McrBC; thus, higher qPCR signals indicate lower methylation levels, and lower qPCR signals indicate higher methylation levels. Significant differences are indicated by ** p < 0.01 and * p < 0.05.
Ijms 21 00671 g004
Figure 5. DNA methylation patterns in different genomic regions. Methylation percentages of different genetic elements, including CDS, downstream, exon, gene, intergenic, intron, inc-RNA, miRNA, mRNA, transcript, and upstream (A). Methylation percentages of transposon elements (TEs) and repeat elements (REs) (B). DNA, long interspersed nuclear elements (LINE), short interspersed nuclear elements (SINE), retrotransposons (RC) and long terminal repeats (LTR) are classified as TE, and Simple_repeat, Low_complexity, satellite and RNA are classified as RE.
Ijms 21 00671 g005
Figure 6. Percentage methylation levels in gene bodies and 2 kb upstream and downstream regions. Different coloured lines represent different experimental repetitions.
Ijms 21 00671 g006
Figure 7. KEGG pathway enrichment of different methylation genes (DMGs) and differentially methylated promoters (DMPs) following HCl treatment. KEGG pathway enrichment of DMGs located in differentially methylated regions (DMRs) (A). DMPs located in DMRs (B). The circle size represents gene numbers, and the colour represents the Q value.
Ijms 21 00671 g007aIjms 21 00671 g007b
Figure 8. Distribution and functional enrichment analysis of significant differences in methylation and expression levels in methylome- and transcriptome-associated genes (MTGs). The distribution of MTGs in four different quadrants; the number in each quadrant refers to the number of MTGs in that quadrant (A). MTGs were classified into cellular components, molecular function and biological processes by WEGO according to GO terms (B). KEGG pathway enrichment of MTGs. The circle size represents gene numbers, and the colour represents the Q value (C).
Ijms 21 00671 g008aIjms 21 00671 g008b
Figure 9. Bisulfite sequencing validation of the hypermethylated gene, G2E3 (101739208).The number indicates the CG position of the target gene, and the percentage represents the statistical mean methylation level of the CG site or the whole CG site. Dark circles indicate CG site methylation, and open circles refer to unmethylated cytosines. Each row consists of a single sequenced clone.
Ijms 21 00671 g009
Table 1. Statistical analysis of RNA-seq data obtained of diapause-destined eggs (non-treated) and diapause-terminated eggs (HCl-treated).
SampleNameRaw ReadsClean ReadsClean BasesTotal Mapped≥Q30GC Content
HCl-treated_148,961,25647,914,2317,012,354,12495.49%95.17%43.33%
HCl-treated_249,151,34648,032,3147,032,354,78595.33%95.02%43.62%
HCl-treated_349,564,52148,462,3457,094,523,65195.41%95.00%43.46%
Non-treated_149,254,25648,108,6597,045,898,54195.33%94.88%43.63%
Non-treated_249,422,34548,188,7547,034,562,54794.78%94.84%43.77%
Non-treated_349,802,14548,657,8547,117,854,21695.11%95.03%43.66%
HCl-treated vs. Non-treatedDEGsUpregulatedDownregulated
Quantity1732856876
Table 2. Summary ofWGBSdataof diapause-destined eggs (Non-treated) and diapause-terminated eggs (HCl-treated).
Samples NameClean ReadsClean BaseClean Reads PercentageClean Base PercentageGC Content>Q30
Non-treated_193,793,43013,090,963,53398.79%98.49%19.29%94.81%
Non-treated_296,273,27813,450,975,09698.08%97.88%19.27%92.81%
Non-treated_392,904,77212,983,974,04298.08%97.91%19.22%92.82%
HCl-treated_198,947,49013,832,834,27498.03%97.89%19.18%92.85%
HCl-treated_295,316,26013,313,691,16898.38%98.15%19.26%93.48%
HCl-treated_389,068,59612,445,567,79498.12%97.93%19.26%92.95%
Table 3. Methylomes- and transcriptome-associated genes involved in metabolism biosynthesis.
GeneIDSynonymMethylation Difference Level (%)Methylation p-ValueExpression FoldchangeExpression p-ValueDescription
N-glycan biosynthesis
LOC101745965FucT615.196632.85 × 10−254.2330248.12 × 10−23alpha-(1,6)-fucosyltransferase-like [Bombyx mori (domestic silkworm)]
LOC101739008ALG917.210881.25 × 10−252.3061666.43 × 10−28alpha-1,2-mannosyltransferase ALG9 [Bombyx mori (domestic silkworm)]
LOC101742247Stt3b22.276472.30 × 10102.1254943.94 × 10−28dolichyl-diphosphooligosaccharide--protein glycosyltransferase subunit STT3B [Bombyx mori (domestic silkworm)]
LOC101744335alpha-Man-Ia12.07253.80 × 1072.0245851.34 × 1017mannosyl-oligosaccharide alpha-1,2-mannosidase IA [Bombyx mori (domestic silkworm)]
LOC101742043GmII10.323765.80 × 10162.11352.50 × 1065alpha-mannosidase 2 [Bombyx mori (domestic silkworm)]
Glycosaminoglycan biosynthesis—heparan sulfate/heparin
LOC101741346EXT222.14261.38 × 10162.3969937.06 × 106exostosin-2 [Bombyx mori (domestic silkworm)]
LOC101736578Hs2st21.048413.40 × 10152.2988922.05 × 1014heparin sulfate O-sulfotransferase [Bombyx mori (domestic silkworm)]
LOC101737390HS6ST221.026521.21 × 1083.1996664.66 × 107heparan-sulfate 6-O-sulfotransferase 2 [Bombyx mori (domestic silkworm)]
Glutathione metabolism
LOC101745413Oplah14.924352.49 × 1062.4055763.76 × 10145-oxoprolinase [Bombyx mori (domestic silkworm)]
LOC101742094Srm10.355051.84 × 10−52.1813863.31 × 1011spermidine synthase [Bombyx mori (domestic silkworm)]
LOC692521GSTd211.335475.47 × 1050.4262641.12 × 1013glutathione S-transferase delta 2[Bombyx mori (domestic silkworm)]
LOC100862776Ggt112.96592.17 × 1070.1496419.93 × 1042gamma-glutamyl transpeptidase [Bombyx mori (domestic silkworm)]
Regulation of lipolysis in adipocytes
LOC101737606Ac76E10.186635.91 × 1057.1396071.27 × 106adenylate cyclase type 2 [Bombyx mori (domestic silkworm)]
LOC101745072irs1-b23.611611.20 × 10122.8518512.82 × 1020insulin receptor substrate 1-B [Bombyx mori (domestic silkworm)]
LOC100158253Pi3k6020.16118.42 × 10132.097167.71 × 1044phosphatidylinositol 3-kinase 60 [Bombyx mori (domestic silkworm)]
Biosynthesis of amino acids
LOC101740956ACO125.618427.63 × 1082.1711176.59 × 1024cytoplasmic aconitate hydratase [Bombyx mori (domestic silkworm)]
LOC101740405Gs217.494323.22 × 10120.4384154.33 × 1029glutamine synthetase 2 cytoplasmic [Bombyx mori (domestic silkworm)]
LOC101743550Ald24.493321.70 × 10140.4363755.81 × 1037fructose-bisphosphate aldolase [Bombyx mori (domestic silkworm)]
LOC101738188argF20.620895.46 × 1090.2304641.88 × 1079ornithine carbamoyltransferase-like [Bombyx mori (domestic silkworm)]
LOC101738186ACO217.06176.27 × 10140.4156940probable aconitate hydratase, mitochondrial [Bombyx mori (domestic silkworm)]
Glyoxylate and dicarboxylate metabolism
LOC101740956ACO125.618427.63 × 1082.1711176.59 × 1024cytoplasmic aconitate hydratase [Bombyx mori (domestic silkworm)]
LOC101740405Gs217.494323.22 × 10120.4384154.33 × 1029glutamine synthetase 2 cytoplasmic [Bombyx mori (domestic silkworm)]
LOC101738186ACO217.06176.27 × 10140.4156940probable aconitate hydratase, mitochondrial [Bombyx mori (domestic silkworm)]
Table 4. Methylomes- and transcriptome-associated genes involved in phosphorylation.
GeneIDSynonymMethylation Difference Level (%)Methylation p-ValueExpression FoldchangeExpression p-ValueDescription
Phosphatidylinositol-signaling system
LOC101740091Inpp5e29.185550.0004963.3781166.58 × 10672 kDa inositol polyphosphate 5-phosphatase [Bombyx mori (domestic silkworm)]
LOC101740803Inpp5j22.429521.11 × 1062.7017476.94 × 109inositol polyphosphate 5-phosphatase K [Bombyx mori (domestic silkworm)]
LOC101745952PTEN14.486837.92 × 1062.5406077.55 × 1075phosphatidylinositol 3,4,5-trisphosphate 3-phosphatase and dual-specificity protein phosphatase PTEN [Bombyx mori (domestic silkworm)]
LOC101735646Plce116.957427.17 × 10282.19777.13 × 10101-phosphatidylinositol 4,5-bisphosphate phosphodiesterase epsilon-1 [Bombyx mori (domestic silkworm)]
LOC100158253Pi3k6020.16118.42 × 10132.097167.71 × 1044phosphatidylinositol 3-kinase 60 [Bombyx mori (domestic silkworm)]
LOC101743221Inpp5a22.182423.06 × 10192.0350927.69 × 108type I inositol 1,4,5-trisphosphate 5-phosphatase [Bombyx mori (domestic silkworm)]
Table 5. Methylomes- and transcriptome-associated genes involved in cell cycle and apoptosis.
GeneIDSynonymMethylation Difference Level (%)Methylation p-ValueExpression FoldchangeExpression p-ValueDescription
G1/S transition of mitotic cell cycle
LOC101746803Phf822.762161.34 × 1094.5397739.05 × 1012histone lysine demethylase PHF8 [Bombyx mori (domestic silkworm)]
LOC 100216493Cyce16.979836.34 × 1062.8688051.35 × 1097cyclin E [Bombyx mori (domestic silkworm)]
LOC101741790SKP226.220850.0017722.0905569.75 × 1024S-phase kinase-associated protein 2 [Bombyx mori (domestic silkworm)]
LOC101738704ACVR113.235111.51 × 1052.0287225.10 × 1059activin receptor type-1 [Bombyx mori (domestic silkworm)]
Regulation of apoptotic process
LOC101742044CG1422610.697761.84 × 10115.62814.06 × 1093cytokine receptor [Bombyx mori (domestic silkworm)]
LOC101739208G2e316.074842.73 × 10142.6191974.72 × 1051G2/M phase-specific E3 ubiquitin-protein ligase [Bombyx mori (domestic silkworm)]
LOC101745221DLG511.600661.46 × 10062.1414836.91 × 1051disks large homolog 5 [Bombyx mori (domestic silkworm)]
LOC101741790SKP226.220850.0017722.0905569.75 × 1024S-phase kinase-associated protein 2 [Bombyx mori (domestic silkworm)]
LOC101740336Sh3kbp122.786330.0010782.0272842.31 × 1045CD2-associated protein [Bombyx mori (domestic silkworm)]
LOC101738660Ppid21.546473.27 × 10190.4807886.92 × 1053peptidyl-prolyl cis-trans isomerase D [Bombyx mori (domestic silkworm)]
Signaling pathways regulating pluripotency of stem cells
LOC101742798Mad12.839380.0016864.3225942.95 × 1021protein mothers against dpp [Bombyx mori (domestic silkworm)]
LOC101744534BMPR223.00321.24 × 1064.0903612.39 × 1030probable serine/threonine-protein kinase DDB_G0278901 [Bombyx mori (domestic silkworm)]
LOC101740154RIF112.92232.47 × 1092.9240234.05 × 1019telomere-associated protein RIF1 [Bombyx mori (domestic silkworm)]
LOC100158253Pi3k6020.16118.42 × 10132.097167.71 × 1044phosphatidylinositol 3-kinase 60 [Bombyx mori (domestic silkworm)]
LOC101735864KIAA044515.48568.89 × 1072.0644352.90 × 1047SWI/SNF-related matrix-associated actin-dependent regulator of chromatin subfamily A containing DEAD/H box 1 homolog [Bombyx mori (domestic silkworm)]
LOC101738704ACVR113.235111.51 × 1052.0287225.10 × 1059activin receptor type-1 [Bombyx mori (domestic silkworm)]

