Glycine Receptor Inhibition Differentially Affect Selected Neuronal Populations of the Developing Embryonic Cortex, as Evidenced by the Analysis of Spontaneous Calcium Oscillations

 , ,
, ,  and
and 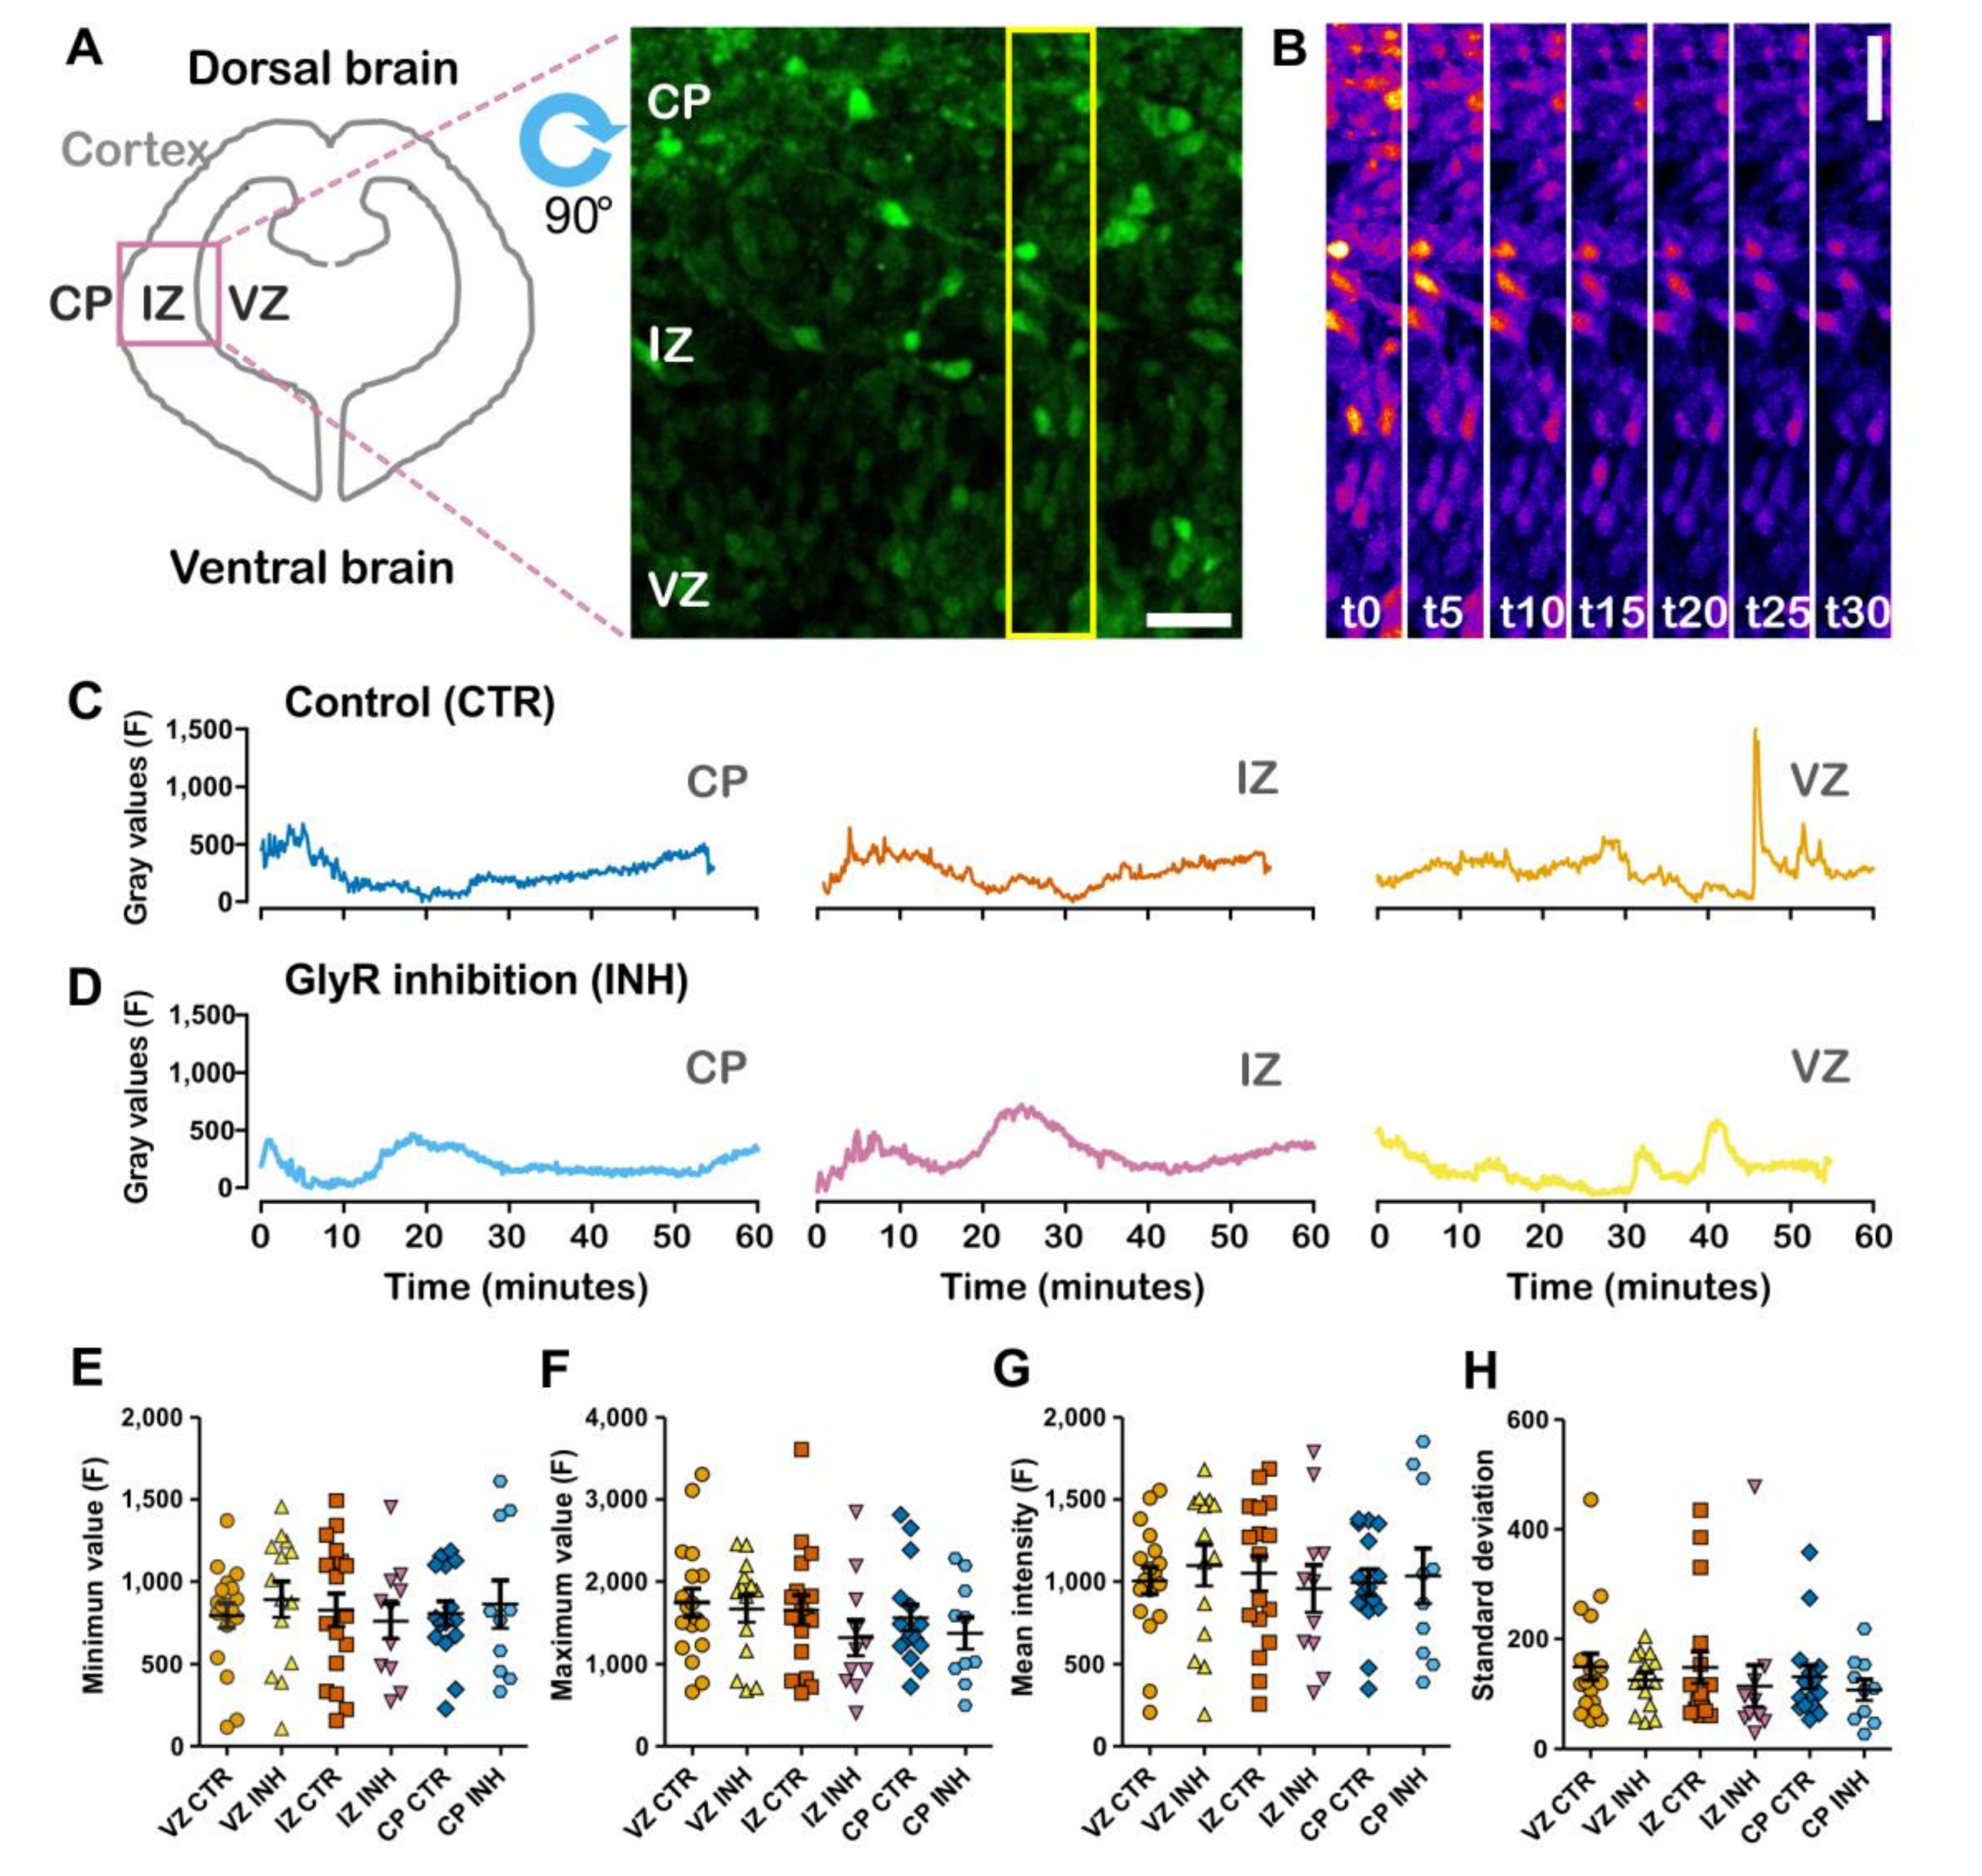
Abstract
:1. Introduction
2. Results
2.1. Spontaneous Calcium Activity in Developing Cortical Projection Neurons Is Differentially Affected along the Cortical Wall by the Inhibition of Glycinergic Neurotransmission
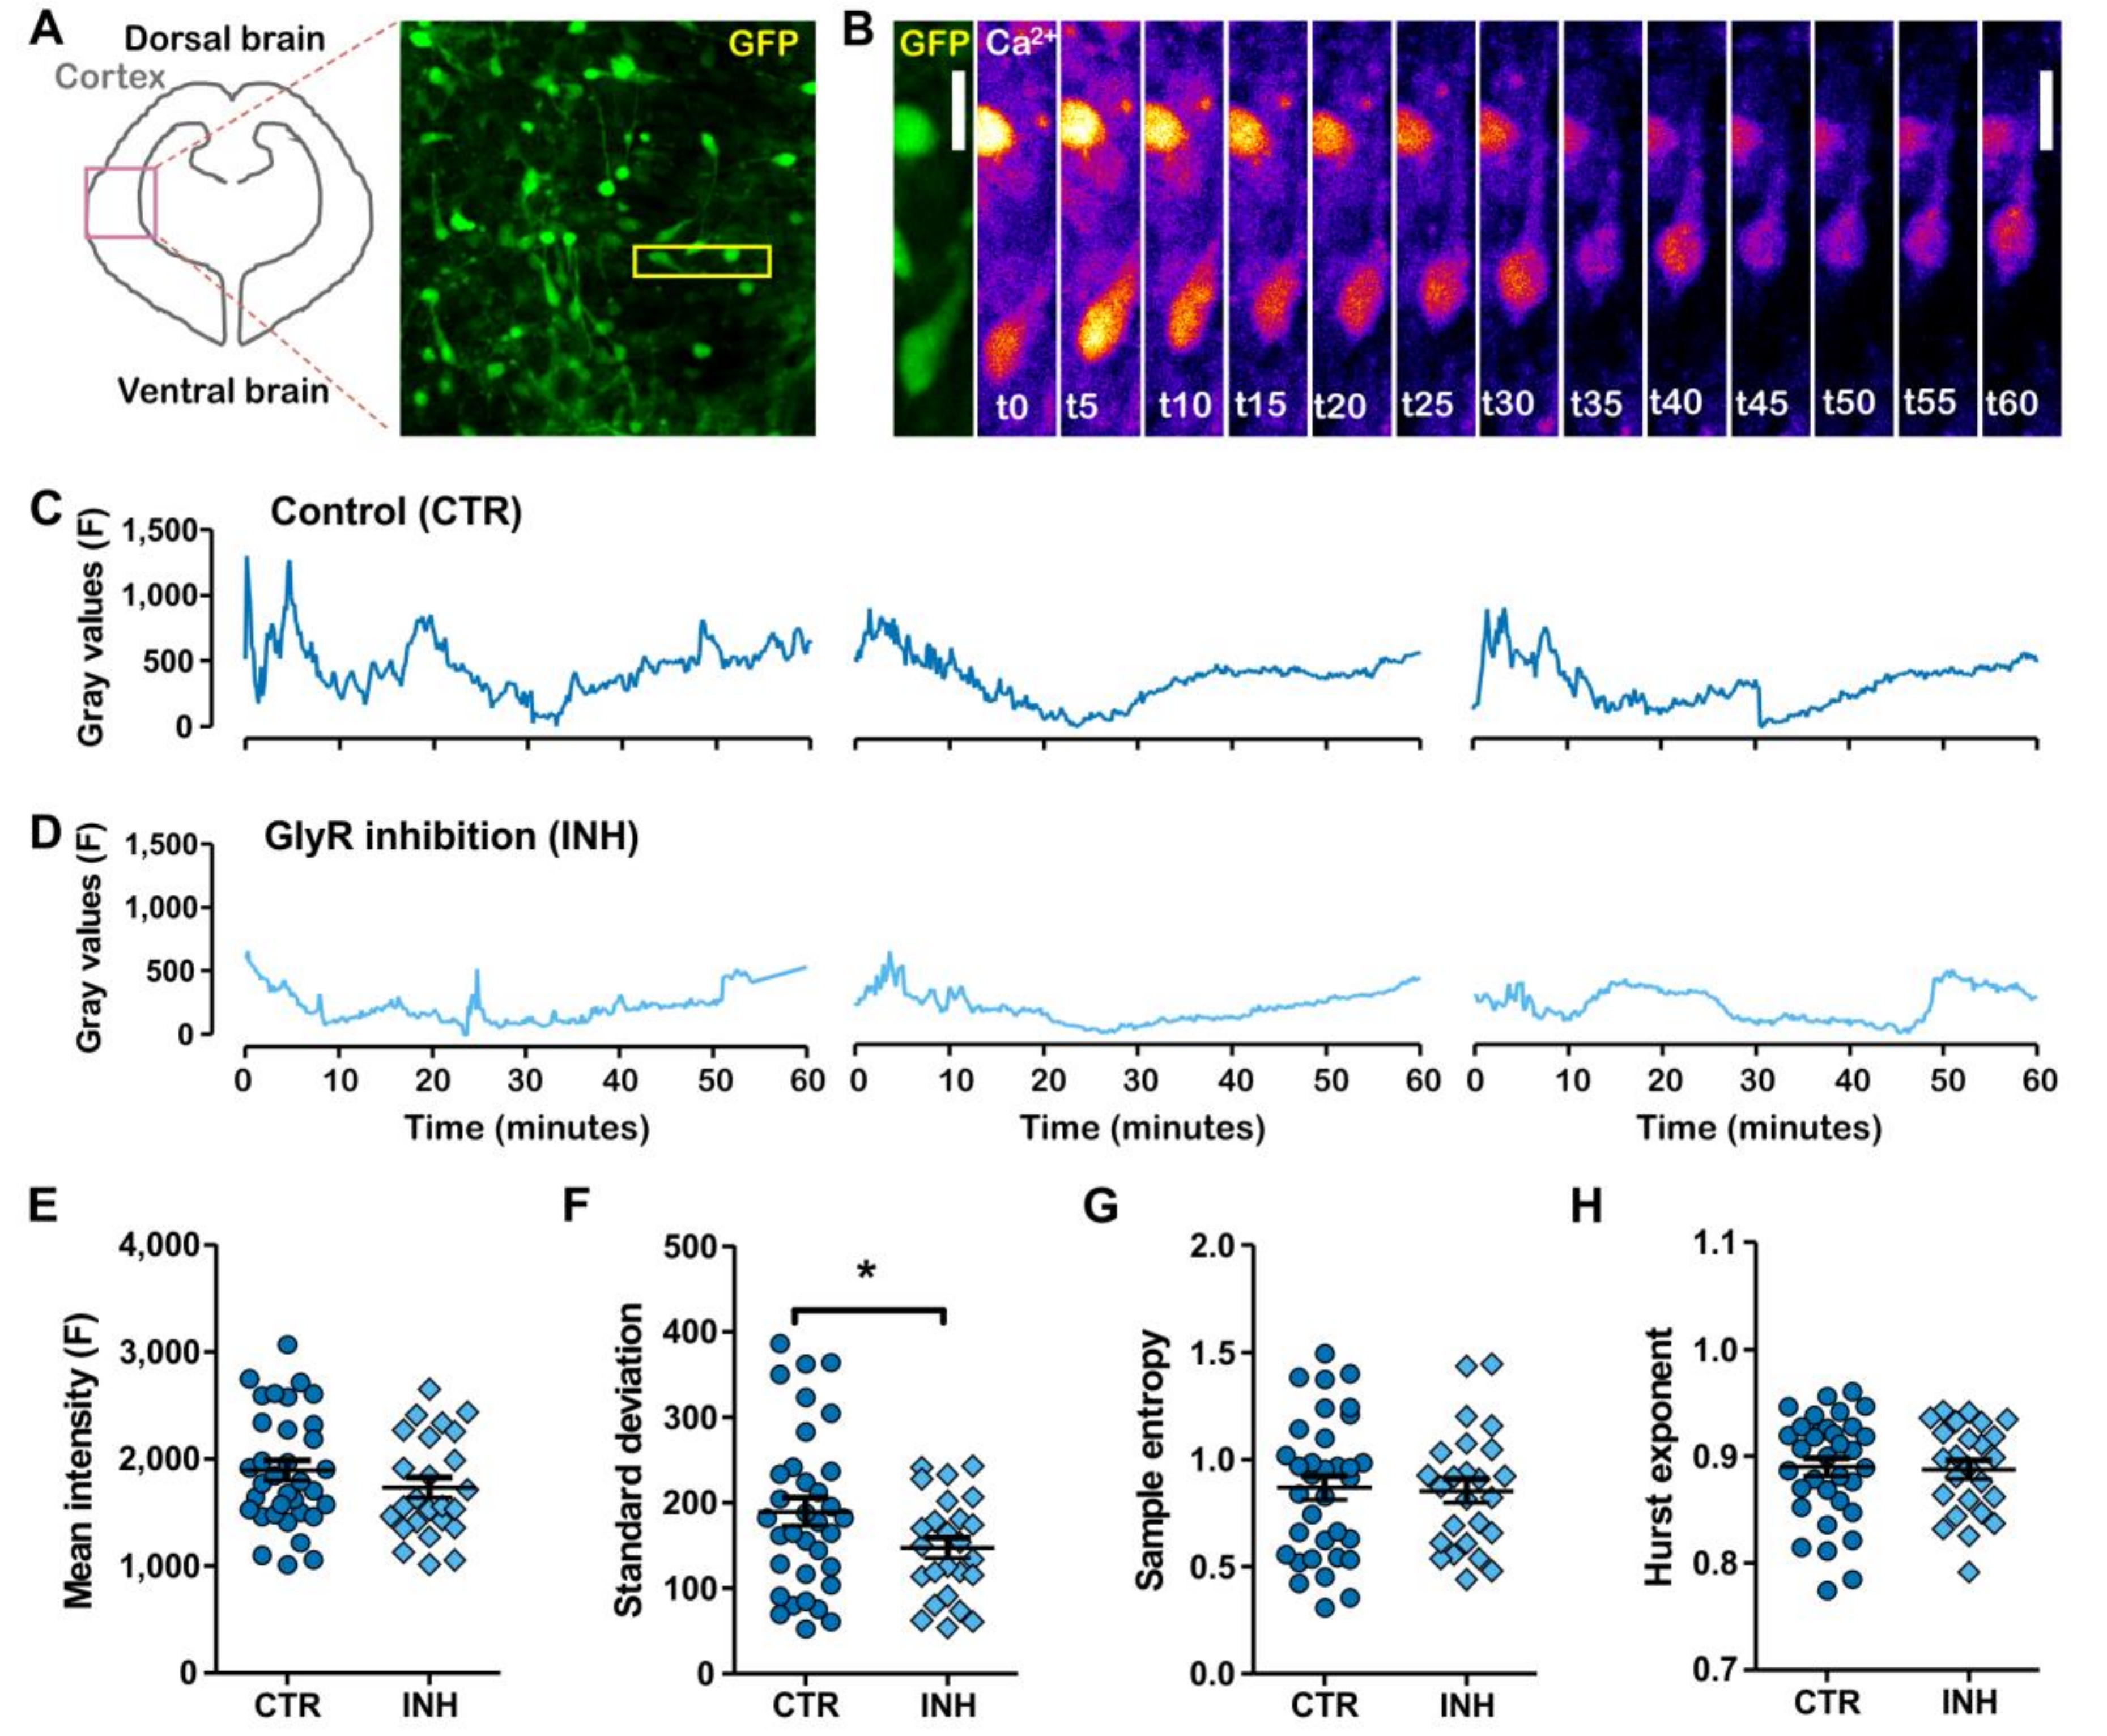
2.2. Migratory Interneurons Display Irregular Spontaneous Calcium Oscillations That Fluctuate in a Narrower Range upon Glycine Receptor Blockage
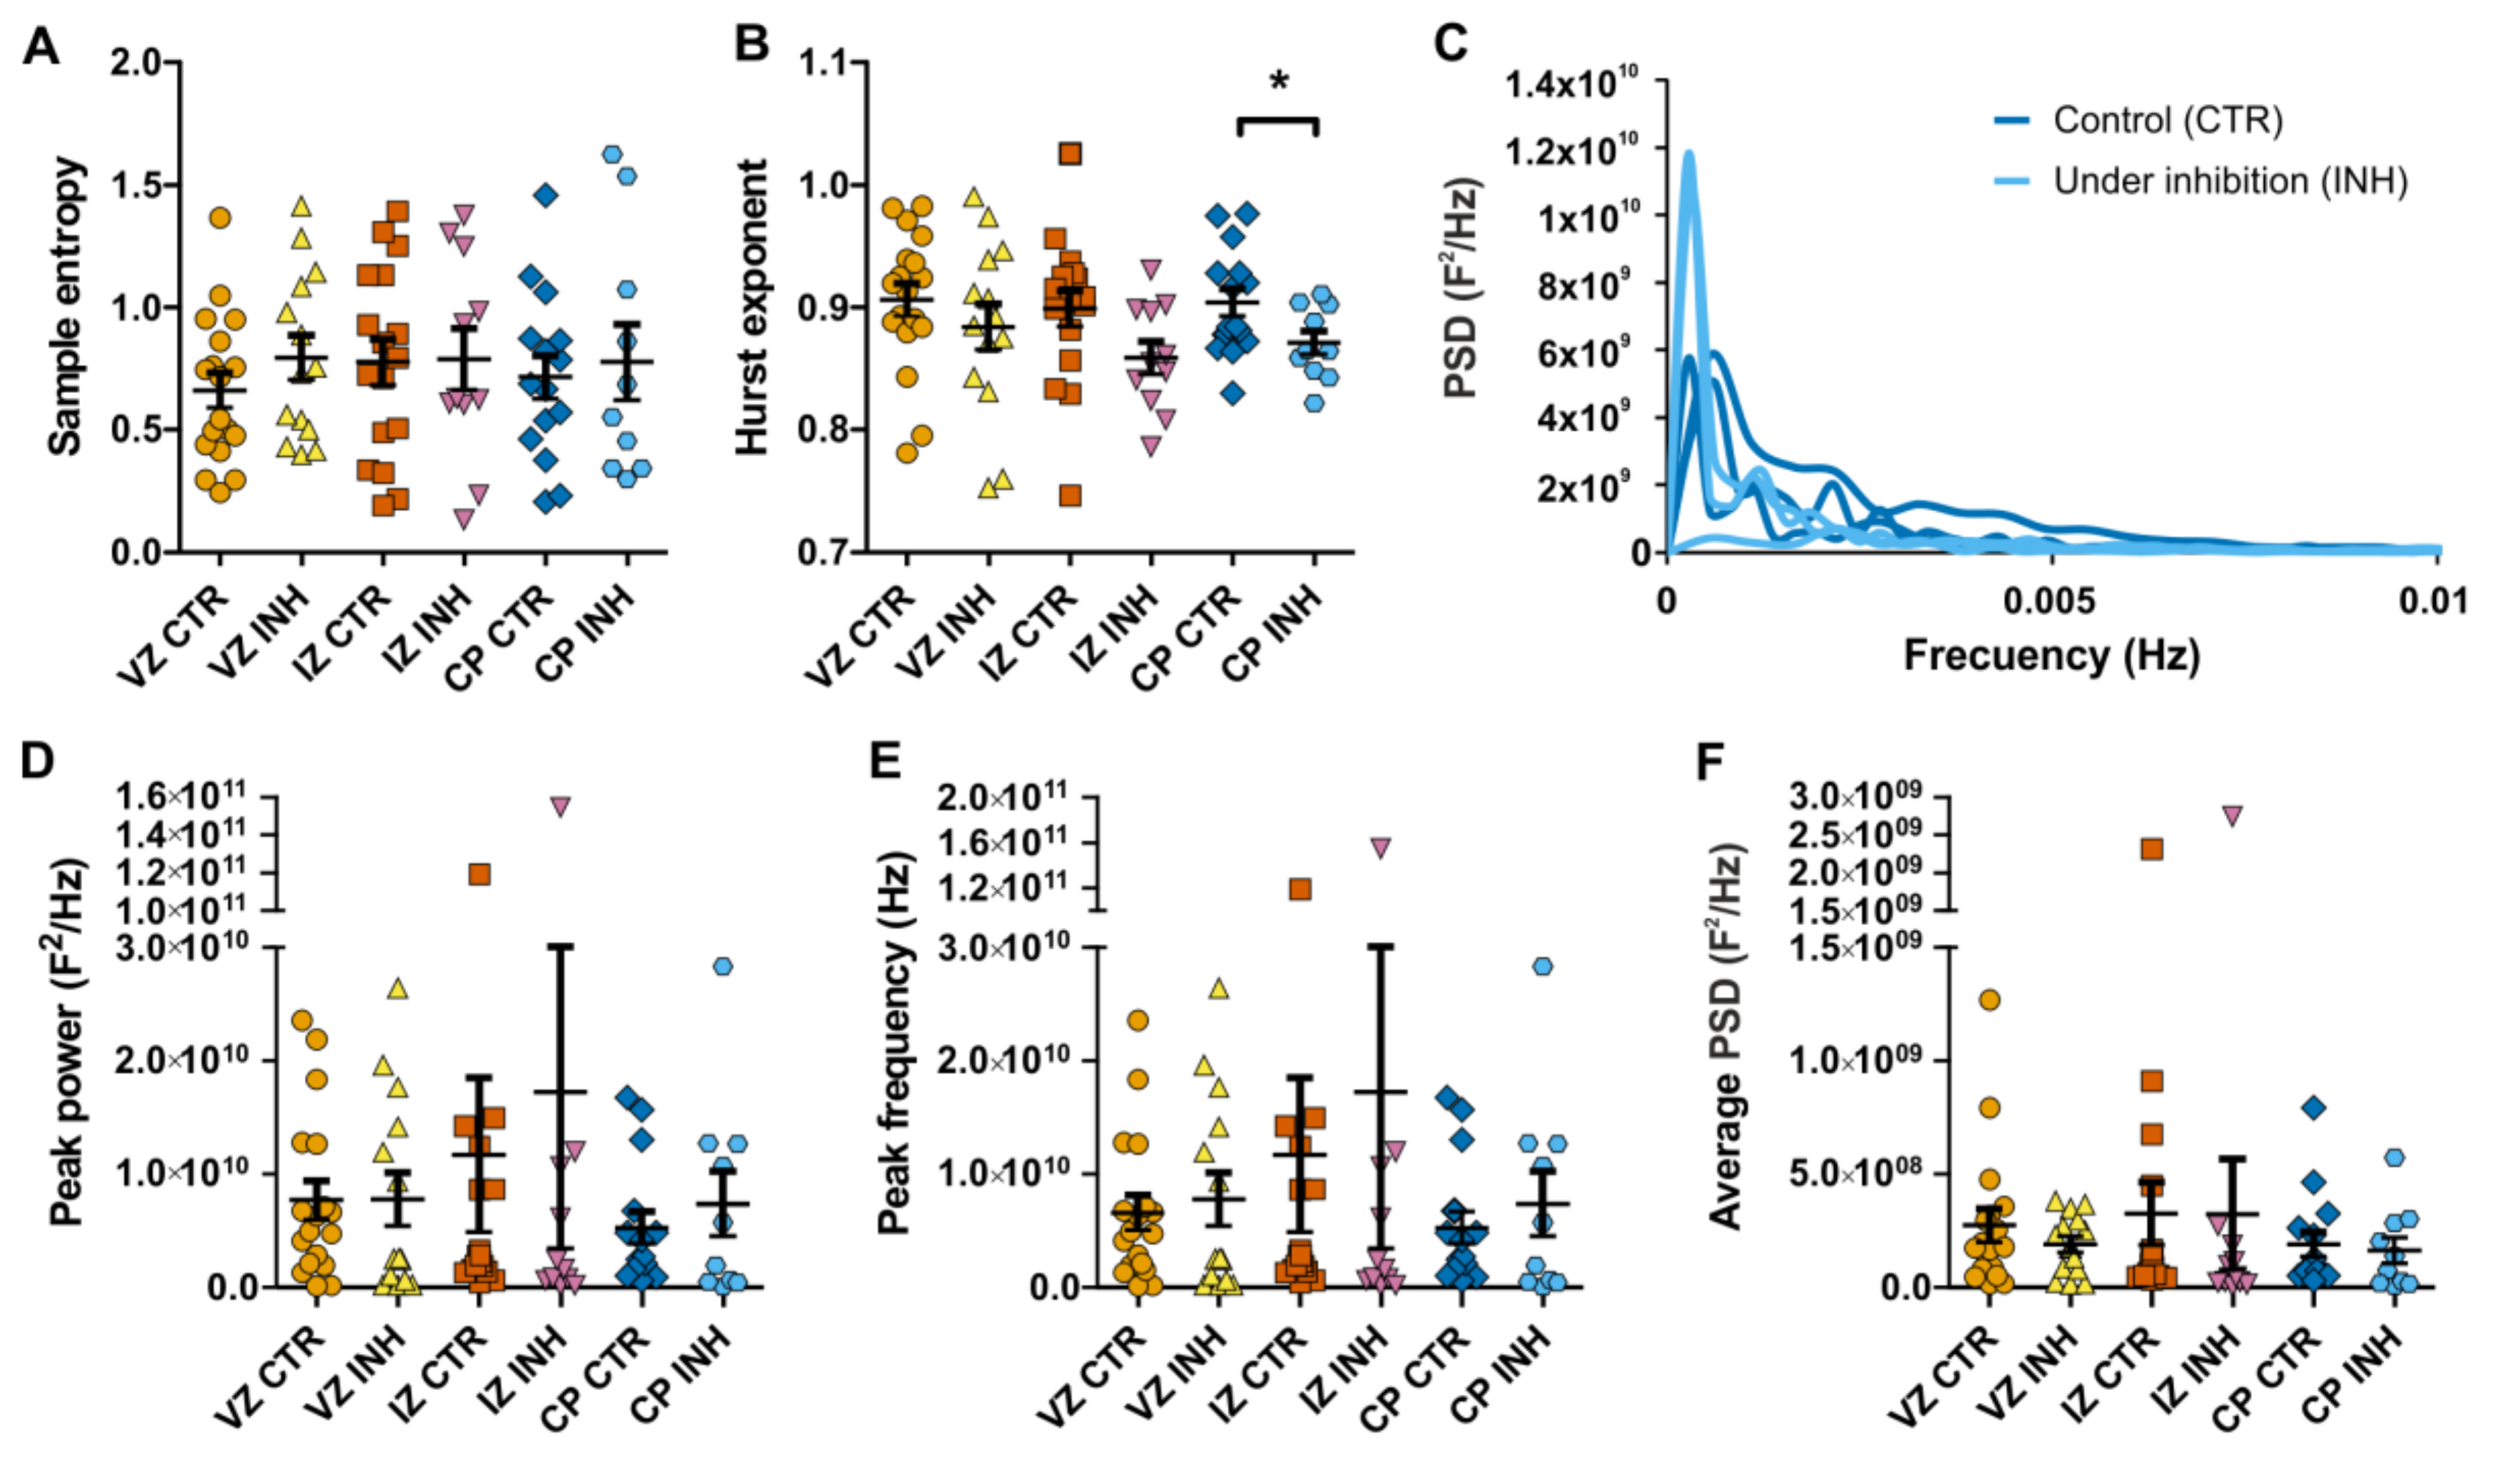
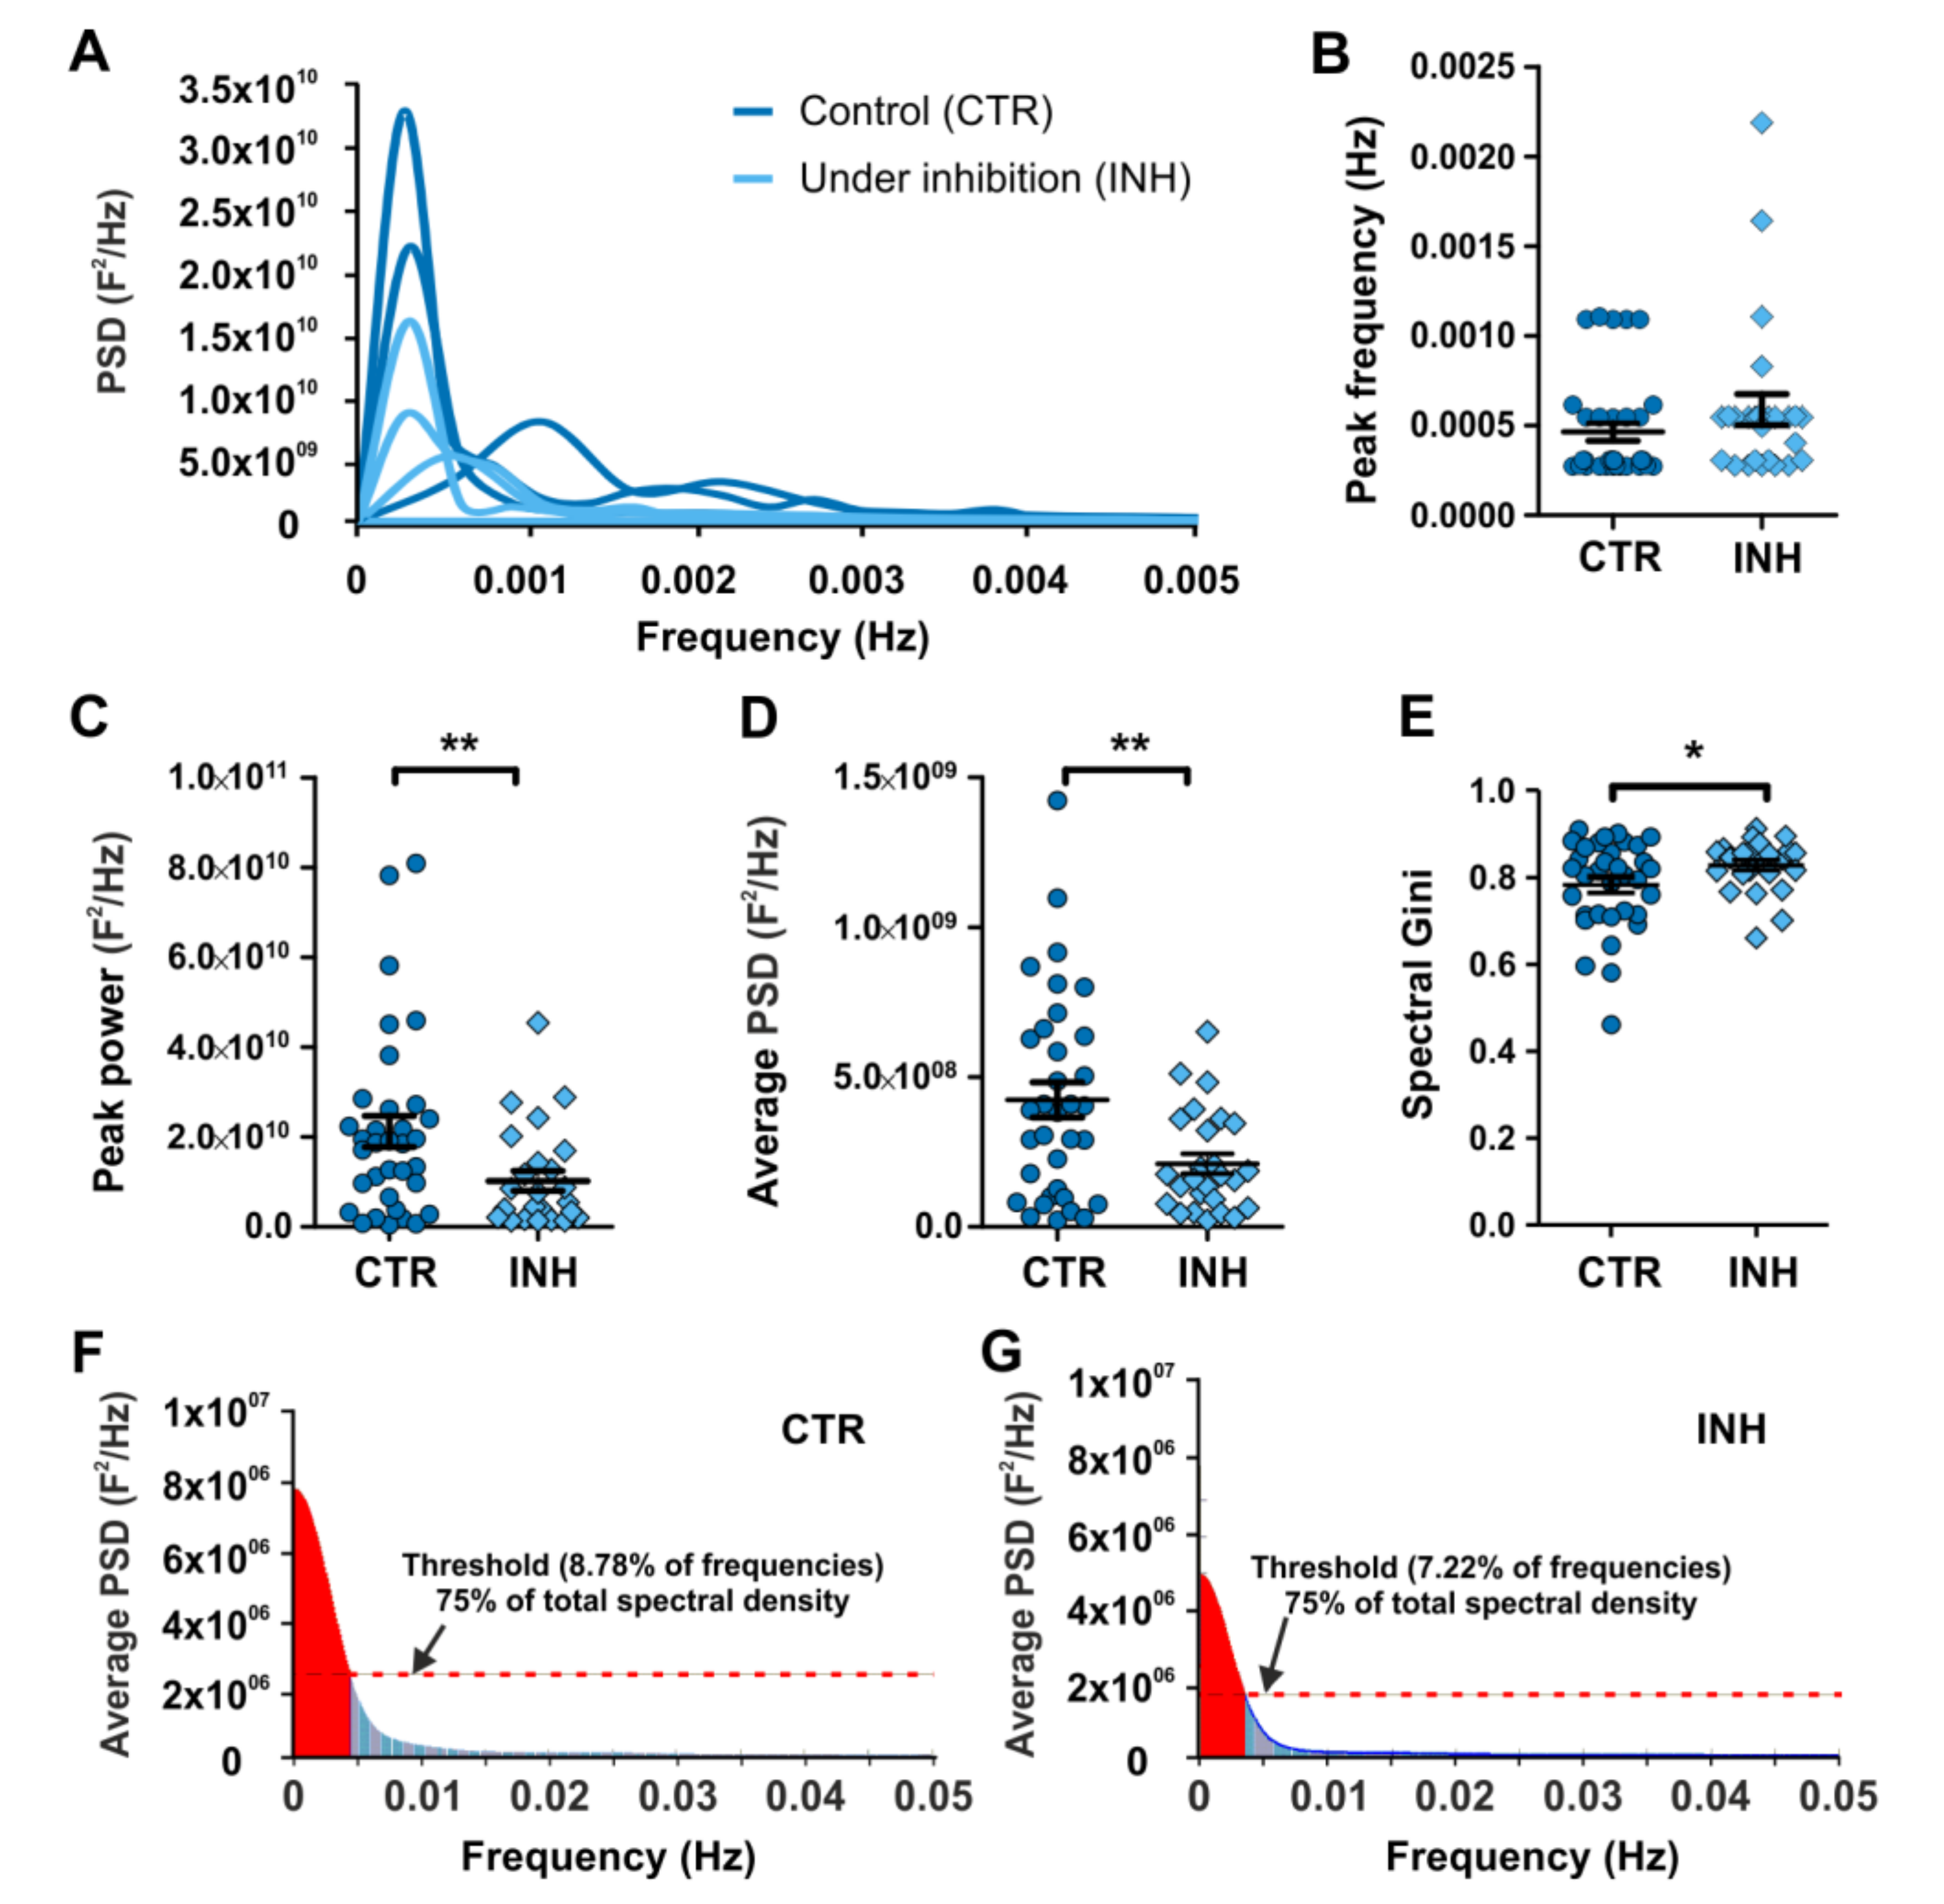
2.3. Power Spectral Analysis of Calcium Oscillations Reveals New Insights on the Effect of Neurotransmitter Receptor Inhibition in Interneurons
2.4. Gini Coefficient-Based Inequality Calculation of Power Spectrum Pinpoint Differences Accounting for the Effect of Interfering with Calcium Oscillations in Migrating Interneurons
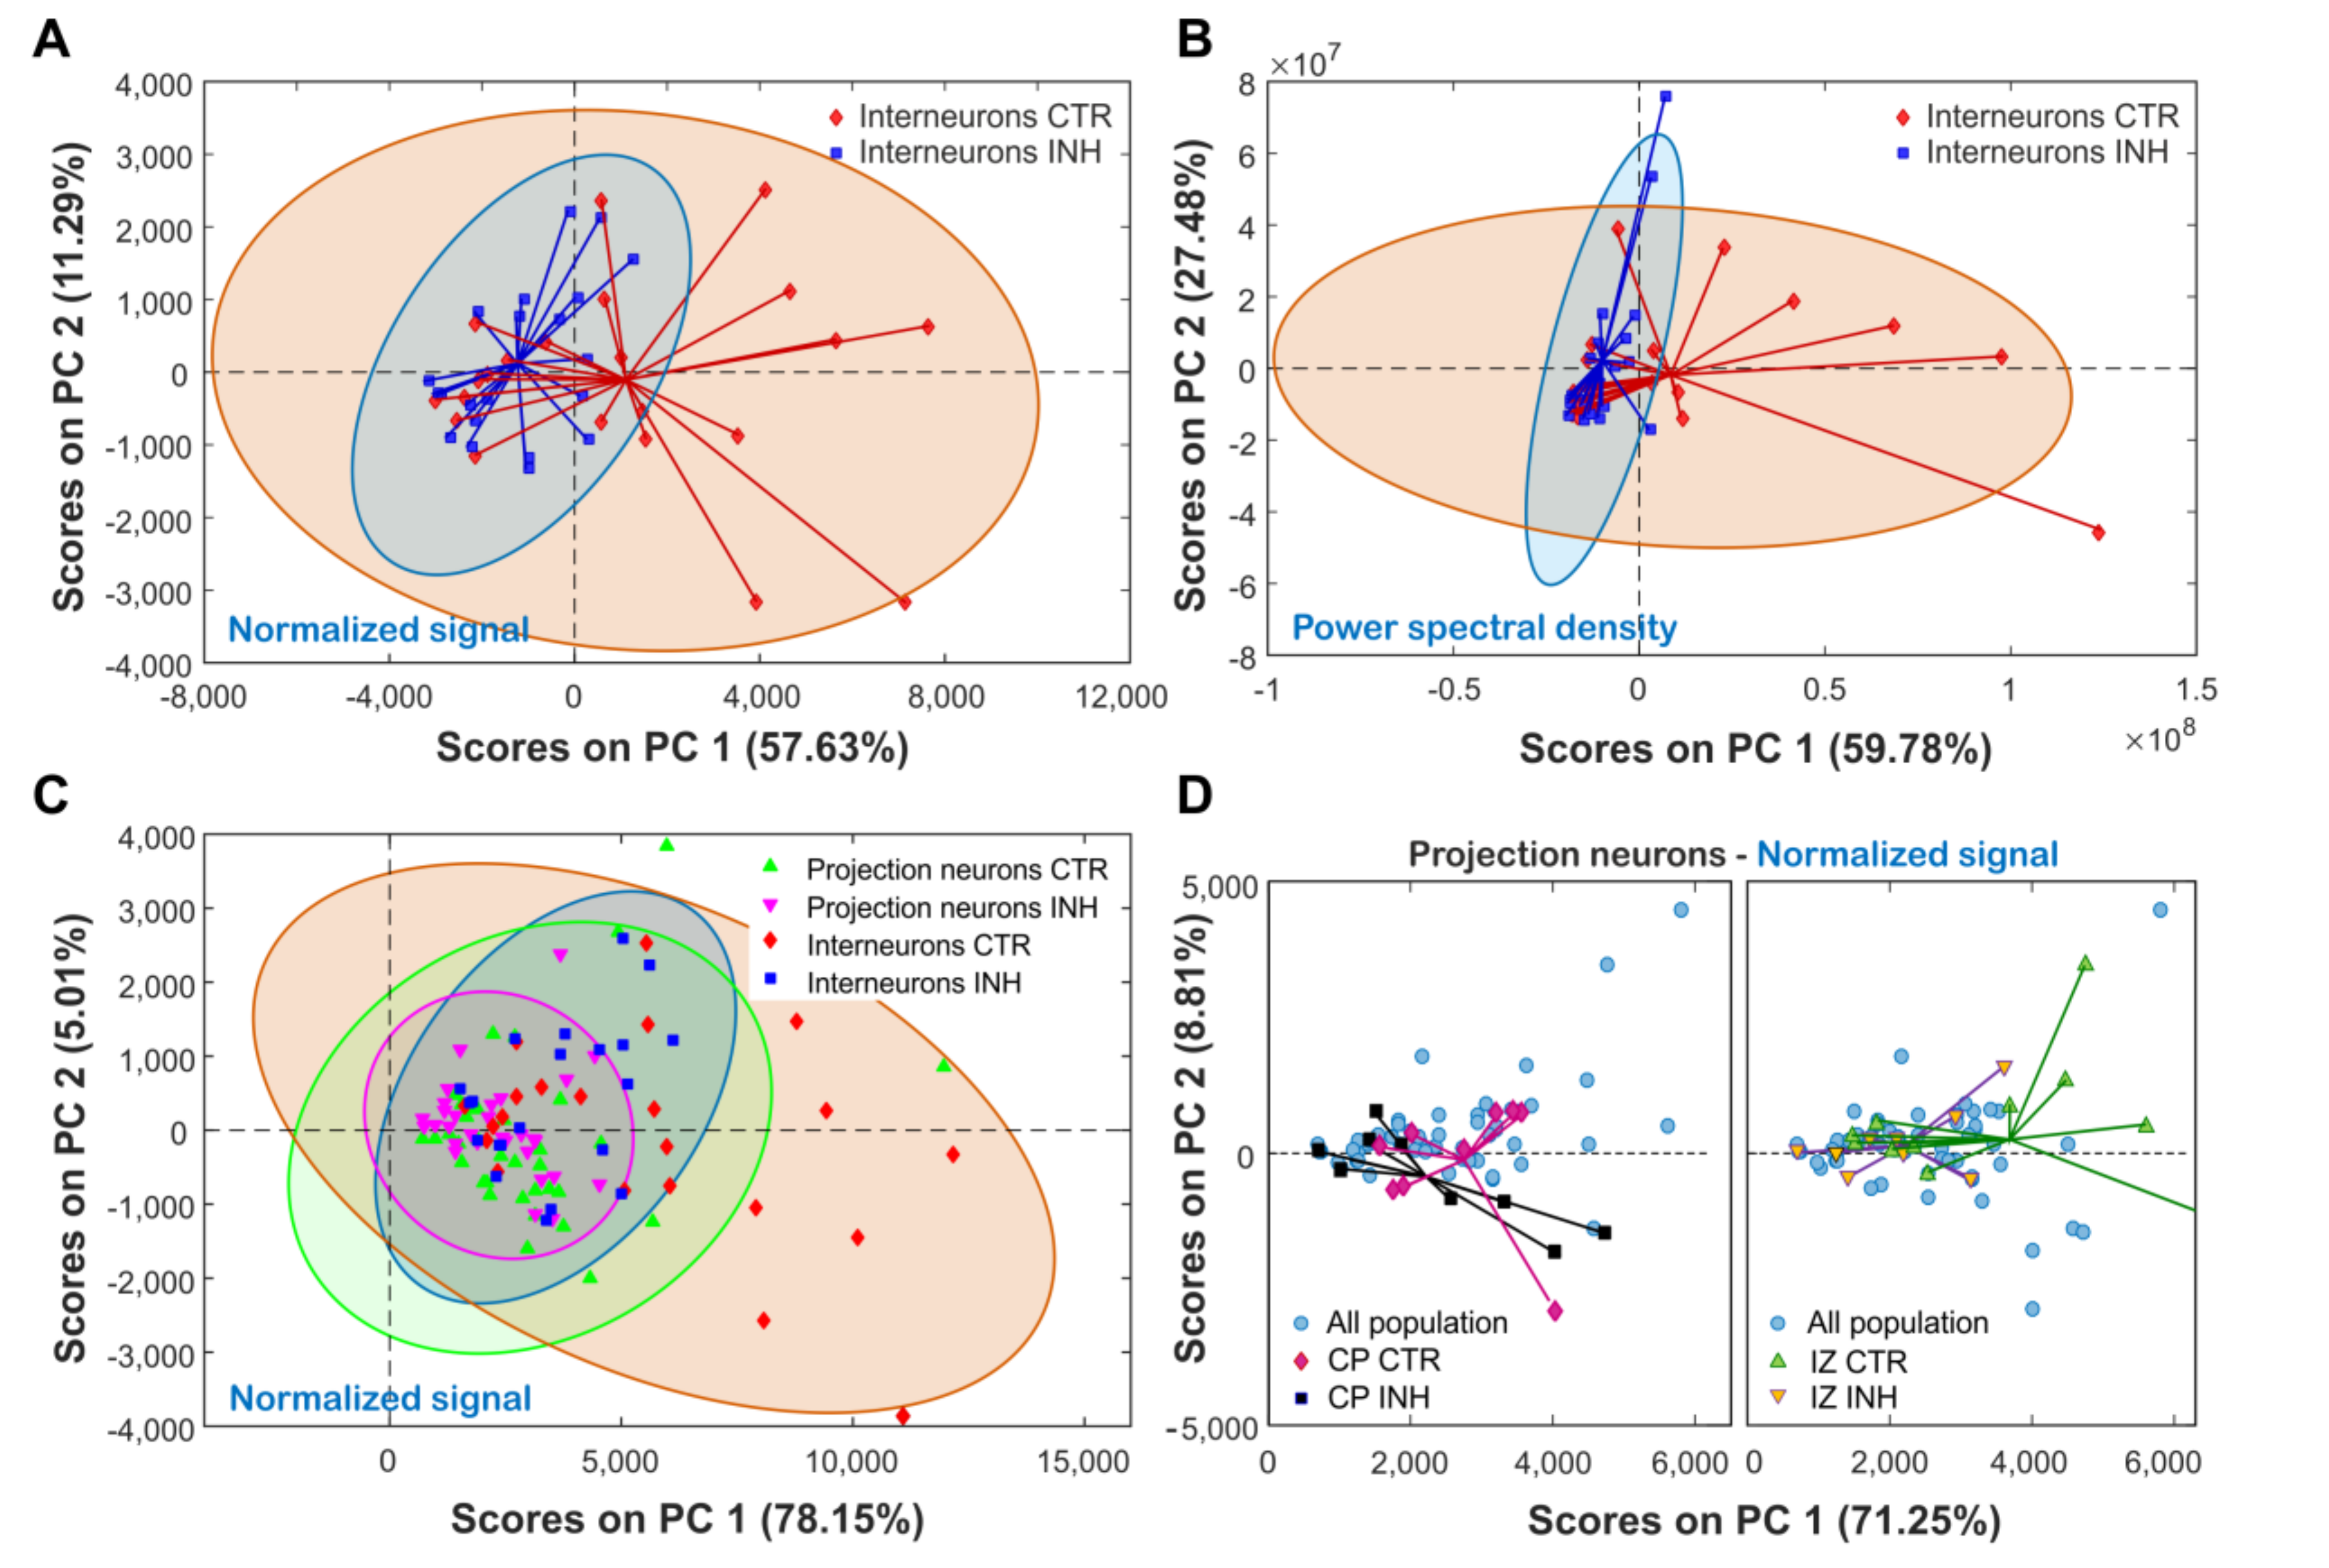
2.5. Principal a Reveals Clustering by Cell Type and Treatment Effect on Cortical Neurons
3. Discussion
4. Material and Methods
4.1. Image Intensity Data Collection
4.2. Statistical Analysis
4.3. Sample Entropy and Hurst Exponent Calculation
4.4. Power spectral Analysis
4.5. Spectral Gini Coefficient Calculation
4.6. Principal Component Analysis (PCA)
Supplementary Materials
Author Contributions
Funding
Conflicts of Interest
References
- Rakic, P. Evolution of the neocortex: A perspective from developmental biology. Nat. Rev. Neurosci. 2009, 10, 724–735. [Google Scholar] [CrossRef]
- Molnár, Z.; Clowry, G.J.; Šestan, N.; Alzu’Bi, A.; Bakken, T.; Hevner, R.F.; Hüppi, P.S.; Kostović, I.; Rakic, P.; Anton, E.S.; et al. New insights into the development of the human cerebral cortex. J. Anat. 2019, 235, 432–451. [Google Scholar] [CrossRef] [PubMed] [Green Version]
- Shao, Z.; Noh, H.; Bin Kim, W.; Ni, P.; Nguyen, C.; Cote, S.E.; Noyes, E.; Zhao, J.; Parsons, T.; Park, J.M.; et al. Dysregulated protocadherin-pathway activity as an intrinsic defect in induced pluripotent stem cell–derived cortical interneurons from subjects with schizophrenia. Nat. Neurosci. 2019, 22, 229–242. [Google Scholar] [CrossRef]
- Lim, L.; Mi, D.; Llorca, A.; Marıín, O. Development and Functional Diversification of Cortical Interneurons. Neuron 2018, 100, 294–313. [Google Scholar] [CrossRef] [Green Version]
- Nadarajah, B.; Alifragis, P.; Wong, R.; Parnavelas, J. Neuronal Migration in the Developing Cerebral Cortex: Observations Based on Real-time Imaging. Cereb. Cortex 2003, 13, 607–611. [Google Scholar] [CrossRef]
- Cuzon, V.C.; Yeh, P.W.L.; Yanagawa, Y.; Obata, K.; Yeh, H.H. Ethanol Consumption during Early Pregnancy Alters the Disposition of Tangentially Migrating GABAergic Interneurons in the Fetal Cortex. J. Neurosci. 2008, 28, 1854–1864. [Google Scholar] [CrossRef] [PubMed] [Green Version]
- Bortone, D.; Polleux, F. KCC2 Expression Promotes the Termination of Cortical Interneuron Migration in a Voltage-Sensitive Calcium-Dependent Manner. Neuron 2009, 62, 53–71. [Google Scholar] [CrossRef] [PubMed] [Green Version]
- LoTurco, J.J.; Owens, D.F.; Heath, M.J.; Davis, M.B.; Kriegstein, A.R. GABA and glutamate depolarize cortical progenitor cells and inhibit DNA synthesis. Neuron 1995, 15, 1287–1298. [Google Scholar] [CrossRef] [Green Version]
- Murthy, S.; Niquille, M.; Hurni, N.; Limoni, G.; Frazer, S.; Chameau, P.; Van Hooft, J.A.; Vitalis, T.; Dayer, A. Serotonin receptor 3A controls interneuron migration into the neocortex. Nat. Commun. 2014, 5, 5524. [Google Scholar] [CrossRef]
- Ojeda, J.; Ávila, A. Early Actions of Neurotransmitters During Cortex Development and Maturation of Reprogrammed Neurons. Front. Synaptic Neurosci. 2019, 11, 33. [Google Scholar] [CrossRef] [Green Version]
- Young-Pearse, T.L.; Ivic, L.; Kriegstein, A.R.; Cepko, C.L. Characterization of Mice with Targeted Deletion of Glycine Receptor Alpha 2. Mol. Cell. Biol. 2006, 26, 5728–5734. [Google Scholar] [CrossRef] [Green Version]
- Eavila, A.; Nguyen, L.; Rigo, J.M. Glycine receptors and brain development. Front. Cell. Neurosci. 2013, 7, 184. [Google Scholar] [CrossRef] [Green Version]
- Avila, A.; Vidal, P.M.; Tielens, S.; Morelli, G.; Laguesse, S.; Harvey, R.J.; Rigo, J.M.; Nguyen, L. Glycine receptors control the generation of projection neurons in the developing cerebral cortex. Cell Death Differ. 2014, 21, 1696–1708. [Google Scholar] [CrossRef]
- Pilorge, M.; Fassier, C.; Le Corronc, H.; Potey, A.; Bai, J.; De Gois, S.; Delaby, E.; Assouline, B.; Guinchat, V.; Devillard, F.; et al. Genetic and functional analyses demonstrate a role for abnormal glycinergic signaling in autism. Mol. Psychiatry 2015, 21, 936–945. [Google Scholar] [CrossRef] [PubMed] [Green Version]
- Zhang, Y.; Ho, T.N.T.; Harvey, R.J.; Lynch, J.W.; Keramidas, A. Structure-Function Analysis of the GlyR α2 Subunit Autism Mutation p.R323L Reveals a Gain-of-Function. Front. Mol. Neurosci. 2017, 10, 158. [Google Scholar] [CrossRef] [Green Version]
- Avila, A.; Vidal, P.M.; Dear, T.N.; Harvey, R.J.; Rigo, J.M.; Nguyen, L. Glycine Receptor α2 Subunit Activation Promotes Cortical Interneuron Migration. Cell Rep. 2013, 4, 738–750. [Google Scholar] [CrossRef] [PubMed]
- Morelli, G.; Avila, A.; Ravanidis, S.; Aourz, N.; Neve, R.L.; Smolders, I.; Harvey, R.J.; Rigo, J.M.; Nguyen, L.; Brône, B. Cerebral Cortical Circuitry Formation Requires Functional Glycine Receptors. Cereb. Cortex 2016, 27. [Google Scholar] [CrossRef]
- Cancedda, L.; Fiumelli, H.; Chen, K.; Poo, M.M. Excitatory GABA Action Is Essential for Morphological Maturation of Cortical Neurons In Vivo. J. Neurosci. 2007, 27, 5224–5235. [Google Scholar] [CrossRef] [Green Version]
- Haydar, T.F.; Wang, F.; Schwartz, M.L.; Rakic, P. Differential modulation of proliferation in the neocortical ventricular and subventricular zones. J. Neurosci. 2000, 20, 5764–5774. [Google Scholar] [CrossRef] [PubMed] [Green Version]
- Gómez, T.M.; Snow, D.M.; Letourneau, P.C. Characterization of spontaneous calcium transients in nerve growth cones and their effect on growth cone migration. Neuron 1995, 14, 1233–1246. [Google Scholar] [CrossRef] [Green Version]
- Leclerc, C.; Néant, I.; Moreau, M. Early neural development in vertebrates is also a matter of calcium. Biochimie 2011, 93, 2102–2111. [Google Scholar] [CrossRef]
- Brini, M.; Calì, T.; Ottolini, D.; Carafoli, E. Neuronal calcium signaling: Function and dysfunction. Cell. Mol. Life Sci. 2014, 71, 2787–2814. [Google Scholar] [CrossRef] [PubMed]
- Clapham, D.E. Calcium Signaling. Cell 2007, 131, 1047–1058. [Google Scholar] [CrossRef] [Green Version]
- Boulanger-Weill, J.; Candat, V.; Jouary, A.; Romano, S.A.; Pérez-Schuster, V.; Esumbre, G. Functional Interactions between Newborn and Mature Neurons Leading to Integration into Established Neuronal Circuits. Curr. Biol. 2017, 27, 1707–1720.e5. [Google Scholar] [CrossRef] [Green Version]
- Blankenship, A.G.; Feller, M.B. Mechanisms underlying spontaneous patterned activity in developing neural circuits. Nat. Rev. Neurosci. 2009, 11, 18–29. [Google Scholar] [CrossRef]
- Spitzer, N.C. Electrical activity in early neuronal development. Nat. Cell Biol. 2006, 444, 707–712. [Google Scholar] [CrossRef]
- Xiao, Q.; Xu, L.; Spitzer, N.C. Target-dependent regulation of neurotransmitter specification and embryonic neuronal calcium spike activity. J. Neurosci. 2010, 30, 5792–5801. [Google Scholar] [CrossRef] [PubMed] [Green Version]
- Rosenberg, S.S.; Spitzer, N.C. Calcium Signaling in Neuronal Development. Cold Spring Harb. Perspect. Biol. 2011, 3, a004259. [Google Scholar] [CrossRef] [PubMed] [Green Version]
- Weissman, T.A.; Riquelme, P.A.; Ivic, L.; Flint, A.C.; Kriegstein, A.R. Calcium Waves Propagate through Radial Glial Cells and Modulate Proliferation in the Developing Neocortex. Neuron 2004, 43, 647–661. [Google Scholar] [CrossRef] [Green Version]
- Rash, B.G.; Micali, N.; Huttner, A.J.; Morozov, Y.M.; Horvath, T.L.; Rakic, P. Metabolic regulation and glucose sensitivity of cortical radial glial cells. Proc. Natl. Acad. Sci. USA 2018, 115, 10142–10147. [Google Scholar] [CrossRef] [Green Version]
- Rebellato, P.; Kaczynska, D.; Kanatani, S.; Al Rayyes, I.; Zhang, S.; Villaescusa, C.; Falk, A.; Arenas, E.; Hermanson, O.; Louhivuori, L.; et al. The T-type Ca2+ Channel Cav3.2 Regulates Differentiation of Neural Progenitor Cells during Cortical Development via Caspase-3. Neuroscience 2019, 402, 78–89. [Google Scholar] [CrossRef]
- Rash, B.G.; Ackman, J.B.; Rakic, P. Bidirectional radial Ca2+ activity regulates neurogenesis and migration during early cortical column formation. Sci. Adv. 2016, 2, e1501733. [Google Scholar] [CrossRef] [PubMed] [Green Version]
- Priya, R.; Paredes, M.F.; Karayannis, T.; Yusuf, N.; Liu, X.; Jaglin, X.; Graef, I.; Alvarez-Buylla, A.; Fishell, G. Activity Regulates Cell Death within Cortical Interneurons through a Calcineurin-Dependent Mechanism. Cell Rep. 2018, 22, 1695–1709. [Google Scholar] [CrossRef] [PubMed] [Green Version]
- Blanquie, O.; Yang, J.W.; Kilb, W.; Sharopov, S.; Sinning, A.; Luhmann, H.J. Electrical activity controls area-specific expression of neuronal apoptosis in the mouse developing cerebral cortex. eLife 2017, 6, e27696. [Google Scholar] [CrossRef]
- Lyons, M.R.; Chen, L.F.; Deng, J.V.; Finn, C.; Pfenning, A.R.; Sabhlok, A.; Wilson, K.M.; West, A.E.; Michelle, R.L.; Liang-Fu, C. The transcription factor calcium-response factor limits NMDA receptor-dependent transcription in the developing brain. J. Neurochem. 2016, 137, 164–176. [Google Scholar] [CrossRef] [Green Version]
- Giorgi, C.; Danese, A.; Missiroli, S.; Patergnani, S.; Pinton, P. Calcium Dynamics as a Machine for Decoding Signals. Trends Cell Biol. 2018, 28, 258–273. [Google Scholar] [CrossRef] [PubMed]
- Ciccolini, F.; Collins, T.J.; Sudhoelter, J.; Lipp, P.; Berridge, M.J.; Bootman, M.D. Local and Global Spontaneous Calcium Events Regulate Neurite Outgrowth and Onset of GABAergic Phenotype during Neural Precursor Differentiation. J. Neurosci. 2003, 23, 103–111. [Google Scholar] [CrossRef] [Green Version]
- Guemez-Gamboa, A.; Xu, L.; Meng, D.; Spitzer, N.C. Non-Cell-Autonomous Mechanism of Activity-Dependent Neurotransmitter Switching. Neuron 2014, 82, 1004–1016. [Google Scholar] [CrossRef] [Green Version]
- Paudel, S.; Ablondi, E.; Sehdev, M.; Marken, J.P.; Halleran, A.D.; Rahman, A.; Kemper, P.; Saha, M. Calcium Activity Dynamics Correlate with Neuronal Phenotype at a Single Cell Level and in a Threshold-Dependent Manner. Int. J. Mol. Sci. 2019, 20, 1880. [Google Scholar] [CrossRef] [Green Version]
- Owens, D.F.; Kriegstein, A.R. Patterns of Intracellular Calcium Fluctuation in Precursor Cells of the Neocortical Ventricular Zone. J. Neurosci. 1998, 18, 5374–5388. [Google Scholar] [CrossRef]
- Martin, N.; Bernard, D. Calcium signaling and cellular senescence. Cell Calcium 2018, 70, 16–23. [Google Scholar] [CrossRef]
- Sánchez-Hechavarría, M.E.; Ghiya, S.; Carrazana-Escalona, R.; Cortina-Reyna, S.; Andreu-Heredia, A.; Acosta-Batista, C.; Saá-Muñoz, N.A. Introduction of Application of Gini Coefficient to Heart Rate Variability Spectrum for Mental Stress Evaluation. Arq. Bras. Cardiol. 2019, 113, 725–733. [Google Scholar] [CrossRef] [PubMed]
- You, K.J.; Noh, G.J.; Shin, H.C. Spectral Gini Index for Quantifying the Depth of Consciousness. Comput. Intell. Neurosci. 2016, 2016, 1–12. [Google Scholar] [CrossRef] [Green Version]
- Viehweger, A.; Riffert, T.; Dhital, B.; Knösche, T.R.; Anwander, A.; Stepan, H.; Sorge, I.; Hirsch, W. The Gini coefficient: A methodological pilot study to assess fetal brain development employing postmortem diffusion MRI. Pediatr. Radiol. 2014, 44, 1290–1301. [Google Scholar] [CrossRef] [PubMed]
- Muelas, M.W.; Mughal, F.; O’Hagan, S.; Day, P.J.; Currin, A. The role and robustness of the Gini coefficient as an unbiased tool for the selection of Gini genes for normalising expression profiling data. Sci. Rep. 2019, 9, 1–21. [Google Scholar] [CrossRef]
- Darmanis, S.; Sloan, S.A.; Zhang, Y.; Enge, M.; Caneda, C.; Shuer, L.M.; Gephart, M.G.H.; Barres, B.A.; Quake, S.R. A survey of human brain transcriptome diversity at the single cell level. Proc. Natl. Acad. Sci. USA 2015, 112, 7285–7290. [Google Scholar] [CrossRef] [Green Version]
- Fan, X.; Dong, J.; Zhong, S.; Wei, Y.; Wu, Q.; Yan, L.; Yong, J.; Sun, L.; Wang, X.; Zhao, Y.; et al. Spatial transcriptomic survey of human embryonic cerebral cortex by single-cell RNA-seq analysis. Cell Res. 2018, 28, 730–745. [Google Scholar] [CrossRef] [Green Version]
- Pollen, A.A.; Nowakowski, T.J.; Shuga, J.; Wang, X.; A Leyrat, A.; Lui, J.H.; Li, N.; Szpankowski, L.; Fowler, B.; Chen, P.; et al. Low-coverage single-cell mRNA sequencing reveals cellular heterogeneity and activated signaling pathways in developing cerebral cortex. Nat. Biotechnol. 2014, 32, 1053–1058. [Google Scholar] [CrossRef] [Green Version]
- Richman, J.S.; Moorman, J.R. Physiological time-series analysis using approximate entropy and sample entropy. Am. J. Physiol. Circ. Physiol. 2000, 278, H2039–H2049. [Google Scholar] [CrossRef] [PubMed] [Green Version]
- FFT Power Spectral Density (Not in Base Package)—LabVIEW 8.2 Help. Available online: https://zone.ni.com/reference/en-XX/help/371361B-01/lvwave/fft_power_spectral_density/ (accessed on 26 August 2020).


Publisher’s Note: MDPI stays neutral with regard to jurisdictional claims in published maps and institutional affiliations. |
© 2020 by the authors. Licensee MDPI, Basel, Switzerland. This article is an open access article distributed under the terms and conditions of the Creative Commons Attribution (CC BY) license (http://creativecommons.org/licenses/by/4.0/).
Share and Cite
Ávila, D.; Aedo, E.; Sánchez-Hechavarria, M.; Ávila, C.; Ávila, A. Glycine Receptor Inhibition Differentially Affect Selected Neuronal Populations of the Developing Embryonic Cortex, as Evidenced by the Analysis of Spontaneous Calcium Oscillations. Int. J. Mol. Sci. 2020, 21, 8013. https://0-doi-org.brum.beds.ac.uk/10.3390/ijms21218013
Ávila D, Aedo E, Sánchez-Hechavarria M, Ávila C, Ávila A. Glycine Receptor Inhibition Differentially Affect Selected Neuronal Populations of the Developing Embryonic Cortex, as Evidenced by the Analysis of Spontaneous Calcium Oscillations. International Journal of Molecular Sciences. 2020; 21(21):8013. https://0-doi-org.brum.beds.ac.uk/10.3390/ijms21218013
Chicago/Turabian StyleÁvila, Denisse, Eduardo Aedo, Miguel Sánchez-Hechavarria, Claudio Ávila, and Ariel Ávila. 2020. "Glycine Receptor Inhibition Differentially Affect Selected Neuronal Populations of the Developing Embryonic Cortex, as Evidenced by the Analysis of Spontaneous Calcium Oscillations" International Journal of Molecular Sciences 21, no. 21: 8013. https://0-doi-org.brum.beds.ac.uk/10.3390/ijms21218013