Impact of Erythropoietin Production by Erythroblastic Island Macrophages on Homeostatic Murine Erythropoiesis

Abstract
:
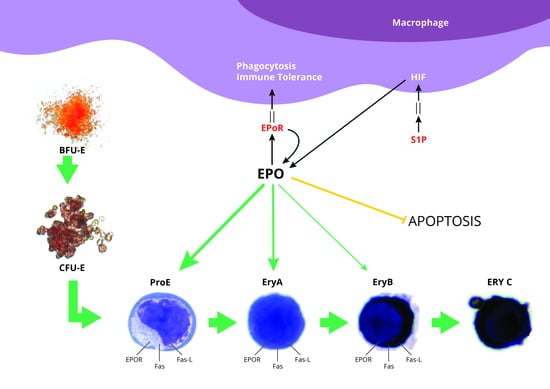
1. Introduction
2. Results
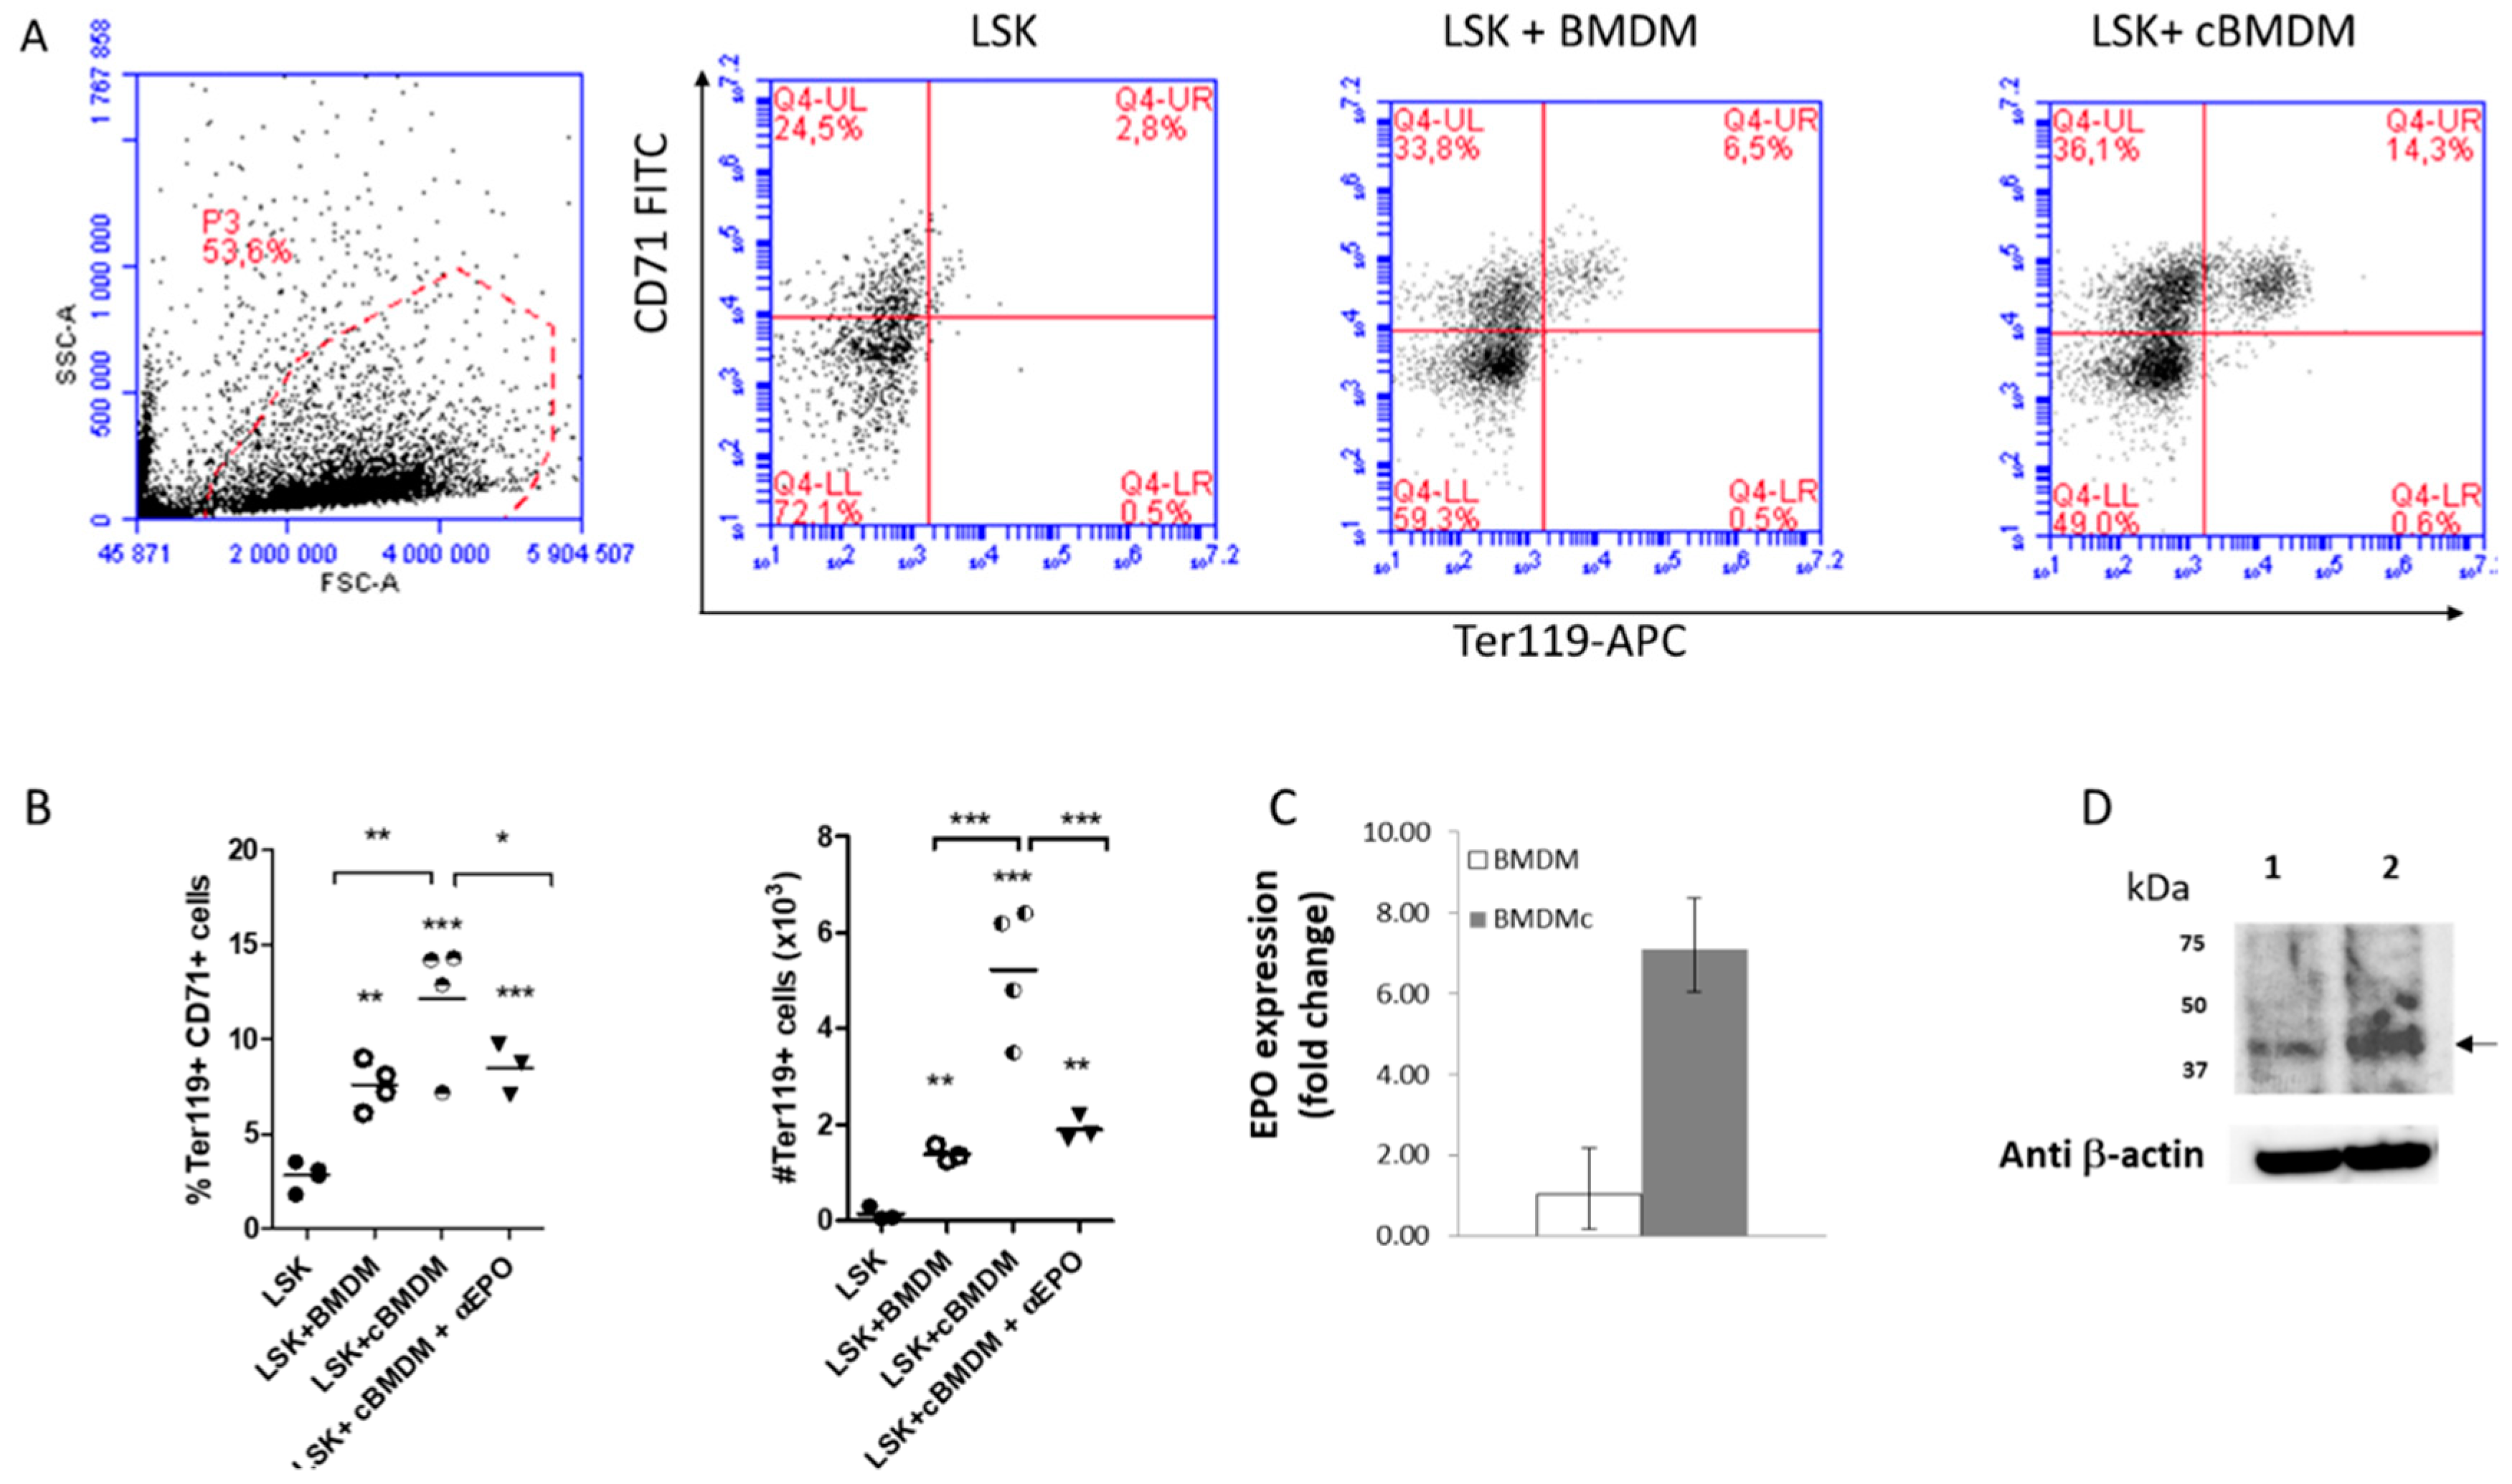
2.1. BMDM Conditioned with Apoptotic Cell-Derived Media Have Improved Ability to Sustain Erythropoiesis In Vitro
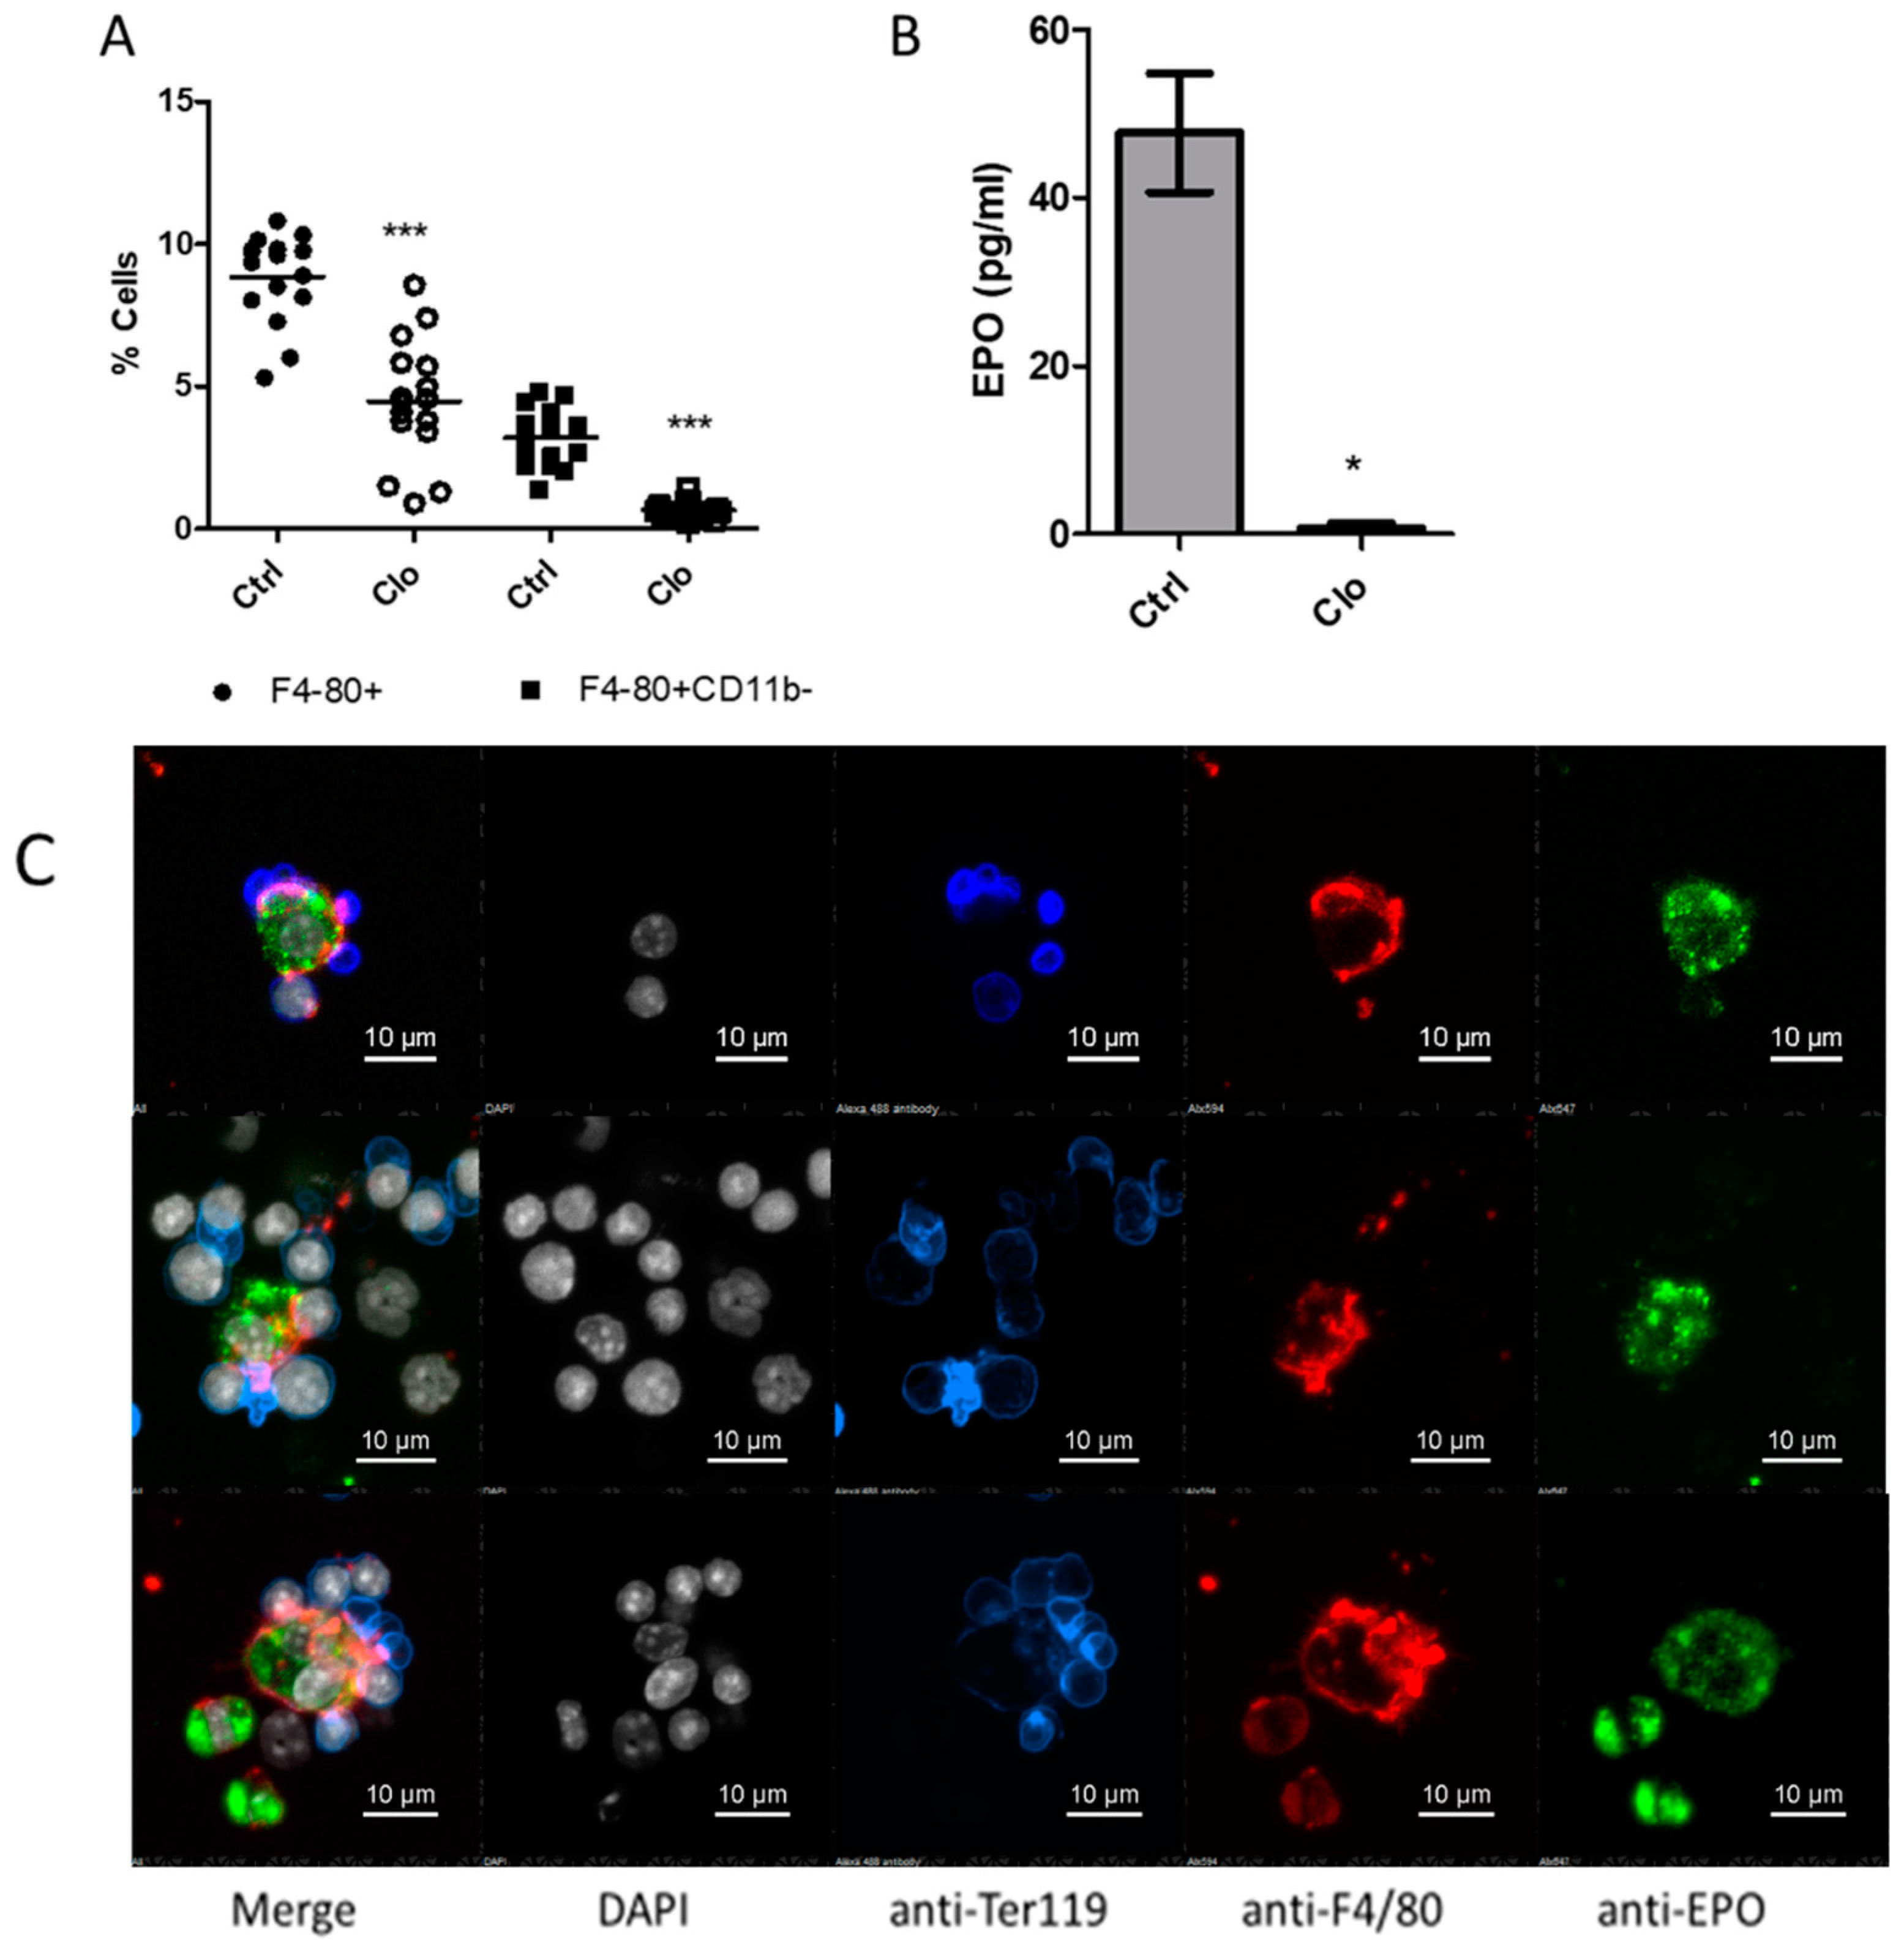
2.2. Detection of EPO in Ex-Vivo EBI Macrophages by IF and Confocal Imagery
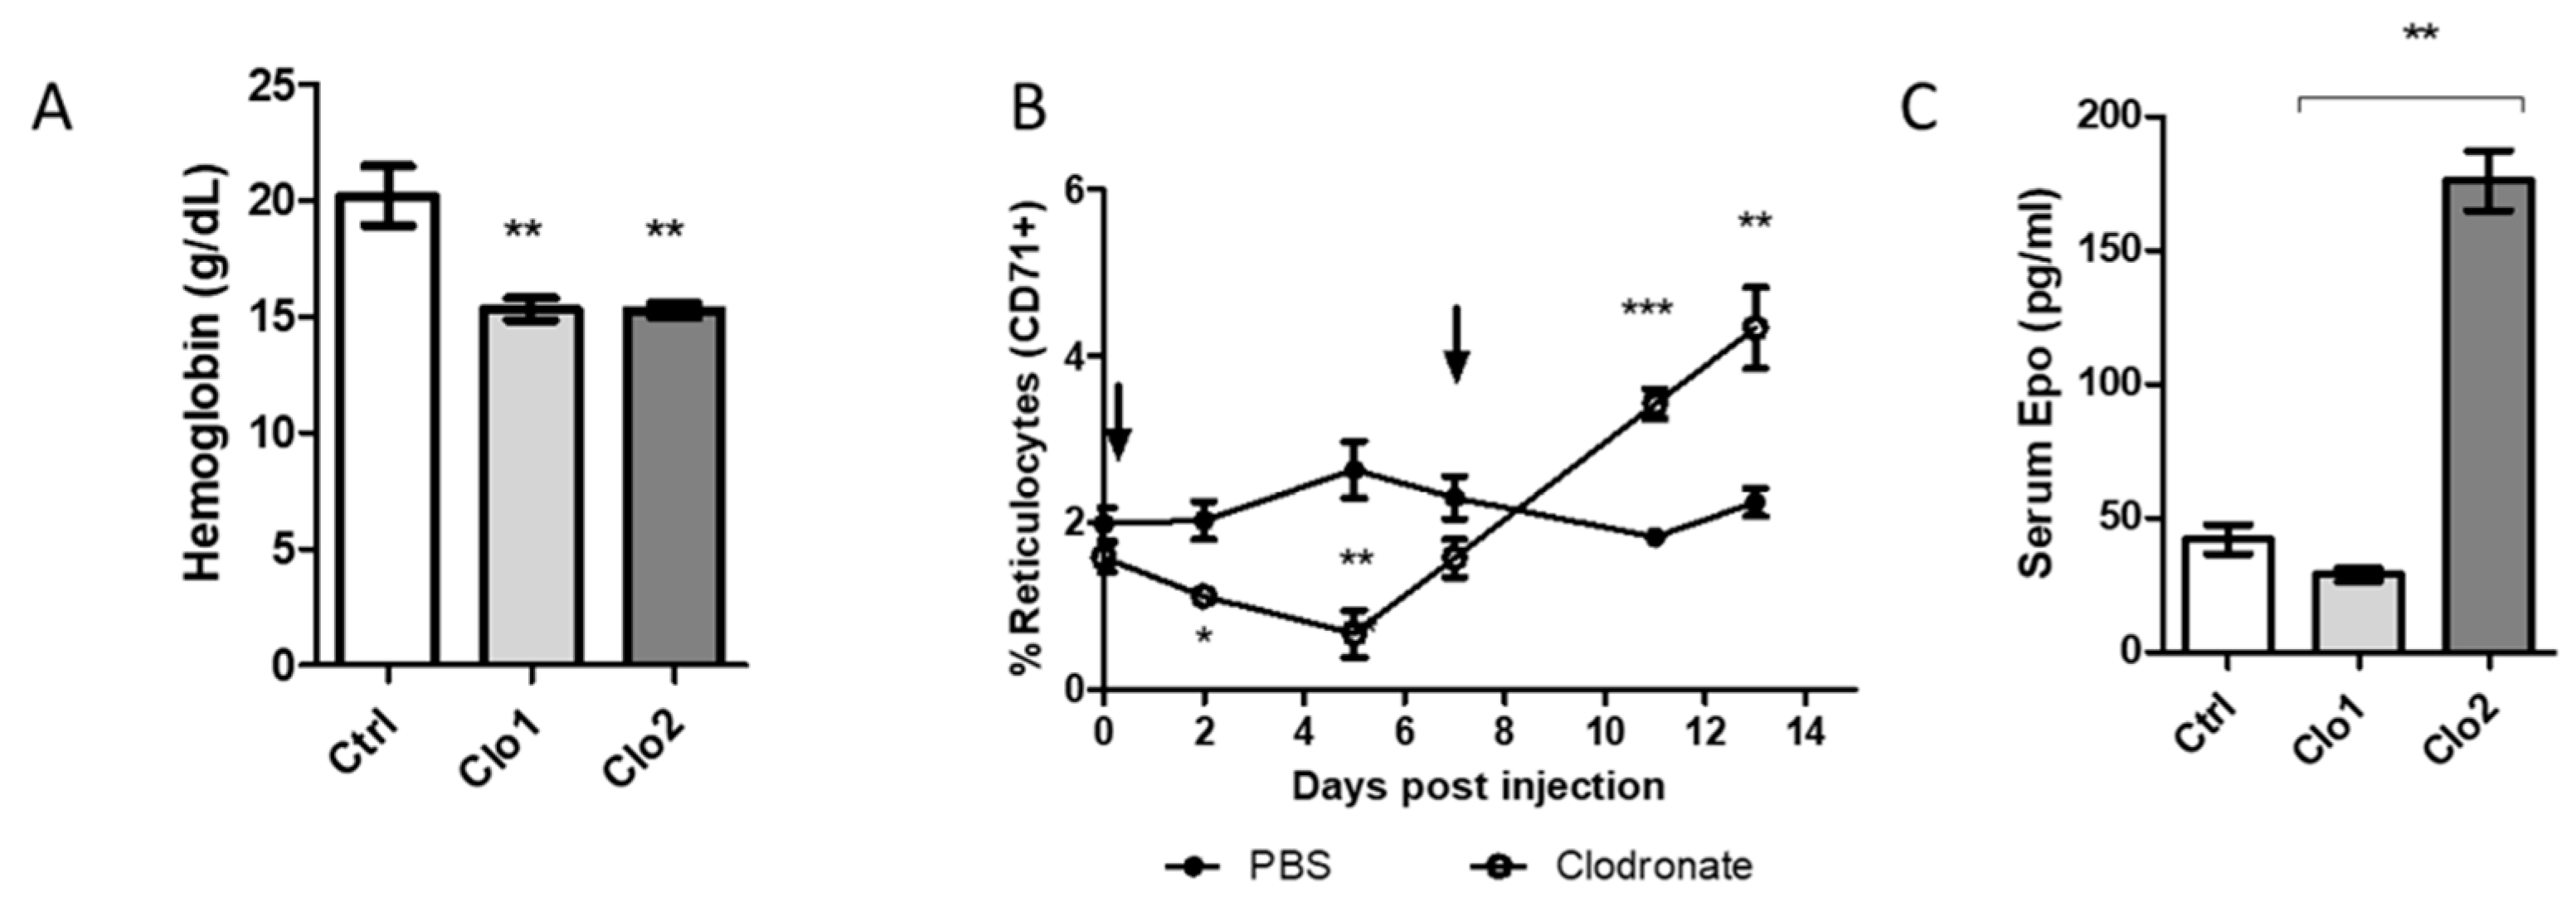
2.3. Impact of Macrophage Depletion with Clodronate Liposomes on Murine Erythropoiesis
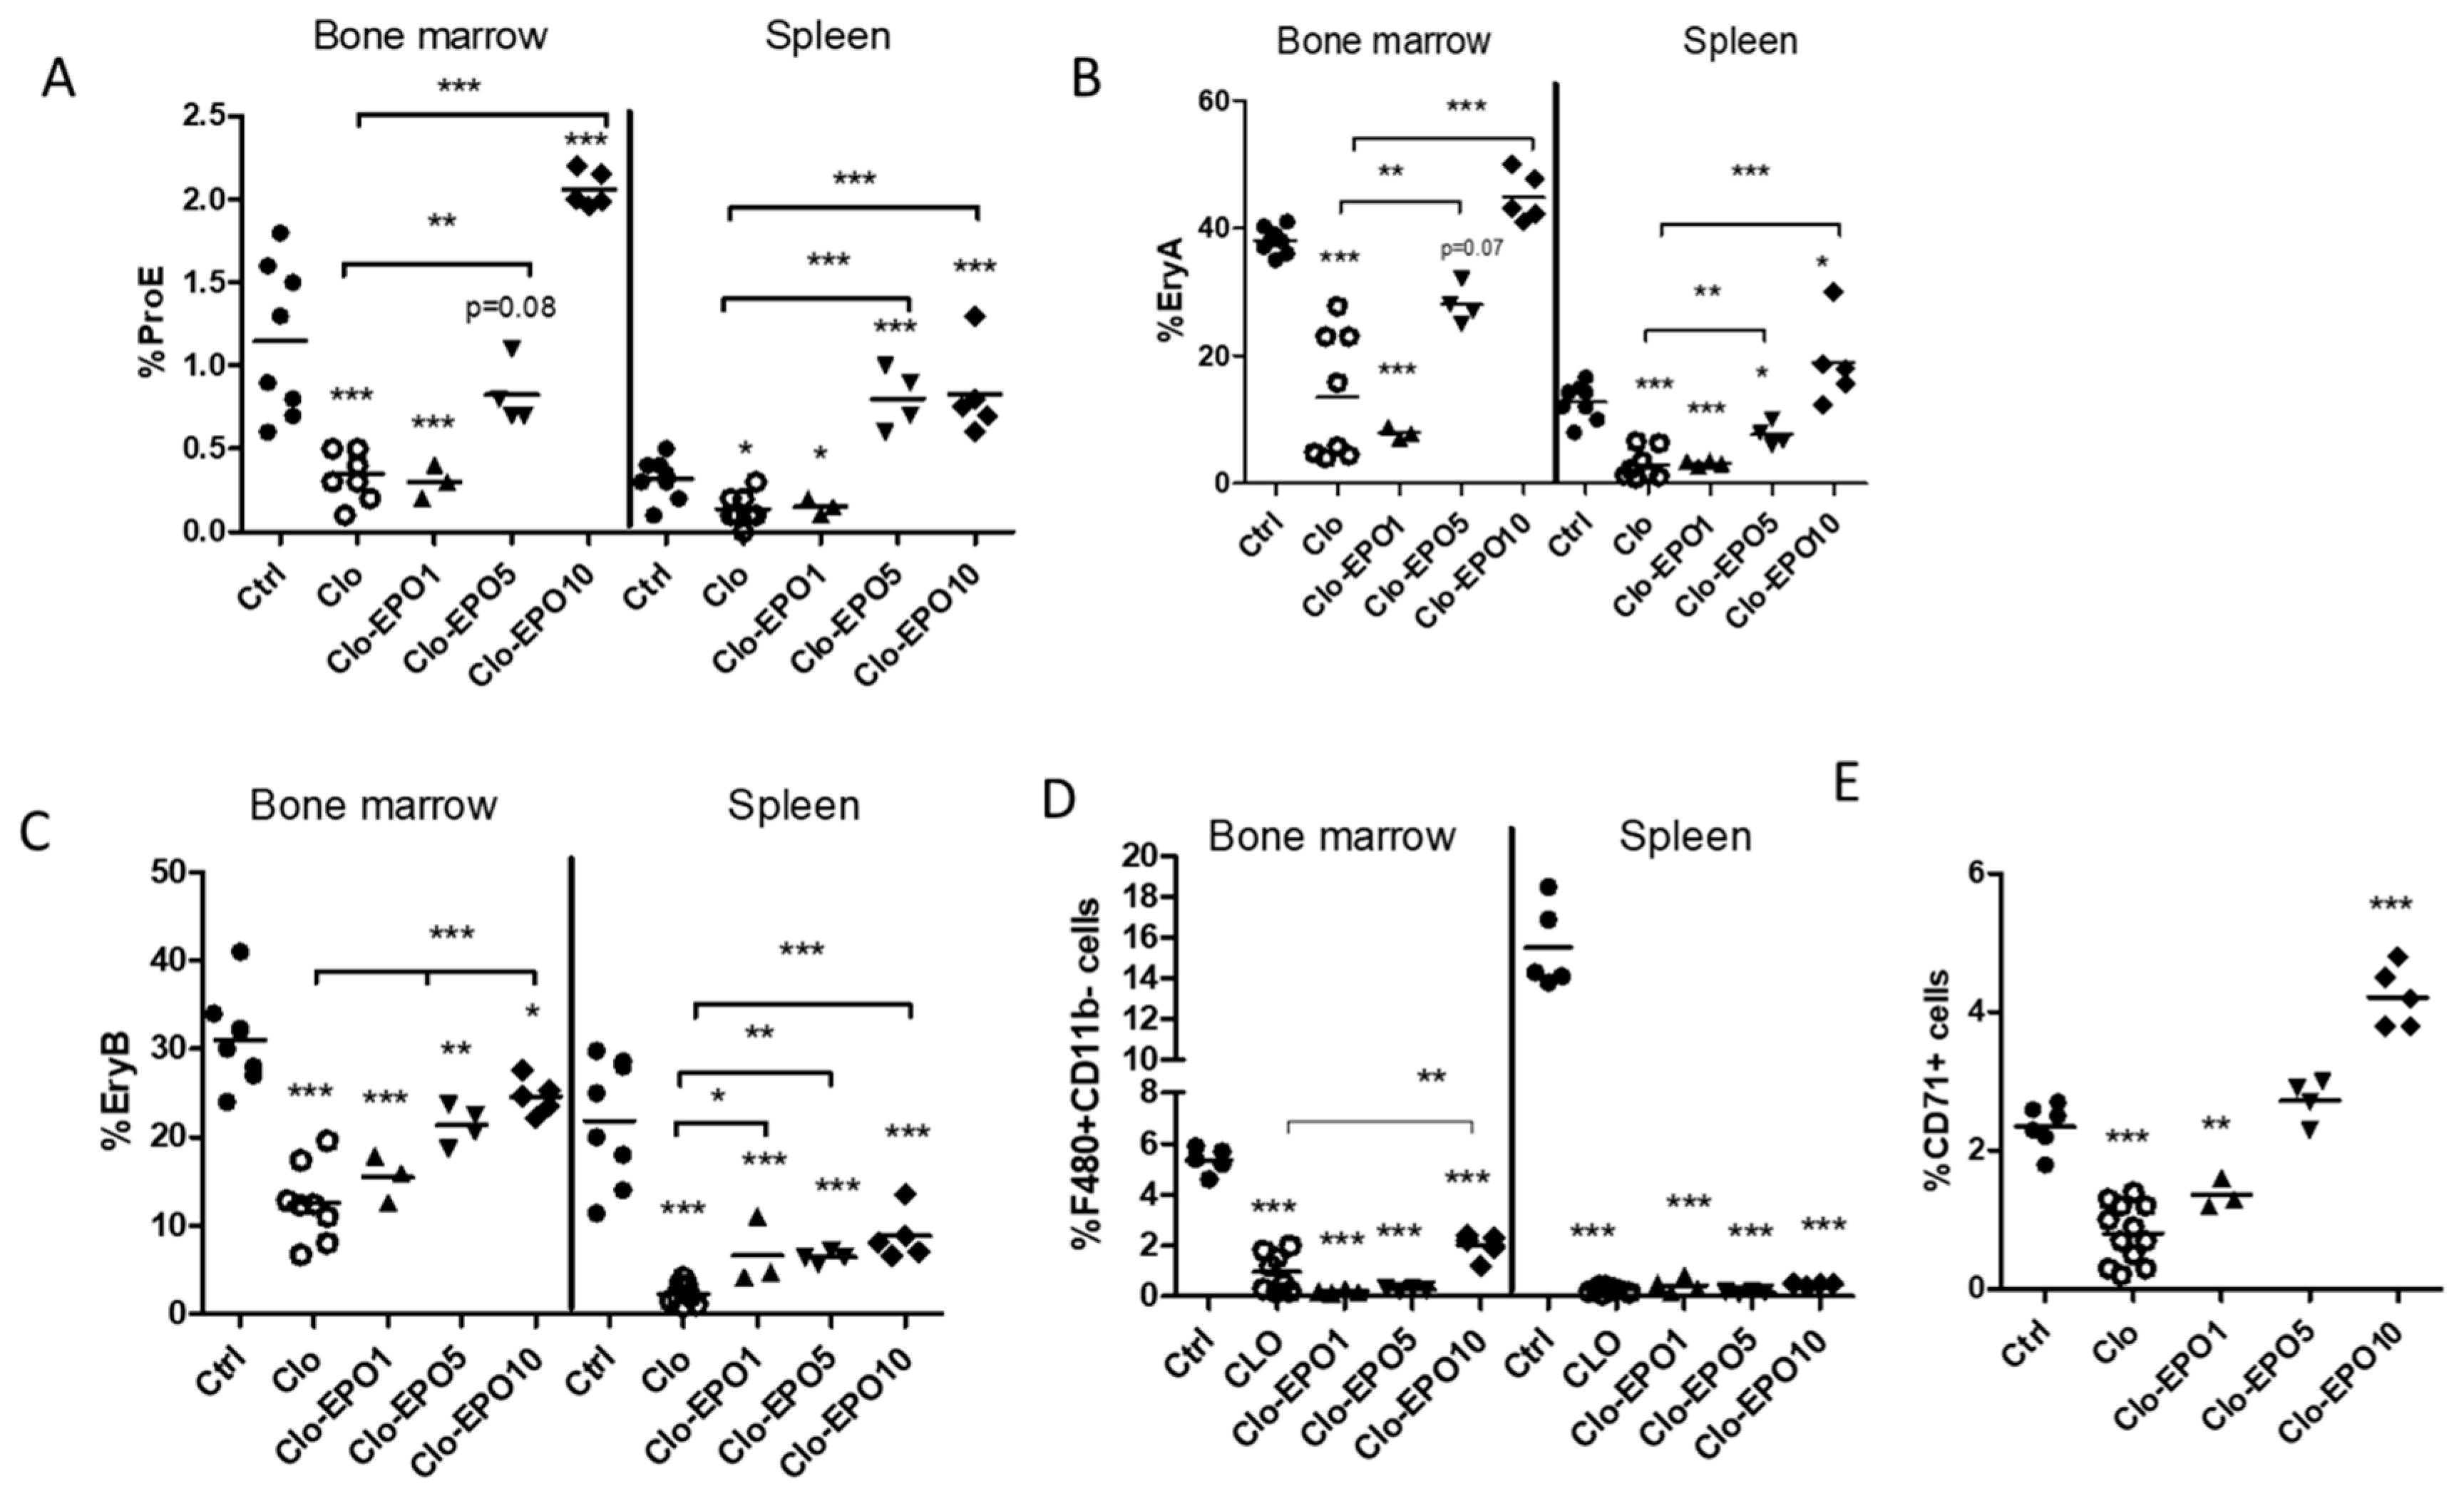
2.4. Restoration of Erythropoiesis by Exogenous EPO in Depleted Mice
3. Discussion
4. Materials and Methods
4.1. In Vitro Experiments
4.1.1. Generation of BMDM
4.1.2. Generation of Apoptotic Splenocyte, Apoptotic Media and Conditioning of BMDMs
4.1.3. Hematopoietic Stem Cells Co-Culture with BMDM
4.1.4. Analysis of EPO Transcript by RT-qPCR
4.1.5. EPO Detection by Western Blot
4.2. In Vivo Assays
4.2.1. Biological Model
4.2.2. Short and Long-Term Macrophage Depletion
4.2.3. Determination of EPO Concentration in Bone Marrow from Clodronate Treated Mice by ELISA
4.2.4. Restoration of Macrophage-Depleted Mice Erythropoiesis by EPO
4.2.5. Flow Cytometry
4.3. Detection of EBI Macrophage Intracellular EPO by IF and Confocal Imagery
4.4. Statistical Analysis
Supplementary Materials
Author Contributions
Funding
Acknowledgments
Conflicts of Interest
Abbreviations
| EPO | Erythropoietin |
| EBI | Erythroblastic island |
| BM | Bone marrow |
| BMDM | Bone marrow derived macrophages |
| EPO-R | Erythropoietin-receptor |
| FC | Flow cytometry |
| IF | Immunofluorescence |
| WB | Western Blot |
| ELISA | Enzyme-linked immunosorbent assay |
| qrtPCR | Quantitative reverse-transcriptase polymerase chain-reaction |
| rHuEPO | Recombinant human erythropoietin |
| S1P | Sphingosine-1-phosphate |
| IV | Intravenous |
| SC | Subcutaneous |
| BMDM | Bone marrow-derived macrophage |
| SDS-PAGE | Sodium Dodecyl Sulfate – Polyacrylamide gel electrophoresis |
References
- Bessis, M. Erythroblastic island, functional unity of bone marrow. Rev. d’Hematologie 1958, 13, 8–11. [Google Scholar]
- Chasis, J.A.; Mohandas, N. Erythroblastic islands: Niches for erythropoiesis. Blood 2008, 112, 470–478. [Google Scholar] [CrossRef] [PubMed] [Green Version]
- Chow, A.; Huggins, M.; Ahmed, J.; Hashimoto, D.; Lucas, D.; Kunisaki, Y.; Pinho, S.; Leboeuf, M.; Noizat, C.; Van Rooijen, N.; et al. CD169+ macrophages provide a niche promoting erythropoiesis under homeostasis and stress. Nat. Med. 2013, 19, 429–436. [Google Scholar] [CrossRef] [PubMed] [Green Version]
- Dzierzak, E.; Philipsen, S. Erythropoiesis: Development and Differentiation. Cold Spring Harb. Perspect. Med. 2013, 3, a011601. [Google Scholar] [CrossRef]
- Kawane, K. Requirement of DNase II for Definitive Erythropoiesis in the Mouse Fetal Liver. Science 2001, 292, 1546–1549. [Google Scholar] [CrossRef]
- Sadahira, Y.; Mori, M. Role of the macrophage in erythropoiesis. Pathol. Int. 1999, 49, 841–848. [Google Scholar] [CrossRef]
- Rich, I.N.; Vogt, C.; Pentz, S. Erythropoietin gene expression in vitro and in vivo detected by in situ hybridization. Blood Cells 1988, 14, 505–520. [Google Scholar]
- Luo, B.; Gan, W.; Liu, Z.; Shen, Z.; Wang, J.; Shi, R.; Liu, Y.; Liu, Y.; Jiang, M.; Zhang, Z.; et al. Erythropoeitin Signaling in Macrophages Promotes Dying Cell Clearance and Immune Tolerance. Immunity 2016, 44, 287–302. [Google Scholar] [CrossRef] [Green Version]
- Ramos, P.; Casu, C.; Gardenghi, S.; Breda, L.; Crielaard, B.J.; Guy, E.; Marongiu, M.F.; Gupta, R.; Levine, R.L.; Abdel-Wahab, O.; et al. Macrophages support pathological erythropoiesis in polycythemia vera and β-thalassemia. Nat. Med. 2013, 19, 437–445. [Google Scholar] [CrossRef] [Green Version]
- Liu, Y.; Pop, R.; Sadegh, C.; Brugnara, C.; Haase, V.H.; Socolovsky, M. Suppression of Fas-FasL coexpression by erythropoietin mediates erythroblast expansion during the erythropoietic stress response in vivo. Blood 2006, 108, 123–133. [Google Scholar] [CrossRef]
- Chang, K.-H.; Stevenson, M.M. Comparison of murine Epo ELISA and Epo bioassays in detecting serum Epo levels during anemia associated with malaria infection. J. Immunol. Methods 2002, 262, 129–136. [Google Scholar] [CrossRef]
- Millot, S.; Andrieu, V.; Letteron, P.; Lyoumi, S.; Hurtado-Nedelec, M.; Karim, Z.; Thibaudeau, O.; Bennada, S.; Charrier, J.-L.; Lasocki, S.; et al. Erythropoietin stimulates spleen BMP4-dependent stress erythropoiesis and partially corrects anemia in a mouse model of generalized inflammation. Blood 2010, 116, 6072–6081. [Google Scholar] [CrossRef] [PubMed]
- Morceau, F.; Dicato, M.; Diederich, M. Pro-Inflammatory Cytokine-Mediated Anemia: Regarding Molecular Mechanisms of Erythropoiesis. Mediat. Inflamm. 2009, 2009, 1–11. [Google Scholar] [CrossRef] [PubMed] [Green Version]
- Winterbourn, C.C. Oxidative denaturation in congenital hemolytic anemias: The unstable hemoglobins. Semin. Hematol. 1990, 27, 41–50. [Google Scholar] [PubMed]
- Zeigler, B.; Vajdos, J.; Qin, W.; Loverro, L.; Niss, K. A mouse model for an erythropoietin-deficiency anemia. Dis. Model. Mech. 2010, 3, 763–772. [Google Scholar] [CrossRef] [Green Version]
- Jelkmann, W. Regulation of erythropoietin production. J. Physiol. 2011, 589, 1251–1258. [Google Scholar] [CrossRef]
- Jelkmann, W. Molecular Biology of Erythropoietin. Intern. Med. 2004, 43, 649–659. [Google Scholar] [CrossRef] [Green Version]
- Wagner, K.F.; Katschinski, D.M.; Hasegawa, J.; Schumacher, D.; Meller, B.; Gembruch, U.; Schramm, U.; Jelkmann, W.; Gassmann, M.; Fandrey, J. Chronic inborn erythrocytosis leads to cardiac dysfunction and premature death in mice overexpressing erythropoietin. Blood 2001, 97, 536–542. [Google Scholar] [CrossRef] [Green Version]
- Koury, S.T.; Koury, M.J.; Bondurant, M.C.; Caro, J.; Graber, S.E. Quantitation of erythropoietin-producing cells in kidneys of mice by in situ hybridization: Correlation with hematocrit, renal erythropoietin mRNA, and serum erythropoietin concentration. Blood 1989, 74, 645–651. [Google Scholar] [CrossRef] [Green Version]
- Elliott, S.G.; Foote, M.; Molineux, G. Erythropoietins, Erythropoietic Factors, and Erythropoiesis: Molecular, Cellular, Preclinical, and Clinical Biology; Springer Science & Business Media: Berlin/Heidelberg, Germany, 2009. [Google Scholar]
- Gregoli, P.A.; Bondurant, M.C. The roles of Bcl-XL and apopain in the control of erythropoiesis by erythropoietin. Blood 1997, 90, 630–640. [Google Scholar] [CrossRef] [Green Version]
- Lee, R.; Kertesz, N.; Joseph, S.B.; Jegalian, A.; Wu, H. Erythropoietin (Epo) and EpoR expression and 2 waves of erythropoiesis. Blood 2001, 98, 1408–1415. [Google Scholar] [CrossRef] [PubMed] [Green Version]
- Paulson, R.F.; Shi, L.; Wu, D.-C. Stress erythropoiesis: New signals and new stress progenitor cells. Curr. Opin. Hematol. 2011, 18, 139–145. [Google Scholar] [CrossRef] [PubMed] [Green Version]
- Rhodes, M.M.; Kopsombut, P.; Bondurant, M.C.; Price, J.O.; Koury, M.J. Adherence to macrophages in erythroblastic islands enhances erythroblast proliferation and increases erythrocyte production by a different mechanism than erythropoietin. Blood 2008, 111, 1700–1708. [Google Scholar] [CrossRef] [PubMed] [Green Version]
- Chen, K.; Liu, J.; Heck, S.; Chasis, J.A.; An, X.; Mohandas, N. Resolving the distinct stages in erythroid differentiation based on dynamic changes in membrane protein expression during erythropoiesis. Proc. Natl. Acad. Sci. USA 2009, 106, 17413–17418. [Google Scholar] [CrossRef] [Green Version]
- Hattangadi, S.M.; Wong, P.; Zhang, L.; Flygare, J.; Lodish, H.F. From stem cell to red cell: Regulation of erythropoiesis at multiple levels by multiple proteins, RNAs, and chromatin modifications. Blood 2011, 118, 6258–6268. [Google Scholar] [CrossRef] [Green Version]
- Carlile, G.W.; Smith, D.H.; Wiedmann, M. Caspase-3 has a nonapoptotic function in erythroid maturation. Blood 2004, 103, 4310–4316. [Google Scholar] [CrossRef] [Green Version]
- De Maria, R.; Zeuner, A.; Eramo, A.; Domenichelli, C.; Bonci, D.; Grignani, F.; Srinivasula, S.M.; Alnemri, E.S.; Testa, U.; Peschle, C. Negative regulation of erythropoiesis by caspase-mediated cleavage of GATA-1. Nat. Cell Biol. 1999, 401, 489–493. [Google Scholar] [CrossRef]
- Shuga, J.; Zhang, J.; Samson, L.D.; Lodish, H.F.; Griffith, L.G. In vitro erythropoiesis from bone marrow-derived progenitors provides a physiological assay for toxic and mutagenic compounds. Proc. Natl. Acad. Sci. USA 2007, 104, 8737–8742. [Google Scholar] [CrossRef] [Green Version]


Publisher’s Note: MDPI stays neutral with regard to jurisdictional claims in published maps and institutional affiliations. |
© 2020 by the authors. Licensee MDPI, Basel, Switzerland. This article is an open access article distributed under the terms and conditions of the Creative Commons Attribution (CC BY) license (http://creativecommons.org/licenses/by/4.0/).
Share and Cite
Perron-Deshaies, G.; St-Louis, P.; Romero, H.; Scorza, T. Impact of Erythropoietin Production by Erythroblastic Island Macrophages on Homeostatic Murine Erythropoiesis. Int. J. Mol. Sci. 2020, 21, 8930. https://0-doi-org.brum.beds.ac.uk/10.3390/ijms21238930
Perron-Deshaies G, St-Louis P, Romero H, Scorza T. Impact of Erythropoietin Production by Erythroblastic Island Macrophages on Homeostatic Murine Erythropoiesis. International Journal of Molecular Sciences. 2020; 21(23):8930. https://0-doi-org.brum.beds.ac.uk/10.3390/ijms21238930
Chicago/Turabian StylePerron-Deshaies, Genève, Philippe St-Louis, Hugo Romero, and Tatiana Scorza. 2020. "Impact of Erythropoietin Production by Erythroblastic Island Macrophages on Homeostatic Murine Erythropoiesis" International Journal of Molecular Sciences 21, no. 23: 8930. https://0-doi-org.brum.beds.ac.uk/10.3390/ijms21238930