A Plasma Proteomic Signature of Skeletal Muscle Mitochondrial Function

 , ,
, ,  ,
,
Abstract
:1. Introduction
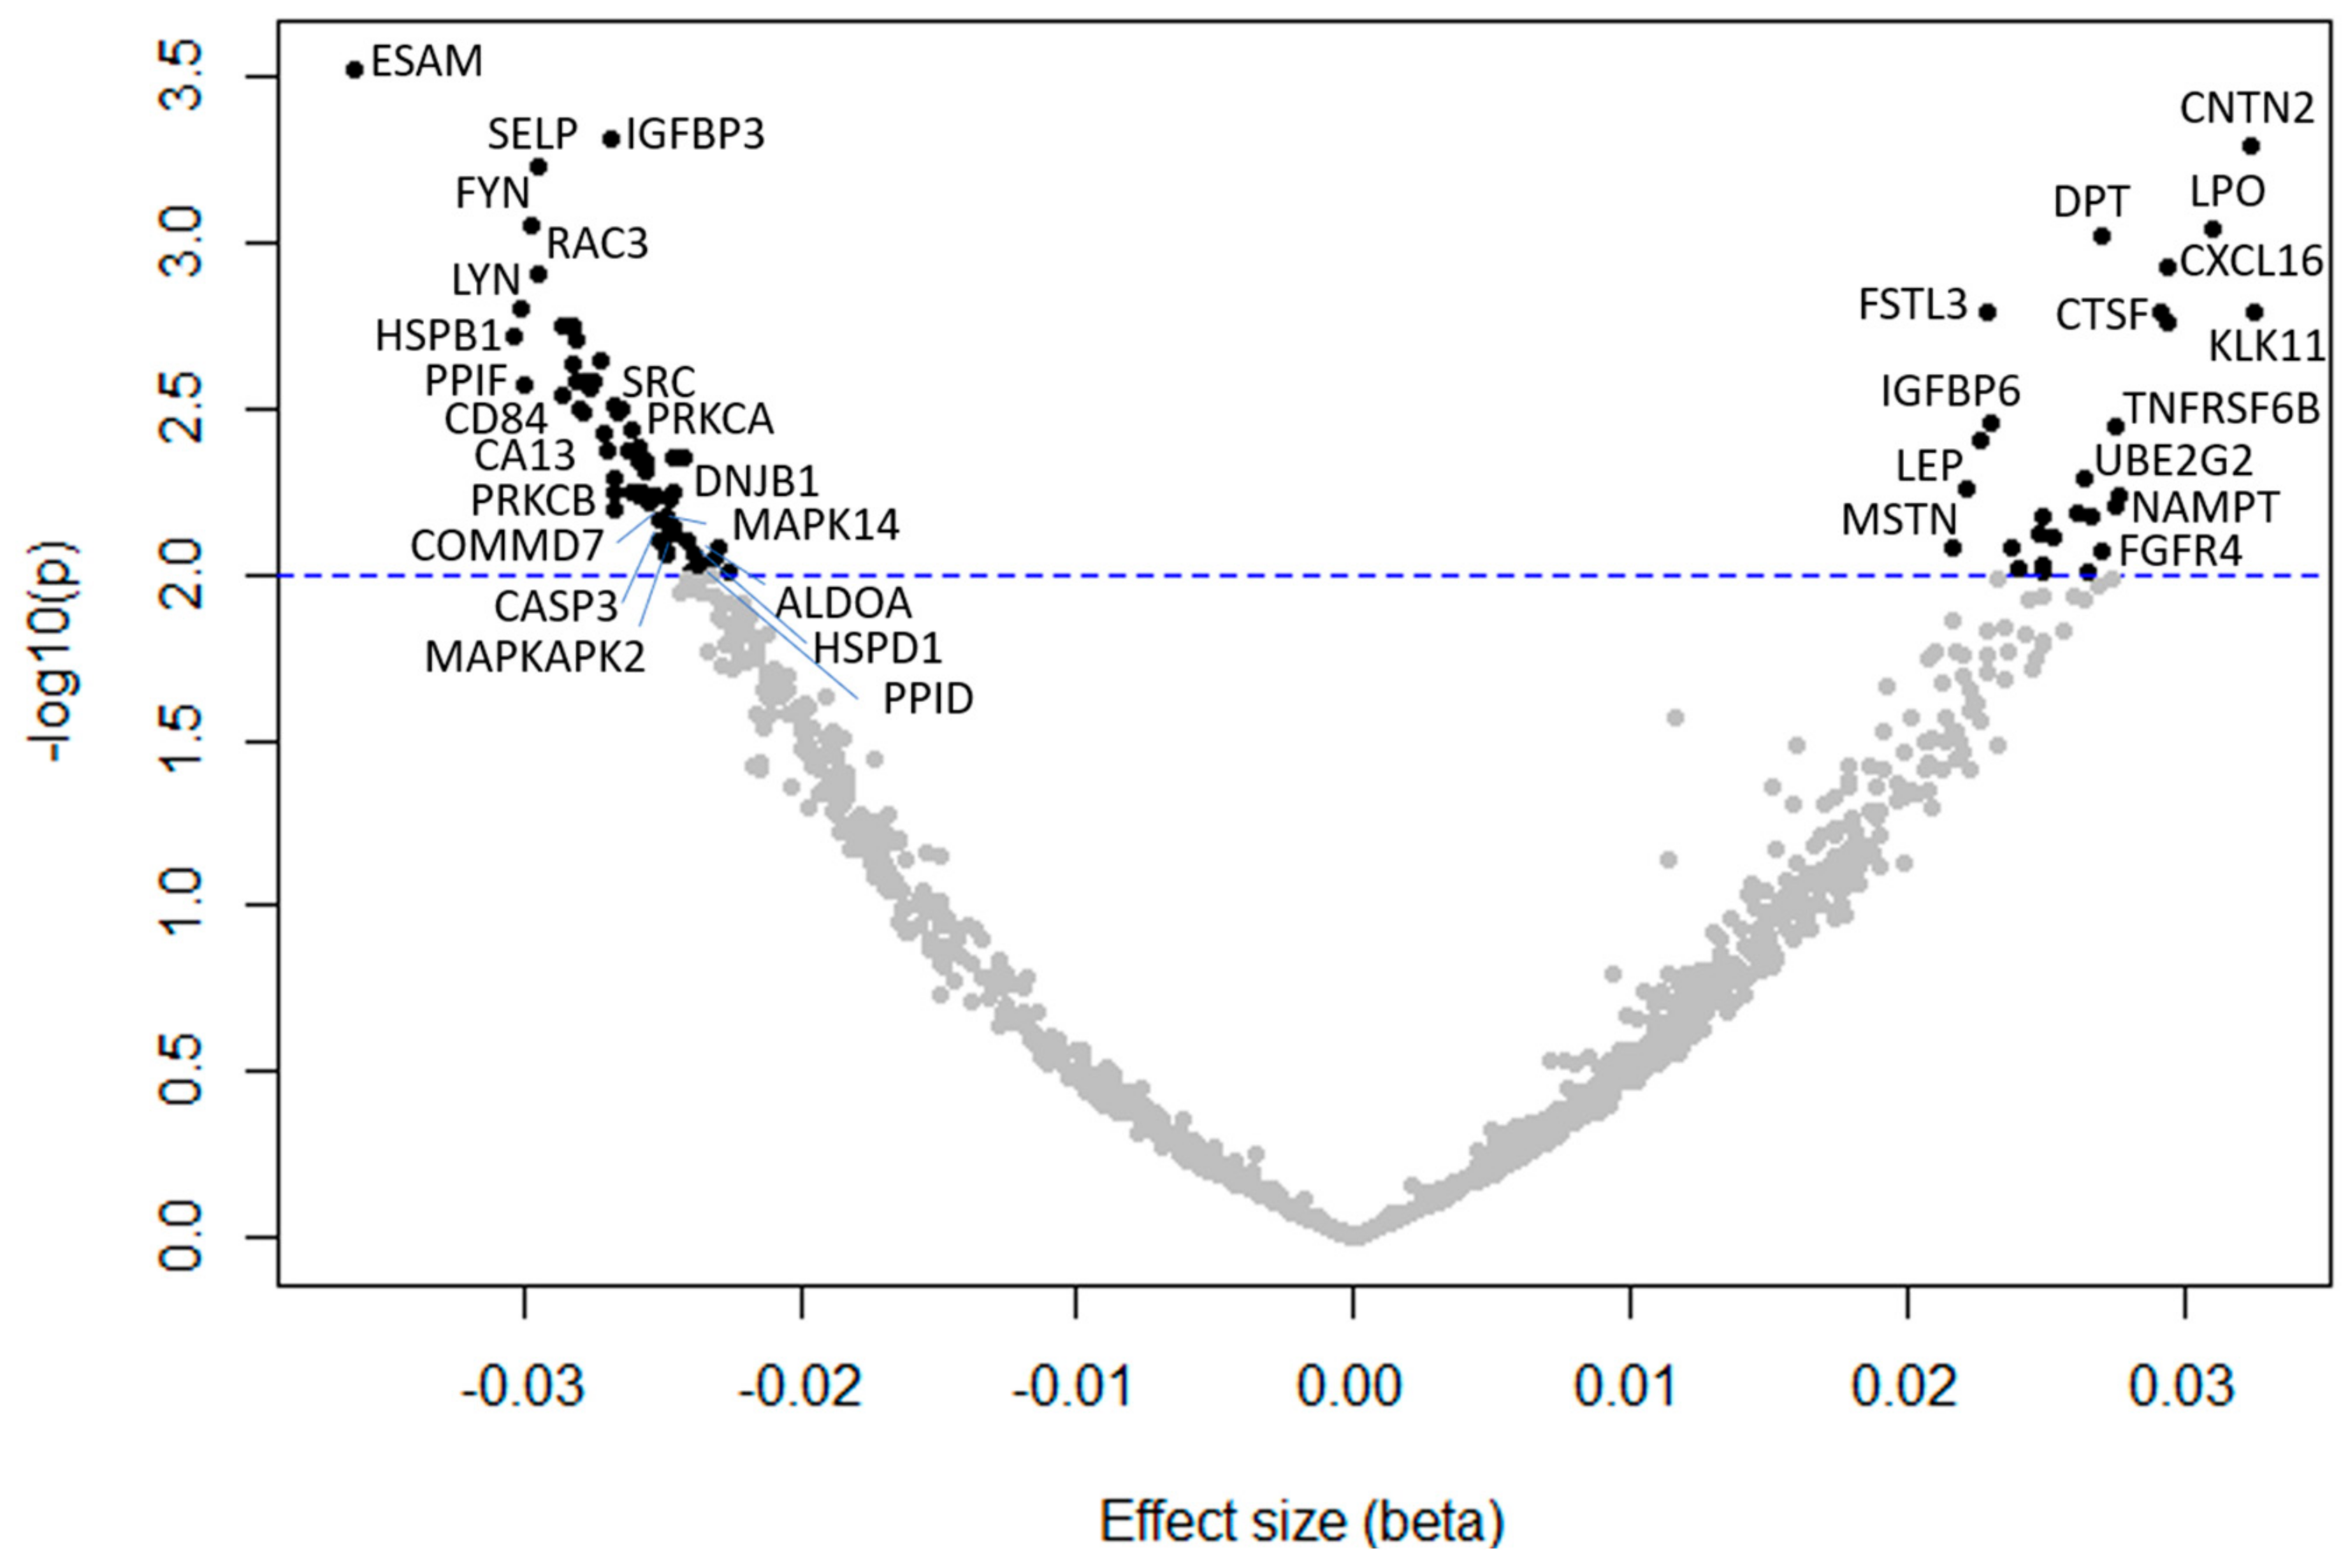
2. Results
3. Discussion
3.1. Energy Metabolism
3.2. Proteostasis
3.3. Inflammation and Response to Reactive Oxygen Species
3.4. Growth Differentiation Factor 15
4. Materials and Methods
4.1. Participants
4.2. Proteomic Assessment
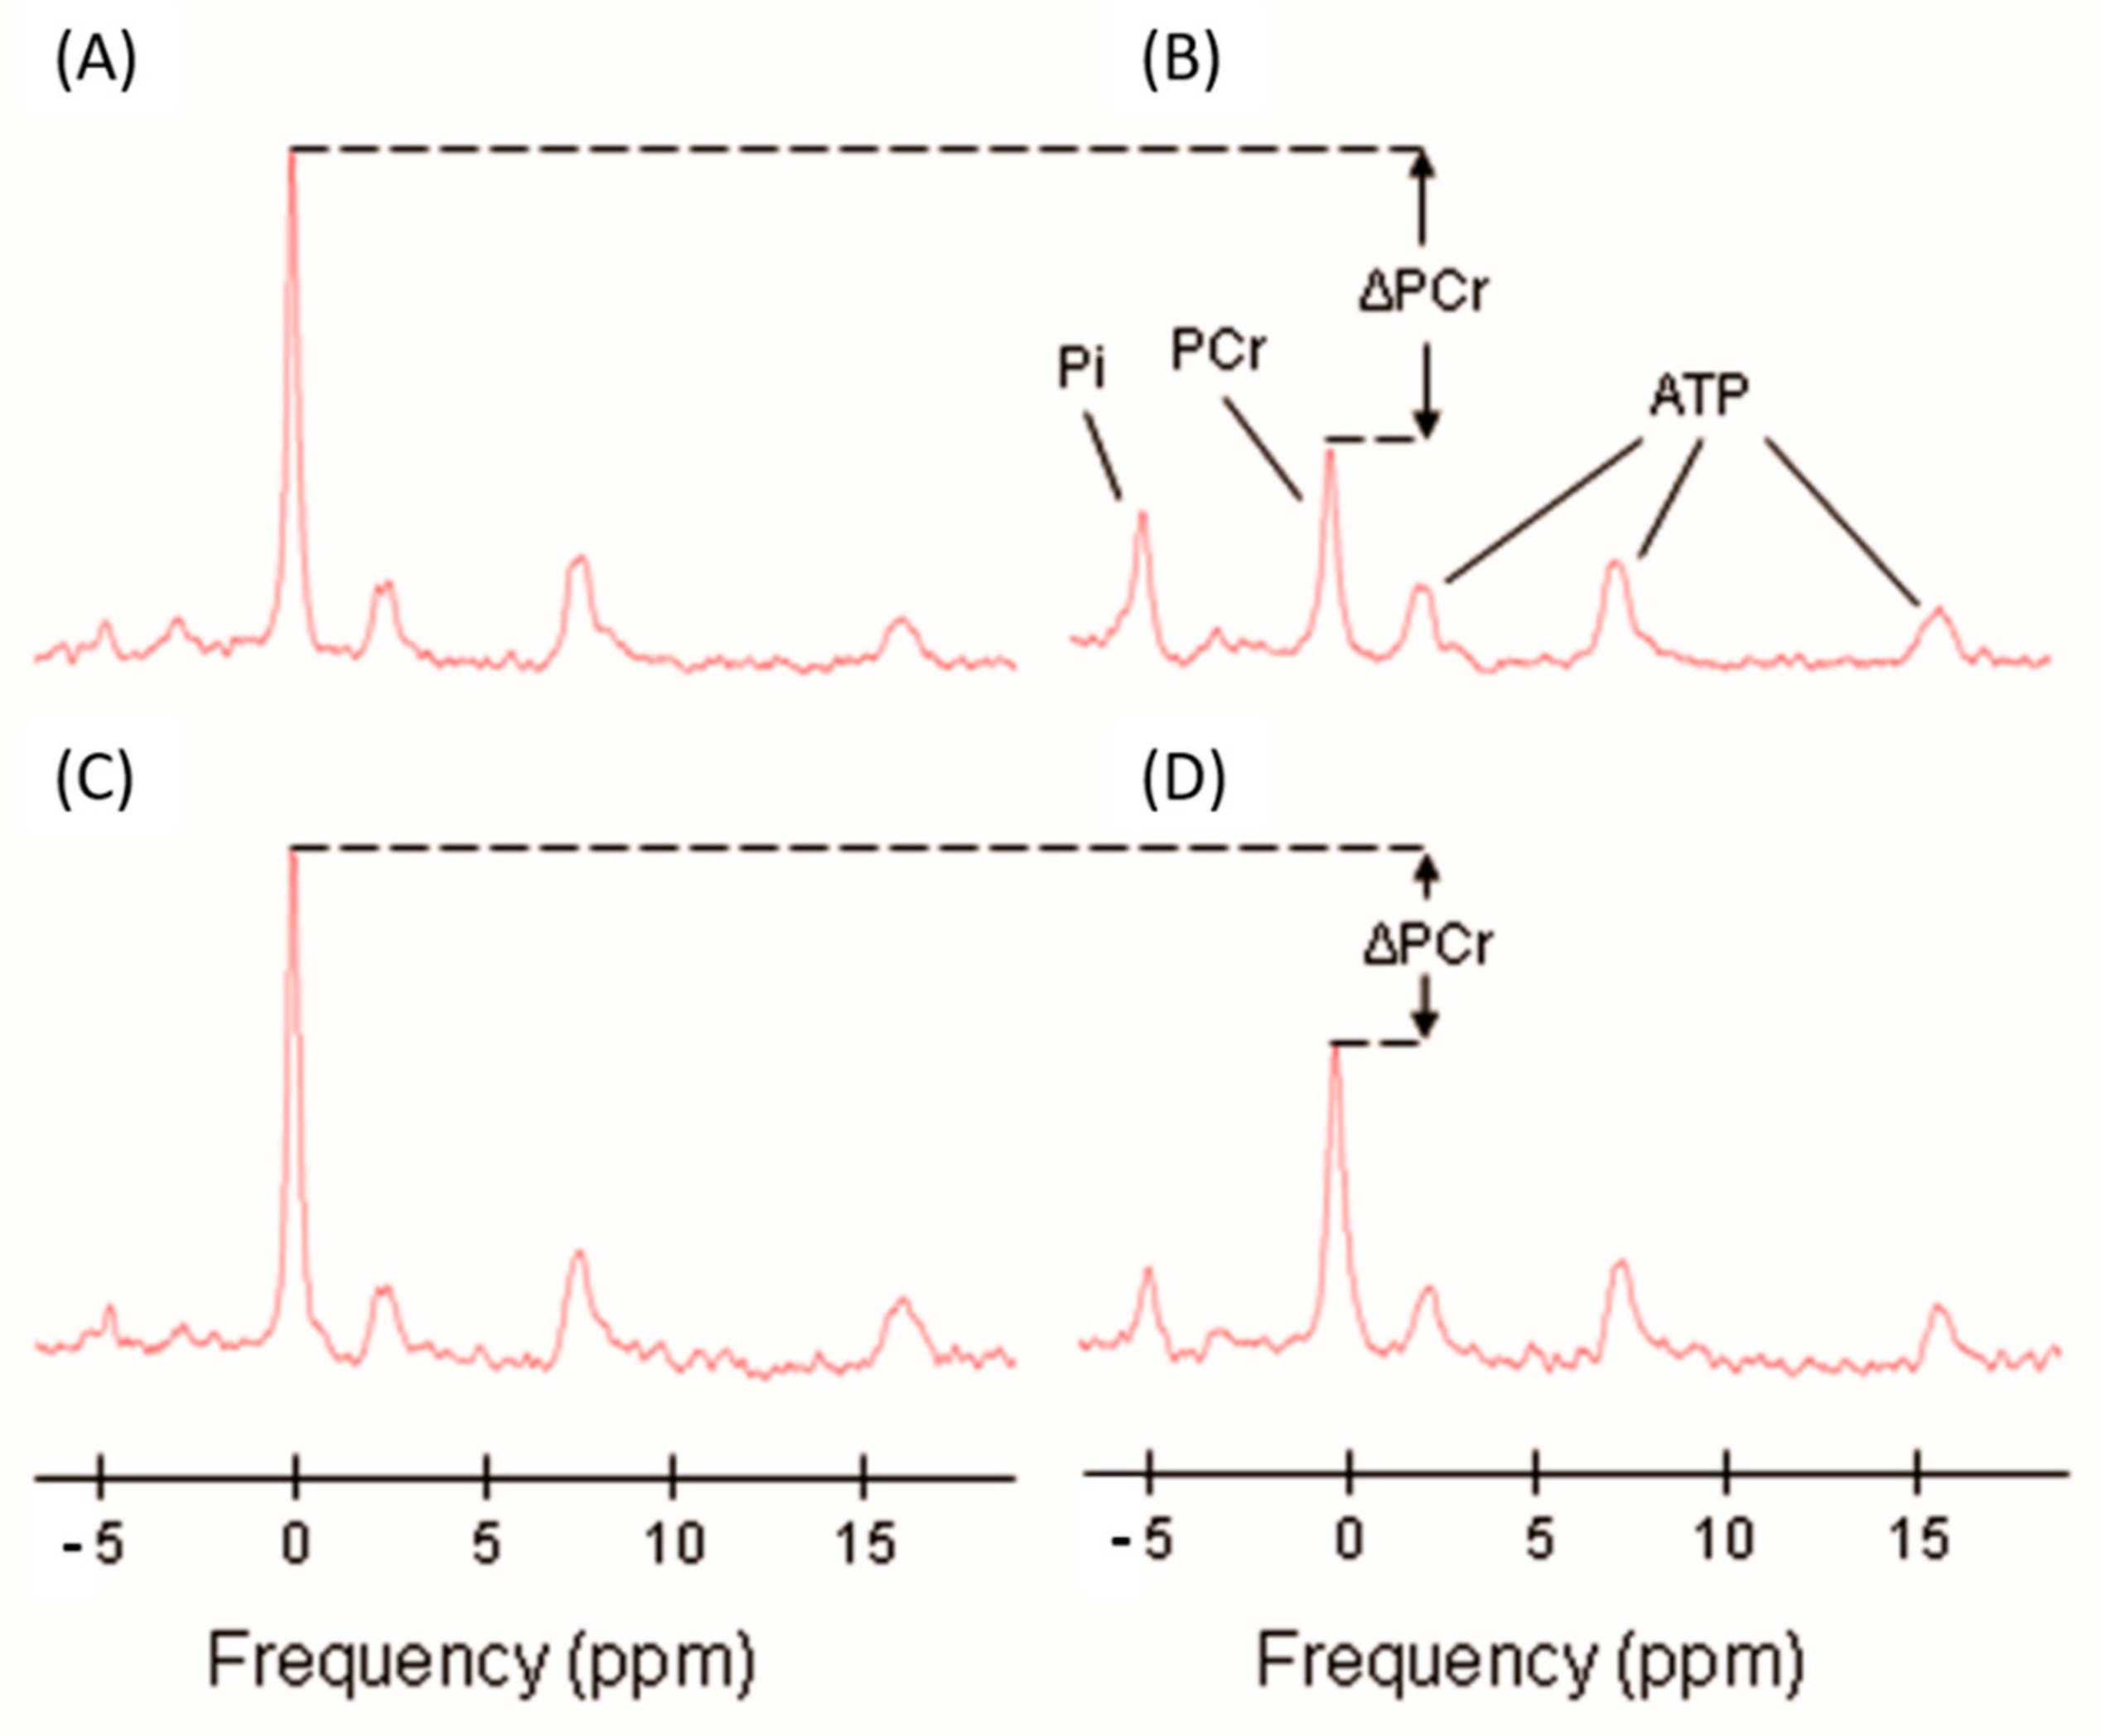
4.3. Phosphorus Magnetic Resonance Spectroscopy
4.4. Statistical Analysis
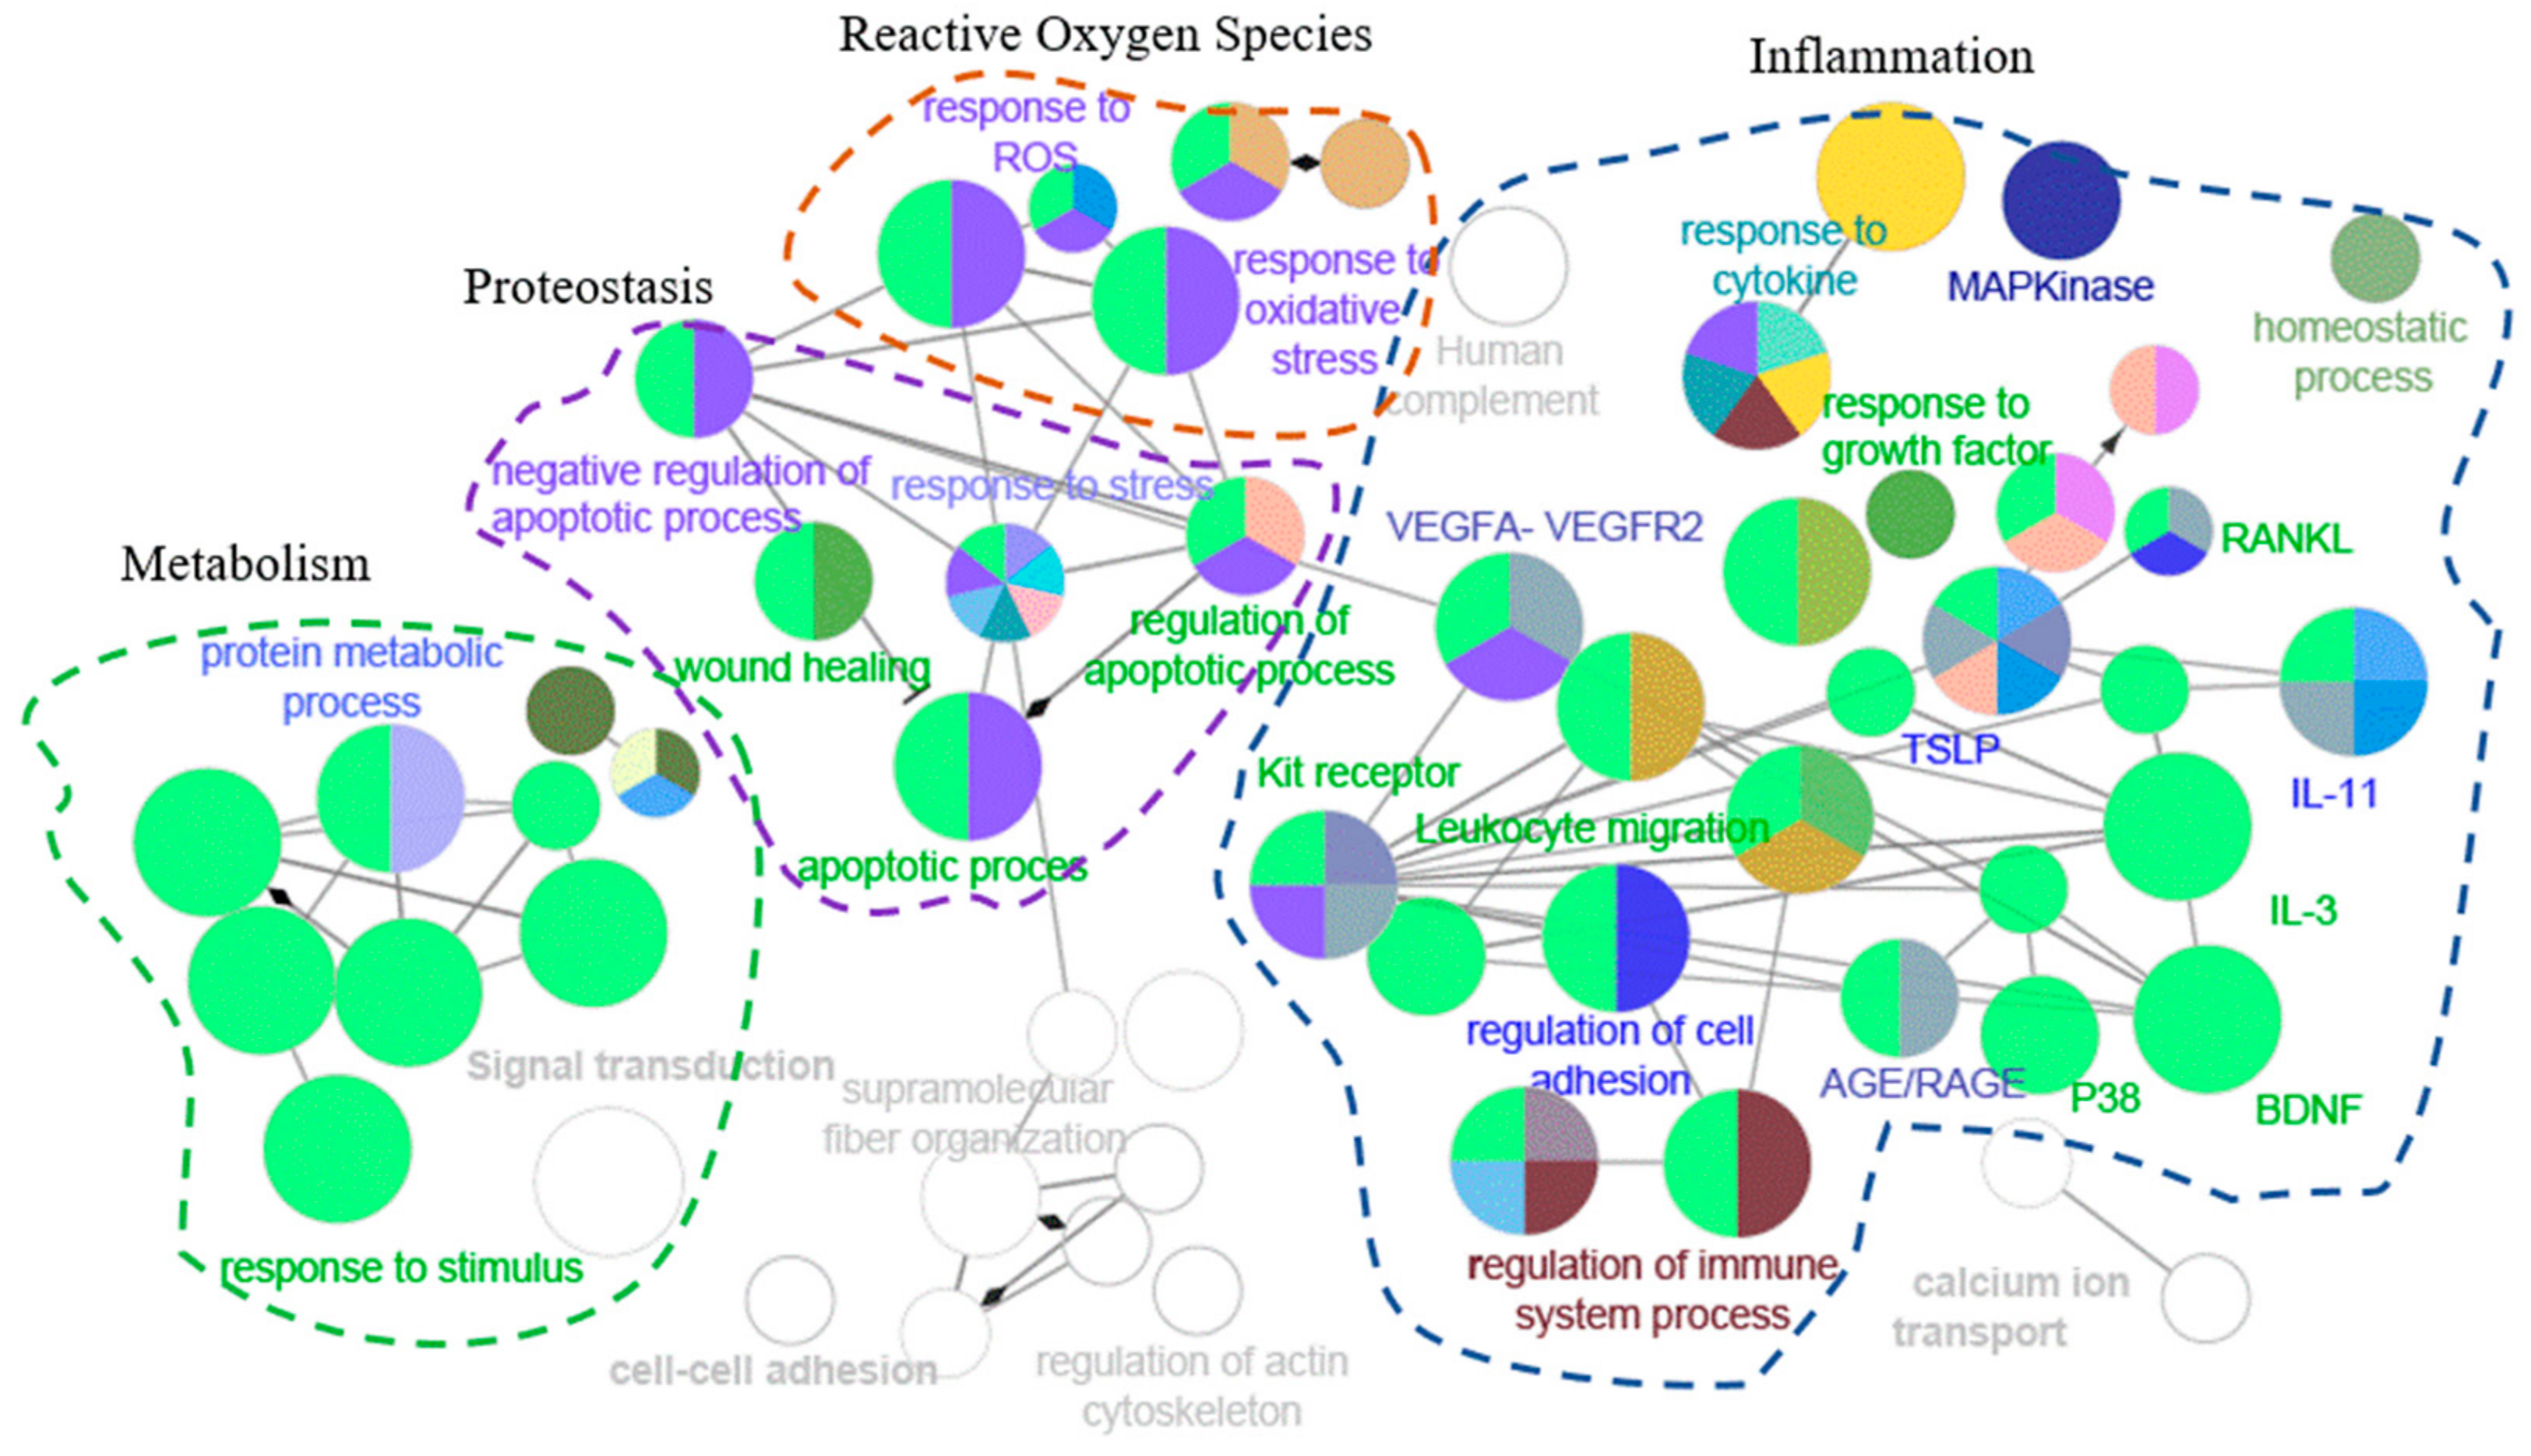
4.5. Enrichment Analysis
5. Limitations and Conclusions
Supplementary Materials
Author Contributions
Funding
Conflicts of Interest
References
- Ohlendieck, K. Proteomics of skeletal muscle differentiation, neuromuscular disorders and fiber aging. Expert Rev. Proteom. 2010, 7, 283–296. [Google Scholar] [CrossRef]
- López-Otín, C.; Blasco, M.A.; Partridge, L.; Serrano, M.; Kroemer, G. The hallmarks of aging. Cell 2013, 153, 1194–1217. [Google Scholar] [CrossRef] [PubMed] [Green Version]
- Bratic, A.; Larsson, N.-G. The role of mitochondria in aging. J. Clin. Investig. 2013, 123, 951–957. [Google Scholar] [CrossRef] [PubMed] [Green Version]
- Dai, D.-F.; Rabinovitch, P.S.; Ungvari, Z. Mitochondria and cardiovascular aging. Circ. Res. 2012, 110, 1109–1124. [Google Scholar] [CrossRef]
- Green, D.R.; Galluzzi, L.; Kroemer, G. Mitochondria and the autophagy–inflammation–cell death axis in organismal aging. Science 2011, 333, 1109–1112. [Google Scholar] [CrossRef] [PubMed] [Green Version]
- Zane, A.C.; Reiter, D.A.; Shardell, M.; Cameron, D.; Simonsick, E.M.; Fishbein, K.W.; Studenski, S.A.; Spencer, R.G.; Ferrucci, L. Muscle strength mediates the relationship between mitochondrial energetics and walking performance. Aging Cell 2017, 16, 461–468. [Google Scholar] [CrossRef] [PubMed]
- Choi, S.; Reiter, D.A.; Shardell, M.; Simonsick, E.M.; Studenski, S.; Spencer, R.G.; Fishbein, K.W.; Ferrucci, L. 31P magnetic resonance spectroscopy assessment of muscle bioenergetics as a predictor of gait speed in the Baltimore Longitudinal Study of Aging. J. Gerontol. Ser. A Biomed. Sci. Med. Sci. 2016, 71, 1638–1645. [Google Scholar] [CrossRef] [Green Version]
- Adelnia, F.; Urbanek, J.; Osawa, Y.; Shardell, M.; Brennan, N.A.; Fishbein, K.W.; Spencer, R.G.; Simonsick, E.M.; Schrack, J.A.; Ferrucci, L. Moderate-to-Vigorous Physical Activity Is Associated With Higher Muscle Oxidative Capacity in Older Adults. J. Am. Geriatr. Soc. 2019, 67, 1695–1699. [Google Scholar] [CrossRef]
- Zampino, M.; Brennan, N.A.; Kuo, P.-L.; Spencer, R.G.; Fishbein, K.W.; Simonsick, E.M.; Ferrucci, L. Poor mitochondrial health and systemic inflammation? Test of a classic hypothesis in the Baltimore Longitudinal Study of Aging. GeroScience 2020, 42, 1175–1182. [Google Scholar] [CrossRef]
- Ubaida-Mohien, C.; Lyashkov, A.; Gonzalez-Freire, M.; Tharakan, R.; Shardell, M.; Moaddel, R.; Semba, R.D.; Chia, C.W.; Gorospe, M.; Sen, R. Discovery proteomics in aging human skeletal muscle finds change in spliceosome, immunity, proteostasis and mitochondria. Elife 2019, 8, e49874. [Google Scholar] [CrossRef]
- Adelnia, F.; Ubaida-Mohien, C.; Moaddel, R.; Shardell, M.; Lyashkov, A.; Fishbein, K.W.; Aon, M.A.; Spencer, R.G.; Ferrucci, L. Proteomic signatures of in vivo muscle oxidative capacity in healthy adults. Aging Cell 2020, 19, e13124. [Google Scholar] [CrossRef] [PubMed]
- Peruzzi, F.; Prisco, M.; Dews, M.; Salomoni, P.; Grassilli, E.; Romano, G.; Calabretta, B.; Baserga, R. Multiple signaling pathways of the insulin-like growth factor 1 receptor in protection from apoptosis. Mol. Cell. Biol. 1999, 19, 7203–7215. [Google Scholar] [CrossRef] [PubMed] [Green Version]
- Marzetti, E.; Calvani, R.; Bernabei, R.; Leeuwenburgh, C. Apoptosis in skeletal myocytes: A potential target for interventions against sarcopenia and physical frailty–a mini-review. Gerontology 2012, 58, 99–106. [Google Scholar] [CrossRef] [PubMed]
- Friedman, J.M. Leptin and the Endocrine Control of Energy Balance. Nat. Metab. 2019, 1, 754–764. [Google Scholar] [CrossRef] [PubMed]
- Yamagishi, S.-I.; Edelstein, D.; Du, X.-L.; Kaneda, Y.; Guzmán, M.; Brownlee, M. Leptin induces mitochondrial superoxide production and monocyte chemoattractant protein-1 expression in aortic endothelial cells by increasing fatty acid oxidation via protein kinase A. J. Biol. Chem. 2001, 276, 25096–25100. [Google Scholar] [CrossRef] [PubMed] [Green Version]
- Ahima, R.S.; Flier, J.S. Leptin. Annu. Rev. Physiol. 2000, 62, 413–437. [Google Scholar] [CrossRef] [Green Version]
- Herzig, S.; Shaw, R.J. AMPK: Guardian of metabolism and mitochondrial homeostasis. Nat. Rev. Mol. Cell Biol. 2018, 19, 121. [Google Scholar] [CrossRef] [Green Version]
- Kreuder, J.; Borkhardt, A.; Repp, R.; Pekrun, A.; Göttsche, B.; Gottschalk, U.; Reichmann, H.; Schachenmayr, W.; Schlegel, K.; Lampert, F. Inherited metabolic myopathy and hemolysis due to a mutation in aldolase A. N. Engl. J. Med. 1996, 334, 1100–1105. [Google Scholar] [CrossRef]
- Merkulova, M.; Hurtado-Lorenzo, A.; Hosokawa, H.; Zhuang, Z.; Brown, D.; Ausiello, D.A.; Marshansky, V. Aldolase directly interacts with ARNO and modulates cell morphology and acidic vesicle distribution. Am. J. Physiol. Cell Physiol. 2011, 300, C1442–C1455. [Google Scholar] [CrossRef]
- Yaku, K.; Okabe, K.; Nakagawa, T. NAD metabolism: Implications in aging and longevity. Ageing Res. Rev. 2018, 47, 1–17. [Google Scholar] [CrossRef]
- Lin, S.-J.; Guarente, L. Nicotinamide adenine dinucleotide, a metabolic regulator of transcription, longevity and disease. Curr. Opin. Cell Biol. 2003, 15, 241–246. [Google Scholar] [CrossRef]
- Huang, Z.; Ruan, H.-B.; Xian, L.; Chen, W.; Jiang, S.; Song, A.; Wang, Q.; Shi, P.; Gu, X.; Gao, X. The stem cell factor/Kit signalling pathway regulates mitochondrial function and energy expenditure. Nat. Commun. 2014, 5, 1–10. [Google Scholar] [CrossRef] [PubMed] [Green Version]
- Fernandez-Marcos, P.J.; Auwerx, J. Regulation of PGC-1α, a nodal regulator of mitochondrial biogenesis. Am. J. Clin. Nutr. 2011, 93, 884S–890S. [Google Scholar] [CrossRef] [Green Version]
- Leone, T.C.; Lehman, J.J.; Finck, B.N.; Schaeffer, P.J.; Wende, A.R.; Boudina, S.; Courtois, M.; Wozniak, D.F.; Sambandam, N.; Bernal-Mizrachi, C. PGC-1α deficiency causes multi-system energy metabolic derangements: Muscle dysfunction, abnormal weight control and hepatic steatosis. PLoS Biol. 2005, 3, e101. [Google Scholar] [CrossRef] [PubMed] [Green Version]
- Semba, R.D.; Nicklett, E.J.; Ferrucci, L. Does accumulation of advanced glycation end products contribute to the aging phenotype? J. Gerontol. Ser. A Biomed. Sci. Med. Sci. 2010, 65, 963–975. [Google Scholar] [CrossRef] [PubMed] [Green Version]
- Thompson, H.; Scordilis, S.; Clarkson, P.; Lohrer, W. A single bout of eccentric exercise increases HSP27 and HSC/HSP70 in human skeletal muscle. Acta Physiol. Scand. 2001, 171, 187–193. [Google Scholar] [CrossRef] [PubMed]
- Davis, T.L.; Walker, J.R.; Campagna-Slater, V.; Finerty, P.J., Jr.; Paramanathan, R.; Bernstein, G.; MacKenzie, F.; Tempel, W.; Ouyang, H.; Lee, W.H. Structural and biochemical characterization of the human cyclophilin family of peptidyl-prolyl isomerases. PLoS Biol. 2010, 8, e1000439. [Google Scholar] [CrossRef] [PubMed] [Green Version]
- McArdle, A.; Vasilaki, A.; Jackson, M. Exercise and skeletal muscle ageing: Cellular and molecular mechanisms. Ageing Res. Rev. 2002, 1, 79–93. [Google Scholar] [CrossRef]
- McArdle, A.; Dillmann, W.H.; Mestril, R.; Faulkner, J.A.; Jackson, M.J. Overexpression of HSP70 in mouse skeletal muscle protects against muscle damage and age-related muscle dysfunction. FASEB J. 2004, 18, 1–12. [Google Scholar] [CrossRef]
- Doran, P.; Donoghue, P.; O’Connell, K.; Gannon, J.; Ohlendieck, K. Proteomics of skeletal muscle aging. Proteomics 2009, 9, 989–1003. [Google Scholar] [CrossRef]
- López-Armada, M.J.; Riveiro-Naveira, R.R.; Vaamonde-García, C.; Valcárcel-Ares, M.N. Mitochondrial dysfunction and the inflammatory response. Mitochondrion 2013, 13, 106–118. [Google Scholar] [CrossRef]
- Sun, N.; Youle, R.J.; Finkel, T. The mitochondrial basis of aging. Mol. Cell 2016, 61, 654–666. [Google Scholar] [CrossRef] [PubMed] [Green Version]
- Kim, E.K.; Choi, E.-J. Pathological roles of MAPK signaling pathways in human diseases. Biochim. Biophys. Acta (BBA) Mol. Basis Dis. 2010, 1802, 396–405. [Google Scholar] [CrossRef] [PubMed] [Green Version]
- Basisty, N.; Kale, A.; Jeon, O.H.; Kuehnemann, C.; Payne, T.; Rao, C.; Holtz, A.; Shah, S.; Sharma, V.; Ferrucci, L. A proteomic atlas of senescence-associated secretomes for aging biomarker development. PLoS Biol. 2020, 18, e3000599. [Google Scholar] [CrossRef] [PubMed] [Green Version]
- Coppé, J.-P.; Desprez, P.-Y.; Krtolica, A.; Campisi, J. The senescence-associated secretory phenotype: The dark side of tumor suppression. Annu. Rev. Pathol. Mech. Dis. 2010, 5, 99–118. [Google Scholar] [CrossRef] [PubMed] [Green Version]
- Zampino, M.; Ferrucci, L.; Semba, R.D. Biomarkers in the path from cellular senescence to frailty. Exp. Gerontol. 2020, 129, 110750. [Google Scholar] [CrossRef]
- Wiley, C.D.; Velarde, M.C.; Lecot, P.; Liu, S.; Sarnoski, E.A.; Freund, A.; Shirakawa, K.; Lim, H.W.; Davis, S.S.; Ramanathan, A. Mitochondrial dysfunction induces senescence with a distinct secretory phenotype. Cell Metab. 2016, 23, 303–314. [Google Scholar] [CrossRef] [Green Version]
- Fujita, Y.; Taniguchi, Y.; Shinkai, S.; Tanaka, M.; Ito, M. Secreted growth differentiation factor 15 as a potential biomarker for mitochondrial dysfunctions in aging and age-related disorders. Geriatr. Gerontol. Int. 2016, 16, 17–29. [Google Scholar] [CrossRef]
- Tanaka, T.; Biancotto, A.; Moaddel, R.; Moore, A.Z.; Gonzalez-Freire, M.; Aon, M.A.; Candia, J.; Zhang, P.; Cheung, F.; Fantoni, G. Plasma proteomic signature of age in healthy humans. Aging Cell 2018, 17, e12799. [Google Scholar] [CrossRef] [Green Version]
- Guralnik, J.M.; Fried, L.P.; Simonsick, E.M.; Lafferty, M.E.; Kasper, J.D. The Women’s Health and Aging Study: Health and Social Characteristics of Older Women with Disability; DIANE Publishing: Darby, PA, USA, 1995. [Google Scholar]
- Lohman, T.G.; Roche, A.F.; Martorell, R. Anthropometric Standardization Reference Manual; Human Kinetics Books: Champaign, IL, USA, 1988; Volume 177. [Google Scholar]
- Candia, J.; Cheung, F.; Kotliarov, Y.; Fantoni, G.; Sellers, B.; Griesman, T.; Huang, J.; Stuccio, S.; Zingone, A.; Ryan, B.M. Assessment of variability in the SOMAscan assay. Sci. Rep. 2017, 7, 1–13. [Google Scholar] [CrossRef] [Green Version]
- Kim, C.H.; Tworoger, S.S.; Stampfer, M.J.; Dillon, S.T.; Gu, X.; Sawyer, S.J.; Chan, A.T.; Libermann, T.A.; Eliassen, A.H. Stability and reproducibility of proteomic profiles measured with an aptamer-based platform. Sci. Rep. 2018, 8, 8382. [Google Scholar] [CrossRef] [PubMed]
- Joshi, A.; Mayr, M. In Aptamers They Trust: The Caveats of the SOMAscan Biomarker Discovery Platform from SomaLogic. Circulation 2018, 138, 2482–2485. [Google Scholar] [CrossRef] [PubMed]
- Cheung, F.; Fantoni, G.; Conner, M.; Sellers, B.A.; Kotliarov, Y.; Candia, J.; Stagliano, K.; Biancotto, A. Web tool for navigating and plotting SomaLogic ADAT files. J. Open Res. Softw. 2017, 5. [Google Scholar] [CrossRef] [PubMed] [Green Version]
- Coen, P.M.; Jubrias, S.A.; Distefano, G.; Amati, F.; Mackey, D.C.; Glynn, N.W.; Manini, T.M.; Wohlgemuth, S.E.; Leeuwenburgh, C.; Cummings, S.R. Skeletal muscle mitochondrial energetics are associated with maximal aerobic capacity and walking speed in older adults. J. Gerontol. Ser. A Biomed. Sci. Med. Sci. 2012, 68, 447–455. [Google Scholar] [CrossRef]
- Paganini, A.; Foley, J.; Meyer, R. Linear dependence of muscle phosphocreatine kinetics on oxidative capacity. Am. J. Physiol. Cell Physiol. 1997, 272, C501–C510. [Google Scholar] [CrossRef]
- Taylor, D.; Styles, P.; Matthews, P.; Arnold, D.; Gadian, D.; Bore, P.; Radda, G. Energetics of human muscle: Exercise-induced ATP depletion. Magn. Reson. Med. 1986, 3, 44–54. [Google Scholar] [CrossRef]
- Vanhamme, L.; Van Huffel, S.; Van Hecke, P.; van Ormondt, D. Time-domain quantification of series of biomedical magnetic resonance spectroscopy signals. J. Magn. Reson. 1999, 140, 120–130. [Google Scholar] [CrossRef]
- Naressi, A.; Couturier, C.; Castang, I.; De Beer, R.; Graveron-Demilly, D. Java-based graphical user interface for MRUI, a software package for quantitation of in vivo/medical magnetic resonance spectroscopy signals. Comput. Biol. Med. 2001, 31, 269–286. [Google Scholar] [CrossRef]
- Prompers, J.J.; Wessels, B.; Kemp, G.J.; Nicolay, K. MITOCHONDRIA: Investigation of in vivo muscle mitochondrial function by 31P magnetic resonance spectroscopy. Int. J. Biochem. Cell Biol. 2014, 50, 67–72. [Google Scholar] [CrossRef]
- Conley, K.E.; Jubrias, S.A.; Esselman, P.C. Oxidative capacity and ageing in human muscle. J. Physiol. 2000, 526, 203–210. [Google Scholar] [CrossRef]
- Arnold, D.; Matthews, P.; Radda, G. Metabolic recovery after exercise and the assessment of mitochondrial function in vivo in human skeletal muscle by means of 31P NMR. Magn. Reson. Med. 1984, 1, 307–315. [Google Scholar] [CrossRef] [PubMed]
- Meyerspeen, M.; Boesch, C.; Cameron, D.; Dezortova, M.; Forbes, S.C.; Heerschap, A.; Jeneson, A.L.J.; Kan, H.E.; Kent, J.; Layec, G.; et al. P-31 magnetic resonance spectroscopy in skeletal muscle: Experts’ consensus recommendations. NMR Biomed. 2020, e4246. [Google Scholar] [CrossRef] [Green Version]
- McCully, K.; Fielding, R.; Evans, W.; Leigh, J., Jr.; Posner, J. Relationships between in vivo and in vitro measurements of metabolism in young and old human calf muscles. J. Appl. Physiol. 1993, 75, 813–819. [Google Scholar] [CrossRef]
- Bindea, G.; Mlecnik, B.; Hackl, H.; Charoentong, P.; Tosolini, M.; Kirilovsky, A.; Fridman, W.-H.; Pagès, F.; Trajanoski, Z.; Galon, J. ClueGO: A Cytoscape plug-in to decipher functionally grouped gene ontology and pathway annotation networks. Bioinformatics 2009, 25, 1091–1093. [Google Scholar] [CrossRef] [Green Version]
- Schafer, M.J.; Atkinson, E.J.; Vanderboom, P.M.; Kotajarvi, B.; White, T.A.; Moore, M.M.; Bruce, C.J.; Greason, K.L.; Suri, R.M.; Khosla, S. Quantification of GDF11 and myostatin in human aging and cardiovascular disease. Cell Metab. 2016, 23, 1207–1215. [Google Scholar] [CrossRef] [PubMed] [Green Version]


| Characteristic | Mean (SD, min, max) or % | |
|---|---|---|
| Age, years | 57.7 (20.0, 22, 93) | |
| Race, % | White | 77.6 |
| Black | 15.8 | |
| Other | 6.6 | |
| Sex, % female | 45.4 | |
| BMI, kg/m2 | 25.9 (3.2, 18.9, 39.7) | |
| τPCr, s | 47.5 (11.3, 23.1, 78.8) | |
| ATP max | 0.41 (0.14, 0.06, 0.71) | |
| pH at baseline | 7.07 (0.03, 6.97, 7.14) | |
| SomaId | GeneID | Target | β Coefficient | SE | p |
|---|---|---|---|---|---|
| SL005160 | ESAM | ESAM | −0.036 | 0.010 | 0.0003 |
| SL000045 | IGFBP3 | IGFBP-3 | −0.027 | 0.007 | 0.0005 |
| SL008623 | CNTN2 | CNTN2 | 0.032 | 0.009 | 0.0005 |
| SL000560 | SELP | P-Selectin | −0.030 | 0.008 | 0.0006 |
| SL006913 | FYN | FYN | −0.030 | 0.009 | 0.0009 |
| SL007153 | LPO | PERL | 0.031 | 0.009 | 0.0009 |
| SL008178 | DPT | DERM | 0.027 | 0.008 | 0.0009 |
| SL004016 | CXCL16 | CXCL16, soluble | 0.023 | 0.009 | 0.001 |
| SL007310 | RAC3 | RAC3 | −0.03 | 0.009 | 0.001 |
| SL006917 | LYN | LYN | −0.03 | 0.009 | 0.002 |
| SL002763 | KLK11 | Kallikrein 11 | 0.033 | 0.010 | 0.002 |
| SL008381 | CTSF | CATF | 0.029 | 0.009 | 0.002 |
| SL009324 | FSTL3 | FSTL3 | 0.023 | 0.007 | 0.002 |
| SL001947 | MIA | MIA | 0.029 | 0.009 | 0.002 |
| SL014488 | VAV1 | VAV | −0.029 | 0.009 | 0.002 |
| SL010518 | TEC | TEC | −0.028 | 0.009 | 0.002 |
| SL000448 | HSPB1 | HSP 27 | −0.030 | 0.010 | 0.002 |
| SL005588 | FER | FER | −0.028 | 0.009 | 0.002 |
| SL004920 | CFL1 | Cofilin-1 | −0.027 | 0.009 | 0.002 |
| SL005793 | PPIF | Cyclophilin F | −0.028 | 0.009 | 0.002 |
| SL013488 | CLEC1B | CLC1B | −0.028 | 0.009 | 0.003 |
| SL003792 | GRB2 | GRB2 adapter protein | −0.028 | 0.009 | 0.003 |
| SL008588 | CD84 | SLAF5 | −0.027 | 0.009 | 0.003 |
| SL006372 | YES1 | YES | −0.030 | 0.010 | 0.003 |
| SL005266 | SNCA | a-Synuclein | −0.028 | 0.009 | 0.003 |
| SL010516 | SRC | SRCN1 | −0.029 | 0.009 | 0.003 |
| SL004101 | SMAD2 | SMAD2 | −0.027 | 0.009 | 0.003 |
| SL011211 | EIF4G2 | IF4G2 | −0.027 | 0.009 | 0.003 |
| SL010500 | LYN | LYNB | −0.028 | 0.009 | 0.003 |
| SL000551 | PRKCA | PKC-A | −0.028 | 0.009 | 0.003 |
| SL010374 | METAP1 | METAP1 | −0.027 | 0.009 | 0.003 |
| SL005172 | IGFBP6 | IGFBP-6 | 0.023 | 0.008 | 0.004 |
| SL003739 | TNFRSF6B | DcR3 | 0.028 | 0.009 | 0.004 |
| SL010927 | KPNB1 | IMB1 | −0.026 | 0.009 | 0.004 |
| SL006088 | SPHK1 | Sphingosine kinase 1 | −0.027 | 0.009 | 0.004 |
| SL002922 | ICAM1 | sICAM-1 | 0.023 | 0.008 | 0.004 |
| SL006998 | PDPK1 | PDPK1 | −0.026 | 0.009 | 0.004 |
| SL004869 | CA13 | Carbonic anhydrase XIII | −0.026 | 0.009 | 0.004 |
| SL004914 | PPA1 | PPase | −0.027 | 0.009 | 0.004 |
| SL014469 | SHC1 | SHC1 | −0.025 | 0.008 | 0.004 |
| SL002823 | SELL | sL-Selectin | −0.024 | 0.008 | 0.004 |
| SL008759 | GP6 | GPVI | −0.026 | 0.009 | 0.005 |
| SL004921 | NME2 | NDP kinase B | −0.026 | 0.009 | 0.005 |
| SL005687 | EIF5A | eIF-5A-1 | −0.026 | 0.009 | 0.005 |
| SL004339 | FGF5 | FGF-5 | 0.026 | 0.009 | 0.005 |
| SL000553 | PRKCB | PKC-B-II | −0.027 | 0.009 | 0.005 |
| SL000498 | LEP | Leptin | 0.022 | 0.008 | 0.005 |
| SL011405 | PDE5A | PDE5A | −0.026 | 0.009 | 0.006 |
| SL000449 | DNAJB1 | HSP 40 | −0.025 | 0.009 | 0.006 |
| SL004760 | PAFAH1B2 | PAFAH beta subunit | −0.026 | 0.009 | 0.006 |
| SL005688 | YWHAZ | 14-3-3 protein zeta/delta | −0.027 | 0.009 | 0.006 |
| SL016549 | PRKAA2 PRKAB2 PRKAG1 | AMPK a2b2g1 | −0.025 | 0.009 | 0.006 |
| SL000337 | CAPN1 CAPNS1 | Calpain I | −0.026 | 0.009 | 0.006 |
| SL018946 | UBE2G2 | UB2G2 | 0.028 | 0.010 | 0.006 |
| SL006920 | MAPK14 | MAPK14 | −0.025 | 0.009 | 0.006 |
| SL004704 | COMMD7 | COMMD7 | −0.026 | 0.009 | 0.006 |
| SL007221 | STAT3 | STAT3 | −0.026 | 0.009 | 0.006 |
| SL004676 | IGFBP5 | IGFBP-5 | 0.027 | 0.010 | 0.006 |
| SL003646 | TPM4 | Tropomyosin 4 | −0.027 | 0.010 | 0.006 |
| SL010373 | FCAR | FCAR | 0.026 | 0.009 | 0.007 |
| SL003685 | NAMPT | PBEF | 0.027 | 0.010 | 0.007 |
| SL008611 | NAAA | ASAHL | 0.025 | 0.009 | 0.007 |
| SL004757 | VTA1 | DRG-1 | −0.025 | 0.009 | 0.007 |
| SL004860 | HTRA2 | HTRA2 | −0.025 | 0.009 | 0.007 |
| SL003711 | CASP3 | Caspase-3 | −0.025 | 0.009 | 0.007 |
| SL003655 | TKT | Transketolase | −0.025 | 0.009 | 0.007 |
| SL017188 | GSK3A GSK3B | GSK-3 alpha/beta | −0.025 | 0.009 | 0.007 |
| SL005372 | SNX4 | Sorting nexin 4 | −0.025 | 0.009 | 0.008 |
| SL004536 | HAMP | LEAP-1 | 0.025 | 0.009 | 0.008 |
| SL003690 | TNFRSF11A | RANK | 0.025 | 0.009 | 0.009 |
| SL010503 | MAPKAPK2 | MAPK2 | −0.024 | 0.009 | 0.008 |
| SL010521 | BTK | BTK | −0.025 | 0.009 | 0.008 |
| SL005084 | POSTN | Periostin | 0.024 | 0.009 | 0.008 |
| SL004357 | MSTN | Myostatin | 0.022 | 0.008 | 0.008 |
| SL004910 | ALDOA | aldolase A | −0.023 | 0.009 | 0.008 |
| SL002036 | FGFR4 | FGFR4 | 0.027 | 0.010 | 0.008 |
| SL000450 | HSPD1 | HSP 60 | −0.025 | 0.009 | 0.009 |
| SL011630 | SEZ6L2 | SE6L2 | −0.024 | 0.009 | 0.009 |
| SL002650 | PKM2 | M2-PK | −0.025 | 0.009 | 0.009 |
| SL004924 | EIF4H | eIF-4H | −0.023 | 0.009 | 0.009 |
| SL010493 | CAMK2D | CAMK2D | −0.024 | 0.009 | 0.009 |
| SL004139 | EFNA3 | Ephrin-A3 | 0.025 | 0.009 | 0.009 |
| SL004672 | TNFRSF17 | BCMA | 0.024 | 0.009 | 0.009 |
| SL007373 | PPID | PPID | −0.024 | 0.009 | 0.009 |
| SL011404 | PDE4D | PDE4D | 0.026 | 0.010 | 0.009 |
| SL010491 | CAMK2A | CAMK2A | −0.023 | 0.009 | 0.009 |
| SL000565 | REN | Renin | 0.025 | 0.009 | 0.009 |
| Model 1 | |||||
|---|---|---|---|---|---|
| SomaId | GeneID | Target | β Coefficient | SE | p |
| SL005160 | ESAM | ESAM | −0.036 | 0.010 | 0.0003 |
| SL000045 | IGFBP3 | IGFBP-3 | −0.027 | 0.007 | 0.0005 |
| SL008623 | CNTN2 | CNTN2 | 0.032 | 0.009 | 0.0005 |
| SL000560 | SELP | P-Selectin | −0.030 | 0.008 | 0.0006 |
| SL006913 | FYN | FYN | −0.030 | 0.009 | 0.0009 |
| SL007153 | LPO | PERL | 0.031 | 0.009 | 0.0009 |
| SL008178 | DPT | DERM | 0.027 | 0.008 | 0.001 |
| SL004016 | CXCL16 | CXCL16, soluble | 0.029 | 0.009 | 0.001 |
| SL007310 | RAC3 | RAC3 | −0.029 | 0.009 | 0.001 |
| SL006917 | LYN | LYN | −0.030 | 0.009 | 0.002 |
| Model 2 | |||||
| SomaId | GeneID | Target | β Coefficient | SE | p |
| SL002763 | KLK11 | Kallikrein 11 | 0.034 | 0.010 | 0.0006 |
| SL000560 | SELP | P-Selectin | −0.031 | 0.009 | 0.0006 |
| SL006913 | FYN | FYN | −0.030 | 0.009 | 0.001 |
| SL009324 | FSTL3 | FSTL3 | 0.023 | 0.007 | 0.001 |
| SL008623 | CNTN2 | CNTN2 | 0.030 | 0.009 | 0.002 |
| SL000045 | IGFBP3 | IGFBP-3 | −0.025 | 0.008 | 0.002 |
| SL005160 | ESAM | ESAM | −0.032 | 0.010 | 0.002 |
| SL007310 | RAC3 | RAC3 | −0.029 | 0.009 | 0.002 |
| SL008381 | CTSF | CATF | 0.028 | 0.009 | 0.003 |
| SL005172 | IGFBP6 | IGFBP-6 | 0.025 | 0.008 | 0.003 |
| GO id | GO Term | N. Genes | Associated Genes Found |
|---|---|---|---|
| GO:0007165 | Signal transduction | 59 | BTK, CAMK2A, CAMK2D, CASP3, CFL1, CLEC1B, CNTN2, COMMD7, CXCL16, EFNA3, FER, FGF5, FGFR4, FSTL3, FYN, GP6, GRB2, HAMP, HSPB1, HSPD1, HTRA2, ICAM1, IGFBP3, IGFBP5, IGFBP6, KPNB1, LEP, LYN, MAPK14, MAPKAPK2, METAP1, MIA, MSTN, NAMPT, NME2, PDE4D, PDE5A, PDPK1, POSTN, PPIF, PRKCA, PRKCB, RAC3, REN, SELP, SEZ6L2, SHC1, SMAD2, SNCA, SPHK1, SRC, STAT3, TEC, TNFRSF11A, TNFRSF17, TNFRSF6B, VAV1, YES1, YWHAZ |
| GO:0010033 | Response to organic substance | 50 | BTK, CAMK2A, CAMK2D, CASP3, CFL1, COMMD7, CXCL16, DNAJB1, FER, FGF5, FGFR4, FSTL3, FYN, GRB2, HAMP, HSPB1, HSPD1, HTRA2, ICAM1, IGFBP5, LEP, LYN, MAPK14, MAPKAPK2, MSTN, NAMPT, NME2, PDE4D, PDPK1, PKM, POSTN, PRKCA, PRKCB, REN, SELL, SELP, SHC1, SMAD2, SNCA, SPHK1, SRC, STAT3, TEC, TNFRSF11A, TNFRSF17, TNFRSF6B, UBE2G2, VAV1, YES1, YWHAZ |
| GO:0071310 | Cellular response to organic substance | 46 | BTK, CAMK2A, CAMK2D, CASP3, CFL1, COMMD7, FER, FGF5, FGFR4, FSTL3, FYN, GRB2, HAMP, HSPB1, HSPD1, HTRA2, ICAM1, IGFBP5, LEP, LYN, MAPK14, MAPKAPK2, MSTN, NAMPT, NME2, PDE4D, PDPK1, PKM, POSTN, PRKCA, PRKCB, REN, SHC1, SMAD2, SNCA, SPHK1, SRC, STAT3, TEC, TNFRSF11A, TNFRSF17, TNFRSF6B, UBE2G2, VAV1, YES1, YWHAZ |
| GO:0051239 | Regulation of multicellular organismal process | 41 | BTK, CAMK2A, CAMK2D, CD84, CFL1, CNTN2, EFNA3, EIF4G2, FSTL3, FYN, HAMP, HSPB1, HSPD1, HTRA2, ICAM1, IGFBP5, LEP, LYN, MAPK14, MAPKAPK2, MSTN, NME2, PDE4D, PDE5A, PDPK1, PKM, POSTN, PRKCA, PRKCB, RAC3, REN, SELP, SMAD2, SNCA, SNX4, SPHK1, SRC, STAT3, TEC, TNFRSF11A, YWHAZ |
| GO:0032268 | Regulation of cellular protein metabolic process | 38 | CAMK2D, CASP3, CNTN2, EFNA3, EIF4G2, EIF4H, EIF5A, FER, FGFR4, FYN, GRB2, HSPB1, HSPD1, HTRA2, ICAM1, IGFBP3, IGFBP5, LEP, LYN, MAPK14, MAPKAPK2, METAP1, MSTN, PDE4D, PDE5A, PDPK1, PRKCA, REN, SHC1, SNCA, SPHK1, SRC, STAT3, TEC, TNFRSF11A, UBE2G2, YES1, YWHAZ |
| GO:1901700 | Response to oxygen-containing compound | 37 | BTK, CAMK2A, CASP3, CFL1, FER, FYN, GRB2, HAMP, HSPD1, HTRA2, ICAM1, IGFBP5, LEP, LYN, MAPK14, MAPKAPK2, MSTN, NAMPT, NME2, PDE4D, PDPK1, PKM, POSTN, PPIF, PRKCA, PRKCB, REN, SELL, SELP, SHC1, SMAD2, SNCA, SPHK1, SRC, STAT3, TNFRSF11A, YES1 |
| GO:0032879 | Regulation of localization | 36 | CAMK2A, CAMK2D, CD84, CXCL16, FER, FYN, HAMP, HSPB1, HSPD1, HTRA2, ICAM1, IGFBP3, IGFBP5, LEP, LYN, MAPK14, METAP1, MSTN, PDE4D, PDPK1, POSTN, PPID, PPIF, PRKCA, PRKCB, REN, SELP, SNCA, SNX4, SPHK1, SRC, STAT3, TNFRSF11A, UBE2G2, YES1, YWHAZ |
| GO:0051128 | Regulation of cellular component organization | 32 | CAMK2D, CFL1, CNTN2, CXCL16, DNAJB1, EIF4G2, EIF5A, ESAM, FER, FGFR4, FYN, GRB2, HAMP, HTRA2, ICAM1, IGFBP3, IGFBP5, LYN, MAPK14, METAP1, MSTN, NME2, PPIF, PRKCA, PRKCB, RAC3, SELP, SNCA, SPHK1, SRC, VTA1, YWHAZ |
| GO:0034097 | Response to cytokine | 31 | BTK, CAMK2A, CAMK2D, CASP3, CFL1, COMMD7, CXCL16, FER, FYN, GRB2, HAMP, HSPD1, HTRA2, ICAM1, LEP, MAPK14, MAPKAPK2, POSTN, PRKCA, SHC1, SNCA, SPHK1, SRC, STAT3, TEC, TNFRSF11A, TNFRSF17, TNFRSF6B, UBE2G2, VAV1, YWHAZ |
| GO:0012501 | Programmed cell death | 31 | BTK, CAMK2A, CAMK2D, CASP3, CFL1, EIF5A, FYN, HSPB1, HSPD1, HTRA2, ICAM1, IGFBP3, KPNB1, LEP, LYN, MAPK14, NME2, PDPK1, PKM, PPID, PPIF, PRKCA, PRKCB, SHC1, SNCA, SPHK1, SRC, TNFRSF11A, TNFRSF6B, VAV1, YWHAZ |
| GO:0006915 | Apoptotic process | 29 | BTK, CAMK2A, CAMK2D, CASP3, CFL1, EIF5A, FYN, HSPB1, HSPD1, HTRA2, ICAM1, IGFBP3, KPNB1, LEP, LYN, MAPK14, NME2, PDPK1, PPID, PPIF, PRKCA, PRKCB, SHC1, SNCA, SPHK1, SRC, TNFRSF6B, VAV1, YWHAZ |
| GO:0048468 | Cell development | 29 | BTK, CAMK2A, CASP3, CFL1, CLEC1B, CNTN2, EFNA3, EIF4G2, FER, FYN, GRB2, HAMP, HTRA2, ICAM1, LEP, LYN, METAP1, NME2, PDE4D, PDE5A, PDPK1, POSTN, PRKCA, RAC3, REN, SHC1, SRC, STAT3, YWHAZ |
| GO:0045321 | Leukocyte activation | 29 | ALDOA, BTK, CASP3, CD84, FCAR, FER, FYN, GRB2, HSPD1, ICAM1, KPNB1, LEP, LYN, MAPK14, NAMPT, NME2, PAFAH1B2, PDE5A, PDPK1, PKM, PRKCB, SELL, SNCA, SNX4, SPHK1, SRC, STAT3, VAV1, YES1 |
| GO:0032940 | Secretion by cell | 28 | ALDOA, BTK, CAMK2A, CD84, FCAR, FER, HSPD1, KPNB1, LEP, LYN, MAPK14, NAAA, NME2, PAFAH1B2, PDPK1, PKM, POSTN, PPID, PRKCA, PRKCB, REN, SELL, SELP, SMAD2, SNCA, SNX4, SRC, TNFRSF11A |
| GO:0042592 | Homeostatic process | 27 | ALDOA, CAMK2D, CASP3, ESAM, FGFR4, FYN, HAMP, HSPB1, ICAM1, IGFBP5, LEP, LPO, LYN, MAPK14, METAP1, MSTN, NME2, PDE4D, PDPK1, PRKCA, PRKCB, RAC3, SNCA, SRC, STAT3, TNFRSF11A, TNFRSF17 |
| GO:0006952 | Defense response | 27 | BTK, CAMK2A, CAMK2D, CD84, CLEC1B, CXCL16, FYN, HAMP, HSPD1, ICAM1, LEP, LPO, LYN, MAPK14, MAPKAPK2, NAMPT, PDPK1, PRKCA, SELP, SHC1, SNCA, SNX4, SPHK1, SRC, STAT3, TNFRSF11A, VAV1 |
| GO:0033554 | Cellular response to stress | 27 | BTK, CAMK2A, CAMK2D, CASP3, DNAJB1, FER, FYN, GRB2, HSPB1, HSPD1, HTRA2, ICAM1, LEP, LYN, MAPK14, MAPKAPK2, NAMPT, NME2, PDPK1, PPIF, PRKCA, SHC1, SNCA, SPHK1, SRC, TNFRSF11A, UBE2G2 |
| GO:0042127 | Regulation of cell population proliferation | 27 | BTK, CASP3, DPT, EIF5A, FER, FGF5, FGFR4, FYN, IGFBP3, IGFBP5, IGFBP6, LEP, LYN, MAPK14, MSTN, NAMPT, NME2, PDE5A, PDPK1, PRKCA, SHC1, SMAD2, SPHK1, SRC, STAT3, TNFRSF11A, YES1 |
| GO:0010243 | Response to organonitrogen compound | 27 | CAMK2A, CASP3, CFL1, FER, FYN, GRB2, HSPD1, ICAM1, IGFBP5, LEP, LYN, MAPK14, MSTN, NAMPT, NME2, PDE4D, PDPK1, PKM, PRKCA, PRKCB, REN, SELL, SHC1, SNCA, SRC, STAT3, UBE2G2 |
| GO:0042981 | Regulation of apoptotic process | 25 | BTK, CAMK2A, CAMK2D, CASP3, CFL1, FYN, HSPB1, HSPD1, HTRA2, ICAM1, IGFBP3, LEP, LYN, NME2, PDPK1, PPID, PPIF, PRKCA, SHC1, SNCA, SPHK1, SRC, TNFRSF6B, VAV1, YWHAZ |
| GO:0007169 | Transmembrane receptor protein tyrosine kinase signaling pathway | 25 | CASP3, EFNA3, FER, FGF5, FGFR4, FYN, GRB2, HSPB1, IGFBP3, IGFBP5, IGFBP6, LEP, LYN, MAPK14, MAPKAPK2, MSTN, PDPK1, PRKCA, PRKCB, SHC1, SNCA, SRC, STAT3, VAV1, YES1 |
| GO:0048585 | Negative regulation of response to stimulus | 25 | CD84, FER, FSTL3, FYN, GRB2, HSPB1, HTRA2, ICAM1, IGFBP3, IGFBP5, IGFBP6, LEP, LYN, MAPK14, MSTN, NAMPT, PDE4D, PDPK1, PPIF, PRKCA, PRKCB, SMAD2, SNCA, SRC, UBE2G2 |
| GO:0080134 | Regulation of response to stress | 25 | BTK, CAMK2A, CAMK2D, DNAJB1, FYN, HSPB1, HSPD1, HTRA2, LEP, LYN, MAPK14, MAPKAPK2, NAMPT, PDPK1, PRKCA, SELP, SNCA, SNX4, SPHK1, SRC, STAT3, TEC, TNFRSF11A, UBE2G2, VAV1 |
| GO:0098609 | Cell-cell adhesion | 24 | CASP3, CD84, CNTN2, ESAM, FER, FSTL3, FYN, GRB2, HSPB1, HSPD1, ICAM1, LEP, LYN, MAPK14, METAP1, PDE5A, PDPK1, PRKCA, SELL, SELP, SHC1, SRC, VAV1, YES1 |
| GO:0033993 | Response to lipid | 23 | CASP3, FER, HAMP, HSPD1, HTRA2, ICAM1, LEP, LYN, MAPK14, MAPKAPK2, MSTN, NME2, PDE4D, POSTN, PRKCA, REN, SELP, SMAD2, SNCA, SRC, STAT3, TNFRSF11A, YES1 |
| GO:0050776 | Regulation of immune response | 22 | BTK, CD84, CLEC1B, FER, FYN, GRB2, HSPD1, ICAM1, LEP, LYN, MAPK14, PDE4D, PDPK1, PRKCA, PRKCB, SELL, SHC1, SNX4, SRC, TEC, VAV1, YES1 |
| GO:0070848 | Response to growth factor | 20 | CASP3, FER, FGF5, FGFR4, FSTL3, FYN, GRB2, HSPB1, HTRA2, MAPK14, MAPKAPK2, MSTN, PDPK1, POSTN, PRKCB, SHC1, SMAD2, SPHK1, SRC, YES1 |
| GO:0050900 | Leukocyte migration | 20 | CD84, CXCL16, ESAM, FER, FYN, GP6, GRB2, ICAM1, LEP, LYN, MAPK14, MSTN, PDE4D, SELL, SELP, SHC1, SRC, TNFRSF11A, VAV1, YES1 |
| GO:0019221 | Cytokine-mediated signaling pathway | 20 | CAMK2A, CAMK2D, CASP3, CFL1, COMMD7, FER, FYN, GRB2, ICAM1, LEP, PRKCA, SHC1, SPHK1, STAT3, TEC, TNFRSF11A, TNFRSF17, TNFRSF6B, VAV1, YWHAZ |
| GO:0042060 | Wound healing | 19 | CASP3, CLEC1B, FYN, GP6, HSPB1, LYN, METAP1, MSTN, PDPK1, PKM, POSTN, PRKCA, PRKCB, SELP, SMAD2, SRC, TEC, VAV1, YWHAZ |
| GO:0022603 | Regulation of anatomical structure morphogenesis | 19 | ALDOA, CFL1, CNTN2, EFNA3, EIF4G2, FYN, HSPB1, ICAM1, LEP, MAPK14, PDPK1, PKM, POSTN, PRKCA, PRKCB, RAC3, SPHK1, SRC, STAT3 |
| GO:0000902 | Cell morphogenesis | 18 | ALDOA, CASP3, CFL1, CLEC1B, CNTN2, EFNA3, EIF4G2, FER, FYN, GRB2, ICAM1, MAPK14, METAP1, POSTN, PRKCA, RAC3, SHC1, SRC |
| GO:0035295 | Tube development | 18 | CASP3, CFL1, EFNA3, FSTL3, HSPB1, IGFBP5, LEP, MAPK14, PDPK1, PKM, PRKCA, PRKCB, SHC1, SMAD2, SPHK1, SRC, STAT3, YWHAZ |
| WP:3888 | VEGFA-VEGFR2 signaling pathway | 17 | ALDOA, CFL1, EIF4G2, FYN, GRB2, HSPB1, ICAM1, IGFBP3, MAPK14, MAPKAPK2, PDPK1, PRKCA, PRKCB, SHC1, SRC, STAT3, TKT |
| GO:1903530 | Regulation of secretion by cell | 17 | CAMK2A, CD84, FER, HSPD1, LEP, LYN, MAPK14, PDPK1, POSTN, PPID, PRKCA, PRKCB, REN, SNCA, SNX4, SRC, TNFRSF11A |
| GO:0006935 | Chemotaxis | 16 | CNTN2, CXCL16, EFNA3, FER, FYN, GRB2, HSPB1, LYN, MAPK14, MSTN, PDE4D, PRKCA, SHC1, SRC, TNFRSF11A, VAV1 |
| GO:0043408 | Regulation of MAPK cascade | 16 | FGFR4, GRB2, ICAM1, IGFBP3, LEP, LYN, MAPK14, MAPKAPK2, PDE5A, PRKCA, REN, SHC1, SPHK1, SRC, TNFRSF11A, YWHAZ |
| GO:0097435 | Supramolecular fiber organization | 15 | ALDOA, CFL1, DPT, ESAM, FER, FYN, GRB2, ICAM1, KPNB1, METAP1, RAC3, SNCA, SRC, TPM4, VTA1 |
| GO:0016032 | Viral process | 15 | CFL1, CLEC1B, EIF4H, FYN, GRB2, HSPB1, HSPD1, ICAM1, KPNB1, LYN, PPID, SHC1, SRC, STAT3, VTA1 |
| GO:0019725 | Cellular homeostasis | 15 | ALDOA, CAMK2D, FYN, HAMP, ICAM1, LPO, LYN, METAP1, MSTN, NME2, PDE4D, PDPK1, PRKCA, PRKCB, SNCA |
| GO:0009636 | Response to toxic substance | 15 | CASP3, FYN, HAMP, HSPD1, HTRA2, ICAM1, LEP, LPO, LYN, MSTN, PPIF, SNCA, SPHK1, SRC, STAT3 |
| GO:0031347 | Regulation of defense response | 15 | BTK, FYN, HSPD1, LEP, LYN, MAPK14, PDPK1, PRKCA, SNCA, SNX4, SPHK1, SRC, STAT3, TNFRSF11A, VAV1 |
| GO:0030335 | Positive regulation of cell migration | 15 | CXCL16, FER, HSPB1, ICAM1, IGFBP5, LYN, MAPK14, MSTN, PDPK1, POSTN, PRKCA, SELP, SPHK1, SRC, STAT3 |
| GO:0006979 | Response to oxidative stress | 14 | BTK, CASP3, FER, FYN, HSPB1, HSPD1, HTRA2, LPO, NME2, PDPK1, PPIF, SNCA, SPHK1, SRC |
| GO:0030162 | Regulation of proteolysis | 14 | CNTN2, EFNA3, FGFR4, FYN, HSPD1, HTRA2, LYN, MAPK14, METAP1, PRKCA, SNCA, SRC, STAT3, UBE2G2 |
| GO:0040008 | Regulation of growth | 14 | CAMK2D, CXCL16, EIF4G2, HAMP, HTRA2, IGFBP3, IGFBP5, LEP, MAPK14, MSTN, SHC1, SPHK1, STAT3, TKT |
| GO:0080135 | Regulation of cellular response to stress | 13 | CAMK2A, CAMK2D, DNAJB1, FYN, HSPB1, HTRA2, LEP, LYN, MAPKAPK2, NAMPT, SPHK1, TNFRSF11A, UBE2G2 |
| GO:0001817 | Regulation of cytokine production | 13 | BTK, CD84, HSPB1, HSPD1, LEP, LYN, MAPK14, MAPKAPK2, PDE4D, POSTN, SPHK1, SRC, STAT3 |
| GO:0043410 | Positive regulation of MAPK cascade | 12 | FGFR4, ICAM1, IGFBP3, LEP, MAPK14, MAPKAPK2, PDE5A, PRKCA, SHC1, SPHK1, SRC, TNFRSF11A |
| GO:0010608 | Posttranscriptional regulation of gene expression | 12 | EIF4G2, EIF4H, EIF5A, HSPB1, IGFBP5, MAPK14, MAPKAPK2, METAP1, PRKCA, SMAD2, STAT3, YWHAZ |
| GO:0044057 | Regulation of system process | 12 | CAMK2D, HAMP, ICAM1, IGFBP5, LEP, MSTN, PDE4D, PDE5A, PRKCA, REN, SPHK1, SRC |
| WP:304 | Kit receptor signaling pathway | 11 | BTK, FYN, GRB2, LYN, MAPK14, PRKCA, PRKCB, SHC1, SRC, STAT3, VAV1 |
| GO:0034612 | Response to tumor necrosis factor | 11 | CASP3, COMMD7, CXCL16, HAMP, ICAM1, MAPK14, POSTN, SPHK1, TNFRSF11A, TNFRSF17, TNFRSF6B |
| GO:0009895 | Negative regulation of catabolic process | 11 | EIF4G2, FYN, HTRA2, LEP, MAPK14, MAPKAPK2, METAP1, NAMPT, SNCA, STAT3, UBE2G2 |
| GO:0072593 | Reactive oxygen species metabolic process | 10 | FYN, GRB2, HSPD1, ICAM1, LEP, LPO, MAPK14, SNCA, STAT3, VAV1 |
| WP:2380 | Brain-Derived Neurotrophic Factor (BDNF) signaling pathway | 10 | CAMK2A, CASP3, CFL1, FYN, GRB2, MAPK14, PDPK1, SHC1, SRC, STAT3 |
| GO:0034248 | Regulation of cellular amide metabolic process | 10 | CASP3, EIF4G2, EIF4H, EIF5A, HSPB1, IGFBP5, METAP1, PDPK1, SPHK1, STAT3 |
| GO:0002703 | Regulation of leukocyte mediated immunity | 10 | BTK, CD84, FER, HSPD1, ICAM1, LEP, LYN, PDPK1, SNX4, VAV1 |
| WP:382 | MAPK signaling pathway | 9 | CASP3, FGF5, FGFR4, GRB2, HSPB1, MAPK14, MAPKAPK2, PRKCA, RAC3 |
| GO:0009743 | Response to carbohydrate | 9 | CASP3, ICAM1, LEP, LYN, NAMPT, NME2, PRKCA, PRKCB, SMAD2 |
| WP:289 | Myometrial relaxation and contraction pathways | 9 | CAMK2A, CAMK2D, IGFBP3, IGFBP5, IGFBP6, PDE4D, PRKCA, PRKCB, YWHAZ |
| GO:0036293 | Response to decreased oxygen levels | 9 | CASP3, HSPD1, ICAM1, LEP, NAMPT, PDPK1, PKM, POSTN, SRC |
| GO:0009408 | Response to heat | 9 | CAMK2A, CAMK2D, DNAJB1, HSPD1, HTRA2, LYN, MAPKAPK2, MSTN, PRKCA |
| GO:0051896 | Regulation of protein kinase B signaling | 9 | FGF5, FGFR4, FYN, GRB2, IGFBP5, LEP, MSTN, SRC, VAV1 |
| GO:0000302 | Response to reactive oxygen species | 8 | BTK, CASP3, FER, FYN, HSPD1, PPIF, SPHK1, SRC |
| WP:2324 | AGE/RAGE pathway | 8 | CASP3, MAPK14, PRKCA, PRKCB, SHC1, SMAD2, SRC, STAT3 |
| GO:0033500 | Carbohydrate homeostasis | 8 | FGFR4, ICAM1, IGFBP5, LEP, NME2, PDPK1, PRKCA, STAT3 |
| GO:0051092 | Positive regulation of NF-kappaB transcription factor activity | 8 | BTK, CAMK2A, FER, ICAM1, PRKCB, SPHK1, STAT3, TNFRSF11A |
| WP:2203 | Thymic Stromal LymphoPoietin (TSLP) signaling pathway | 7 | BTK, FYN, LYN, MAPK14, SRC, STAT3, YES1 |
| WP:286 | IL-3 signaling pathway | 7 | FYN, GRB2, LYN, SHC1, SRC, STAT3, VAV1 |
| WP:2332 | Interleukin-11 signaling pathway | 7 | FYN, GRB2, ICAM1, PDPK1, SRC, STAT3, YES1 |
| GO:0014896 | Muscle hypertrophy | 7 | CAMK2D, HAMP, IGFBP5, LEP, MSTN, PDE5A, PRKCA |
| GO:0010522 | Regulation of calcium ion transport into cytosol | 7 | CAMK2D, FYN, LYN, PDE4D, PDPK1, PRKCA, SNCA |
| WP:481 | Insulin signaling | 6 | GRB2, MAPK14, PDPK1, PRKCA, PRKCB, SHC1 |
| WP:4298 | Viral acute myocarditis | 6 | CASP3, EIF4G2, FYN, RAC3, SRC, STAT3 |
| WP:4747 | Netrin-UNC5B signaling pathway | 6 | CASP3, FYN, ICAM1, MAPK14, PRKCA, SRC |
| GO:0010675 | Regulation of cellular carbohydrate metabolic process | 6 | IGFBP3, LEP, PDPK1, SNCA, SRC, STAT3 |
| GO:0014743 | Regulation of muscle hypertrophy | 6 | CAMK2D, HAMP, IGFBP5, MSTN, PDE5A, PRKCA |
| WP:400 | p38 MAPK signaling pathway | 5 | GRB2, HSPB1, MAPK14, MAPKAPK2, SHC1 |
| WP:2018 | RANKL/RANK (receptor activator of NFKB (ligand)) signaling pathway | 5 | ICAM1, LYN, MAPK14, SRC, TNFRSF11A |
| GO:0014812 | Muscle cell migration | 5 | IGFBP3, IGFBP5, MSTN, POSTN, SRC |
| WP:2032 | Human Thyroid Stimulating Hormone (TSH) signaling pathway | 5 | MAPK14, PDE4D, PDPK1, SRC, STAT3 |
| WP:2371 | Parkinson’s disease pathway | 5 | CASP3, HTRA2, MAPK14, SNCA, UBE2G2 |
| GO:0045123 | Cellular extravasation | 5 | FER, ICAM1, LEP, SELL, SELP |
| GO:0051193 | Regulation of cofactor metabolic process | 4 | FYN, PDPK1, SNCA, STAT3 |
| GO:0060416 | Response to growth hormone | 4 | IGFBP5, LYN, NME2, STAT3 |
| GO:0070741 | Response to interleukin-6 | 4 | FER, HAMP, ICAM1, STAT3 |
| WP:2038 | Regulation of microtubule cytoskeleton | 4 | MAPKAPK2, PRKCA, SRC, STAT3 |
| WP:3668 | Hypothesized pathways in pathogenesis of cardiovascular disease | 4 | MAPK14, POSTN, SHC1, SMAD2 |
| GO:0010543 | Regulation of platelet activation | 4 | LYN, PRKCA, SELP, TEC |
| WP:4357 | NRF2-ARE regulation | 4 | FYN, PRKCA, SRC, YES1 |
| WP:1528 | Physiological and pathological hypertrophy of the heart | 4 | CAMK2D, MAPK14, PRKCB, STAT3 |
Publisher’s Note: MDPI stays neutral with regard to jurisdictional claims in published maps and institutional affiliations. |
© 2020 by the authors. Licensee MDPI, Basel, Switzerland. This article is an open access article distributed under the terms and conditions of the Creative Commons Attribution (CC BY) license (http://creativecommons.org/licenses/by/4.0/).
Share and Cite
Zampino, M.; Tanaka, T.; Ubaida-Mohien, C.; Fantoni, G.; Candia, J.; Semba, R.D.; Ferrucci, L. A Plasma Proteomic Signature of Skeletal Muscle Mitochondrial Function. Int. J. Mol. Sci. 2020, 21, 9540. https://0-doi-org.brum.beds.ac.uk/10.3390/ijms21249540
Zampino M, Tanaka T, Ubaida-Mohien C, Fantoni G, Candia J, Semba RD, Ferrucci L. A Plasma Proteomic Signature of Skeletal Muscle Mitochondrial Function. International Journal of Molecular Sciences. 2020; 21(24):9540. https://0-doi-org.brum.beds.ac.uk/10.3390/ijms21249540
Chicago/Turabian StyleZampino, Marta, Toshiko Tanaka, Ceereena Ubaida-Mohien, Giovanna Fantoni, Julián Candia, Richard D. Semba, and Luigi Ferrucci. 2020. "A Plasma Proteomic Signature of Skeletal Muscle Mitochondrial Function" International Journal of Molecular Sciences 21, no. 24: 9540. https://0-doi-org.brum.beds.ac.uk/10.3390/ijms21249540