Divergent Regulation of Myotube Formation and Gene Expression by E2 and EPA during In-Vitro Differentiation of C2C12 Myoblasts

Abstract
:1. Introduction
2. Results
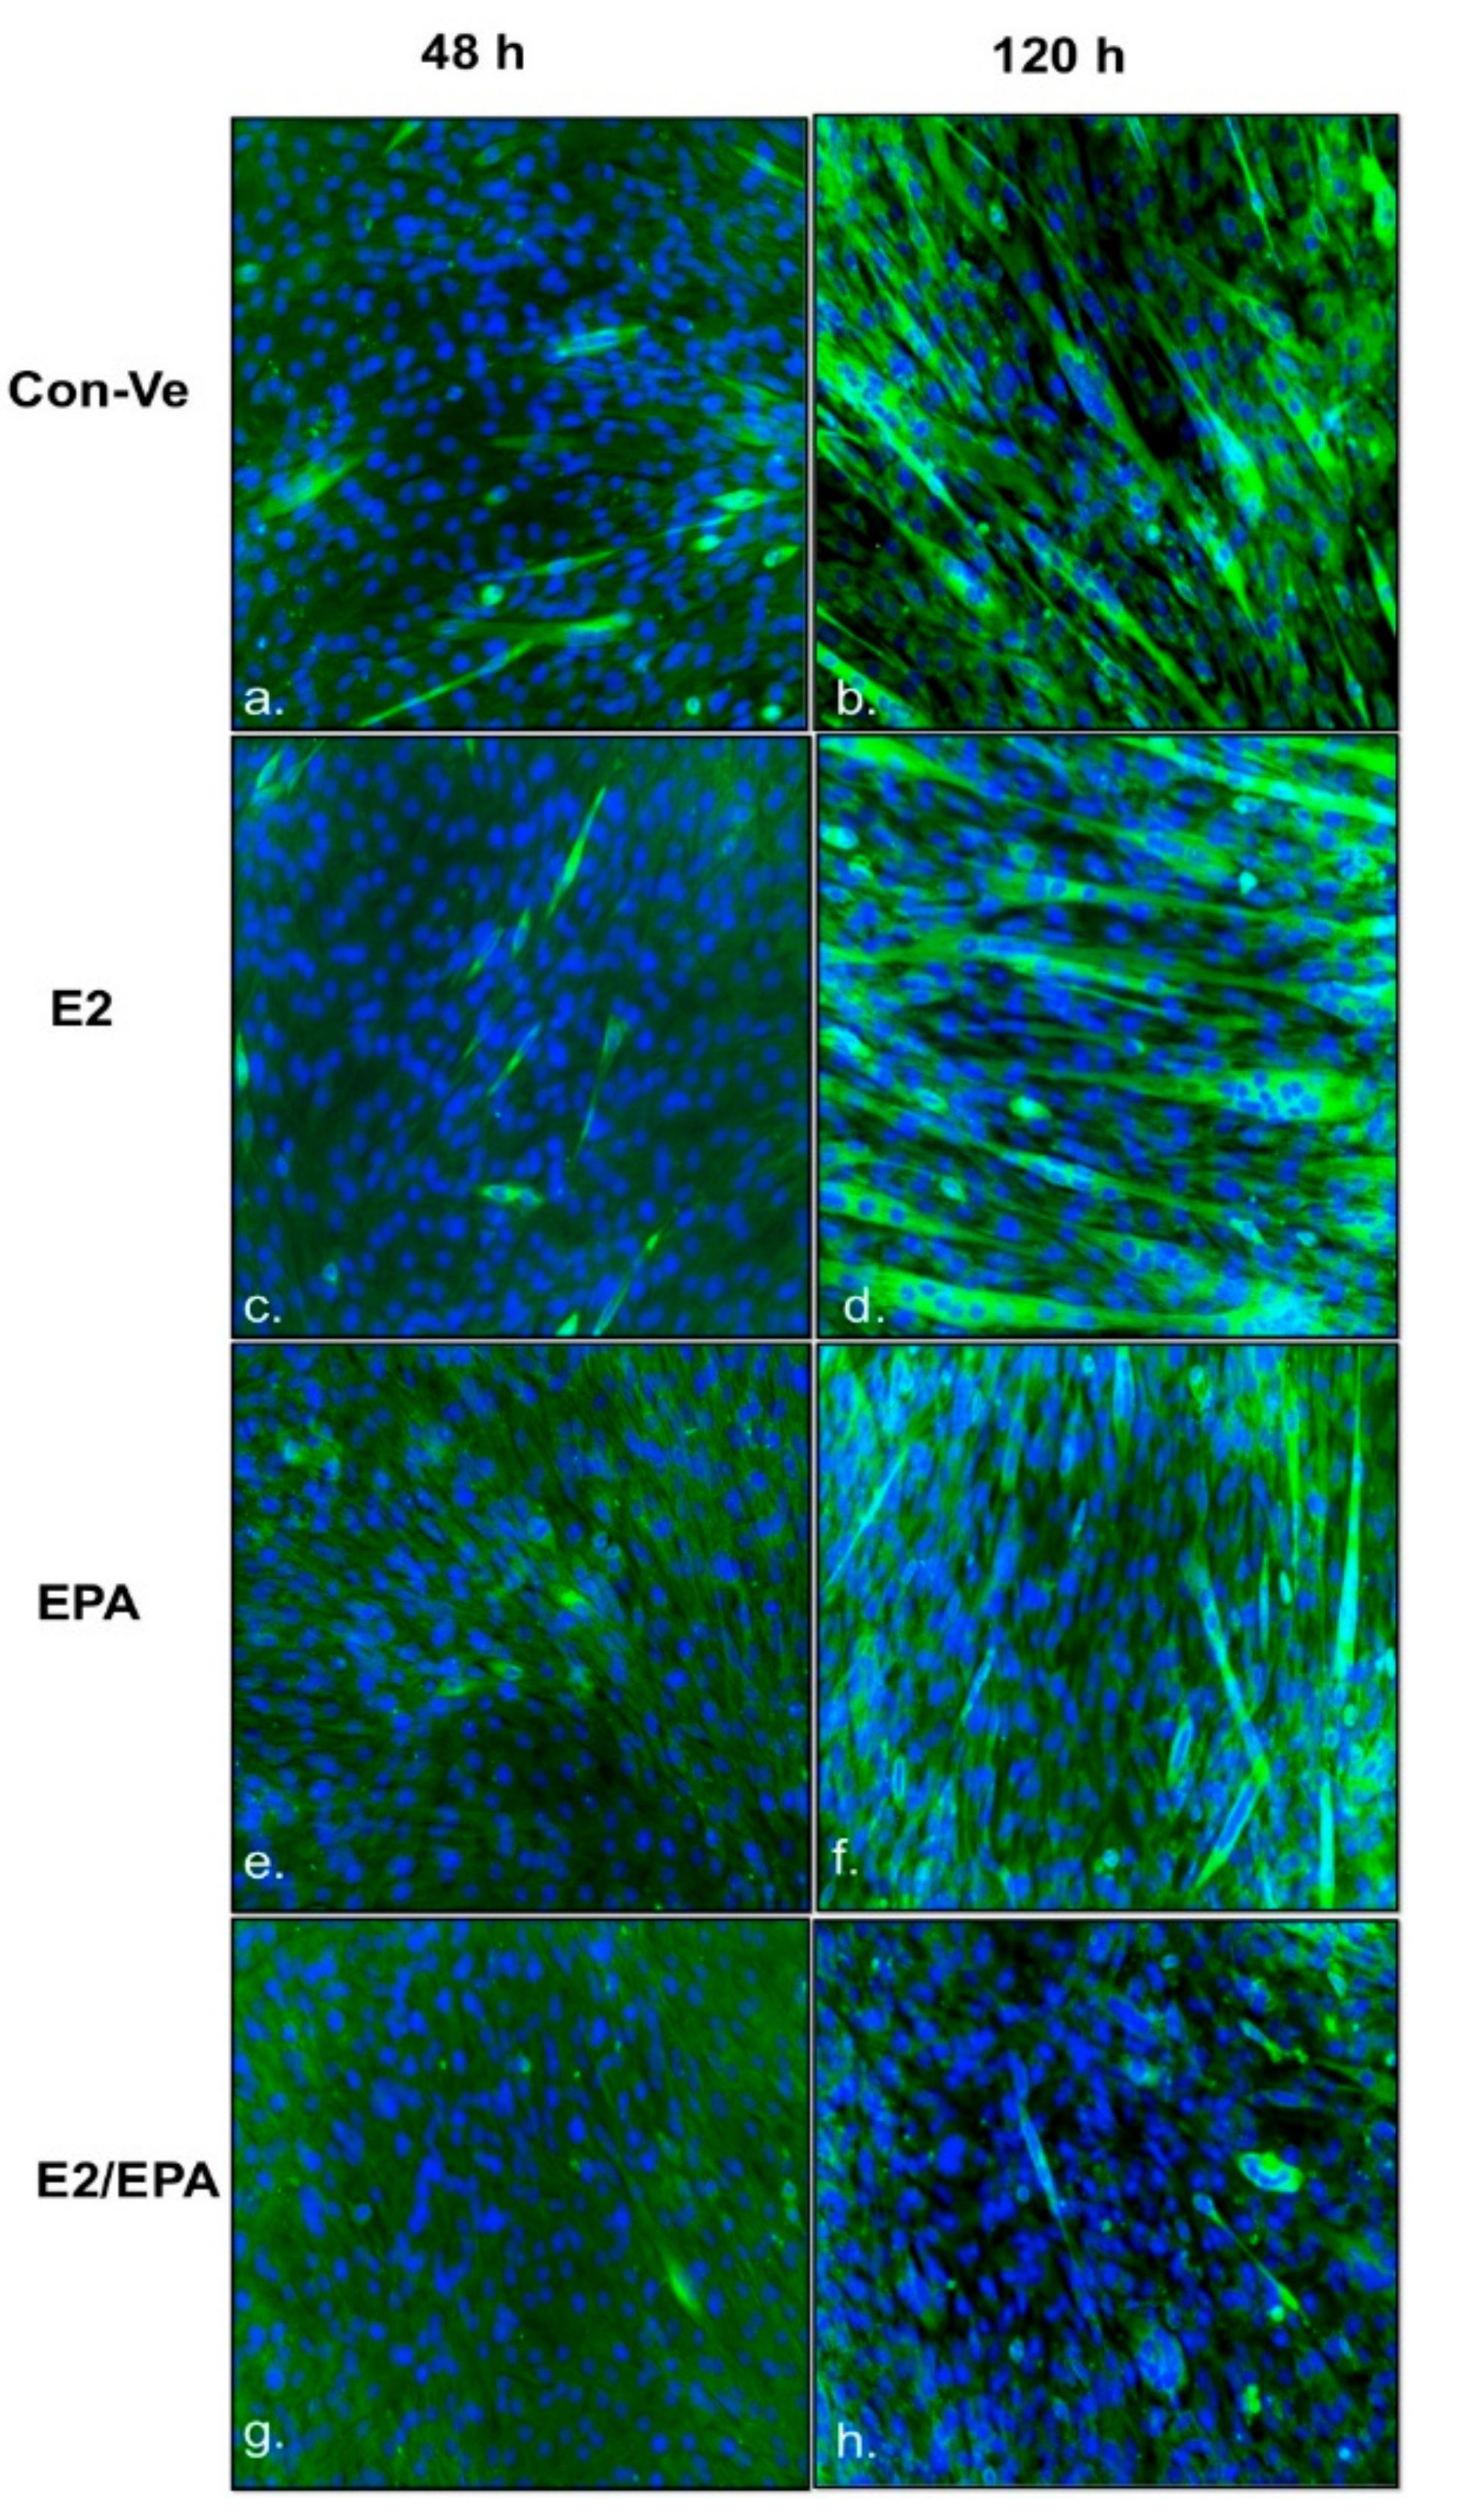
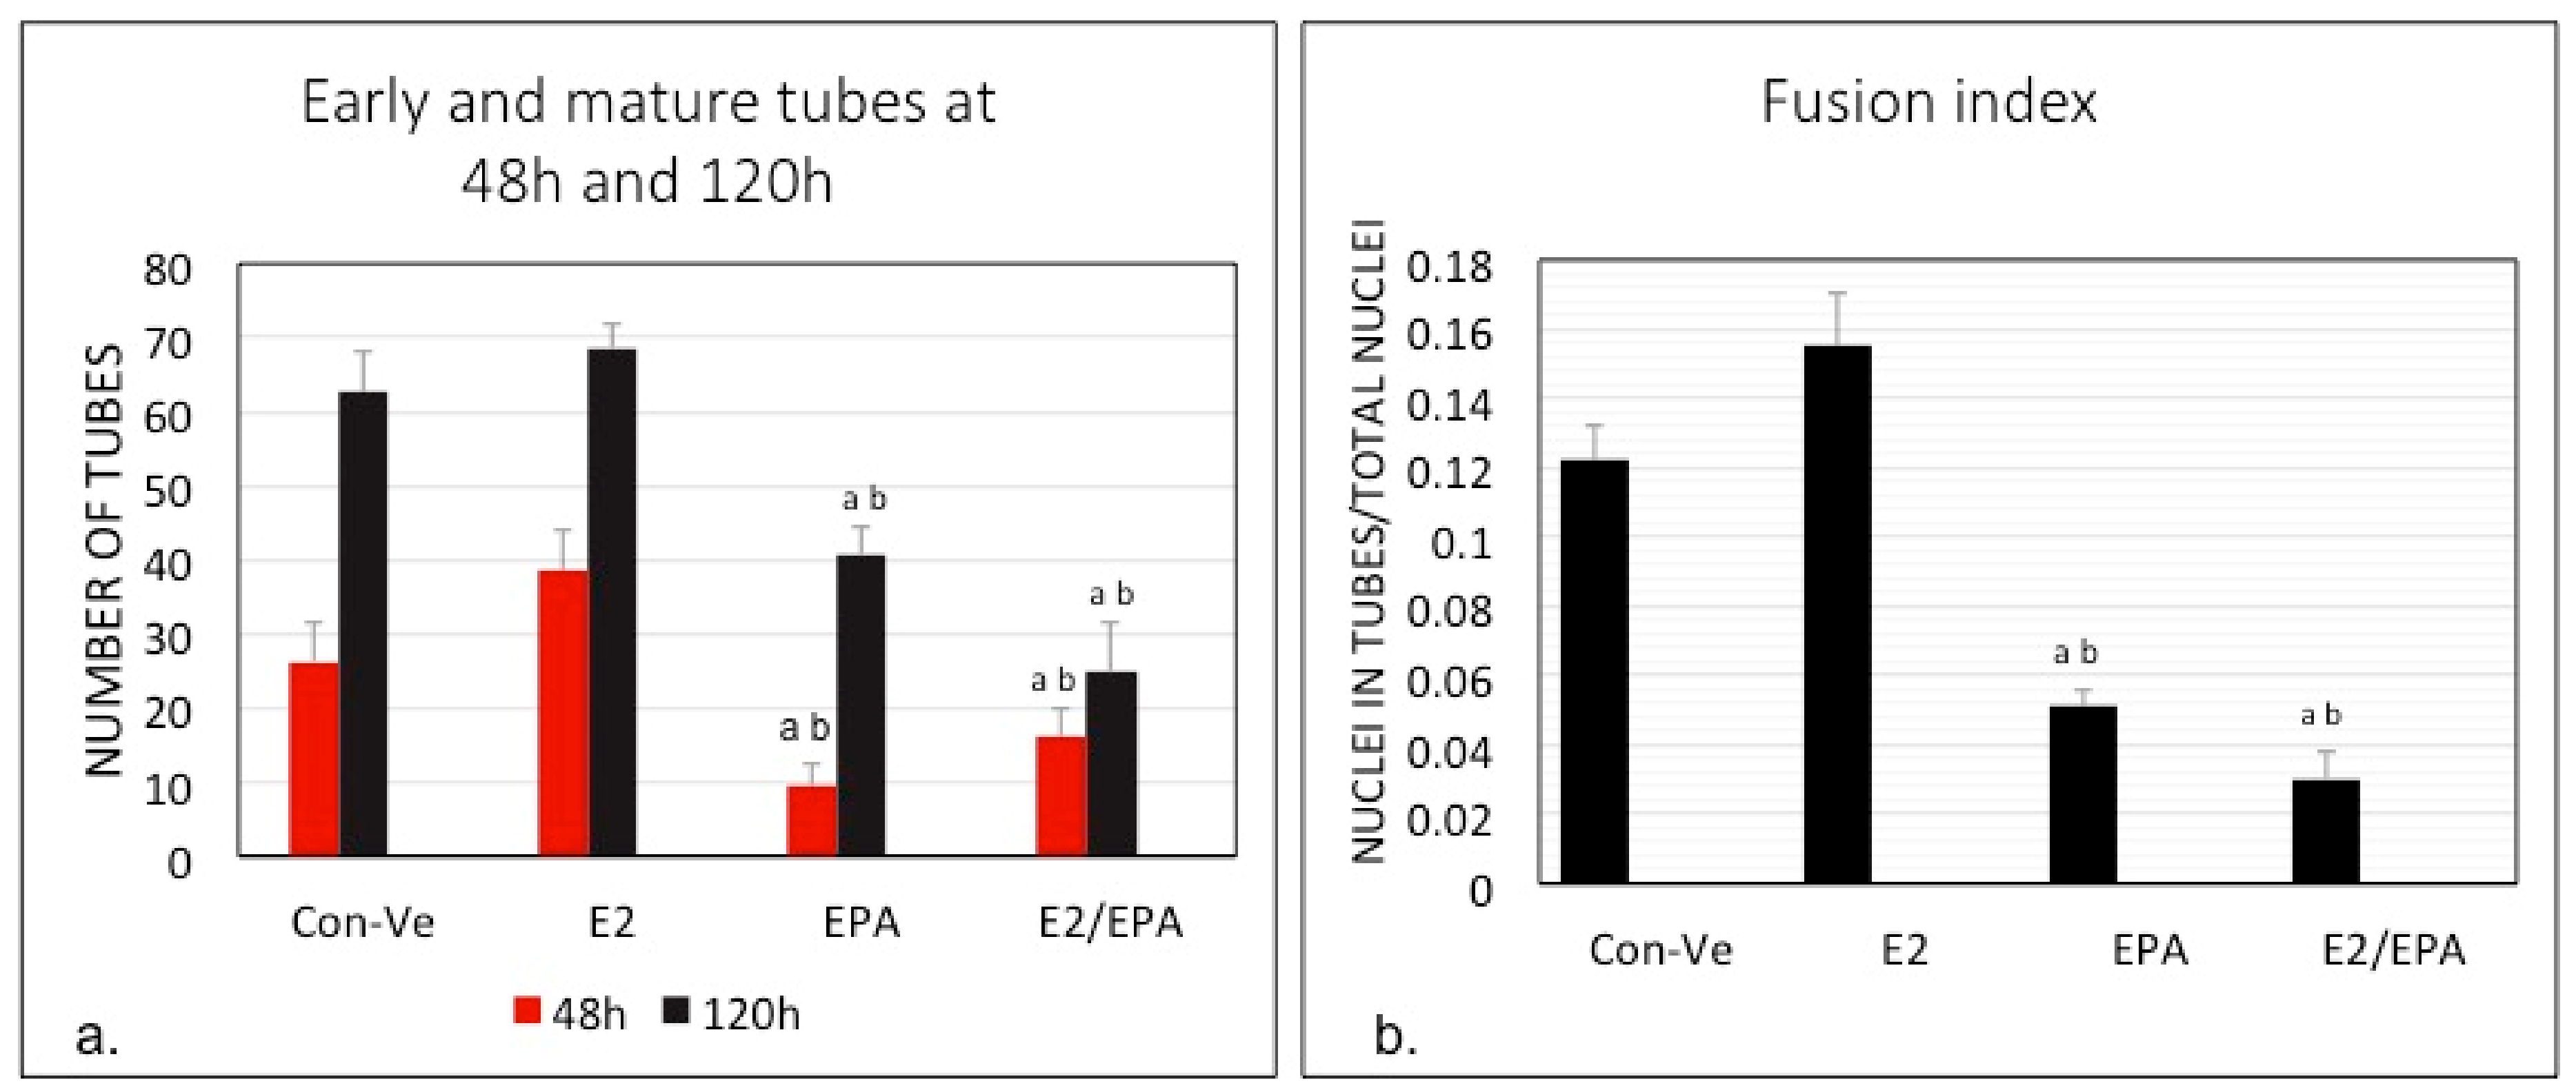
2.1. Morphological Changes and Myoblast Fusion Index
2.2. Gene Expression
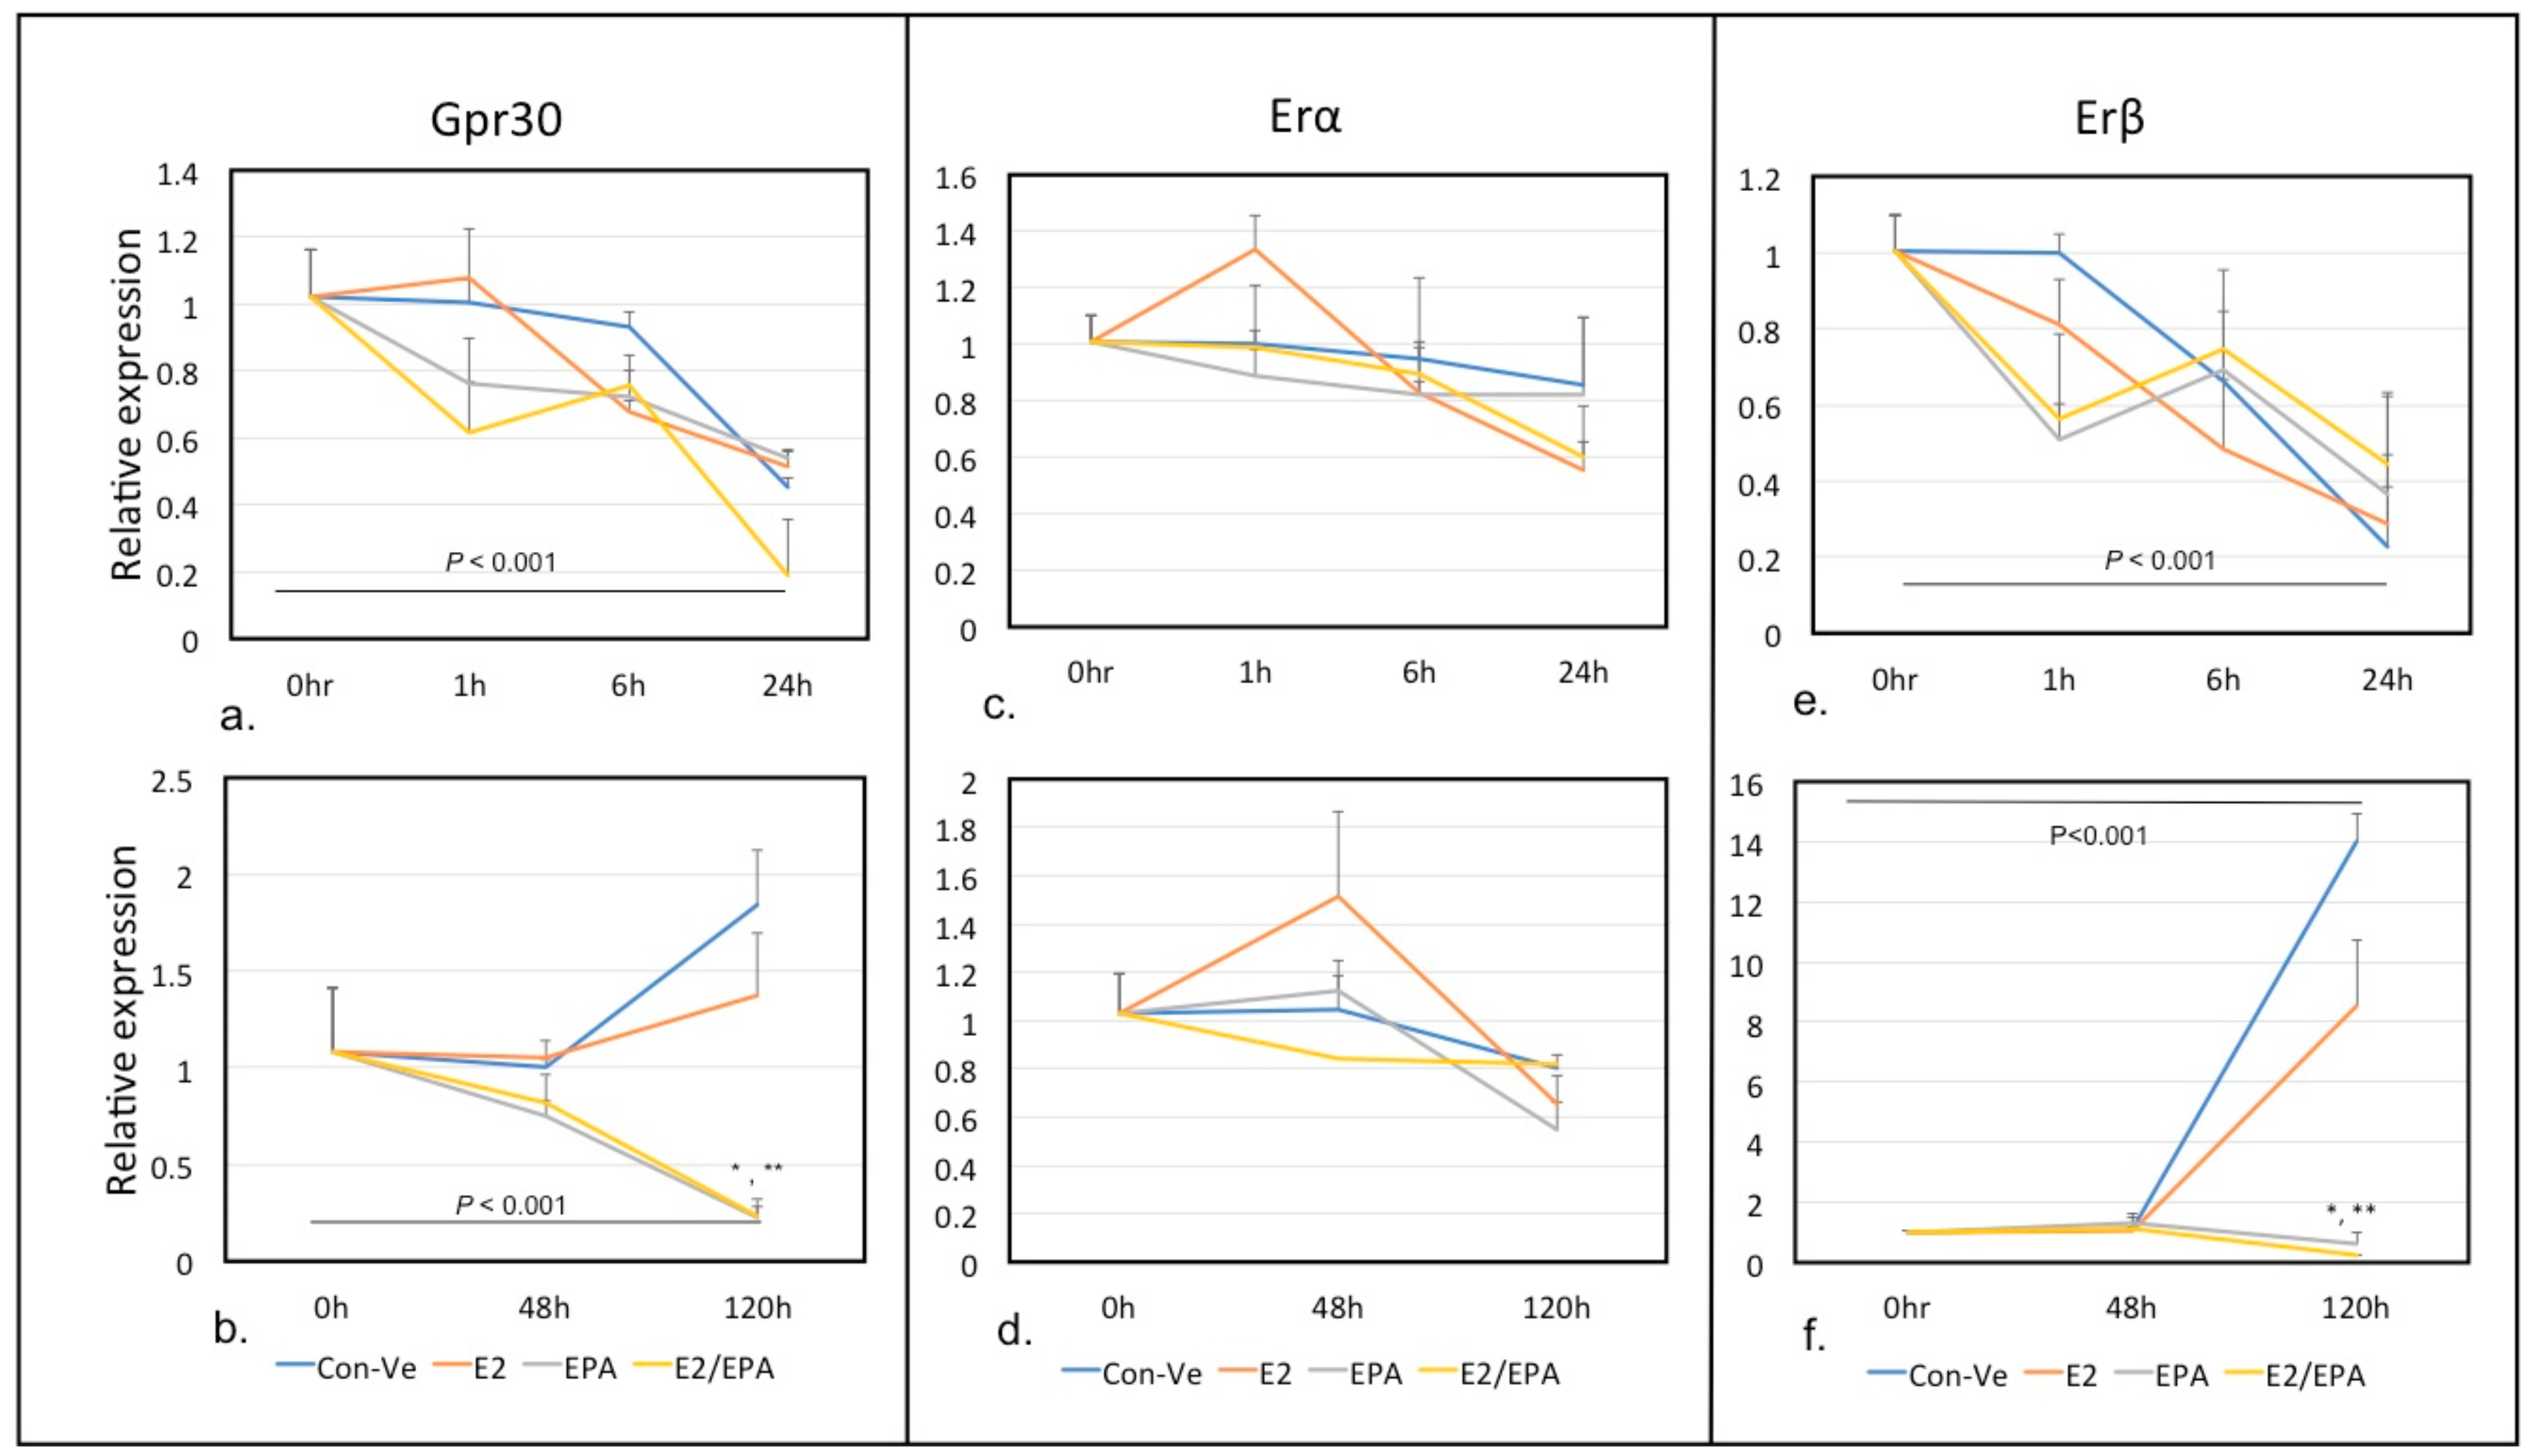
2.2.1. Time-Dependent Expression of Individual Genes Relative to 18S Ribosomal RNA Using Real Time qPCR Analysis
Gpr30, Erα and Erβ
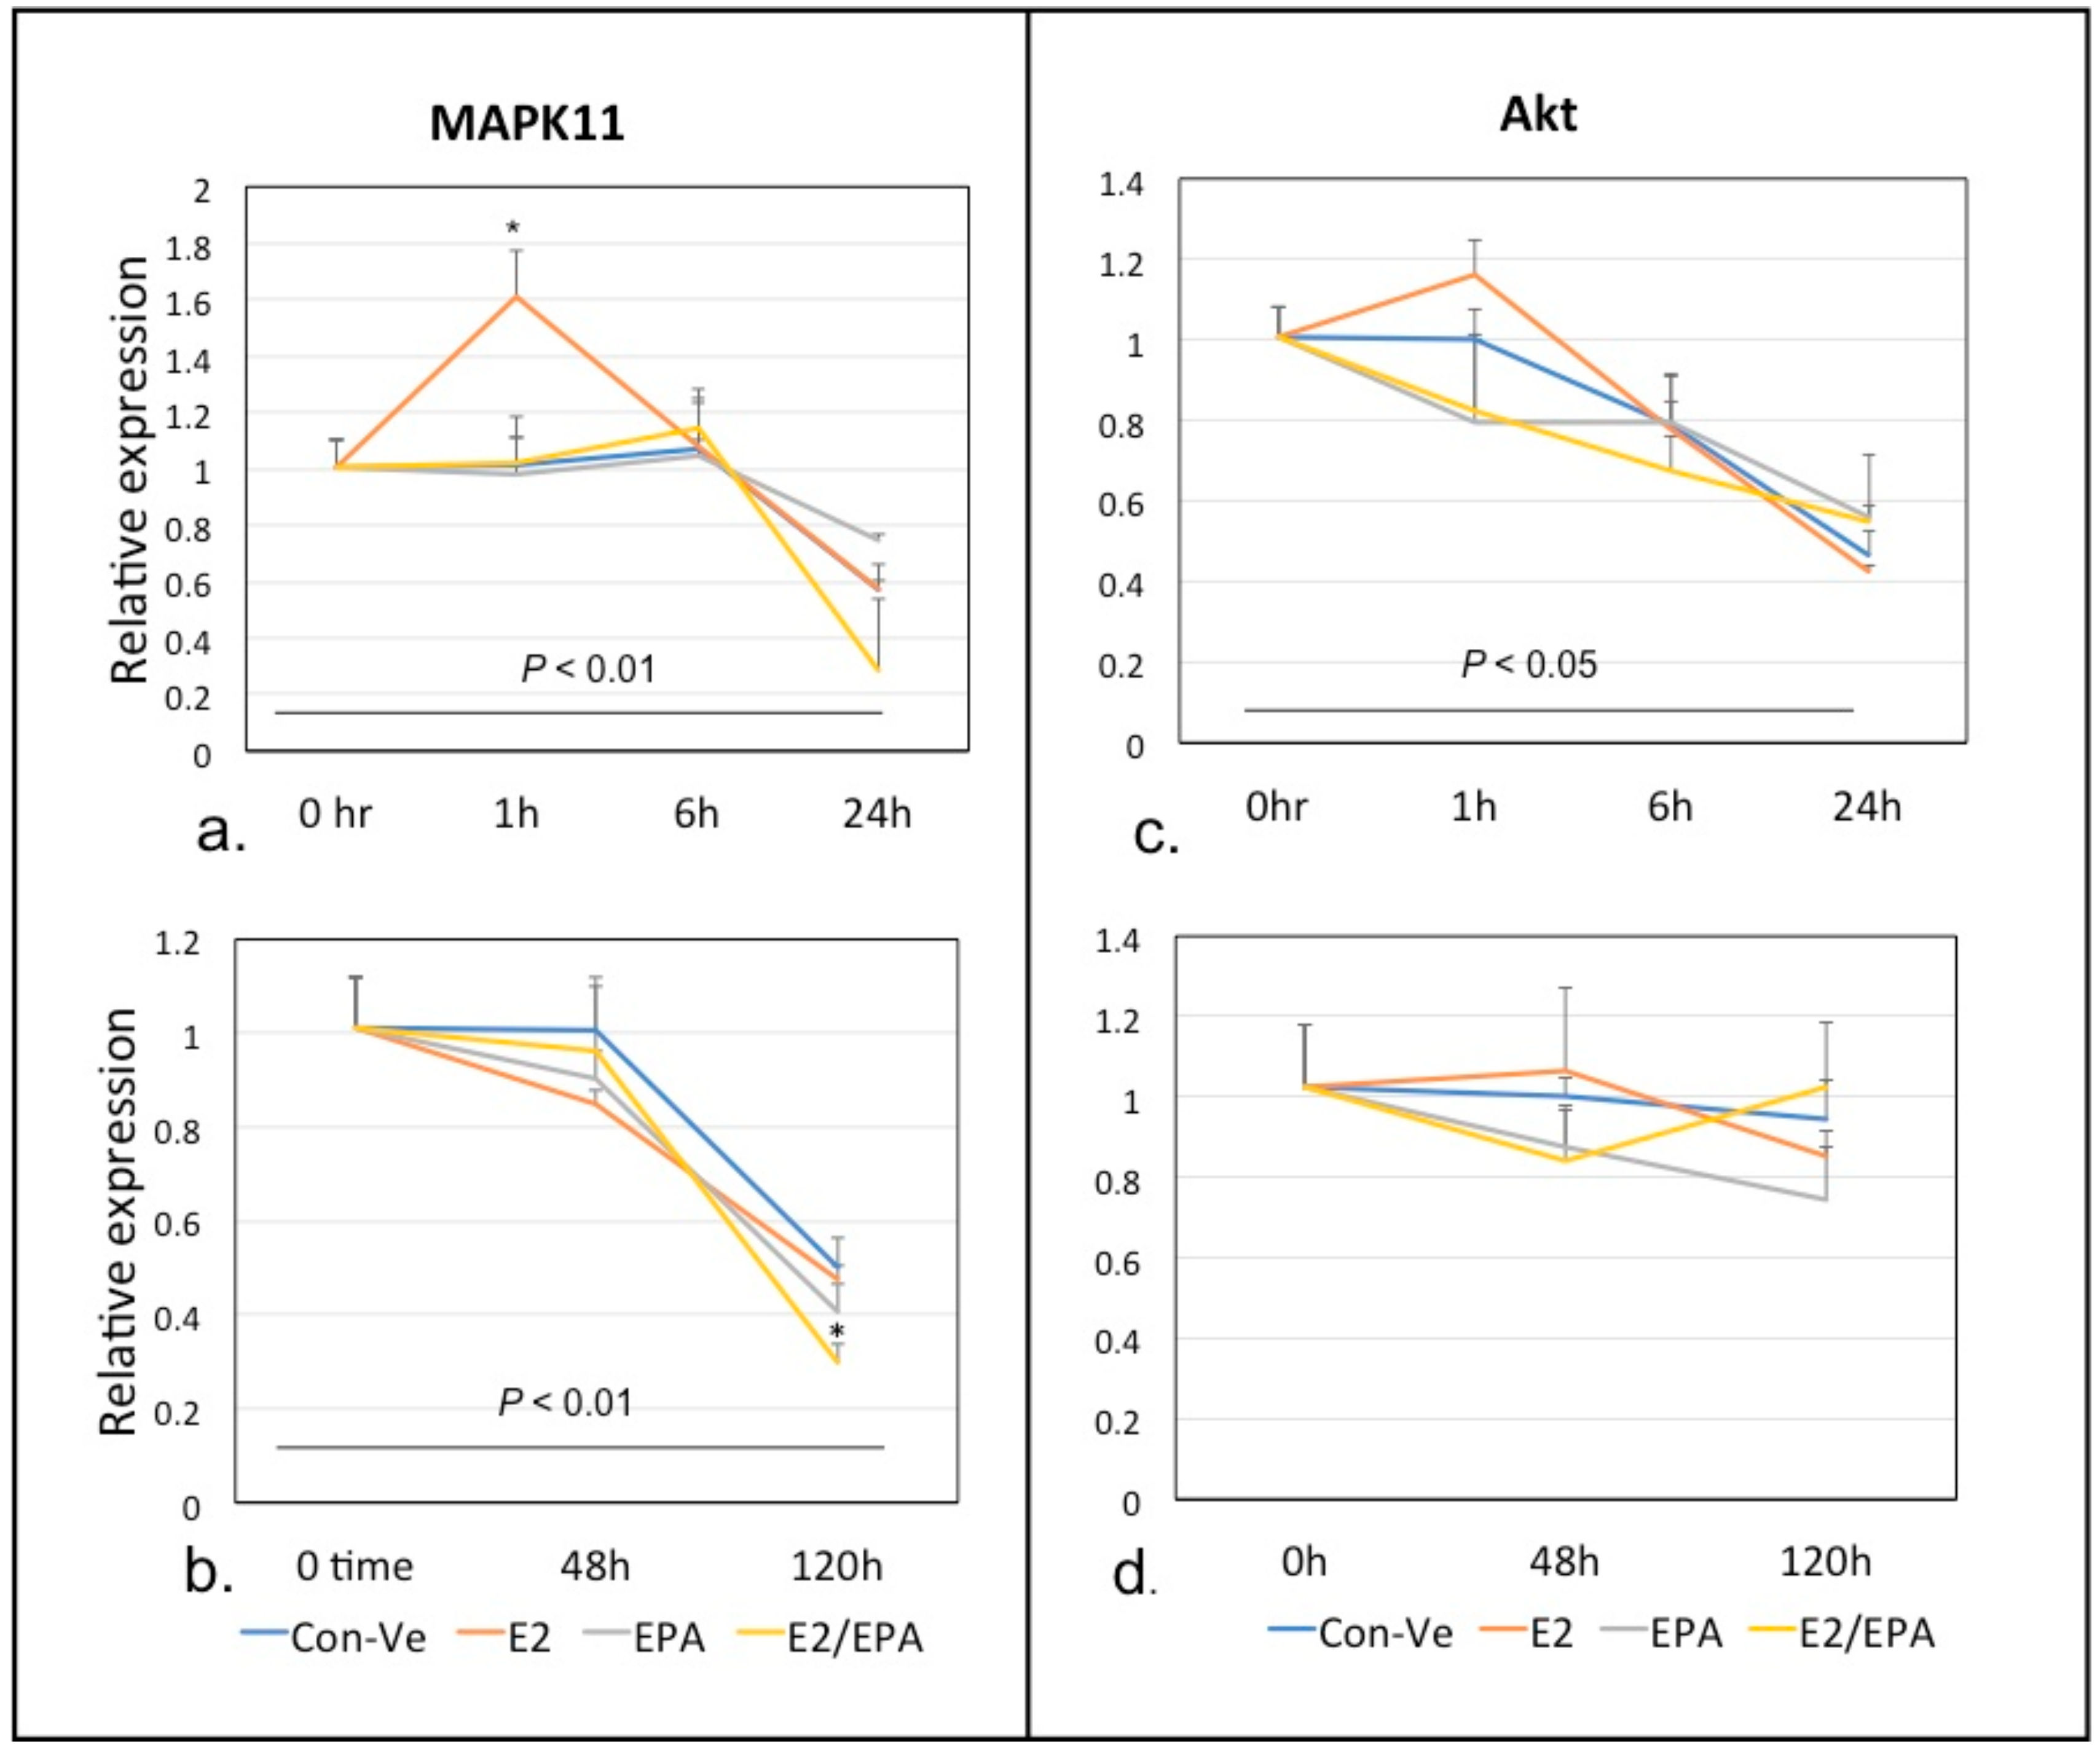
Mapk11 and Akt1
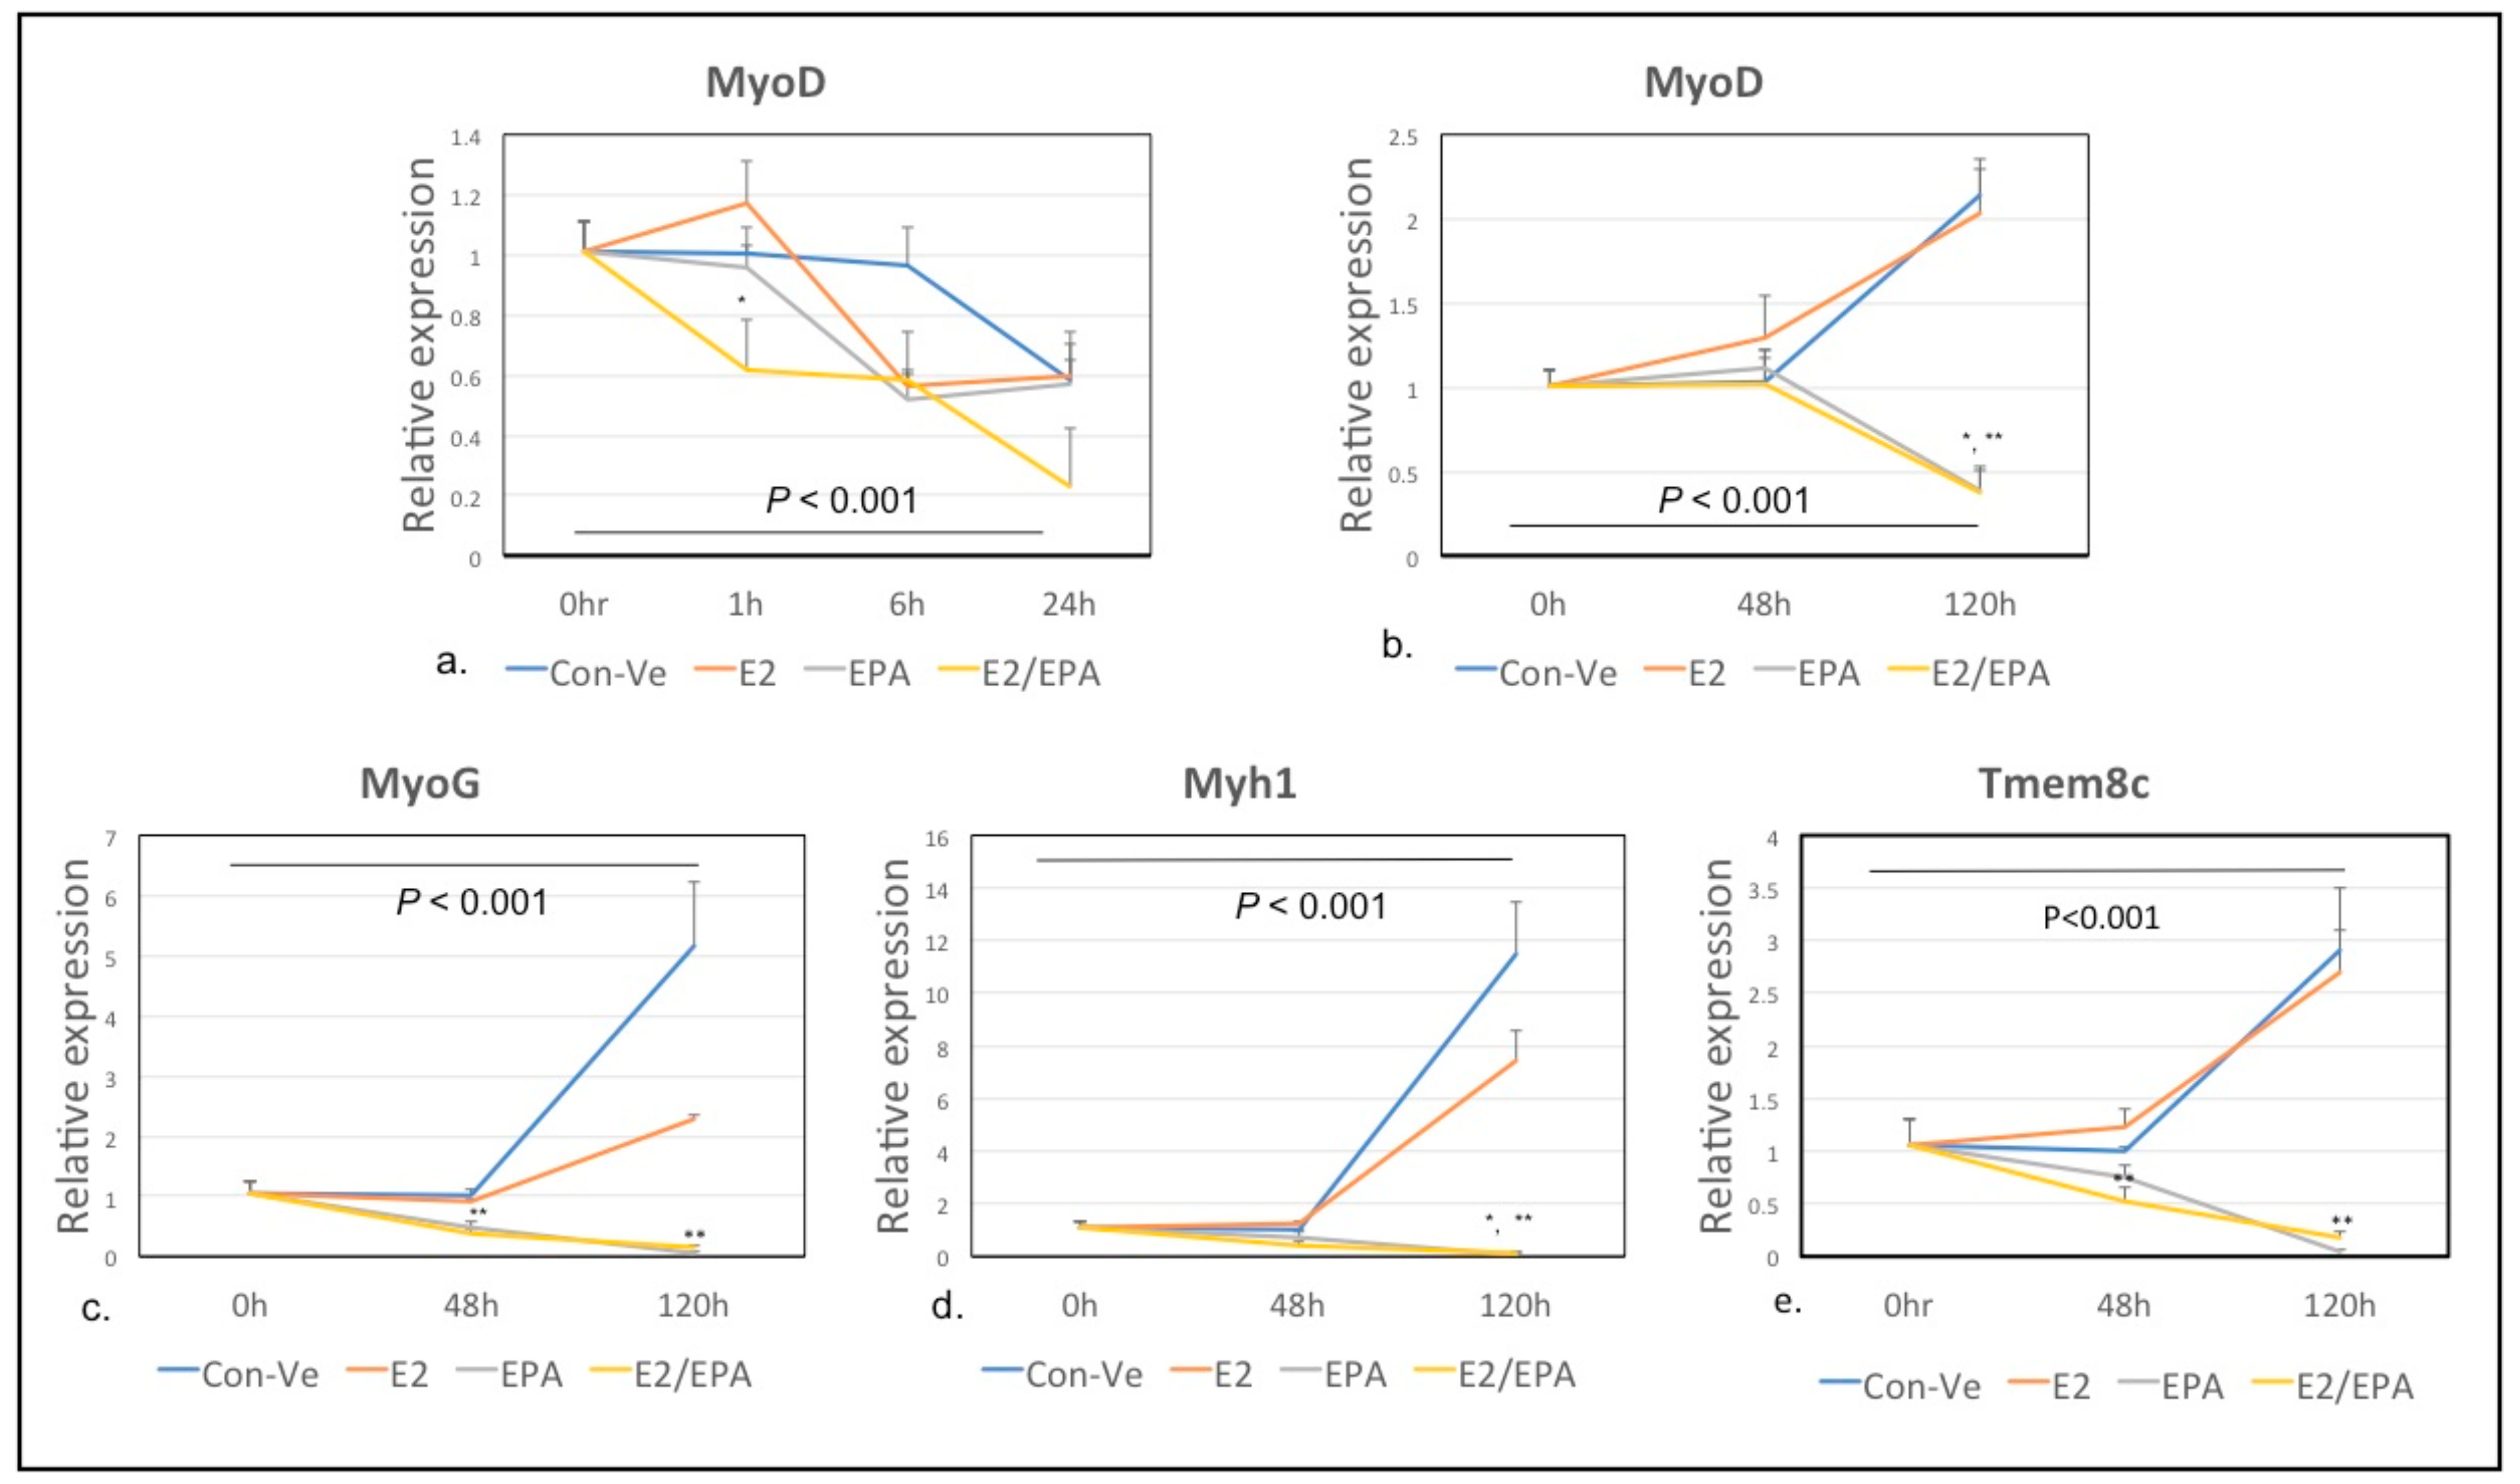
MyoD1, Myog, Myh1 and Myomaker (Tmem8c)
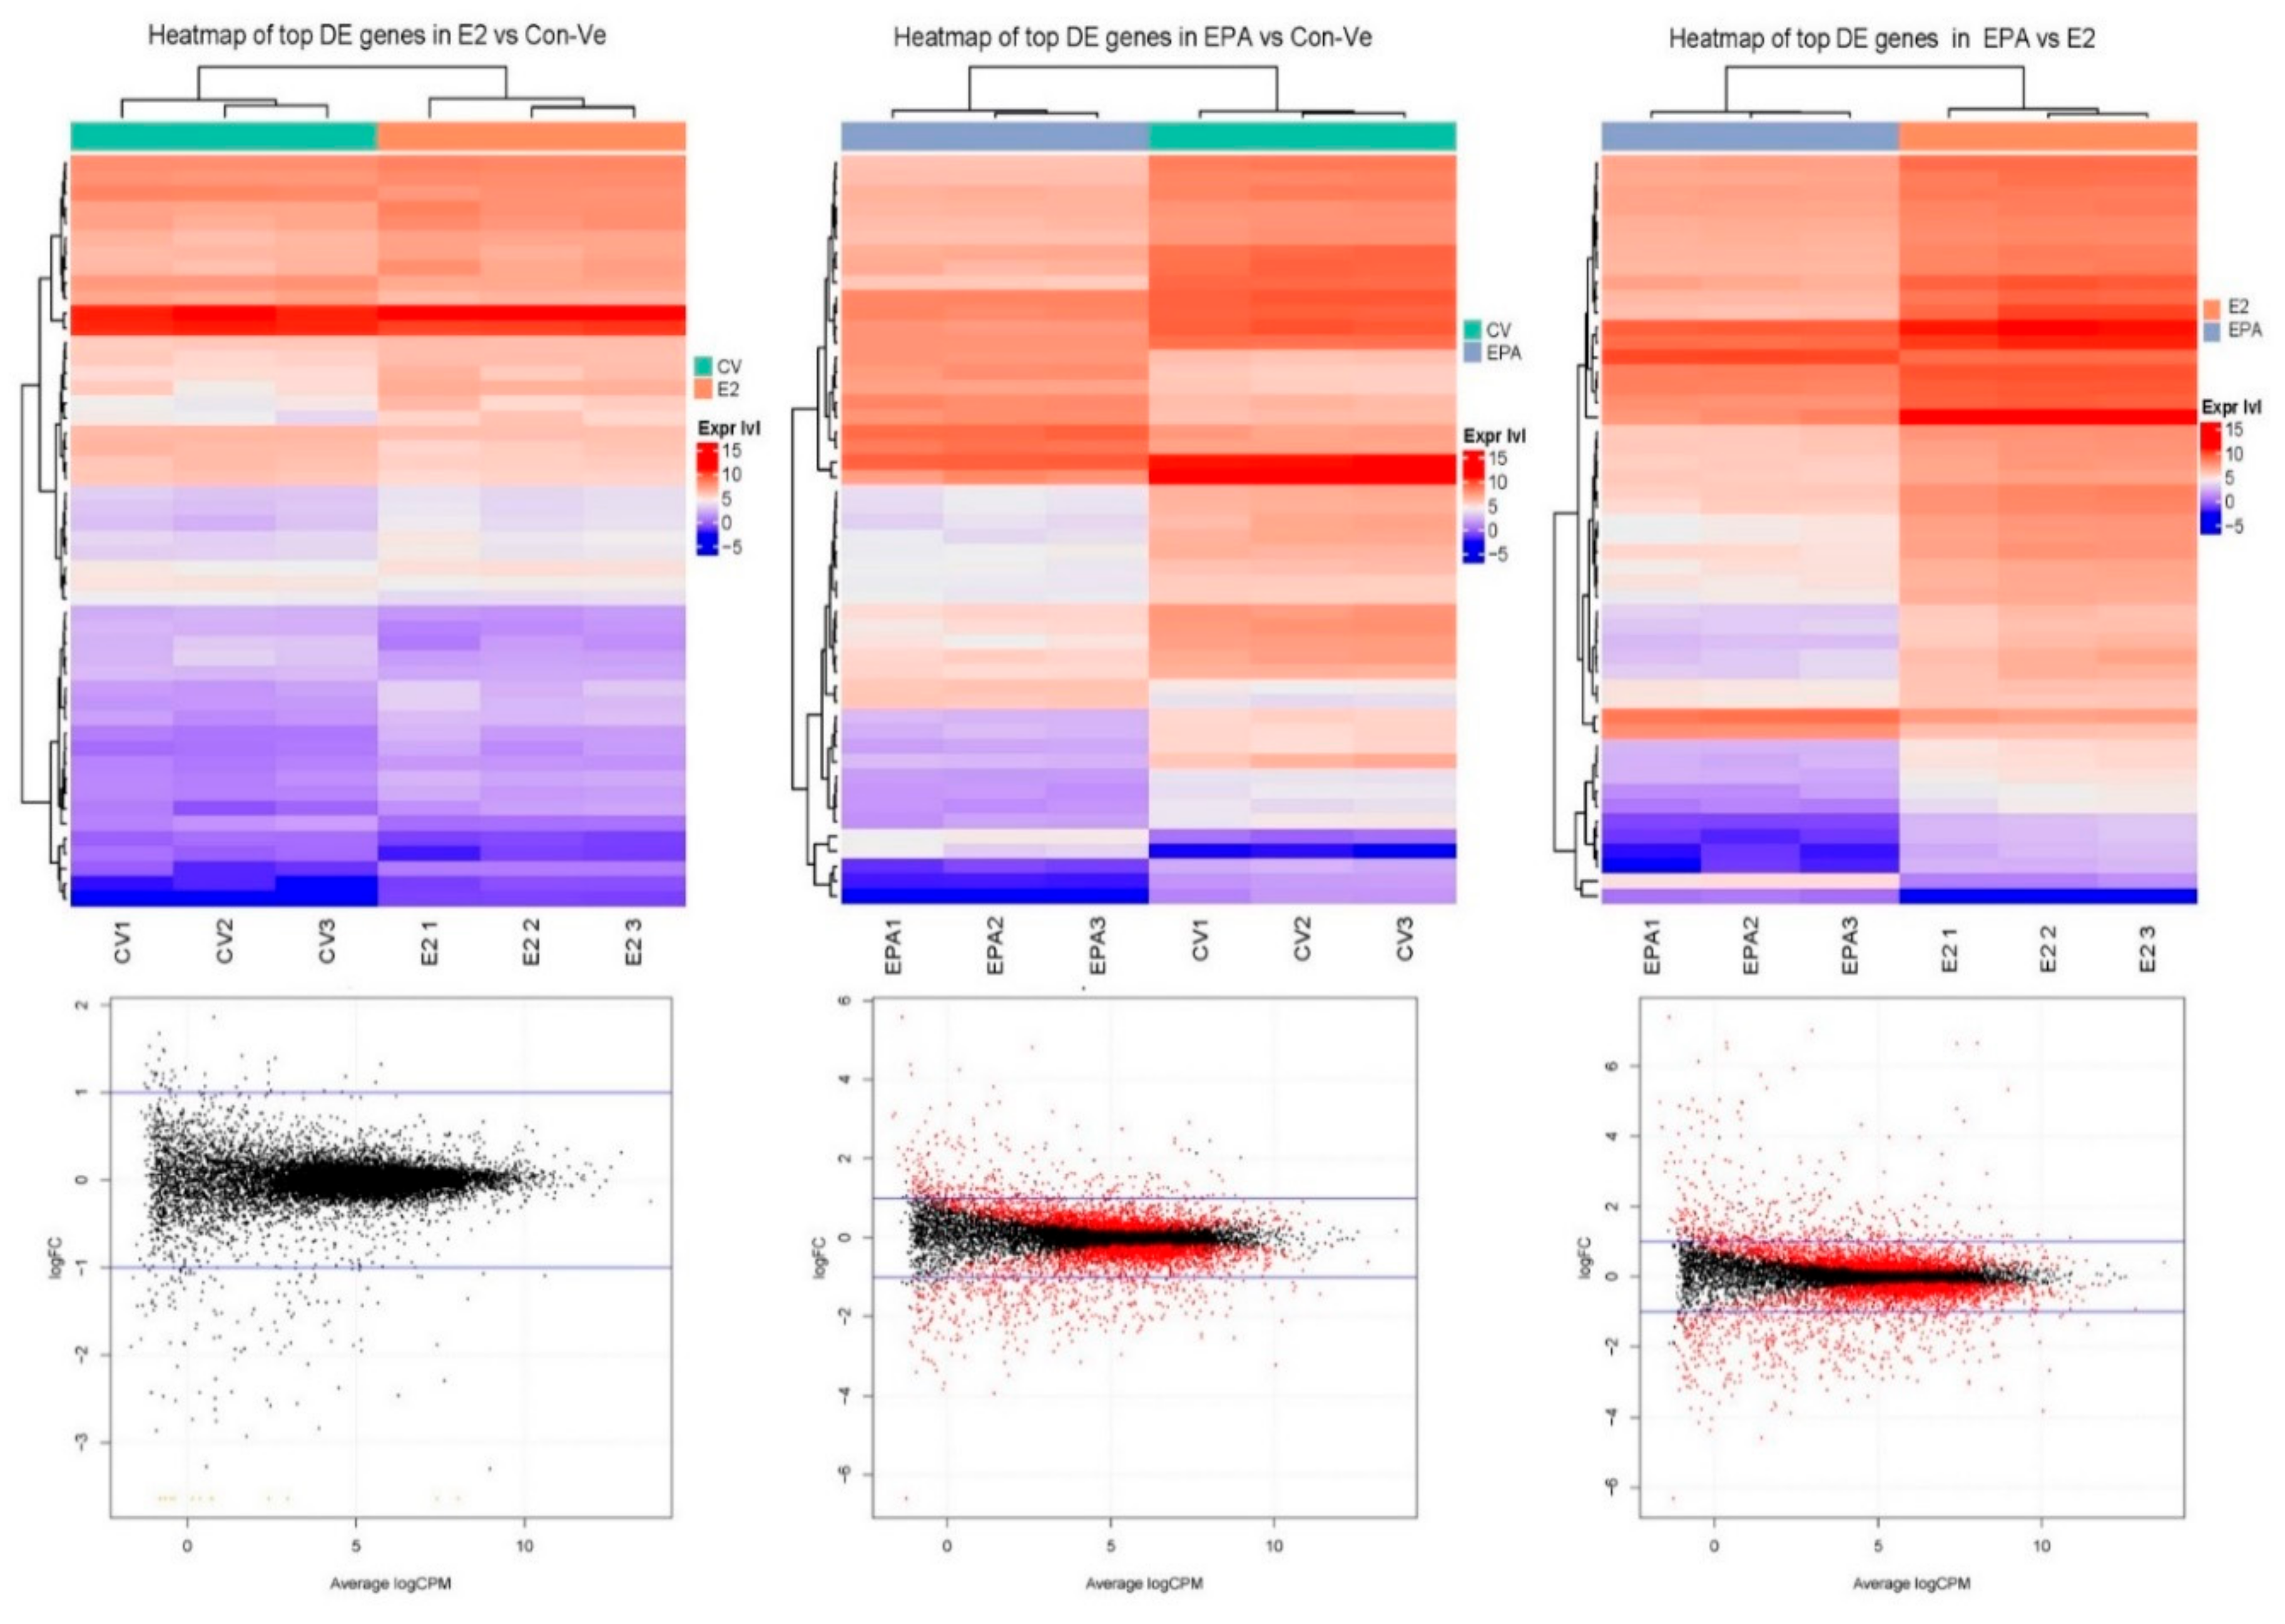
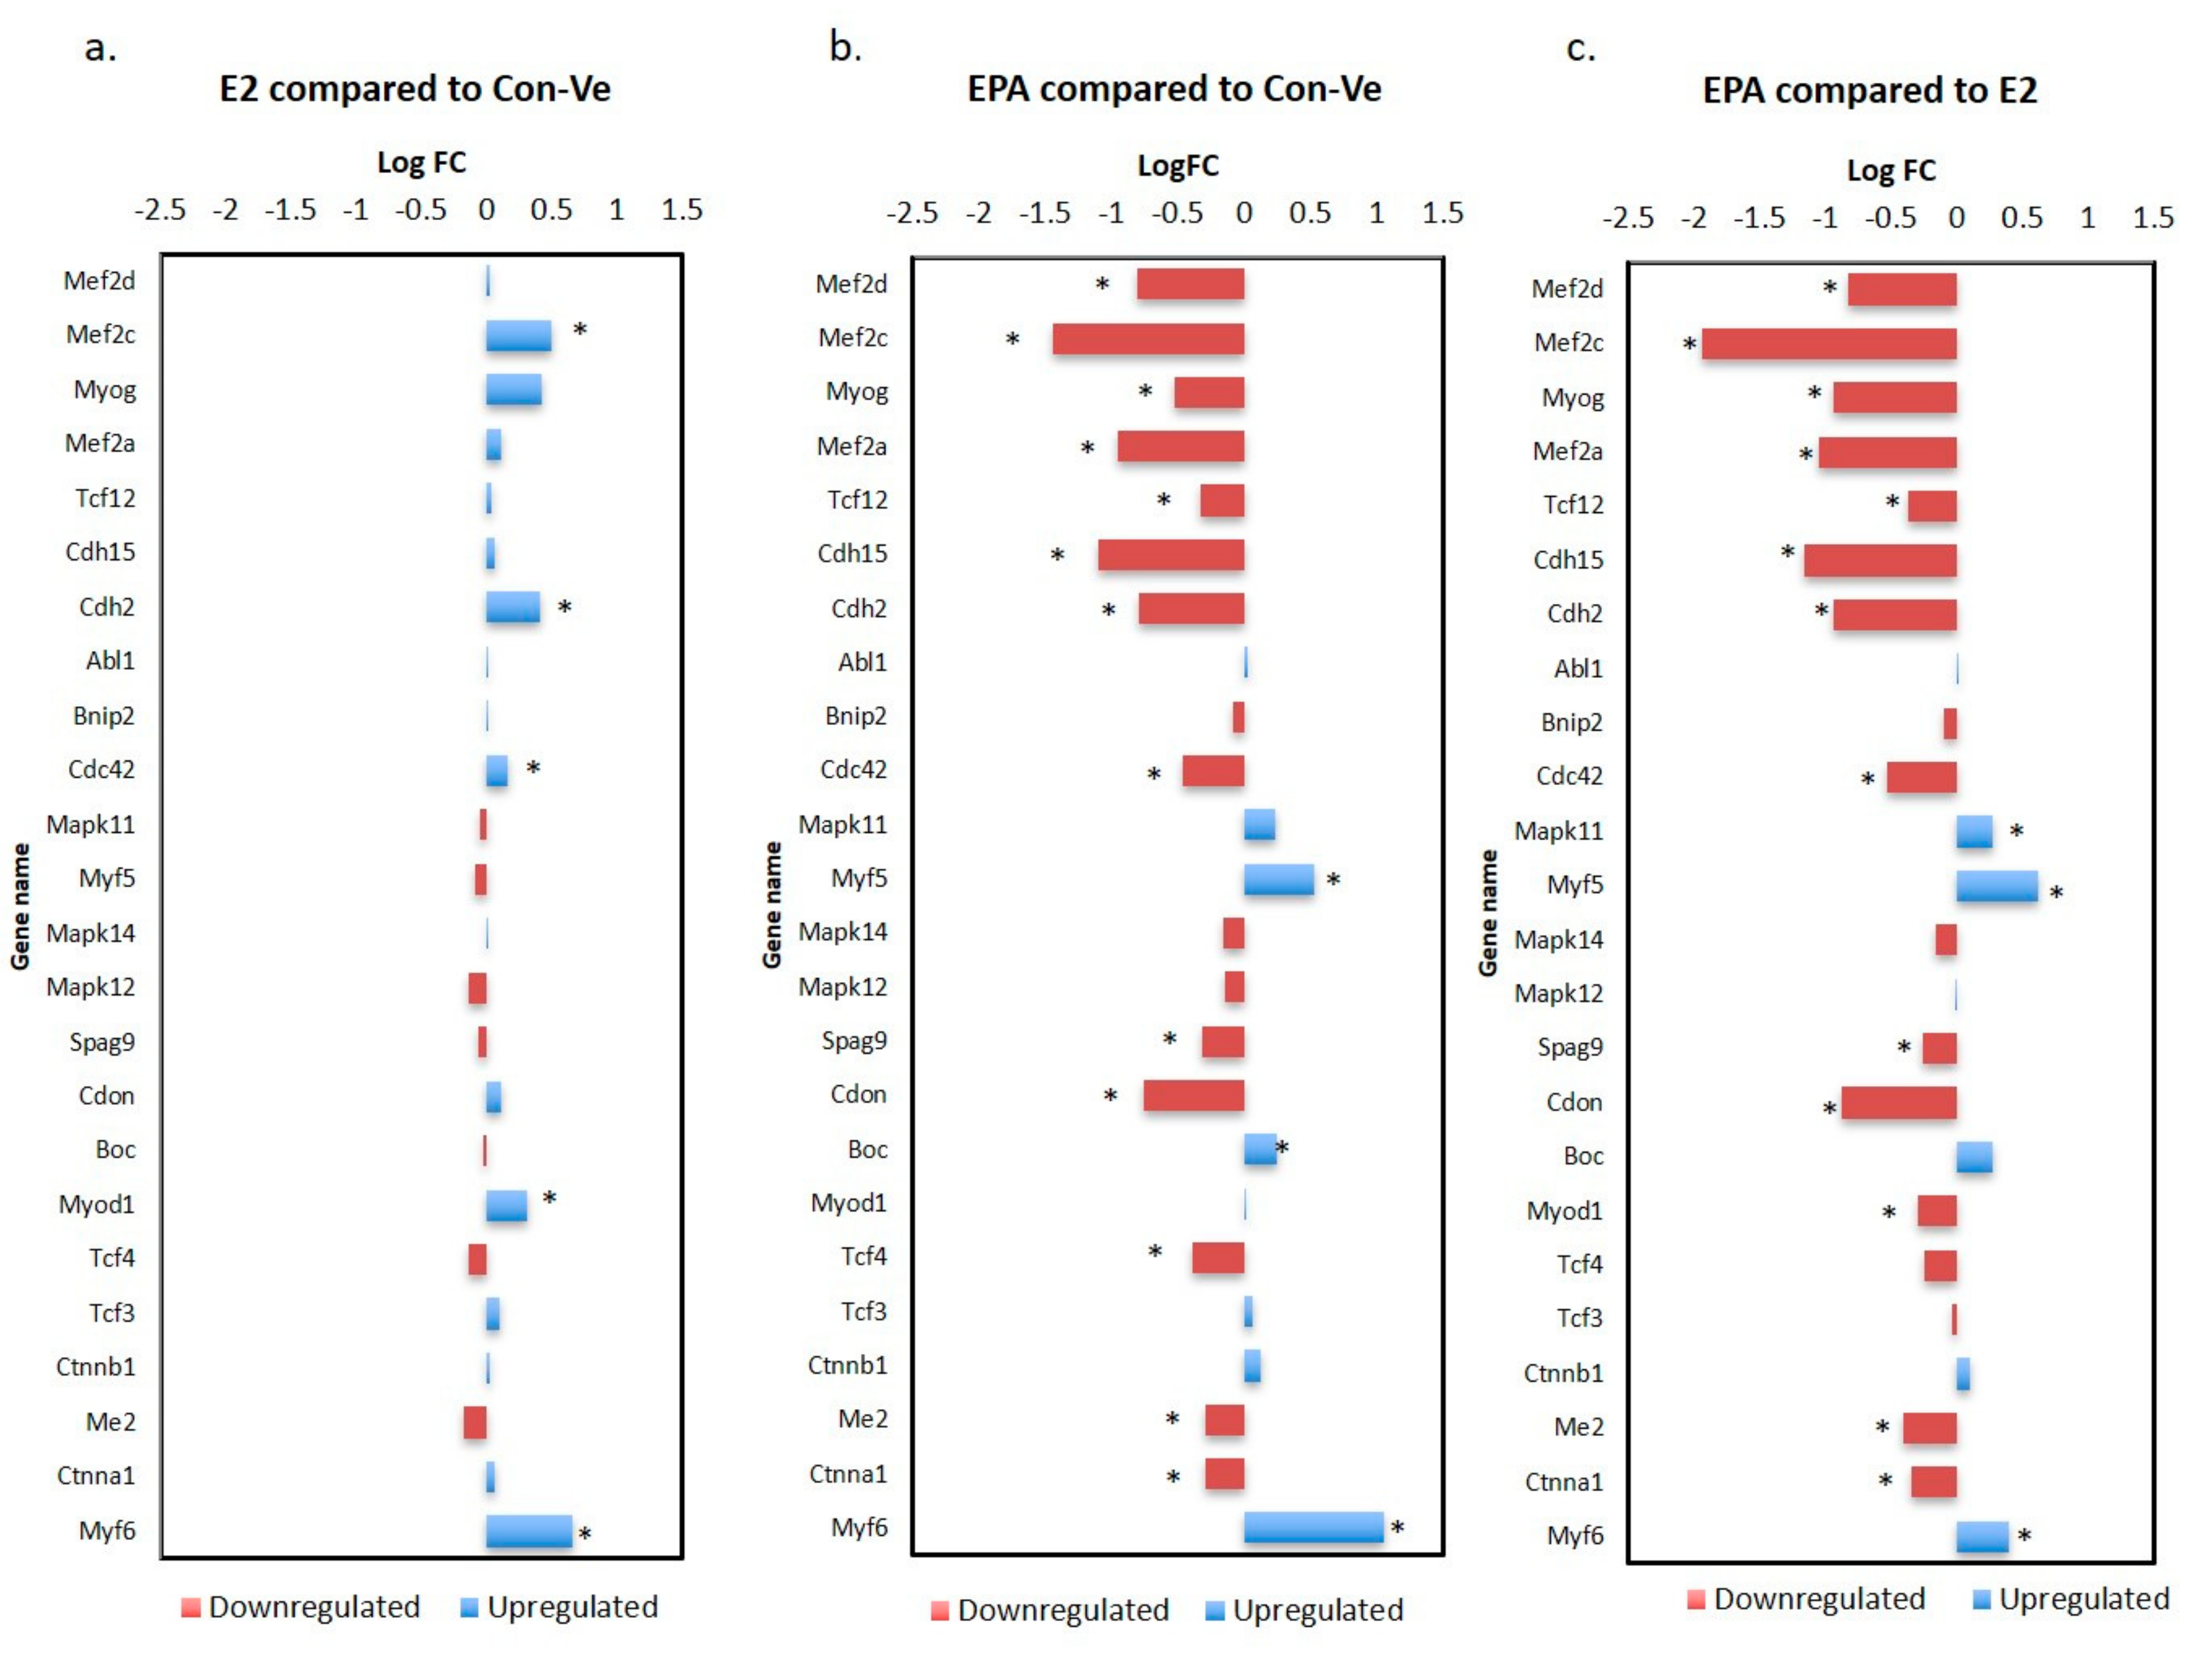
2.3. Next Generation Sequencing (NGS)
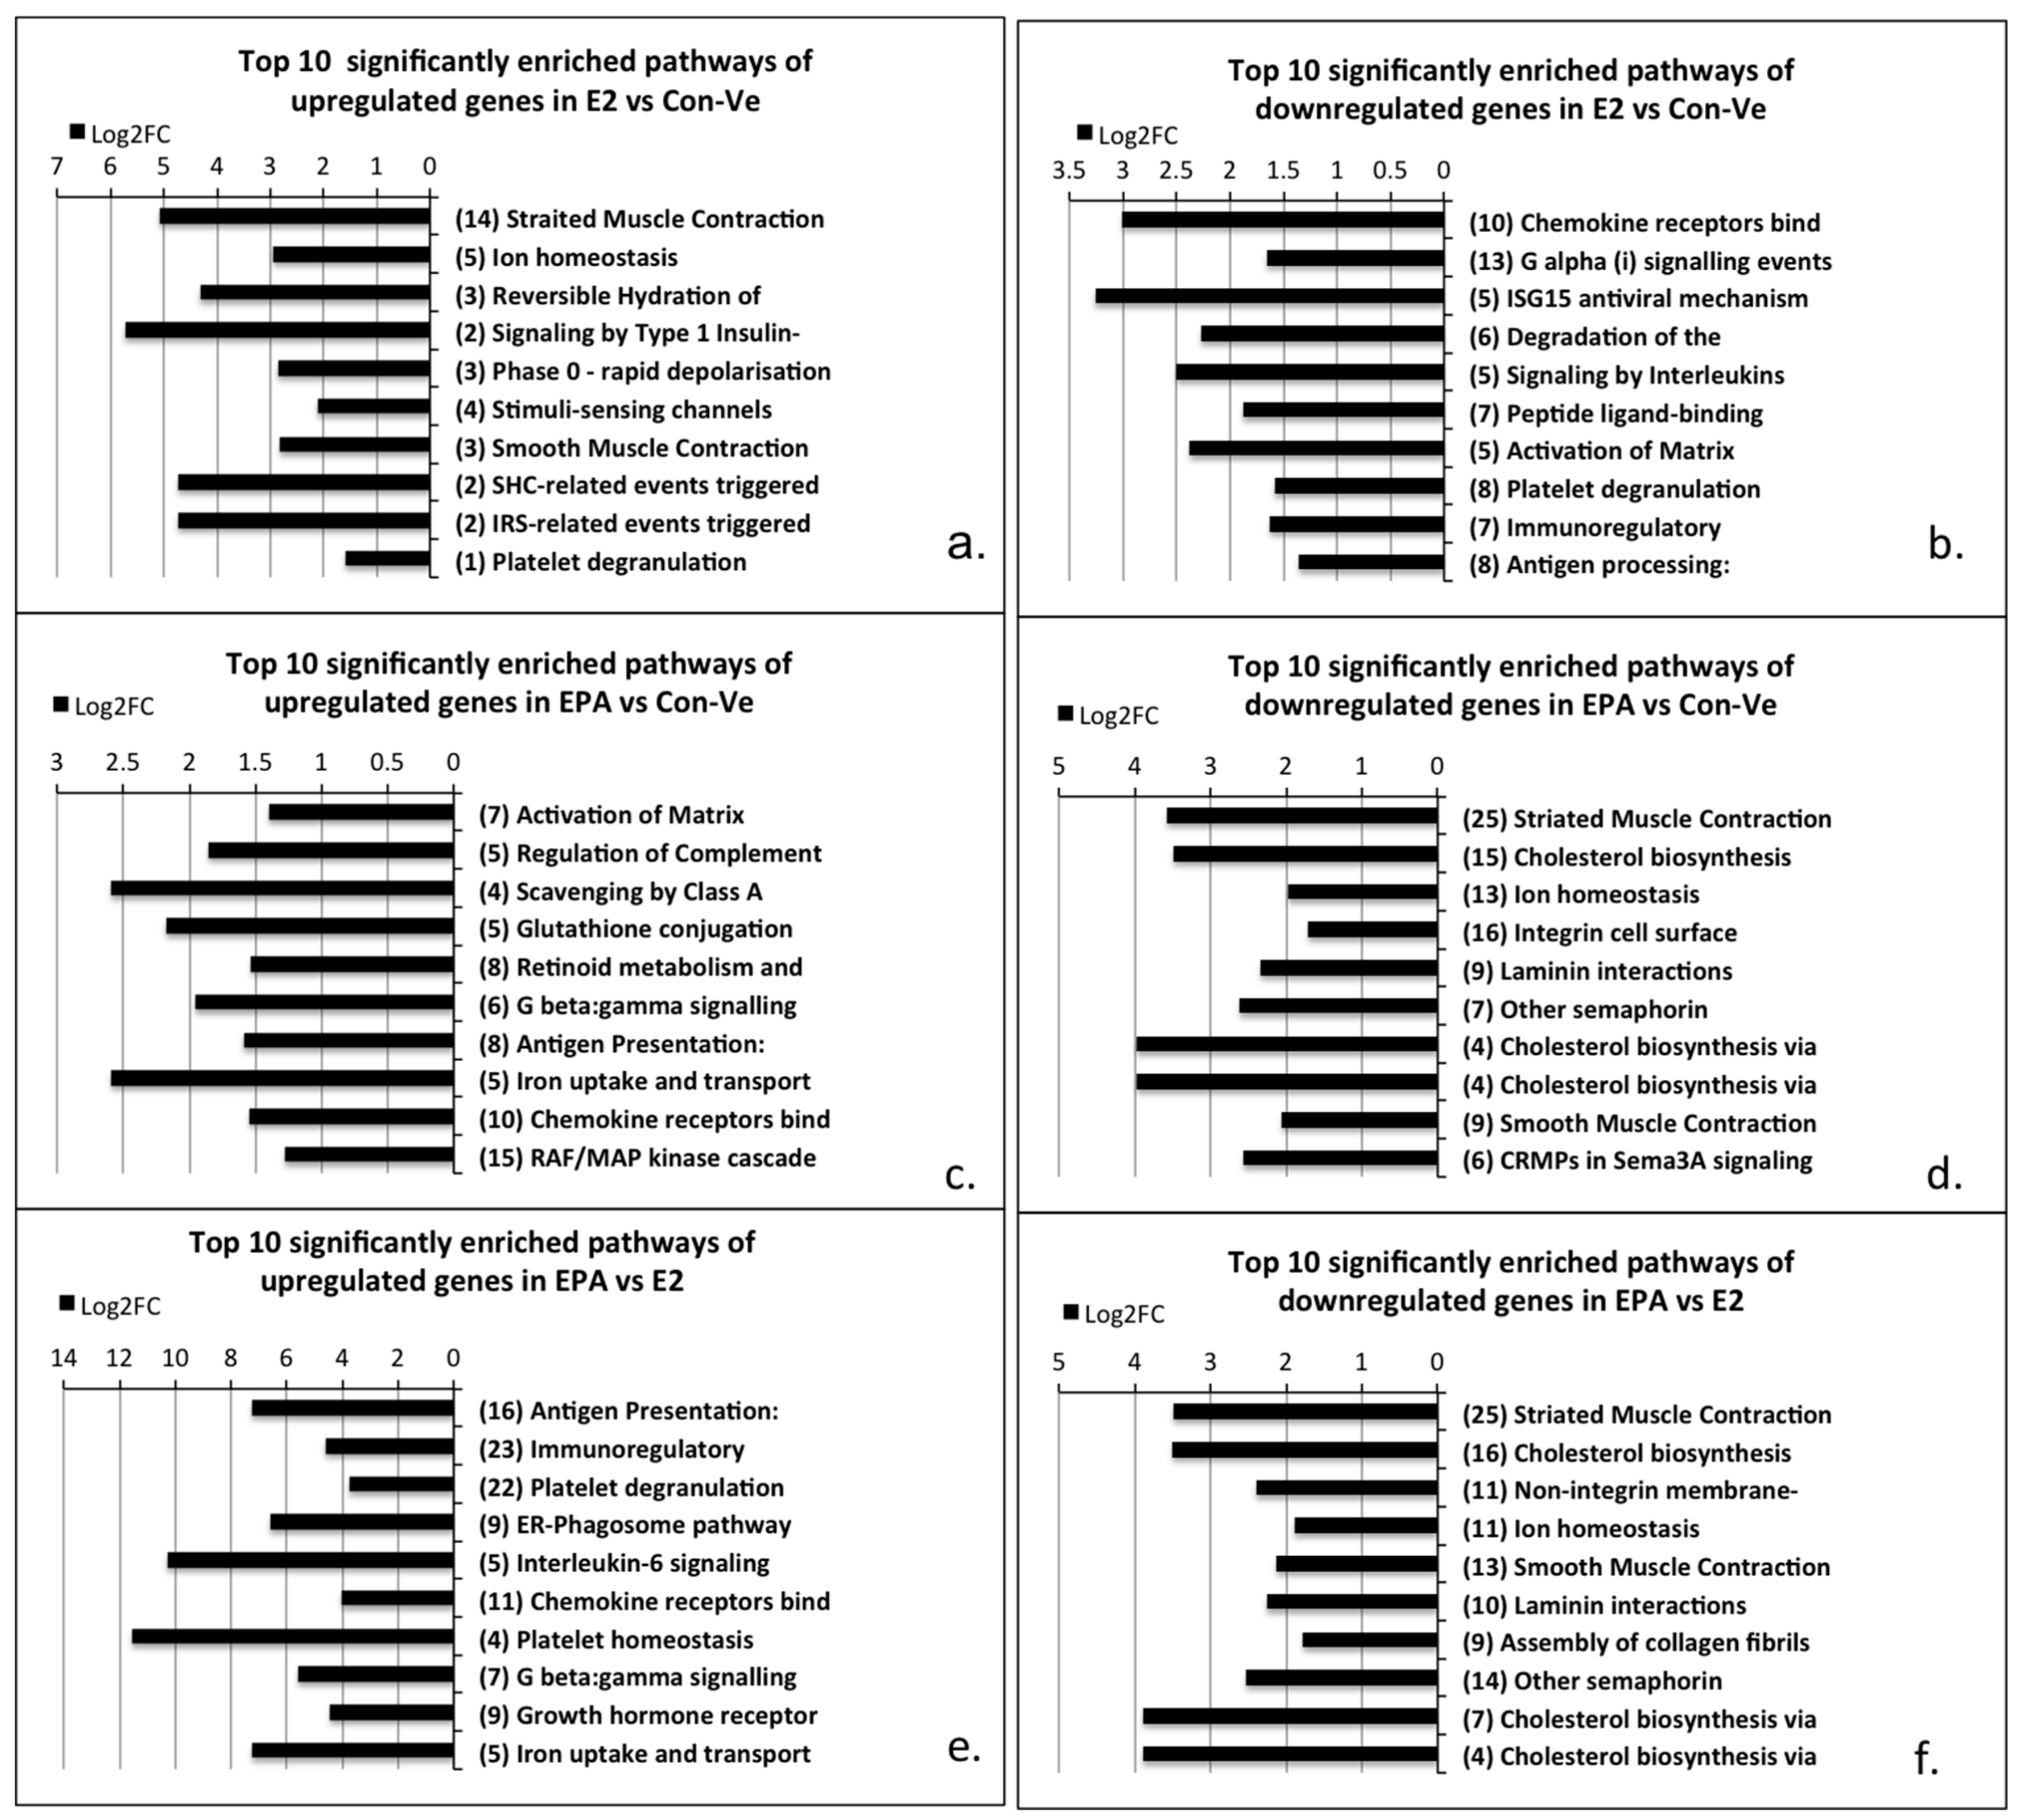
2.3.1. Pathway Enrichment Analyses, Gene Ontology and Gene Functional Category in Cultures at 48 h Treatment with Con-Ve, E2 and EPA
2.3.2. Gene Expression Profile in the Myogenic and the Striated Muscle Contraction Pathways at 48 h Treatment with Con-Ve, E2 and EPA
2.3.3. Genes Unique to E2 and EPA Treated Cells
3. Discussion
4. Materials and Methods
4.1. Cell Culture
4.2. E2 and EPA Treatments
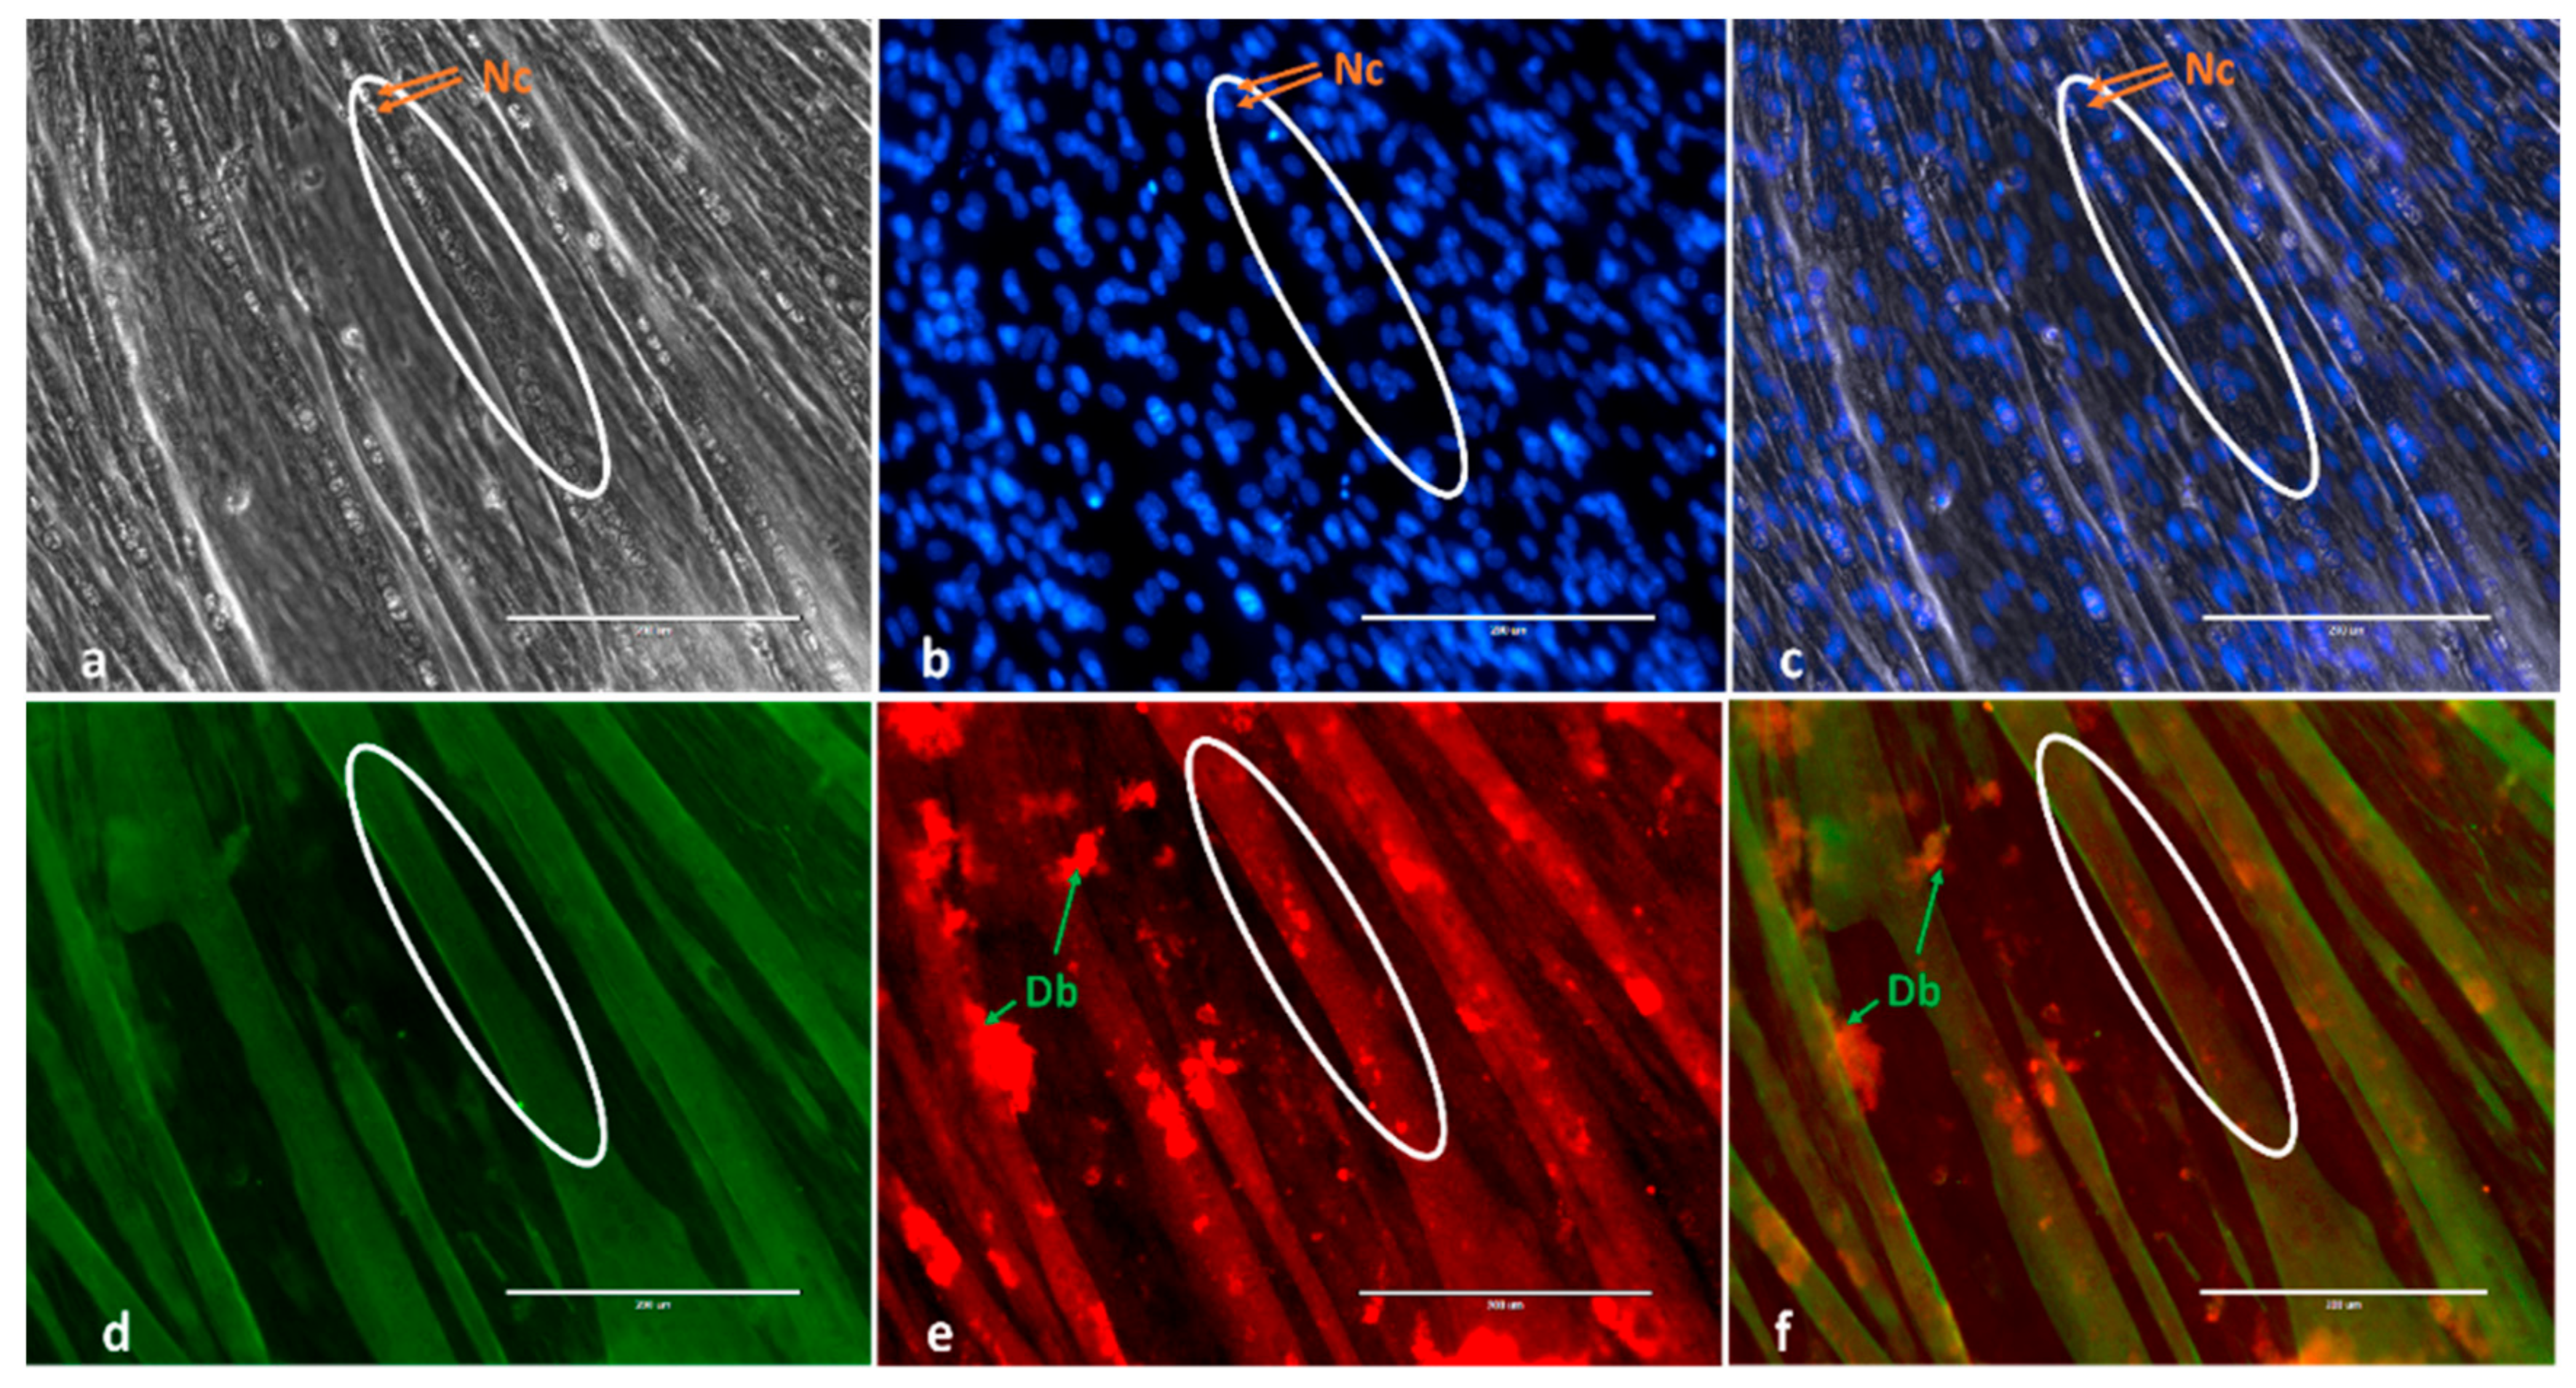
4.3. Immunofluorescence, Mytube Formation and Fusion Parameters
4.4. Transcriptome Analyses
4.4.1. RNA Extraction
4.4.2. Real Time Quantitative PCR
4.4.3. Next Generation Sequencing (NGS) Using Illumina HiSeq 2500 RNA-seq
4.5. Statistical Analyses
Supplementary Materials
Author Contributions
Funding
Conflicts of Interest
Abbreviation
| Akt1 | serine/threonine kinase 1 |
| BSA | bovine serum albumin |
| DAPI | 4′,6-diamidino-2-phenylindole |
| DMEM | Dulbecco’s modified eagle medium |
| DEG | digital expression of genes |
| E2 | 17β-estradiol |
| EPA | eicosapentaenoic acid |
| Erα | E2 receptor alpha |
| Erβ | E2 receptor beta |
| ERT | estrogen-based hormone replacement therapy |
| FBS | foetal bovine serum |
| FC | fold change |
| FDR | false discovery |
| GO | gene ontology |
| GFC | gene functional category |
| Gpr30 | G protein-coupled estrogen receptor-30 |
| h | hour |
| HRT | hormone replacement therapy |
| HS | horse serum |
| Mapk11 | mitogen-activated protein kinase 11 |
| Mrfs | myogenic regulatory factors |
| MyoD | myoblast determination protein |
| Myh1 | myosin heavy chain 1 |
| Myog | myogenin |
| μL | microliter |
| μM | micromolar |
| nM | nanomolar |
| n-3PUFA | 3n polyunsaturated fatty acids |
| NGS | next generation sequencing |
| PE | pathway enrichment |
| Pen/Strep | penicillin/streptomycin |
| qPCR | quantitative polymerase chain reaction |
| RNA | ribosomal nucleic acid |
| SCs | satellite cells |
| Tmem8c | transmembrane protein 8C |
References
- Dumont, N.A.; Bentzinger, C.F.; Sincennes, M.C.; Rudnicki, M.A. Satellite Cells and Skeletal Muscle Regeneration. Compr. Physiol. 2015, 5, 1027–1059. [Google Scholar] [CrossRef] [PubMed]
- Hernandez-Hernandez, J.M.; Garcia-Gonzalez, E.G.; Brun, C.E.; Rudnicki, M.A. The myogenic regulatory factors, determinants of muscle development, cell identity and regeneration. Semin. Cell Dev. Biol. 2017, 72, 10–18. [Google Scholar] [CrossRef] [PubMed]
- Zammit, P.S. Function of the myogenic regulatory factors Myf5, MyoD, Myogenin and MRF4 in skeletal muscle, satellite cells and regenerative myogenesis. Semin. Cell Dev. Biol. 2017, 72, 19–32. [Google Scholar] [CrossRef] [PubMed]
- McKenna, C.; Fry, C. Altered satellite cell dynamics accompany skeletal muscle atrophy during chronic. Curr. Opin. Clin. Nutr. Metab. Care 2017, 20, 447–452. [Google Scholar] [CrossRef]
- Laakkonen, E.K.; Soliymani, R.; Karvinen, S.; Kaprio, J.; Kujala, U.M.; Baumann, M.; Sipila, S.; Kovanen, V.; Lalowski, M. Estrogenic regulation of skeletal muscle proteome: a study of premenopausal women and postmenopausal MZ cotwins discordant for hormonal therapy. Aging Cell 2017, 16, 1276–1287. [Google Scholar] [CrossRef]
- Qaisar, R.; Renaud, G.; Hedstrom, Y.; Pöllänen, E.; Ronkainen, P.; Kaprio, J.; Alen, M.; Sipilä, S.; Artemenko, K.; Bergquist, J. Hormone replacement therapy improves contractile function and myonuclear organization of single muscle fibres from postmenopausal monozygotic female twin pairs. J. Physiol. 2013, 591, 2333–2344. [Google Scholar] [CrossRef]
- Tiidus, P.M.; Lowe, D.A.; Brown, M. Estrogen replacement and skeletal muscle: mechanisms and population health. J. Appl. Physiol. 2013, 115, 569–578. [Google Scholar] [CrossRef]
- Toivonen, M.H.; Pöllänen, E.; Ahtiainen, M.; Suominen, H.; Taaffe, D.R.; Cheng, S.; Takala, T.; Kujala, U.M.; Tammi, M.I.; Sipilä, S. OGT and OGA expression in postmenopausal skeletal muscle associates with hormone replacement therapy and muscle cross-sectional area. Exp. Gerontol. 2013, 48, 1501–1504. [Google Scholar] [CrossRef] [Green Version]
- Mohseni, R.; Aliakbar, S.; Abdollahi, A.; Yekaninejad, M.S.; Maghbooli, Z.; Mirzaei, K. Relationship between major dietary patterns and sarcopenia among menopausal women. Aging Clin. Exp. Res. 2017, 29, 1241–1248. [Google Scholar] [CrossRef]
- Dupont, J.; Dedeyne, L.; Dalle, S.; Koppo, K.; Gielen, E. The role of omega-3 in the prevention and treatment of sarcopenia. Aging Clin Exp Res 2019, 31, 825–836. [Google Scholar] [CrossRef] [Green Version]
- Rodacki, C.L.; Rodacki, A.L.; Pereira, G.; Naliwaiko, K.; Coelho, I.; Pequito, D.; Fernandes, L.C. Fish-oil supplementation enhances the effects of strength training in elderly women. Am. J. Clin. Nutr. 2012, 95, 428–436. [Google Scholar] [CrossRef] [PubMed]
- Berio, E.; Divari, S.; Cucuzza, L.S.; Biolatti, B.; Cannizzo, F.T. 17β-estradiol upregulates oxytocin and the oxytocin receptor in C2C12 myotubes. PeerJ 2017, 5, e3124. [Google Scholar] [CrossRef] [PubMed] [Green Version]
- Galluzzo, P.; Rastelli, C.; Bulzomi, P.; Acconcia, F.; Pallottini, V.; Marino, M. 17β-Estradiol regulates the first steps of skeletal muscle cell differentiation via ER-α-mediated signals. Am. J. Physiol.-Cell Physiol. 2009, 297, C1249–C1262. [Google Scholar] [CrossRef]
- Magee, P.; Pearson, S.; Allen, J. The omega-3 fatty acid, eicosapentaenoic acid (EPA), prevents the damaging effects of tumour necrosis factor (TNF)-alpha during murine skeletal muscle cell differentiation. Lipids Health Dis. 2008, 7, 24. [Google Scholar] [CrossRef] [PubMed] [Green Version]
- Murray, J.; Huss, J.M. Estrogen-related receptor α regulates skeletal myocyte differentiation via modulation of the ERK MAP kinase pathway. Am. J. Physiol.-Cell Physiol. 2011, 301, C630–C645. [Google Scholar] [CrossRef] [PubMed] [Green Version]
- Saini, A.; Sharples, A.P.; Al-Shanti, N.; Stewart, C.E. Omega-3 fatty acid EPA improves regenerative capacity of mouse skeletal muscle cells exposed to saturated fat and inflammation. Biogerontology 2017, 18, 109–129. [Google Scholar] [CrossRef] [Green Version]
- Ghnaimawi, S.; Shelby, S.; Baum, J.; Huang, Y. Effects of eicosapentaenoic acid and docosahexaenoic acid on C2C12 cell adipogenesis and inhibition of myotube formation. Anim. Cells Syst. 2019, 23, 355–364. [Google Scholar] [CrossRef] [Green Version]
- Go, G.-Y.; Lee, S.-J.; Jo, A.; Lee, J.-R.; Kang, J.-S.; Yang, M.; Bae, G.-U. Bisphenol A and estradiol impede myoblast differentiation through down-regulating Akt signaling pathway. Toxicol. Lett. 2018, 292, 12–19. [Google Scholar] [CrossRef]
- Hsueh, T.-Y.; Baum, J.I.; Huang, Y. Effect of eicosapentaenoic acid and docosahexaenoic acid on myogenesis and mitochondrial biosynthesis during murine skeletal muscle cell differentiation. Front. Nutr. 2018, 5, 15. [Google Scholar] [CrossRef] [Green Version]
- Ogawa, M.; Yamaji, R.; Higashimura, Y.; Harada, N.; Ashida, H.; Nakano, Y.; Inui, H. 17β-estradiol represses myogenic differentiation by increasing ubiquitin-specific peptidase 19 through estrogen receptor α. J. Biol. Chem. 2011, 286, 41455–41465. [Google Scholar] [CrossRef] [Green Version]
- Peng, Y.; Zheng, Y.; Zhang, Y.; Zhao, J.; Chang, F.; Lu, T.; Zhang, R.; Li, Q.; Hu, X.; Li, N. Different effects of omega-3 fatty acids on the cell cycle in C2C12 myoblast proliferation. Mol. Cell. Biochem. 2012, 367, 165–173. [Google Scholar] [CrossRef] [PubMed]
- Zhang, J.; Xu, X.; Liu, Y.; Zhang, L.; Odle, J.; Lin, X.; Zhu, H.; Wang, X.; Liu, Y. EPA and DHA Inhibit Myogenesis and Downregulate the Expression of Muscle-related Genes in C2C12 Myoblasts. Genes 2019, 10, 64. [Google Scholar] [CrossRef] [PubMed] [Green Version]
- Hatae, J.; Takami, N.; Lin, H.; Honda, A.; Inoue, R. 17β-Estradiol-induced enhancement of estrogen receptor biosynthesis via MAPK pathway in mouse skeletal muscle myoblasts. J. Physiol. Sci. 2009, 59, 181–190. [Google Scholar] [CrossRef] [PubMed]
- Stark, K.D.; Holub, B.J. Differential eicosapentaenoic acid elevations and altered cardiovascular disease risk factor responses after supplementation with docosahexaenoic acid in postmenopausal women receiving and not receiving hormone replacement therapy. Am. J. Clin. Nutr. 2004, 79, 765–773. [Google Scholar] [CrossRef] [PubMed] [Green Version]
- Stark, K.D.; Park, E.J.; Maines, V.A.; Holub, B.J. Effect of a fish-oil concentrate on serum lipids in postmenopausal women receiving and not receiving hormone replacement therapy in a placebo-controlled, double-blind trial. Am. J. Clin. Nutr. 2000, 72, 389–394. [Google Scholar] [CrossRef] [PubMed]
- Wander, R.C.; Du, S.-H.; Ketchum, S.O.; Rowe, K.E. Effects of interaction of RRR-alpha-tocopheryl acetate and fish oil on low-density-lipoprotein oxidation in postmenopausal women with and without hormone-replacement therapy. Am. J. Clin. Nutr. 1996, 63, 184–193. [Google Scholar] [CrossRef] [Green Version]
- Chen, Y.; Stegaev, V.; Kouri, V.P.; Sillat, T.; Chazot, P.L.; Stark, H.; Wen, J.G.; Konttinen, Y.T. Identification of histamine receptor subtypes in skeletal myogenesis. Mol. Med. Rep. 2015, 11, 2624–2630. [Google Scholar] [CrossRef] [Green Version]
- Henderson, C.A.; Gomez, C.G.; Novak, S.M.; Mi-Mi, L.; Gregorio, C.C. Overview of the muscle cytoskeleton. Compr. Physiol. 2017, 7, 891–944. [Google Scholar]
- Passey, S.L.; Bozinovski, S.; Vlahos, R.; Anderson, G.P.; Hansen, M.J. Serum amyloid A induces Toll-like receptor 2-dependent inflammatory cytokine expression and atrophy in C2C12 skeletal muscle myotubes. PLoS ONE 2016, 11, e0146882. [Google Scholar] [CrossRef]
- Rall, J.A. What makes skeletal muscle striated? Discoveries in the endosarcomeric and exosarcomeric cytoskeleton. Adv. Physiol. Educ. 2018, 42, 672–684. [Google Scholar] [CrossRef]
- Lee, E.J.; Nam, J.H.; Choi, I. Fibromodulin modulates myoblast differentiation by controlling calcium channel. Biochem. Biophys. Res. Commun. 2018, 503, 580–585. [Google Scholar] [CrossRef] [PubMed]
- Taetzsch, T.; Tenga, M.J.; Valdez, G. Muscle fibers secrete FGFBP1 to slow degeneration of neuromuscular synapses during aging and progression of ALS. J. Neurosci. 2017, 37, 70–82. [Google Scholar] [CrossRef] [PubMed] [Green Version]
- Liu, Z.; Wang, C.; Liu, X.; Kuang, S. Shisa2 regulates the fusion of muscle progenitors. Stem Cell Res. 2018, 31, 31–41. [Google Scholar] [CrossRef] [PubMed]
- Runfola, V.; Sebastian, S.; Dilworth, F.J.; Gabellini, D. Rbfox proteins regulate tissue-specific alternative splicing of Mef2D required for muscle differentiation. J. Cell Sci. 2015, 128, 631–637. [Google Scholar] [CrossRef] [PubMed] [Green Version]
- Lei, H.; Sun, Y.; Luo, Z.; Yourek, G.; Gui, H.; Yang, Y.; Su, D.-F.; Liu, X. Fatigue-induced orosomucoid 1 acts on CC chemokine receptor type 5 to enhance muscle endurance. Sci. Rep. 2016, 6, 18839. [Google Scholar] [CrossRef] [Green Version]
- Shimba, S.; Wada, T.; Hara, S.; Tezuka, M. EPAS1 promotes adipose differentiation in 3T3-L1 cells. J. Biol. Chem. 2004, 279, 40946–40953. [Google Scholar] [CrossRef] [Green Version]
- Rebalka, I.A.; Monaco, C.M.; Varah, N.E.; Berger, T.; D’souza, D.M.; Zhou, S.; Mak, T.W.; Hawke, T.J. Loss of the adipokine lipocalin-2 impairs satellite cell activation and skeletal muscle regeneration. Am. J. Physiol.-Cell Physiol. 2018, 315, C714–C721. [Google Scholar] [CrossRef]
- Maffei, M.; Barone, I.; Scabia, G.; Santini, F. The multifaceted haptoglobin in the context of adipose tissue and metabolism. Endocr. Rev. 2016, 37, 403–416. [Google Scholar] [CrossRef] [Green Version]
- Brandt, A.; Kania, J.; Reinholt, B.; Johnson, S. Human IL6 stimulates bovine satellite cell proliferation through a signal transducer and activator of transcription 3 (STAT3)-dependent mechanism. Domest. Anim. Endocrinol. 2018, 62, 32–38. [Google Scholar] [CrossRef]
- Muñoz-Cánoves, P.; Scheele, C.; Pedersen, B.K.; Serrano, A.L. Interleukin-6 myokine signaling in skeletal muscle: a double-edged sword? FEBS J. 2013, 280, 4131–4148. [Google Scholar] [CrossRef]
- Bennett, A.M.; Tonks, N.K. Regulation of distinct stages of skeletal muscle differentiation by mitogen-activated protein kinases. Science 1997, 278, 1288–1291. [Google Scholar] [CrossRef] [PubMed]
- Jones, N.C.; Fedorov, Y.V.; Rosenthal, R.S.; Olwin, B.B. ERK1/2 is required for myoblast proliferation but is dispensable for muscle gene expression and cell fusion. J. Cell. Physiol. 2001, 186, 104–115. [Google Scholar] [CrossRef]
- Millay, D.P.; Sutherland, L.B.; Bassel-Duby, R.; Olson, E.N. Myomaker is essential for muscle regeneration. Genes Dev. 2014, 28, 1641–1646. [Google Scholar] [CrossRef] [PubMed] [Green Version]
- Weiss, A.; Leinwand, L.A. The mammalian myosin heavy chain gene family. Annu. Rev. Cell Dev. Biol. 1996, 12, 417–439. [Google Scholar] [CrossRef] [PubMed]
- Eyster, K.M. The estrogen receptors: an overview from different perspectives. In Estrogen Receptors; Springer: Berlin/Heidelberg, Germany, 2016; pp. 1–10. [Google Scholar]
- Ronda, A.C.; Boland, R.L. Intracellular distribution and involvement of GPR30 in the actions of E2 on C2C12 cells. J. Cell. Biochem. 2016, 117, 793–805. [Google Scholar] [CrossRef] [PubMed]
- Ronda, A.C.; Buitrago, C.; Boland, R. Role of estrogen receptors, PKC and Src in ERK2 and p38 MAPK signaling triggered by 17β-estradiol in skeletal muscle cells. J. Steroid Biochem. Mol. Biol. 2010, 122, 287–294. [Google Scholar] [CrossRef]
- Ronda, A.C.; Vasconsuelo, A.; Boland, R. 17β-estradiol protects mitochondrial functions through extracellular-signal-regulated kinase in C2C12 muscle cells. Cell. Physiol. Biochem. 2013, 32, 1011–1023. [Google Scholar] [CrossRef]
- Cao, W.; Ma, Z.; Rasenick, M.M.; Yeh, S.; Yu, J. N-3 poly-unsaturated fatty acids shift estrogen signaling to inhibit human breast cancer cell growth. PLoS ONE 2012, 7, e52838. [Google Scholar] [CrossRef] [Green Version]
- Brown, L.D. Endocrine regulation of fetal skeletal muscle growth: impact on future metabolic health. J. Endocr. 2014, 221, R13–R29. [Google Scholar] [CrossRef] [Green Version]
- Berkane, N.; Liere, P.; Oudinet, J.-P.; Hertig, A.; Lefèvre, G.; Pluchino, N.; Schumacher, M.; Chabbert-Buffet, N. From pregnancy to preeclampsia: A key role for estrogens. Endocr. Rev. 2017, 38, 123–144. [Google Scholar] [CrossRef]
- Schock, H.; Zeleniuch-Jacquotte, A.; Lundin, E.; Grankvist, K.; Lakso, H.-Å.; Idahl, A.; Lehtinen, M.; Surcel, H.-M.; Fortner, R.T. Hormone concentrations throughout uncomplicated pregnancies: a longitudinal study. BMC Pregnancy Childbirth 2016, 16, 146. [Google Scholar] [CrossRef] [PubMed]
- Kawabata, T.; Kagawa, Y.; Kimura, F.; Miyazawa, T.; Saito, S.; Arima, T.; Nakai, K.; Yaegashi, N. Polyunsaturated Fatty Acid Levels in Maternal Erythrocytes of Japanese Women during Pregnancy and after Childbirth. Nutrients 2017, 9, 245. [Google Scholar] [CrossRef] [PubMed] [Green Version]
- Coletta, J.M.; Bell, S.J.; Roman, A.S. Omega-3 fatty acids and pregnancy. Rev. Obstet. Gynecol. 2010, 3, 163–171. [Google Scholar] [PubMed]
- Vahdaninia, M.; Mackenzie, H.; Dean, T.; Helps, S. The effectiveness of omega-3 polyunsaturated fatty acid interventions during pregnancy on obesity measures in the offspring: an up-to-date systematic review and meta-analysis. Eur. J. Nutr. 2018. [Google Scholar] [CrossRef] [Green Version]
- Jones, M.L.; Mark, P.J.; Keelan, J.A.; Barden, A.; Mas, E.; Mori, T.A.; Waddell, B.J. Maternal dietary omega-3 fatty acid intake increases resolvin and protectin levels in the rat placenta. J. Lipid Res. 2013, 54, 2247–2254. [Google Scholar] [CrossRef] [Green Version]
- Yaffe, D.; Saxel, O. A myogenic cell line with altered serum requirements for differentiation. Differentiation 1977, 7, 159–166. [Google Scholar] [CrossRef]
- Guo, T.; Liu, W.; Konermann, A.; Gu, Z.; Cao, M.; Ding, Y. Estradiol modulates the expression pattern of myosin heavy chain subtypes via an ERalpha-mediated pathway in muscle-derived tissues and satellite cells. Cell. Physiol. Biochem. 2014, 33, 681–691. [Google Scholar] [CrossRef]
- Saiti, D.; Lacham-Kaplan, O. Density gradients for the isolation of germ cells from embryoid bodies. Reprod. Biomed. Online 2008, 16, 730–740. [Google Scholar] [CrossRef]
- Huang, D.W.; Sherman, B.T.; Zheng, X.; Yang, J.; Imamichi, T.; Stephens, R.; Lempicki, R.A. Extracting biological meaning from large gene lists with DAVID. Curr. Protoc. Bioinform. 2009, 27, 1–13. [Google Scholar] [CrossRef]
- Fabregat, A.; Sidiropoulos, K.; Viteri, G.; Marin-Garcia, P.; Ping, P.; Stein, L.; D’Eustachio, P.; Hermjakob, H. Reactome diagram viewer: data structures and strategies to boost performance. Bioinformatics 2018, 34, 1208–1214. [Google Scholar] [CrossRef]


| Gene Name | E2 vs. Con-Ve | EPA vs. Cont-Ve | EPA vs. E2 | |||||||
|---|---|---|---|---|---|---|---|---|---|---|
| logFC | p Value | FDR | logFC | p Value | FDR | logFC | p Value | FDR | ||
| Acta1 | actin, alpha 1, skeletal muscle | 0.56 | 0.048 | 0.606 | −2.11 | 1 × 10⁵ | 0.0004 | −2.67 | 1 × 10⁶ | 0.0001 |
| Acta2 | actin, alpha 2, smooth muscle, aorta | 0.35 | 0.034 | 0.566 | −0.328 | 0.045 | 0.1138 | −0.68 | 0.0008 | 0.006 |
| Actc1 | actin, alpha, cardiac muscle 1 | 0.66 | 0.024 | 0.551 | −2.53 | 2 × 10⁶ | 0.0001 | −3.19 | 4 × 10⁷ | 4 × 10⁵ |
| Actg1 | actin, gamma, cytoplasmic 1 | −0.02 | 0.831 | 0.985 | −0.49 | 0.0005 | 0.005 | −0.47 | 0.0006 | 0.005 |
| Actn2 | actinin alpha 2 | 0.92 | 0.001 | 0.364 | −2.29 | 4 × 10⁶ | 0.0002 | −3.22 | 1 × 10⁷ | 2 × 10⁵ |
| Actn3 | actinin alpha 3 | 0.24 | 0.029 | 0.557 | −1.10 | 6 × 10⁶ | 9 × 10⁵ | −1.35 | 1 × 10⁷ | 2 × 10⁵ |
| Actn4 | actinin alpha 4 | 0.05 | 0.352 | 0.886 | −0.36 | 0.0001 | 0.002 | −0.42 | 3 × 10⁵ | 0.0007 |
| Casq2 | calsequestrin 2 | 0.53 | 0.034 | 0.566 | −2.43 | 1 × 10⁶ | 0.0001 | −2.97 | 2 × 10⁷ | 3 × 10⁵ |
| Des | Desmin | 0.03 | 0.705 | 0.977 | −0.52 | 5 × 10⁵ | 0.001 | −0.55 | 10 × 103 | 0.0007 |
| Jsrp1 | junctional sarcoplasmic reticulum protein 1 | 0.17 | 0.325 | 0.877 | −0.69 | 0.001 | 0.014 | −0.86 | 0.0004 | 0.003 |
| Mybpc1 | myosin binding protein C, slow-type | 1.16 | 0.0002 | 0.226 | −1.05 | 0.001 | 0.013 | −2.21 | 3 × 10⁶ | 0.0001 |
| Mybpc2 | myosin binding protein C, fast-type | 0.67 | 0.128 | 0.740 | −2.23 | 0.002 | 0.017 | −2.91 | 0.0003 | 0.003 |
| Myh1 | myosin, heavy polypeptide 1, skeletal muscle, adult | 0.95 | 0.0006 | 0.300 | −2.00 | 2 × 10² | 0.0001 | −2.96 | 9 × 10⁹ | 2 × 10⁵ |
| Myh3 | myosin, heavy polypeptide 3, skeletal muscle, embryonic | 0.60 | 0.016 | 0.529 | −3.21 | 7 × 10⁸ | 3 × 10⁵ | −3.828 | 1 × 10⁸ | 1 × 10⁵ |
| Myh4 | myosin, heavy polypeptide 4, skeletal muscle | 0.99 | 6 × 10⁵ | 0.183 | −0.55 | 0.005 | 0.029 | −1.55 | 1 × 10⁶ | 0.0001 |
| Myh6 | myosin, heavy polypeptide 6, cardiac muscle, alpha | 1.10 | 0.0001 | 0.183 | −1.69 | 2 × 10⁵ | 0.0008 | −2.79 | 2 × 10⁷ | 3 × 10⁵ |
| Myh7 | myosin, heavy polypeptide 7, cardiac muscle, beta | 0.93 | 0.0004 | 0.262 | −1.34 | 0.0005 | 0.006 | −2.15 | 8 × 10⁶ | 0.0002 |
| Myh8 | myosin, heavy polypeptide 8, skeletal muscle, perinatal | 1.18 | 0.0006 | 0.295 | −2.21 | 1 × 10⁵ | 0.0004 | −3.39 | 2 × 10⁷ | 3 × 10⁵ |
| Myl1 | myosin, light polypeptide 1 | 0.50 | 0.035 | 0.566 | −0.83 | 0.002 | 0.016 | −1.34 | 8 × 10⁵ | 0.001 |
| Myl4 | myosin, light polypeptide 4 | 0.61 | 0.047 | 0.604 | −1.74 | 0.0001 | 0.002 | −2.36 | 1 × 10⁵ | 0.0003 |
| Myl9 | myosin, light polypeptide 9, regulatory | 0.09 | 0.661 | 0.971 | −0.90 | 0.002 | 0.016 | −1.00 | 0.001 | 0.008 |
| Myom1 | myomesin 1 | 0.52 | 0.021 | 0.539 | −2.00 | 2 × 10⁶ | 0.0001 | −2.52 | 3 × 10⁷ | 4 × 10⁵ |
| Myom2 | myomesin 2 | 0.17 | 0.138 | 0.754 | −0.86 | 1 × 10⁵ | 0.0005 | −1.03 | 2 × 10⁶ | 0.0001 |
| Neb | Nebulin | 0.40 | 0.036 | 0.566 | −2.02 | 4 × 10⁷ | 8 × 10⁵ | −2.42 | 9 × 10⁸ | 2 × 10⁵ |
| Smpx | small muscle protein, X-linked | 0.49 | 0.047 | 0.604 | −1.67 | 4 × 10⁵ | 0.001 | −2.16 | 4 × 10⁶ | 0.0002 |
| Tcap | titin-cap | 0.87 | 0.031 | 0.561 | −0.59 | 0.169 | 0.285 | −1.47 | 0.003 | 0.015 |
| Tmod1 | tropomodulin 1 | 0.54 | 0.008 | 0.482 | −0.84 | 0.0005 | 0.005 | −1.38 | 1 × 10⁵ | 0.0003 |
| Tnnc1 | troponin C, cardiac/slow skeletal | 0.51 | 0.060 | 0.624 | −1.43 | 0.0002 | 0.003 | −1.94 | 1 × 10⁵ | 0.0004 |
| Tnnc2 | troponin C2, fast | 0.51 | 0.072 | 0.646 | −1.72 | 7 × 10⁵ | 0.001 | −2.23 | 9 × 10⁶ | 0.0003 |
| Tnni1 | troponin I, skeletal, slow 1 | 0.49 | 0.068 | 0.639 | −1.90 | 2 × 10⁵ | 0.0007 | −2.40 | 3 × 10⁶ | 0.0001 |
| Tnni2 | troponin I, skeletal, fast 2 | 0.39 | 0.187 | 0.800 | −1.65 | 0.0001 | 0.003 | −2.05 | 3 × 10⁵ | 0.0007 |
| Tnni3 | troponin I, cardiac 3 | 0.27 | 0.457 | 0.918 | −0.90 | 0.05 | 0.129 | −1.18 | 0.015 | 0.050 |
| Tnnt1 | troponin T1, skeletal, slow | 0.32 | 0.146 | 0.764 | −1.31 | 0.0001 | 0.002 | −1.64 | 1 × 10⁵ | 0.0004 |
| Tnnt2 | troponin T2, cardiac | 0.29 | 0.268 | 0.855 | −1.97 | 2 × 10⁵ | 0.0007 | −2.27 | 7 × 10⁶ | 0.0002 |
| Tnnt3 | troponin T3, skeletal, fast | 0.39 | 0.152 | 0.769 | −1.63 | 0.0001 | 0.001 | −2.025 | 1 × 10⁵ | 0.0004 |
| Tpm1 | tropomyosin 1, alpha | 0.13 | 0.139 | 0.756 | −0.36 | 0.001 | 0.009 | −0.49 | 0.0001 | 0.001 |
| Tpm2 | tropomyosin 2, beta | 0.33 | 0.061 | 0.629 | −0.68 | 0.001 | 0.012 | −1.02 | 8 × 10⁵ | 0.001 |
| Tpm3 | tropomyosin 3, gamma | −0.09 | 0.342 | 0.885 | −0.42 | 0.001 | 0.009 | −0.33 | 0.005 | 0.023 |
| Tpm4 | tropomyosin 4 | −0.08 | 0.299 | 0.868 | −0.14 | 0.072 | 0.157 | −0.06 | 0.38 | 0.506 |
| Ttn | titin | 0.19 | 0.152 | 0.769 | −1.17 | 4 × 10⁶ | 0.0002 | −1.37 | 1 × 10⁶ | 7E-05 |
| Vim | vimetin | 0.09 | 0.419 | 0.904 | −0.03 | 0.728 | 0.810 | −0.13 | 0.258 | 0.381 |
© 2020 by the authors. Licensee MDPI, Basel, Switzerland. This article is an open access article distributed under the terms and conditions of the Creative Commons Attribution (CC BY) license (http://creativecommons.org/licenses/by/4.0/).
Share and Cite
Lacham-Kaplan, O.; Camera, D.M.; Hawley, J.A. Divergent Regulation of Myotube Formation and Gene Expression by E2 and EPA during In-Vitro Differentiation of C2C12 Myoblasts. Int. J. Mol. Sci. 2020, 21, 745. https://0-doi-org.brum.beds.ac.uk/10.3390/ijms21030745
Lacham-Kaplan O, Camera DM, Hawley JA. Divergent Regulation of Myotube Formation and Gene Expression by E2 and EPA during In-Vitro Differentiation of C2C12 Myoblasts. International Journal of Molecular Sciences. 2020; 21(3):745. https://0-doi-org.brum.beds.ac.uk/10.3390/ijms21030745
Chicago/Turabian StyleLacham-Kaplan, Orly, Donny M. Camera, and John A. Hawley. 2020. "Divergent Regulation of Myotube Formation and Gene Expression by E2 and EPA during In-Vitro Differentiation of C2C12 Myoblasts" International Journal of Molecular Sciences 21, no. 3: 745. https://0-doi-org.brum.beds.ac.uk/10.3390/ijms21030745