Inhibition of Bromodomain and Extraterminal Domain (BET) Proteins by JQ1 Unravels a Novel Epigenetic Modulation to Control Lipid Homeostasis

 , , , and
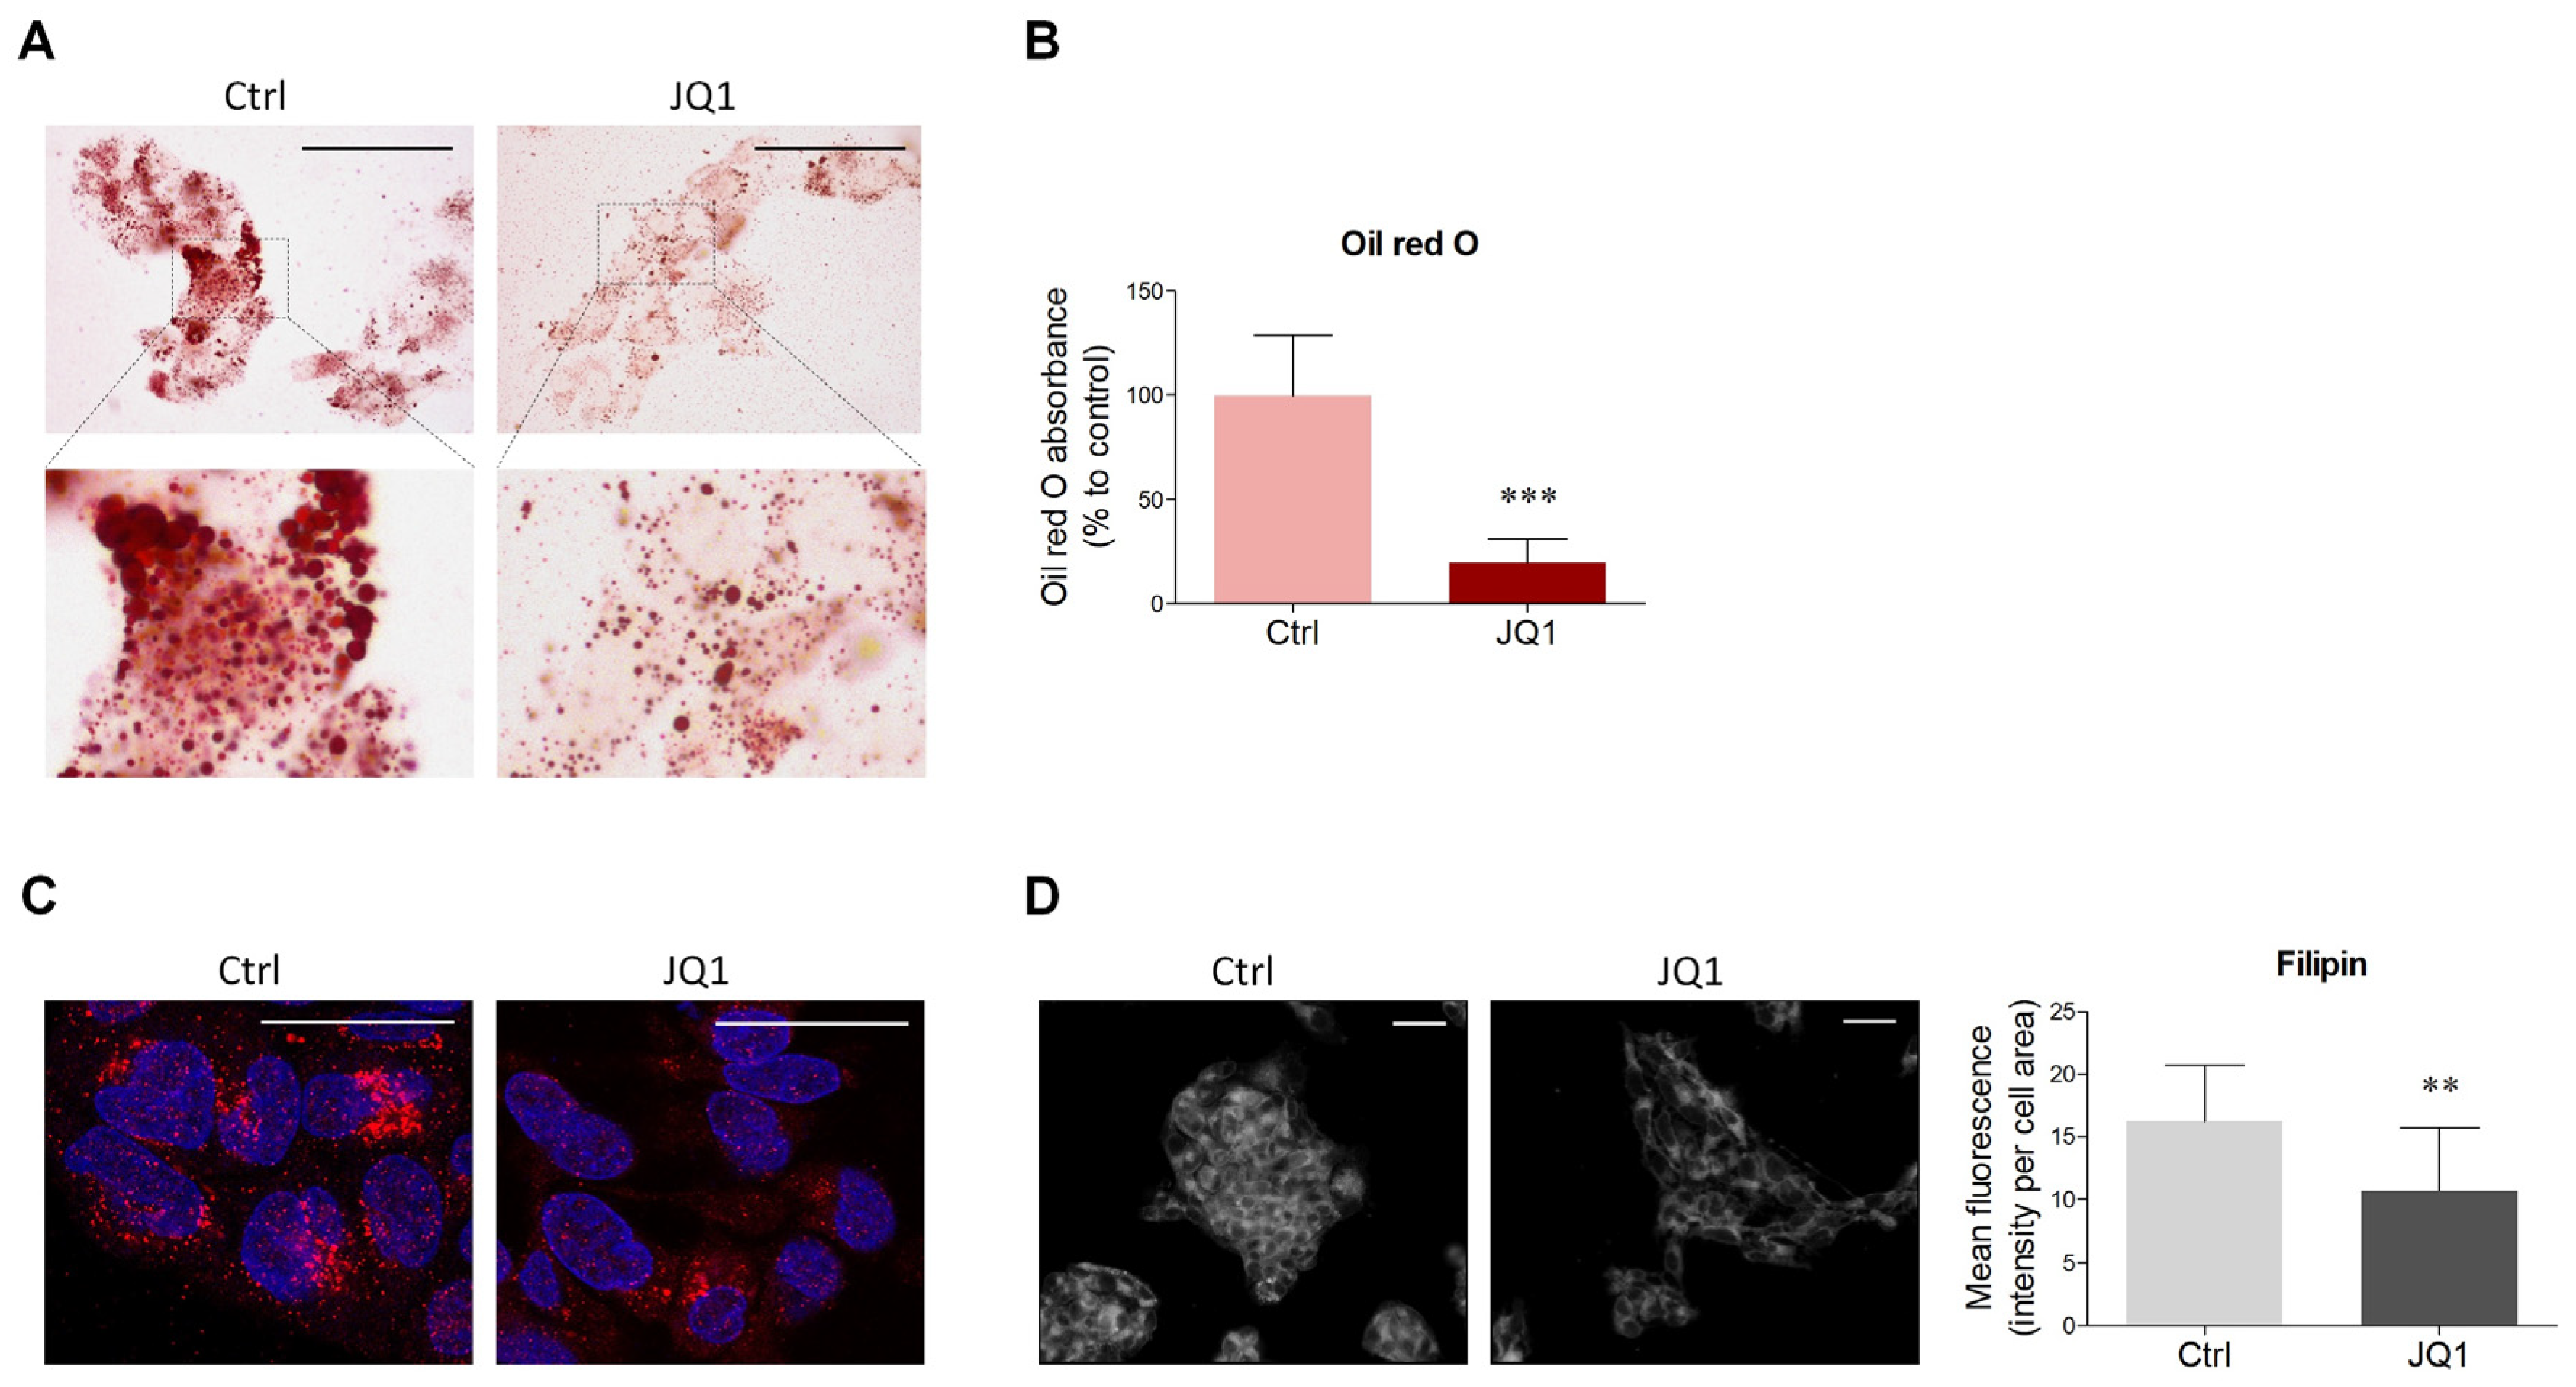
Abstract
:1. Introduction
2. Results
2.1. BET Inhibition Decreases Lipid Content in HepG2 Cells
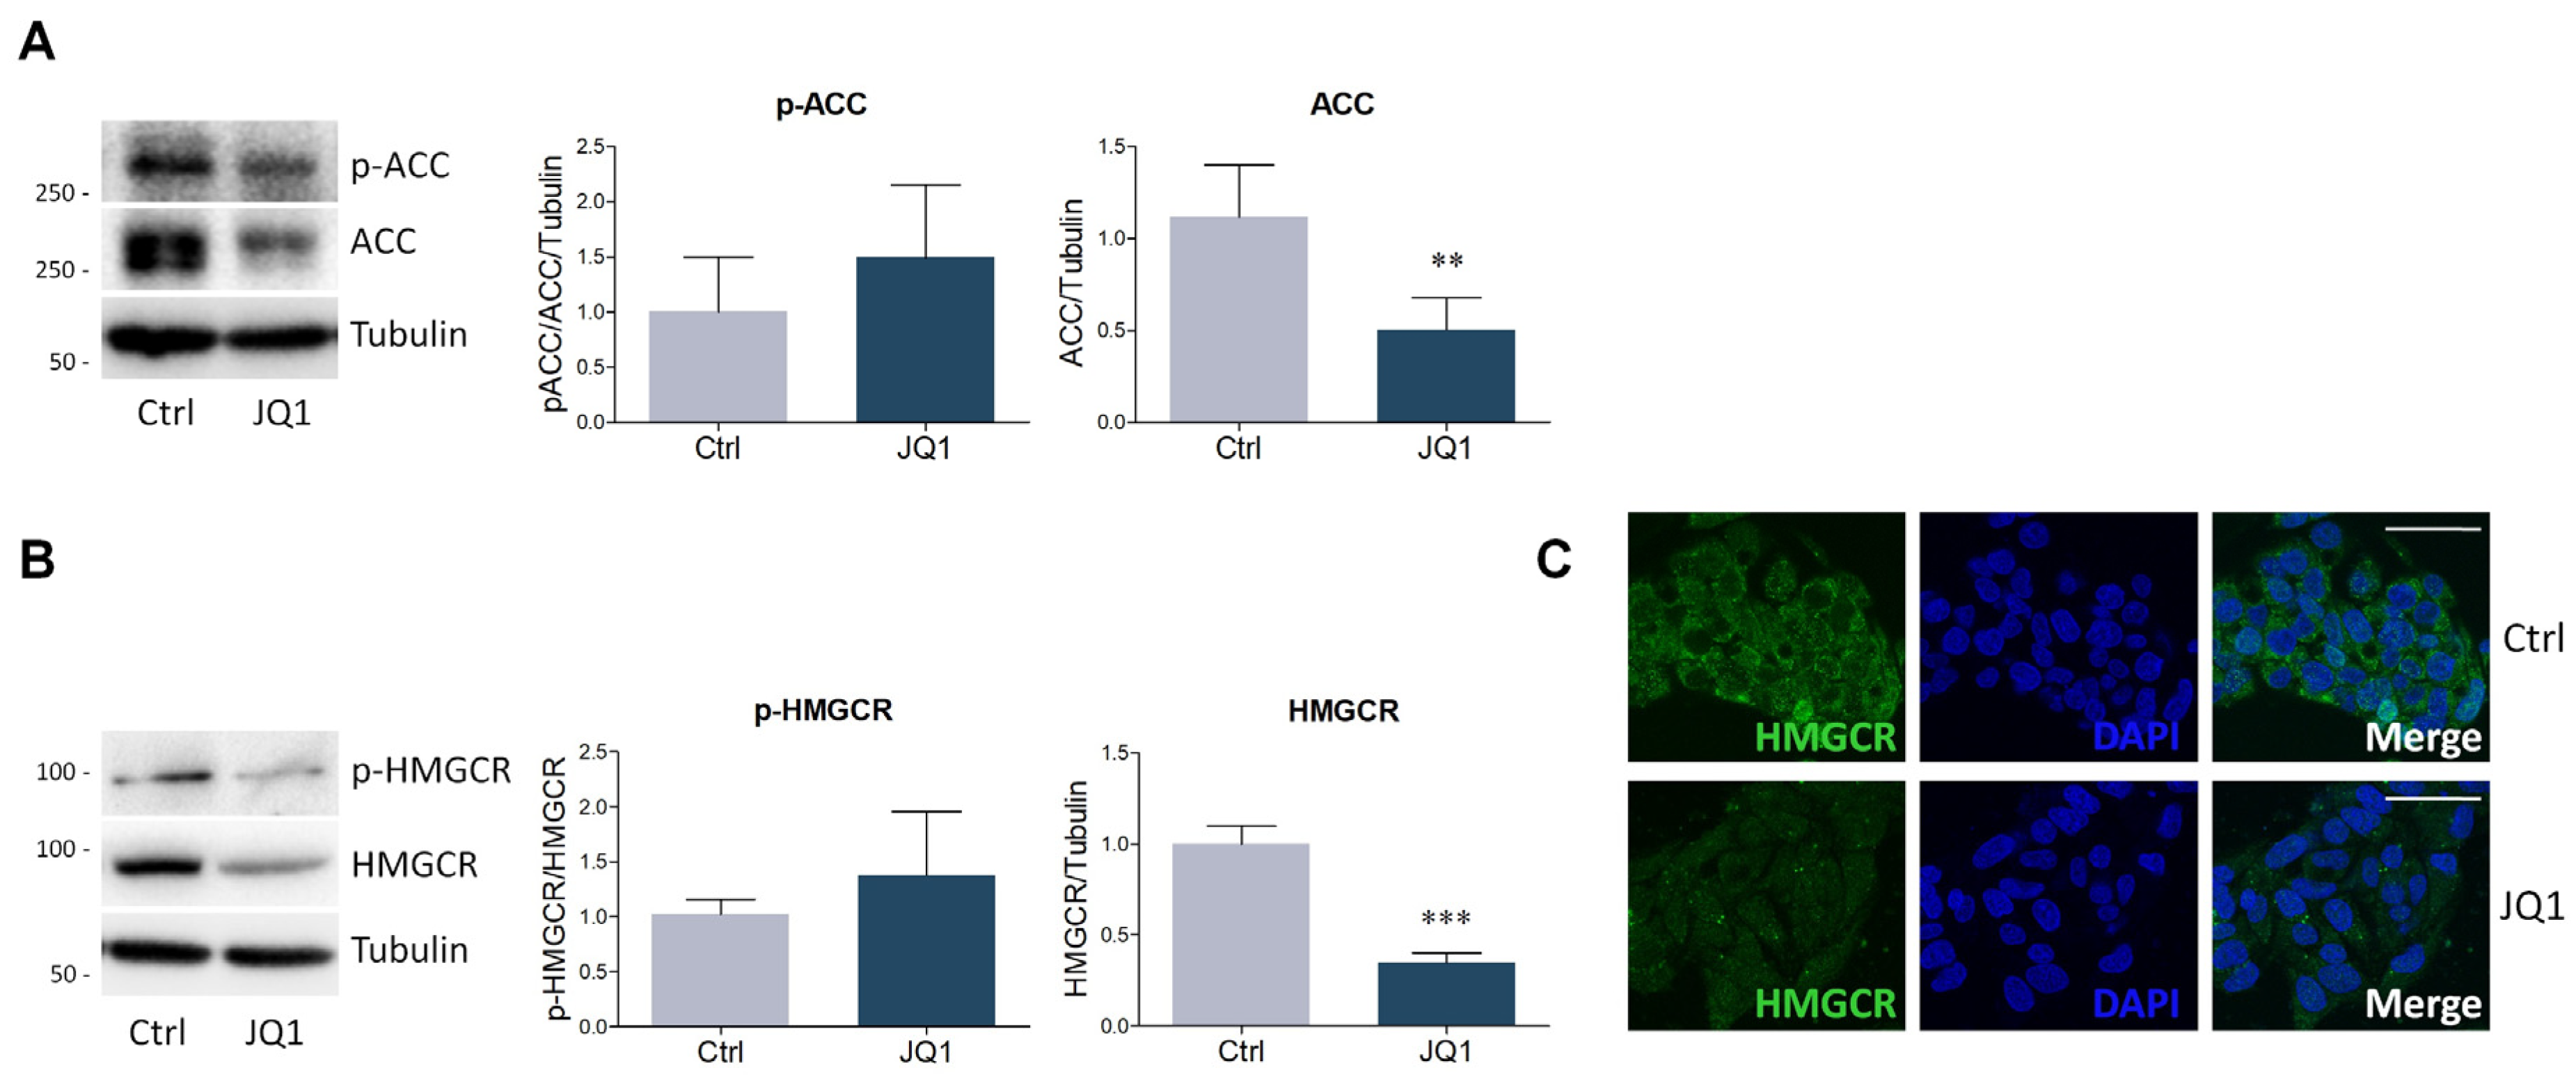
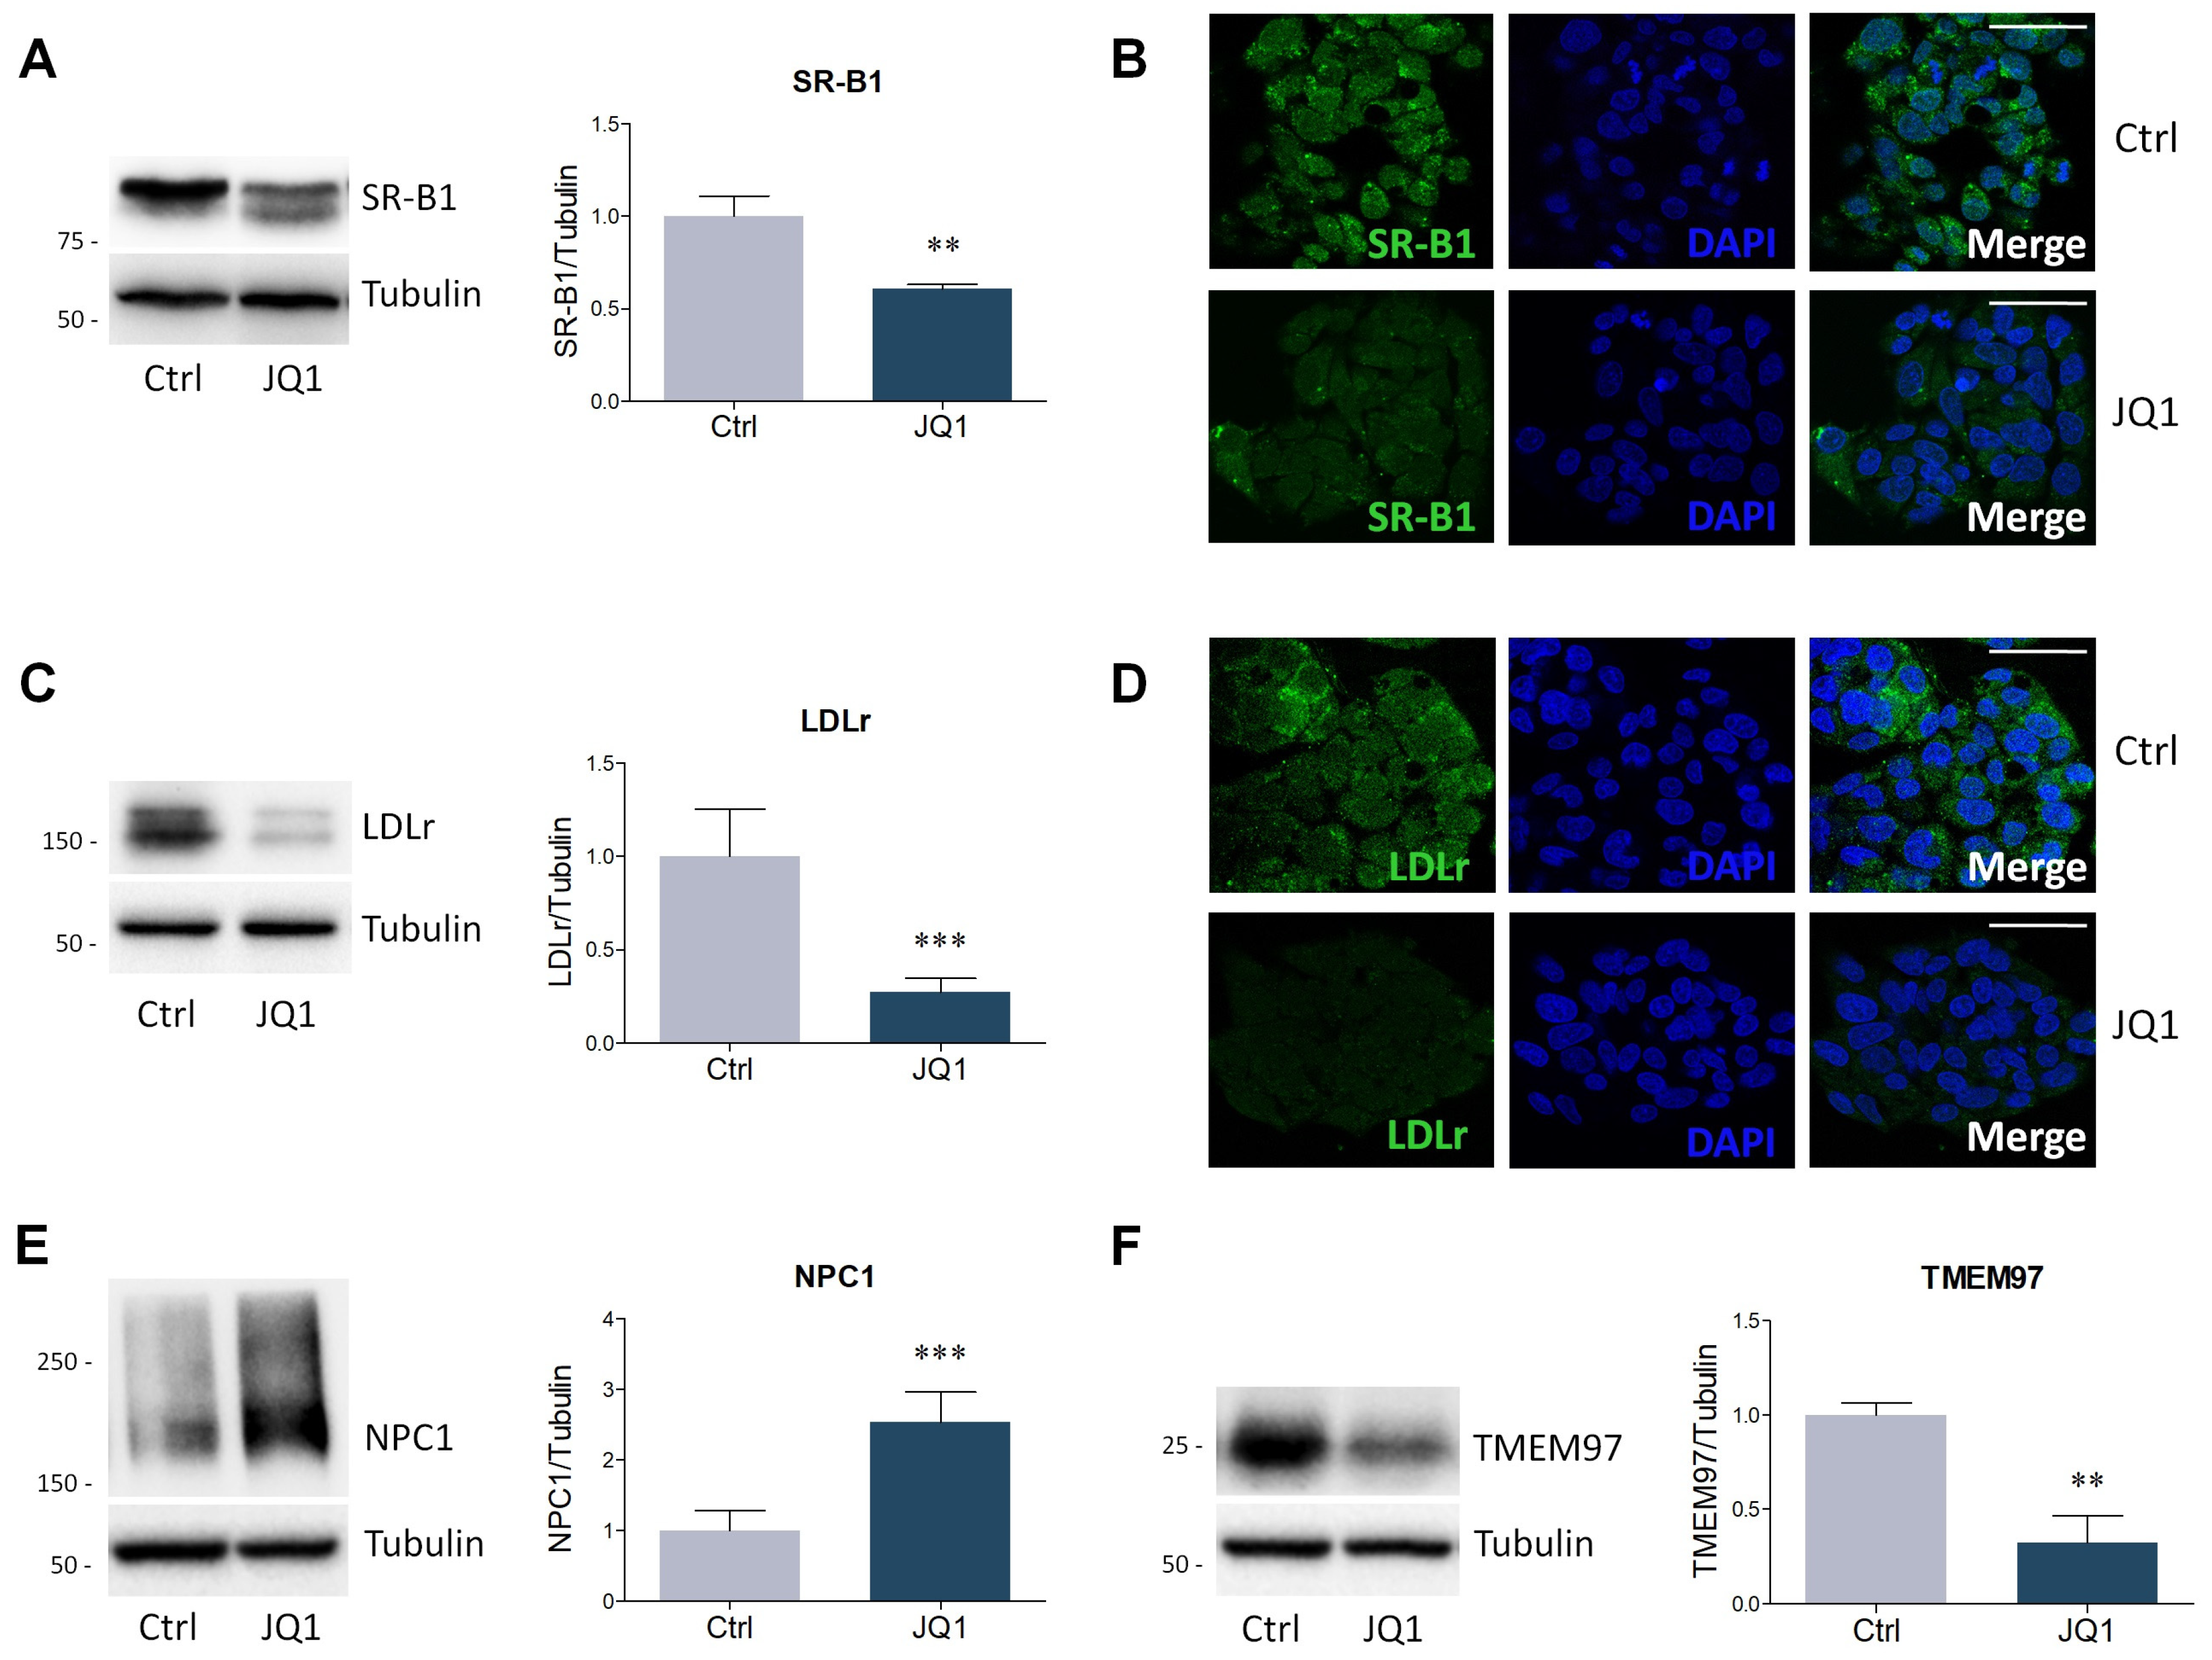
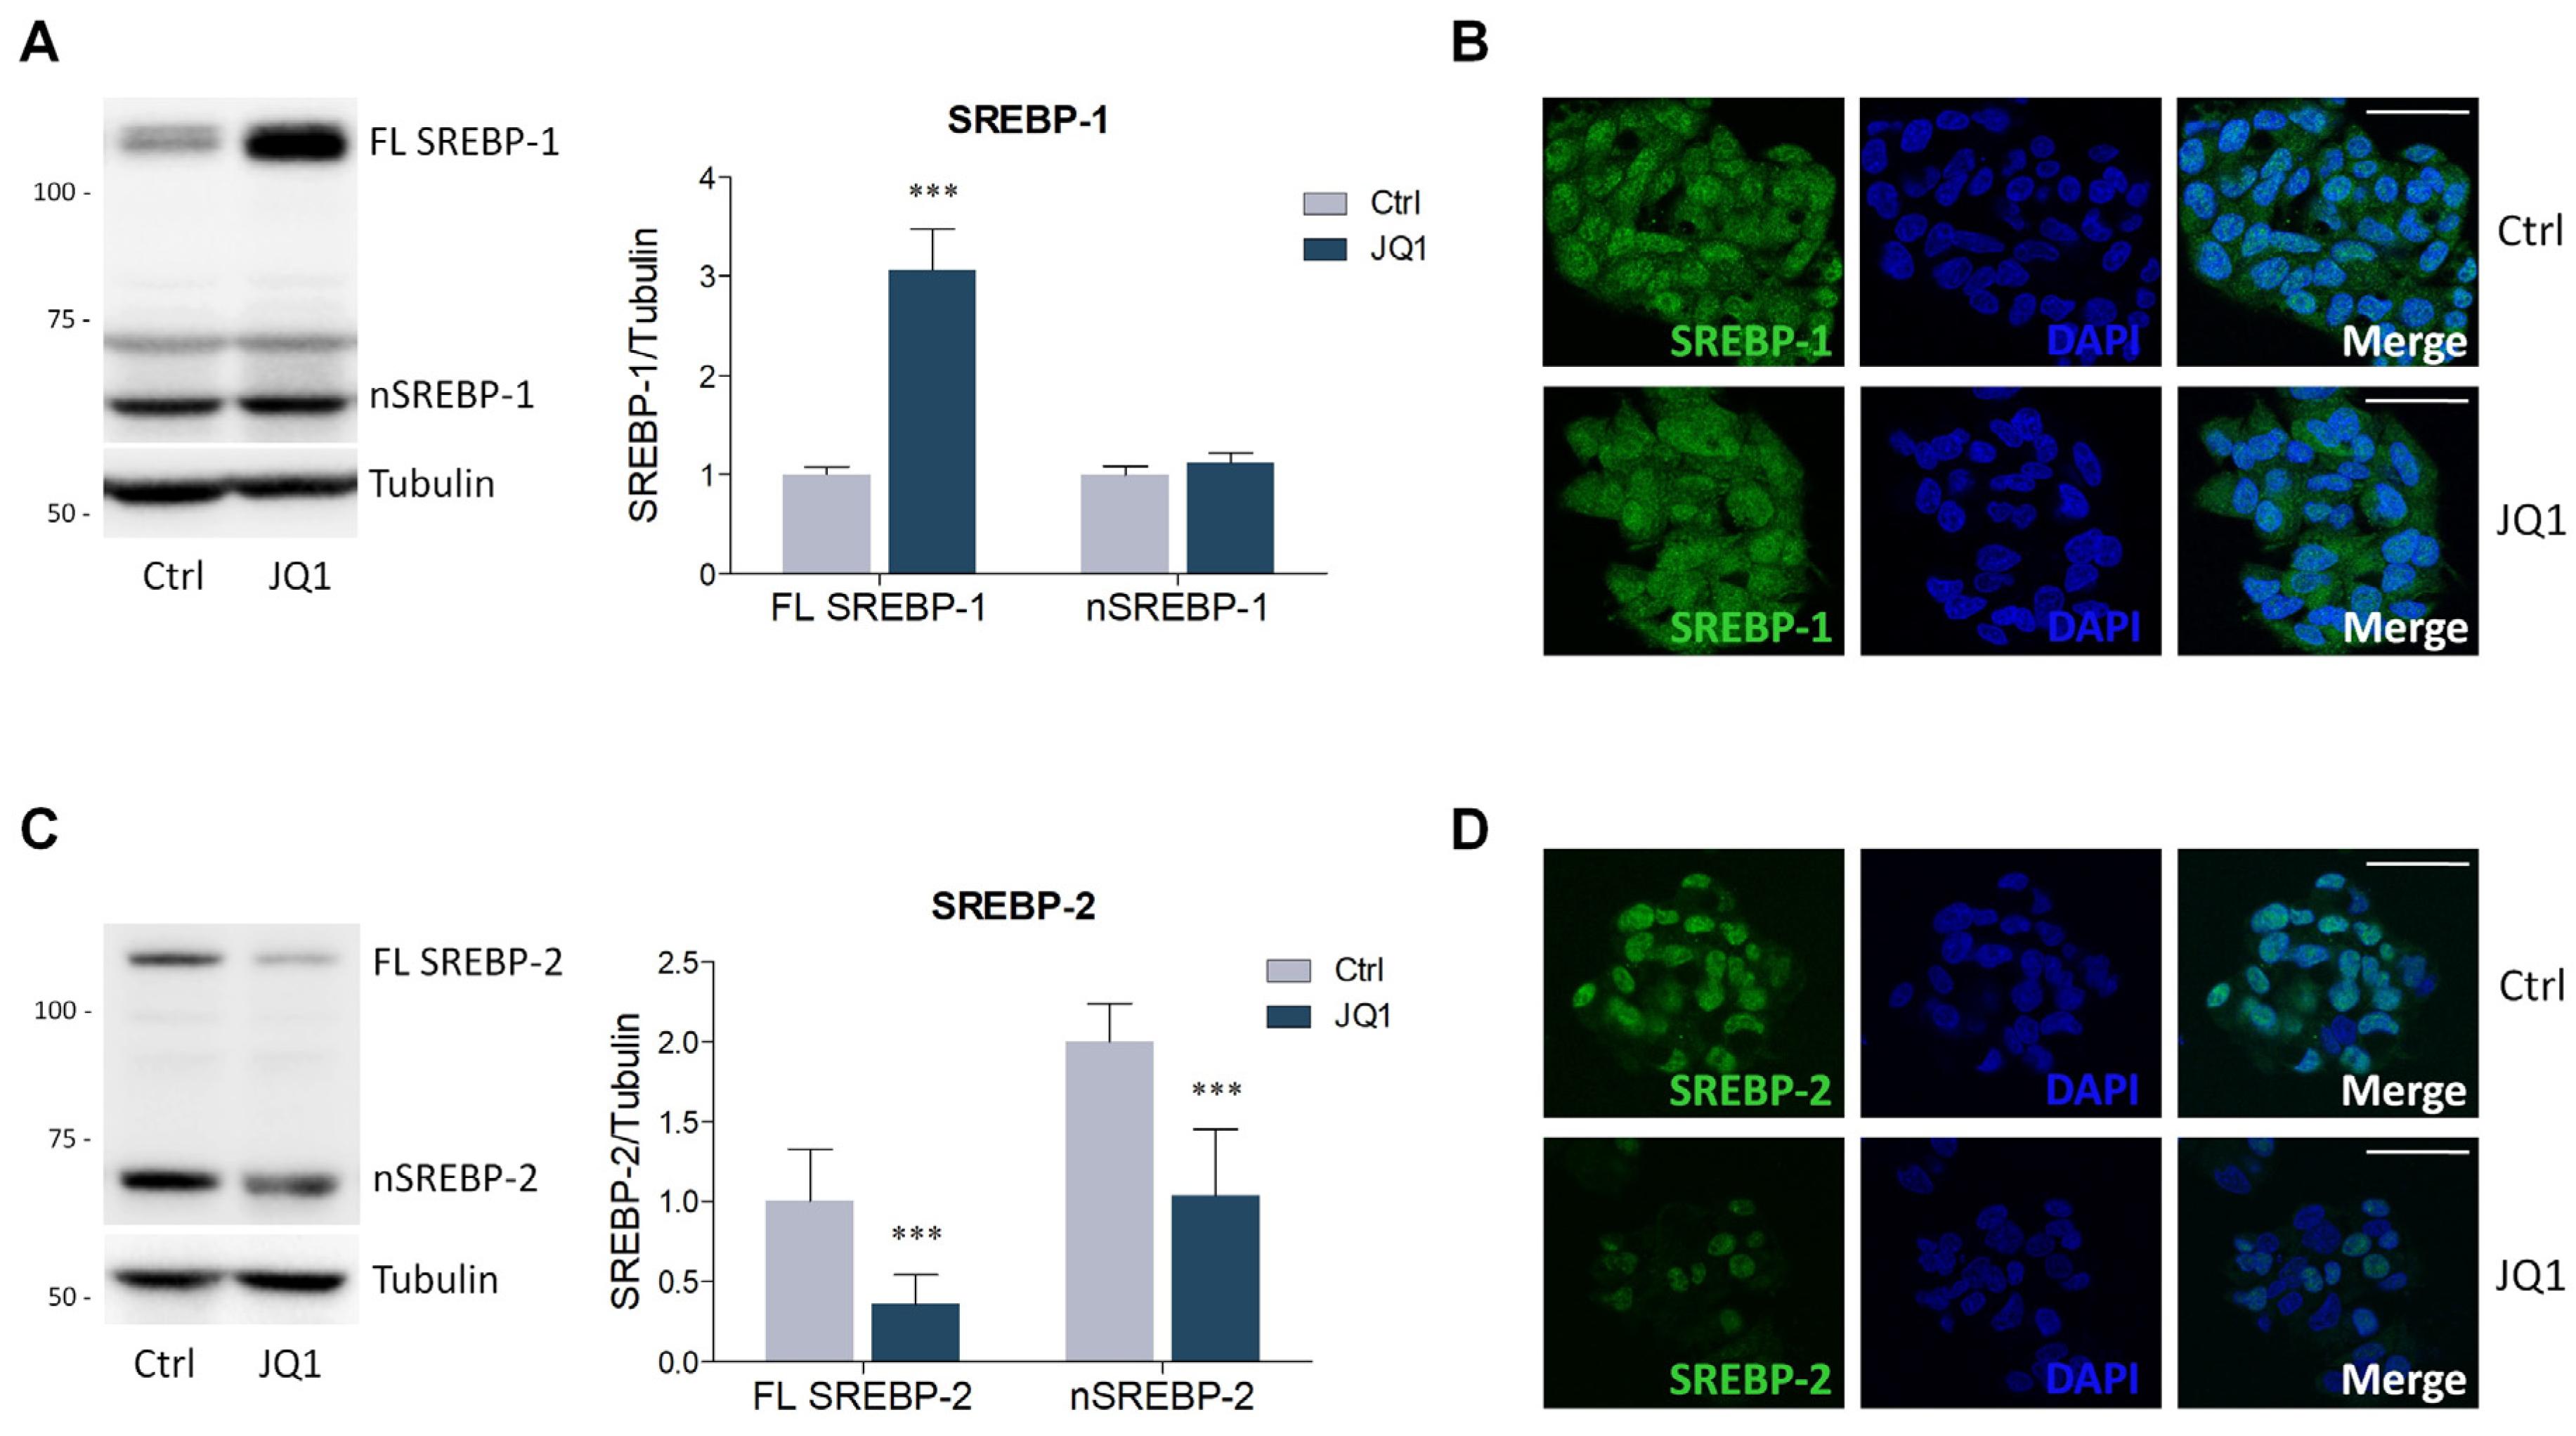
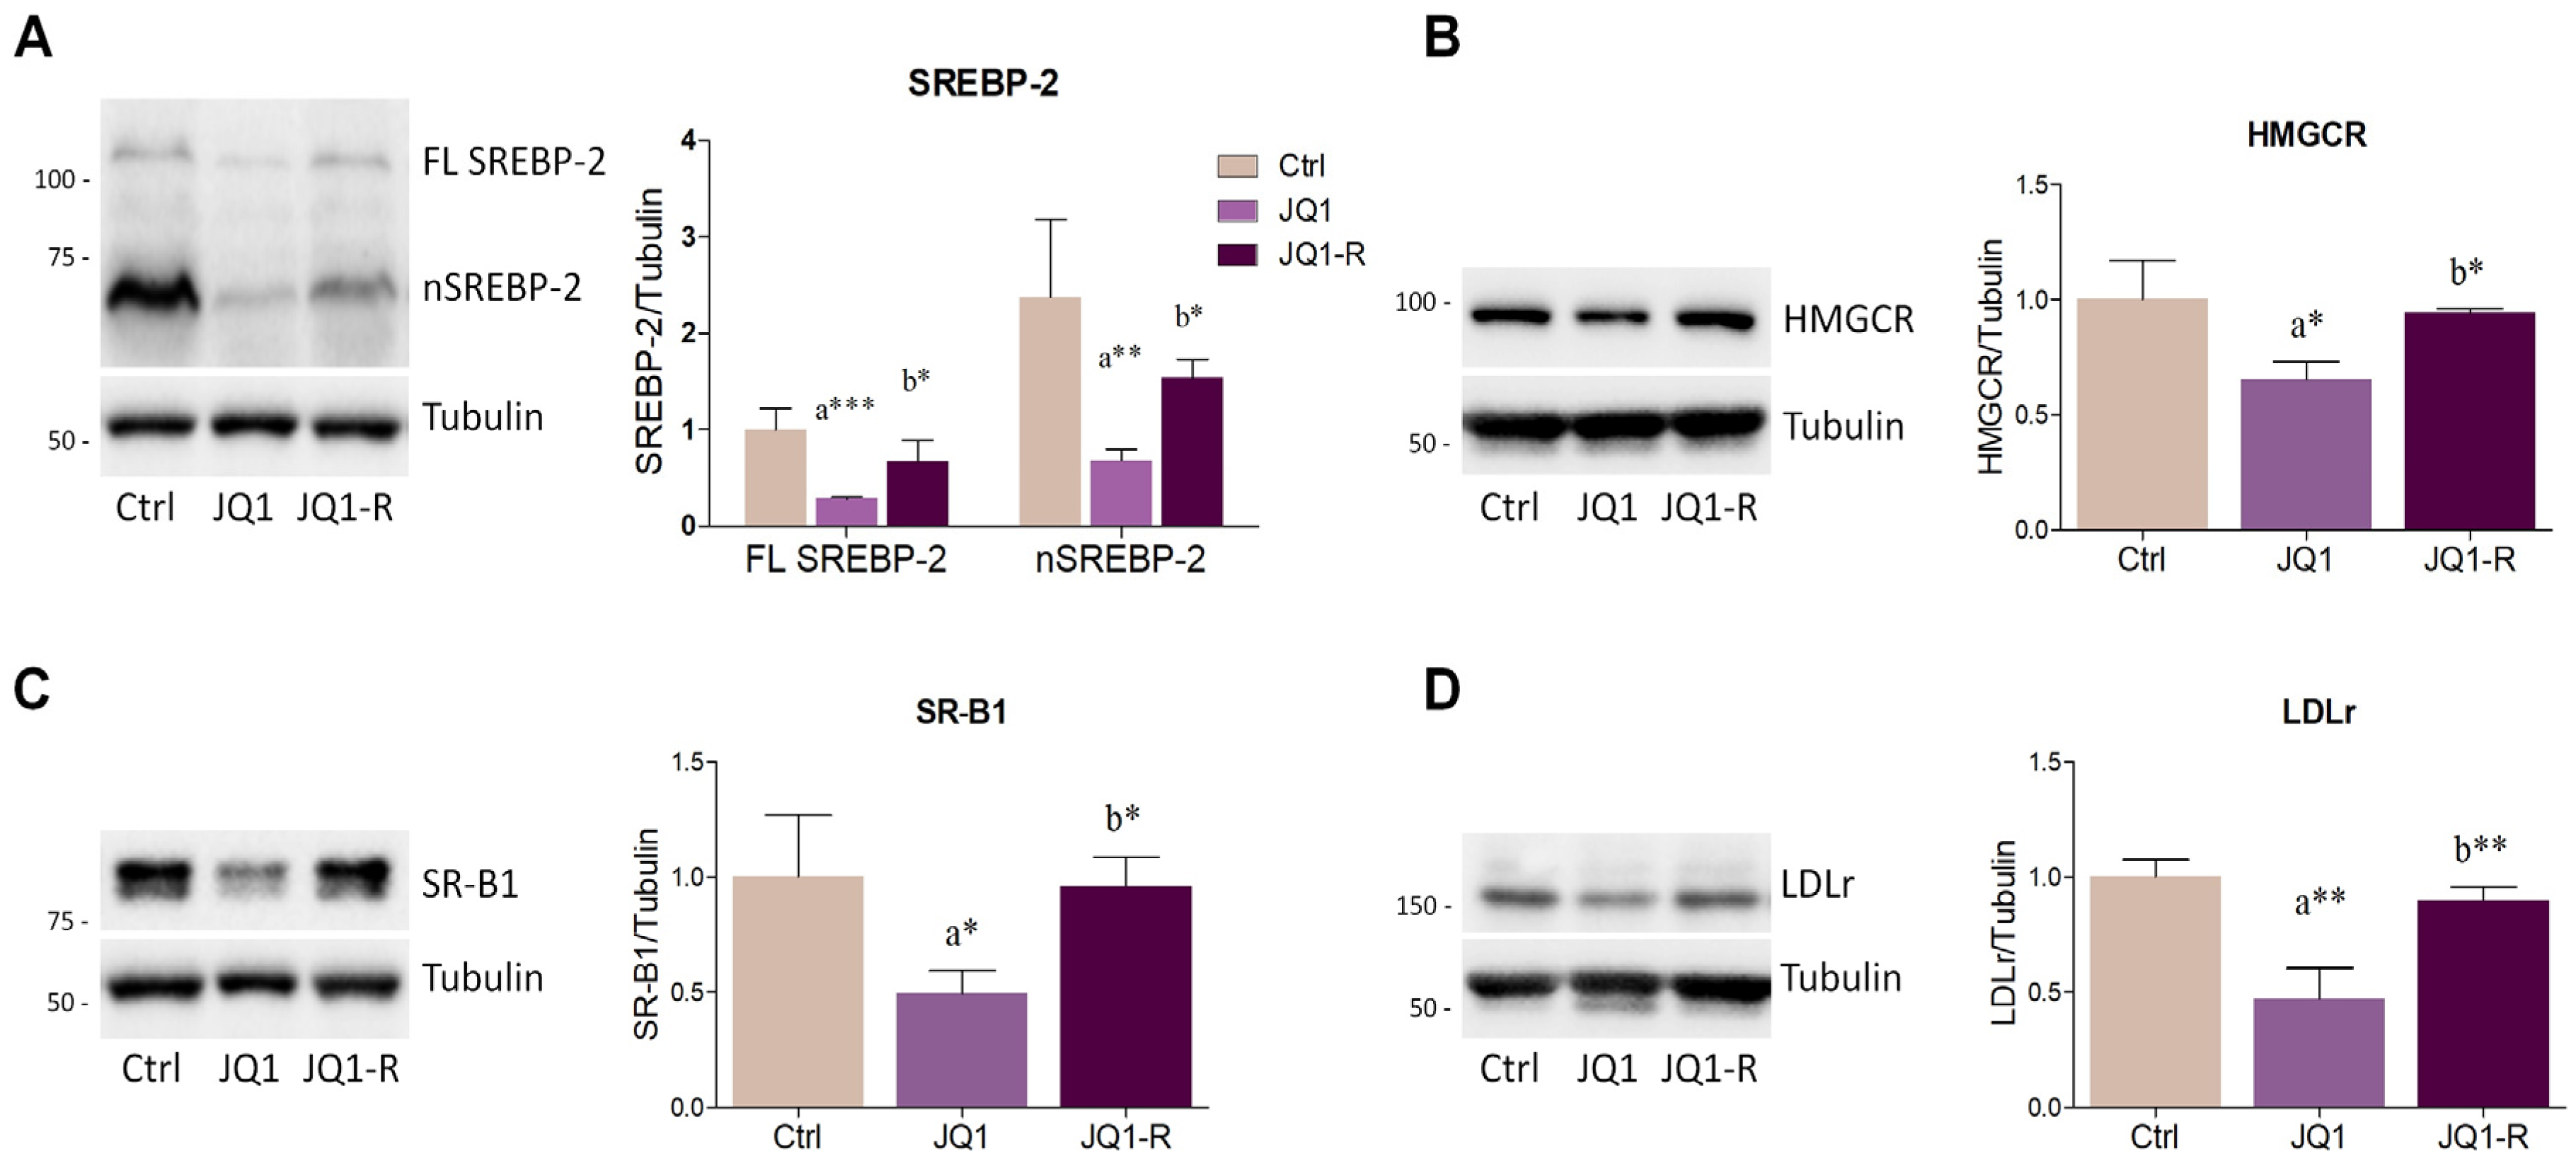
2.2. BET Inhibition by JQ1 Modulates the Expression of Proteins and Enzymes Involved in Lipid Metabolism
2.3. BET Inhibition Affects Cell Proliferation in a Cholesterol-Dependent Manner
3. Discussion
4. Materials and Methods
4.1. Cell Cultures and Generation of HepG2 Resistant to JQ1
4.2. Oil Red O Staining and Quantification
4.3. Filipin Staining
4.4. Lysate Preparation and Western Blot Analysis
4.5. Immunofluorescence Staining
4.6. Statistical Analysis
Author Contributions
Funding
Conflicts of Interest
Abbreviations
| ACC | Acyl Coenzyme A carboxylase |
| BET | Bromodomain and extra-terminal domain |
| HDAC | histone deacetylases |
| HDL | high density lipoprotein |
| HMGCR | 3-hydroxy-3-methylglutaryl Coenzyme A reductase |
| LDL | low density lipoprotein |
| LDLr | low density lipoprotein receptor |
| NPC1 | Niemann-Pick type C1 |
| ROS | reactive oxygen species |
| SR-B1 | scavenger receptor class B type 1 |
| SREBPs | sterol regulatory element binding proteins |
| TMEM97 | transmembrane protein 97 |
References
- Wakil, S.J.; Abu-Elheiga, L.A. Fatty acid metabolism: target for metabolic syndrome. J. Lipid Res. 2009, 50, S138–S143. [Google Scholar] [CrossRef] [Green Version]
- Papackova, Z.; Cahová, M. Fatty Acid Signaling: The New Function of Intracellular Lipases. Int. J. Mol. Sci. 2015, 16, 3831–3855. [Google Scholar] [CrossRef] [Green Version]
- Trapani, L.; Segatto, M.; Pallottini, V. Regulation and deregulation of cholesterol homeostasis: The liver as a metabolic “power station”. World J. Hepatol. 2012, 4, 184–190. [Google Scholar] [CrossRef] [PubMed]
- Chen, H.W. Role of cholesterol metabolism in cell growth. Fed. Proc. 1984, 43, 126–130. [Google Scholar] [PubMed]
- Yao, C.H.; Fowle-Grider, R.; Mahieu, N.G.; Liu, G.Y.; Chen, Y.J.; Wang, R.; Singh, M.; Potter, G.S.; Gross, R.W.; Schaefer, J.; et al. Exogenous Fatty Acids Are the Preferred Source of Membrane Lipids in Proliferating Fibroblasts. Cell Chem. Biol. 2016, 23, 483–493. [Google Scholar] [CrossRef] [PubMed] [Green Version]
- Nohturfft, A.; Zhang, S.C. Coordination of Lipid Metabolism in Membrane Biogenesis. Annu. Rev. Cell Dev. Boil. 2009, 25, 539–566. [Google Scholar] [CrossRef] [PubMed]
- Donaldson, W.E. Regulation of fatty acid synthesis. Fed. Proc. 1979, 38, 2617–2621. [Google Scholar]
- Segatto, M.; Manduca, A.; Lecis, C.; Rosso, P.; Jozwiak, A.; Swiezewska, E.; Moreno, S.; Trezza, V.; Pallottini, V. Simvastatin treatment highlights a new role for the isoprenoid/cholesterol biosynthetic pathway in the modulation of emotional reactivity and cognitive performance in rats. Neuropsychopharmacology 2014, 39, 841–854. [Google Scholar] [CrossRef] [Green Version]
- Segatto, M.; Trapani, L.; Lecis, C.; Pallottini, V. Regulation of cholesterol biosynthetic pathway in different regions of the rat central nervous system. Acta Physiol. 2012, 206, 62–71. [Google Scholar] [CrossRef]
- Eberlé, D.; Hegarty, B.; Bossard, P.; Ferré, P.; Foufelle, F. SREBP transcription factors: master regulators of lipid homeostasis. Biochimie 2004, 86, 839–848. [Google Scholar] [CrossRef]
- Shen, W.J.; Azhar, S.; Kraemer, F.B. SR-B1: A Unique Multifunctional Receptor for Cholesterol Influx and Efflux. Annu. Rev. Physiol. 2018, 80, 95–116. [Google Scholar] [CrossRef] [PubMed]
- Cartocci, V.; Segatto, M.; Di Tunno, I.; Leone, S.; Pfrieger, F.W.; Pallottini, V. Modulation of the Isoprenoid/Cholesterol Biosynthetic Pathway During Neuronal Differentiation In Vitro. J. Cell. Biochem. 2016, 117, 2036–2044. [Google Scholar] [CrossRef] [PubMed]
- Cartocci, V.; Catallo, M.; Tempestilli, M.; Segatto, M.; Pfrieger, F.W.; Bronzuoli, M.R.; Scuderi, C.; Servadio, M.; Trezza, V.; Pallottini, V. Altered Brain Cholesterol/Isoprenoid Metabolism in a Rat Model of Autism Spectrum Disorders. Neuroscience 2018, 372, 27–37. [Google Scholar] [CrossRef] [PubMed]
- Trapani, L.; Segatto, M.; Simeoni, V.; Balducci, V.; Dhawan, A.; Parmar, V.S.; Prasad, A.K.; Saso, L.; Incerpi, S.; Pallottini, V. Short- and long-term regulation of 3-hydroxy 3-methylglutaryl coenzyme A reductase by a 4-methylcoumarin. Biochimie 2011, 93, 1165–1171. [Google Scholar] [CrossRef] [PubMed]
- Schulze, H.; Sandhoff, K. Lysosomal Lipid Storage Diseases. Cold Spring Harb. Perspect. Boil. 2011, 3, a004804. [Google Scholar] [CrossRef]
- Wang, C.-Y.; Filippakopoulos, P. Beating the odds: BETs in disease. Trends Biochem. Sci. 2015, 40, 468–479. [Google Scholar] [CrossRef]
- Segatto, M.; Fittipaldi, R.; Pin, F.; Sartori, R.; Ko, K.D.; Zare, H.; Fenizia, C.; Zanchettin, G.; Pierobon, E.S.; Hatakeyama, S.; et al. Epigenetic targeting of bromodomain protein BRD4 counteracts cancer cachexia and prolongs survival. Nat. Commun. 2017, 8, 1707. [Google Scholar] [CrossRef]
- Andrieu, G.P.; Shafran, J.S.; Deeney, J.T.; Bharadwaj, K.R.; Rangarajan, A.; Denis, G.V. BET proteins in abnormal metabolism, inflammation, and the breast cancer microenvironment. J. Leukoc. Boil. 2018, 104, 265–274. [Google Scholar] [CrossRef]
- Stathis, A.; Bertoni, F. BET Proteins as Targets for Anticancer Treatment. Cancer Discov. 2018, 8, 24–36. [Google Scholar] [CrossRef] [Green Version]
- Klein, K. Bromodomain protein inhibition: a novel therapeutic strategy in rheumatic diseases. RMD Open 2018, 4, e000744. [Google Scholar] [CrossRef] [Green Version]
- Hussong, M.; Börno, S.T.; Kerick, M.; Wunderlich, A.; Franz, A.; Sültmann, H.; Timmermann, B.; Lehrach, H.; Hirsch-Kauffmann, M.; Schweiger, M.R. The bromodomain protein BRD4 regulates the KEAP1/NRF2-dependent oxidative stress response. Cell Death Dis. 2014, 5, e1195. [Google Scholar] [CrossRef] [PubMed] [Green Version]
- Siebel, A.L.; Trinh, S.K.; Formosa, M.F.; Mundra, P.A.; Natoli, A.K.; Reddy-Luthmoodoo, M.; Huynh, K.; Khan, A.A.; Carey, A.L.; Van Hall, G.; et al. Effects of the BET-inhibitor, RVX-208 on the HDL lipidome and glucose metabolism in individuals with prediabetes: A randomized controlled trial. Metabolism 2016, 65, 904–914. [Google Scholar] [CrossRef] [PubMed]
- Sakamaki, J.I.; Wilkinson, S.; Hahn, M.; Tasdemir, N.; O’Prey, J.; Clark, W.; Hedley, A.; Nixon, C.; Long, J.S.; New, M.; et al. Bromodomain Protein BRD4 Is a Transcriptional Repressor of Autophagy and Lysosomal Function. Mol. Cell 2017, 66, 517–532.e9. [Google Scholar] [CrossRef] [PubMed]
- Li, F.; Yang, C.; Zhang, H.-B.; Ma, J.; Jia, J.; Tang, X.; Zeng, J.; Chong, T.; Wang, X.; He, D.; et al. BET inhibitor JQ1 suppresses cell proliferation via inducing autophagy and activating LKB1/AMPK in bladder cancer cells. Cancer Med. 2019, 8, 4792–4805. [Google Scholar] [CrossRef]
- Gilham, D.; Wasiak, S.; Tsujikawa, L.M.; Halliday, C.; Norek, K.; Patel, R.G.; Kulikowski, E.; Johansson, J.; Sweeney, M.; Wong, N.C. RVX-208, a BET-inhibitor for treating atherosclerotic cardiovascular disease, raises ApoA-I/HDL and represses pathways that contribute to cardiovascular disease. Atherosclerosis 2016, 247, 48–57. [Google Scholar] [CrossRef] [Green Version]
- Zhang, P.; Wang, D.; Zhao, Y.; Ren, S.; Gao, K.; Ye, Z.; Wang, S.; Pan, C.W.; Zhu, Y.; Yan, Y.; et al. Intrinsic BET inhibitor resistance in SPOP-mutated prostate cancer is mediated by BET protein stabilization and AKT-mTORC1 activation. Nat. Med. 2017, 23, 1055–1062. [Google Scholar] [CrossRef]
- Filippakopoulos, P.; Qi, J.; Picaud, S.; Shen, Y.; Smith, W.B.; Fedorov, O.; Morse, E.M.; Keates, T.; Hickman, T.T.; Felletar, I.; et al. Selective inhibition of BET bromodomains. Nature 2010, 468, 1067–1073. [Google Scholar] [CrossRef] [Green Version]
- Leng, E.; Xiao, Y.; Mo, Z.; Li, Y.; Zhang, Y.; Deng, X.; Zhou, M.; Zhou, C.; He, Z.; He, J.; et al. Synergistic effect of phytochemicals on cholesterol metabolism and lipid accumulation in HepG2 cells. BMC Complement. Altern. Med. 2018, 18, 122. [Google Scholar] [CrossRef]
- Mi, Y.; Tan, D.; He, Y.; Zhou, X.; Zhou, Q.; Ji, S. Melatonin Modulates lipid Metabolism in HepG2 Cells Cultured in High Concentrations of Oleic Acid: AMPK Pathway Activation may Play an Important Role. Cell Biophys. 2018, 76, 463–470. [Google Scholar] [CrossRef]
- Nagarajan, S.R.; Paul-Heng, M.; Krycer, J.R.; Fazakerley, D.J.; Sharland, A.F.; Hoy, A.J. Lipid and glucose metabolism in hepatocyte cell lines and primary mouse hepatocytes: a comprehensive resource for in vitro studies of hepatic metabolism. Am. J. Physiol. Metab. 2019, 316, E578–E589. [Google Scholar] [CrossRef]
- Mehlem, A.; Hagberg, C.E.; Muhl, L.; Eriksson, U.; Falkevall, A. Imaging of neutral lipids by oil red O for analyzing the metabolic status in health and disease. Nat. Protoc. 2013, 8, 1149–1154. [Google Scholar] [CrossRef] [PubMed] [Green Version]
- Goldstein, J.L.; Brown, M.S. Regulation of low-density lipoprotein receptors: implications for pathogenesis and therapy of hypercholesterolemia and atherosclerosis. Circulation 1987, 76, 504–507. [Google Scholar] [CrossRef] [PubMed] [Green Version]
- Yang, X.-P.; Amar, M.J.; Vaisman, B.; Bocharov, A.V.; Vishnyakova, T.G.; Freeman, L.A.; Kurlander, R.J.; Patterson, A.P.; Becker, L.C.; Remaley, A.T. Scavenger receptor-BI is a receptor for lipoprotein(a). J. Lipid Res. 2013, 54, 2450–2457. [Google Scholar] [CrossRef] [PubMed] [Green Version]
- Wojtanik, K.M.; Liscum, L. The Transport of Low Density Lipoprotein-derived Cholesterol to the Plasma Membrane Is Defective in NPC1 Cells. J. Boil. Chem. 2003, 278, 14850–14856. [Google Scholar] [CrossRef] [PubMed] [Green Version]
- Peake, K.B.; Vance, J.E. Defective cholesterol trafficking in Niemann-Pick C-deficient cells. FEBS Lett. 2010, 584, 2731–2739. [Google Scholar] [CrossRef] [PubMed] [Green Version]
- Ebrahimi-Fakhari, D.; Wahlster, L.; Bartz, F.; Werenbeck-Ueding, J.; Praggastis, M.; Zhang, J.; Joggerst-Thomalla, B.; Theiss, S.; Grimm, D.; Ory, D.S.; et al. Reduction of TMEM97 increases NPC1 protein levels and restores cholesterol trafficking in Niemann-pick type C1 disease cells. Hum. Mol. Genet. 2016, 25, 3588–3599. [Google Scholar] [CrossRef] [Green Version]
- Pesiri, V.; Totta, P.; Segatto, M.; Bianchi, F.; Pallottini, V.; Marino, M.; Acconcia, F. Estrogen receptor α L429 and A430 regulate 17β-estradiol-induced cell proliferation via CREB1. Cell. Signal. 2015, 27, 2380–2388. [Google Scholar] [CrossRef]
- Stock, C.J.W.; Michaeloudes, C.; Leoni, P.; Durham, A.L.; Mumby, S.; Wells, A.U.; Chung, K.F.; Adcock, I.M.; Renzoni, E.A.; Lindahl, G.E. Bromodomain and Extraterminal (BET) Protein Inhibition Restores Redox Balance and Inhibits Myofibroblast Activation. Biomed. Res. Int. 2019, 2019, 1484736. [Google Scholar] [CrossRef]
- Roberts, T.C.; Etxaniz, U.; Dall’Agnese, A.; Wu, S.-Y.; Chiang, C.-M.; Brennan, P.E.; Wood, M.J.A.; Puri, P.L. BRD3 and BRD4 BET Bromodomain Proteins Differentially Regulate Skeletal Myogenesis. Sci. Rep. 2017, 7, 1–16. [Google Scholar] [CrossRef]
- Lu, H.; Talbot, S.; Robertson, K.A.; Watterson, S.; Forster, T.; Roy, U.; Ghazal, P. Rapid proteasomal elimination of 3-hydroxy-3-methylglutaryl-CoA reductase by interferon-γ in primary macrophages requires endogenous 25-hydroxycholesterol synthesis. Steroids 2015, 99, 219–229. [Google Scholar] [CrossRef] [Green Version]
- Segatto, M.; Tonini, C.; Pfrieger, F.W.; Trezza, V.; Pallottini, V. Loss of Mevalonate/Cholesterol Homeostasis in the Brain: A Focus on Autism Spectrum Disorder and Rett Syndrome. Int. J. Mol. Sci. 2019, 20, 3317. [Google Scholar] [CrossRef] [Green Version]
- Pahan, K. Lipid-lowering drugs. Cell. Mol. Life Sci. 2006, 63, 1165–1178. [Google Scholar] [CrossRef]
- Pipalia, N.H.; Cosner, C.C.; Huang, A.; Chatterjee, A.; Bourbon, P.; Farley, N.; Helquist, P.; Wiest, O.; Maxfield, F.R. Histone deacetylase inhibitor treatment dramatically reduces cholesterol accumulation in Niemann-Pick type C1 mutant human fibroblasts. Proc. Natl. Acad. Sci. USA 2011, 108, 5620–5625. [Google Scholar] [CrossRef] [Green Version]
- Meaney, S. Epigenetic regulation of cholesterol homeostasis. Front. Genet. 2014, 5, 311. [Google Scholar] [CrossRef] [Green Version]
- Gaur, V.; Connor, T.; Sanigorski, A.; Martin, S.D.; Bruce, C.R.; Henstridge, D.C.; Bond, S.T.; McEwen, K.A.; Kerr-Bayles, L.; Ashton, T.D.; et al. Disruption of the Class IIa HDAC Corepressor Complex Increases Energy Expenditure and Lipid Oxidation. Cell Rep. 2016, 16, 2802–2810. [Google Scholar] [CrossRef] [Green Version]
- Lin, Z.; Bishop, K.S.; Sutherland, H.; Marlow, G.; Murray, P.; Denny, W.A.; Ferguson, L.R. A quinazoline-based HDAC inhibitor affects gene expression pathways involved in cholesterol biosynthesis and mevalonate in prostate cancer cells. Mol. BioSyst. 2016, 12, 839–849. [Google Scholar] [CrossRef] [Green Version]
- Ferrari, A.; Fiorino, E.; Giudici, M.; Gilardi, F.; Galmozzi, A.; Mitro, N.; Cermenati, G.; Godio, C.; Caruso, D.; De Fabiani, E.; et al. Linking epigenetics to lipid metabolism: Focus on histone deacetylases. Mol. Membr. Boil. 2012, 29, 257–266. [Google Scholar] [CrossRef]
- Bartz, F.; Kern, L.; Erz, D.; Zhu, M.; Gilbert, D.; Meinhof, T.; Wirkner, U.; Erfle, H.; Muckenthaler, M.; Pepperkok, R.; et al. Identification of Cholesterol-Regulating Genes by Targeted RNAi Screening. Cell Metab. 2009, 10, 63–75. [Google Scholar] [CrossRef] [Green Version]
- Sasaki, M.; Terao, Y.; Ayaori, M.; Uto-Kondo, H.; Iizuka, M.; Yogo, M.; Hagisawa, K.; Takiguchi, S.; Yakushiji, E.; Nakaya, K.; et al. Hepatic overexpression of idol increases circulating protein convertase subtilisin/kexin type 9 in mice and hamsters via dual mechanisms: sterol regulatory element-binding protein 2 and low-density lipoprotein receptor-dependent pathways. Arterioscler. Thromb. Vasc. Biol. 2014, 34, 1171–1178. [Google Scholar] [CrossRef] [Green Version]
- Kim, Y.-M.; Shin, H.-T.; Seo, Y.-H.; Byun, H.-O.; Yoon, S.-H.; Lee, I.-K.; Hyun, N.-H.; Chung, H.-Y.; Yoon, G. Sterol Regulatory Element-binding Protein (SREBP)-1-mediated Lipogenesis Is Involved in Cell Senescence*. J. Boil. Chem. 2010, 285, 29069–29077. [Google Scholar] [CrossRef] [Green Version]
- Segatto, M.; Trapani, L.; Di Tunno, I.; Sticozzi, C.; Valacchi, G.; Hayek, J.; Pallottini, V. Cholesterol Metabolism Is Altered in Rett Syndrome: A Study on Plasma and Primary Cultured Fibroblasts Derived from Patients. PLoS ONE 2014, 9, e104834. [Google Scholar] [CrossRef] [Green Version]
- Wen, Y.-A.; Xiong, X.; Zaytseva, Y.Y.; Napier, D.L.; Vallee, E.; Li, A.T.; Wang, C.; Weiss, H.L.; Evers, B.M.; Gao, T. Downregulation of SREBP inhibits tumor growth and initiation by altering cellular metabolism in colon cancer. Cell Death Dis. 2018, 9, 265. [Google Scholar] [CrossRef] [Green Version]
- Shi, J.; Vakoc, C.R.; Junwei, S. The mechanisms behind the therapeutic activity of BET bromodomain inhibition. Mol. Cell 2014, 54, 728–736. [Google Scholar] [CrossRef] [Green Version]
- Gobbi, G.; Donati, B.; Valle, I.F.D.; Reggiani, F.; Torricelli, F.; Remondini, D.; Castellani, G.; Ambrosetti, D.C.; Ciarrocchi, A.; Sancisi, V. The Hippo pathway modulates resistance to BET proteins inhibitors in lung cancer cells. Oncogene 2019, 38, 6801–6817. [Google Scholar] [CrossRef]
- Göritz, C.; Thiebaut, R.; Tessier, L.-H.; Nieweg, K.; Moehle, C.; Buard, I.; Dupont, J.-L.; Schurgers, L.J.; Schmitz, G.; Pfrieger, F.W. Glia-induced neuronal differentiation by transcriptional regulation. Glia 2007, 55, 1108–1122. [Google Scholar] [CrossRef]
- Rocha, J.; Trapani, L.; Segatto, M.; Rosa, P.; Nogueira, C.; Zeni, G.; Pallottini, V. Molecular Effects of Diphenyl Diselenide on Cholesterol and Glucose Cell Metabolism. Curr. Med. Chem. 2013, 20, 4426–4434. [Google Scholar] [CrossRef]


© 2020 by the authors. Licensee MDPI, Basel, Switzerland. This article is an open access article distributed under the terms and conditions of the Creative Commons Attribution (CC BY) license (http://creativecommons.org/licenses/by/4.0/).
Share and Cite
Tonini, C.; Colardo, M.; Colella, B.; Di Bartolomeo, S.; Berardinelli, F.; Caretti, G.; Pallottini, V.; Segatto, M. Inhibition of Bromodomain and Extraterminal Domain (BET) Proteins by JQ1 Unravels a Novel Epigenetic Modulation to Control Lipid Homeostasis. Int. J. Mol. Sci. 2020, 21, 1297. https://0-doi-org.brum.beds.ac.uk/10.3390/ijms21041297
Tonini C, Colardo M, Colella B, Di Bartolomeo S, Berardinelli F, Caretti G, Pallottini V, Segatto M. Inhibition of Bromodomain and Extraterminal Domain (BET) Proteins by JQ1 Unravels a Novel Epigenetic Modulation to Control Lipid Homeostasis. International Journal of Molecular Sciences. 2020; 21(4):1297. https://0-doi-org.brum.beds.ac.uk/10.3390/ijms21041297
Chicago/Turabian StyleTonini, Claudia, Mayra Colardo, Barbara Colella, Sabrina Di Bartolomeo, Francesco Berardinelli, Giuseppina Caretti, Valentina Pallottini, and Marco Segatto. 2020. "Inhibition of Bromodomain and Extraterminal Domain (BET) Proteins by JQ1 Unravels a Novel Epigenetic Modulation to Control Lipid Homeostasis" International Journal of Molecular Sciences 21, no. 4: 1297. https://0-doi-org.brum.beds.ac.uk/10.3390/ijms21041297