Molecular Dissection of TaLTP1 Promoter Reveals Functional Cis-Elements Regulating Epidermis-Specific Expression

 and
and 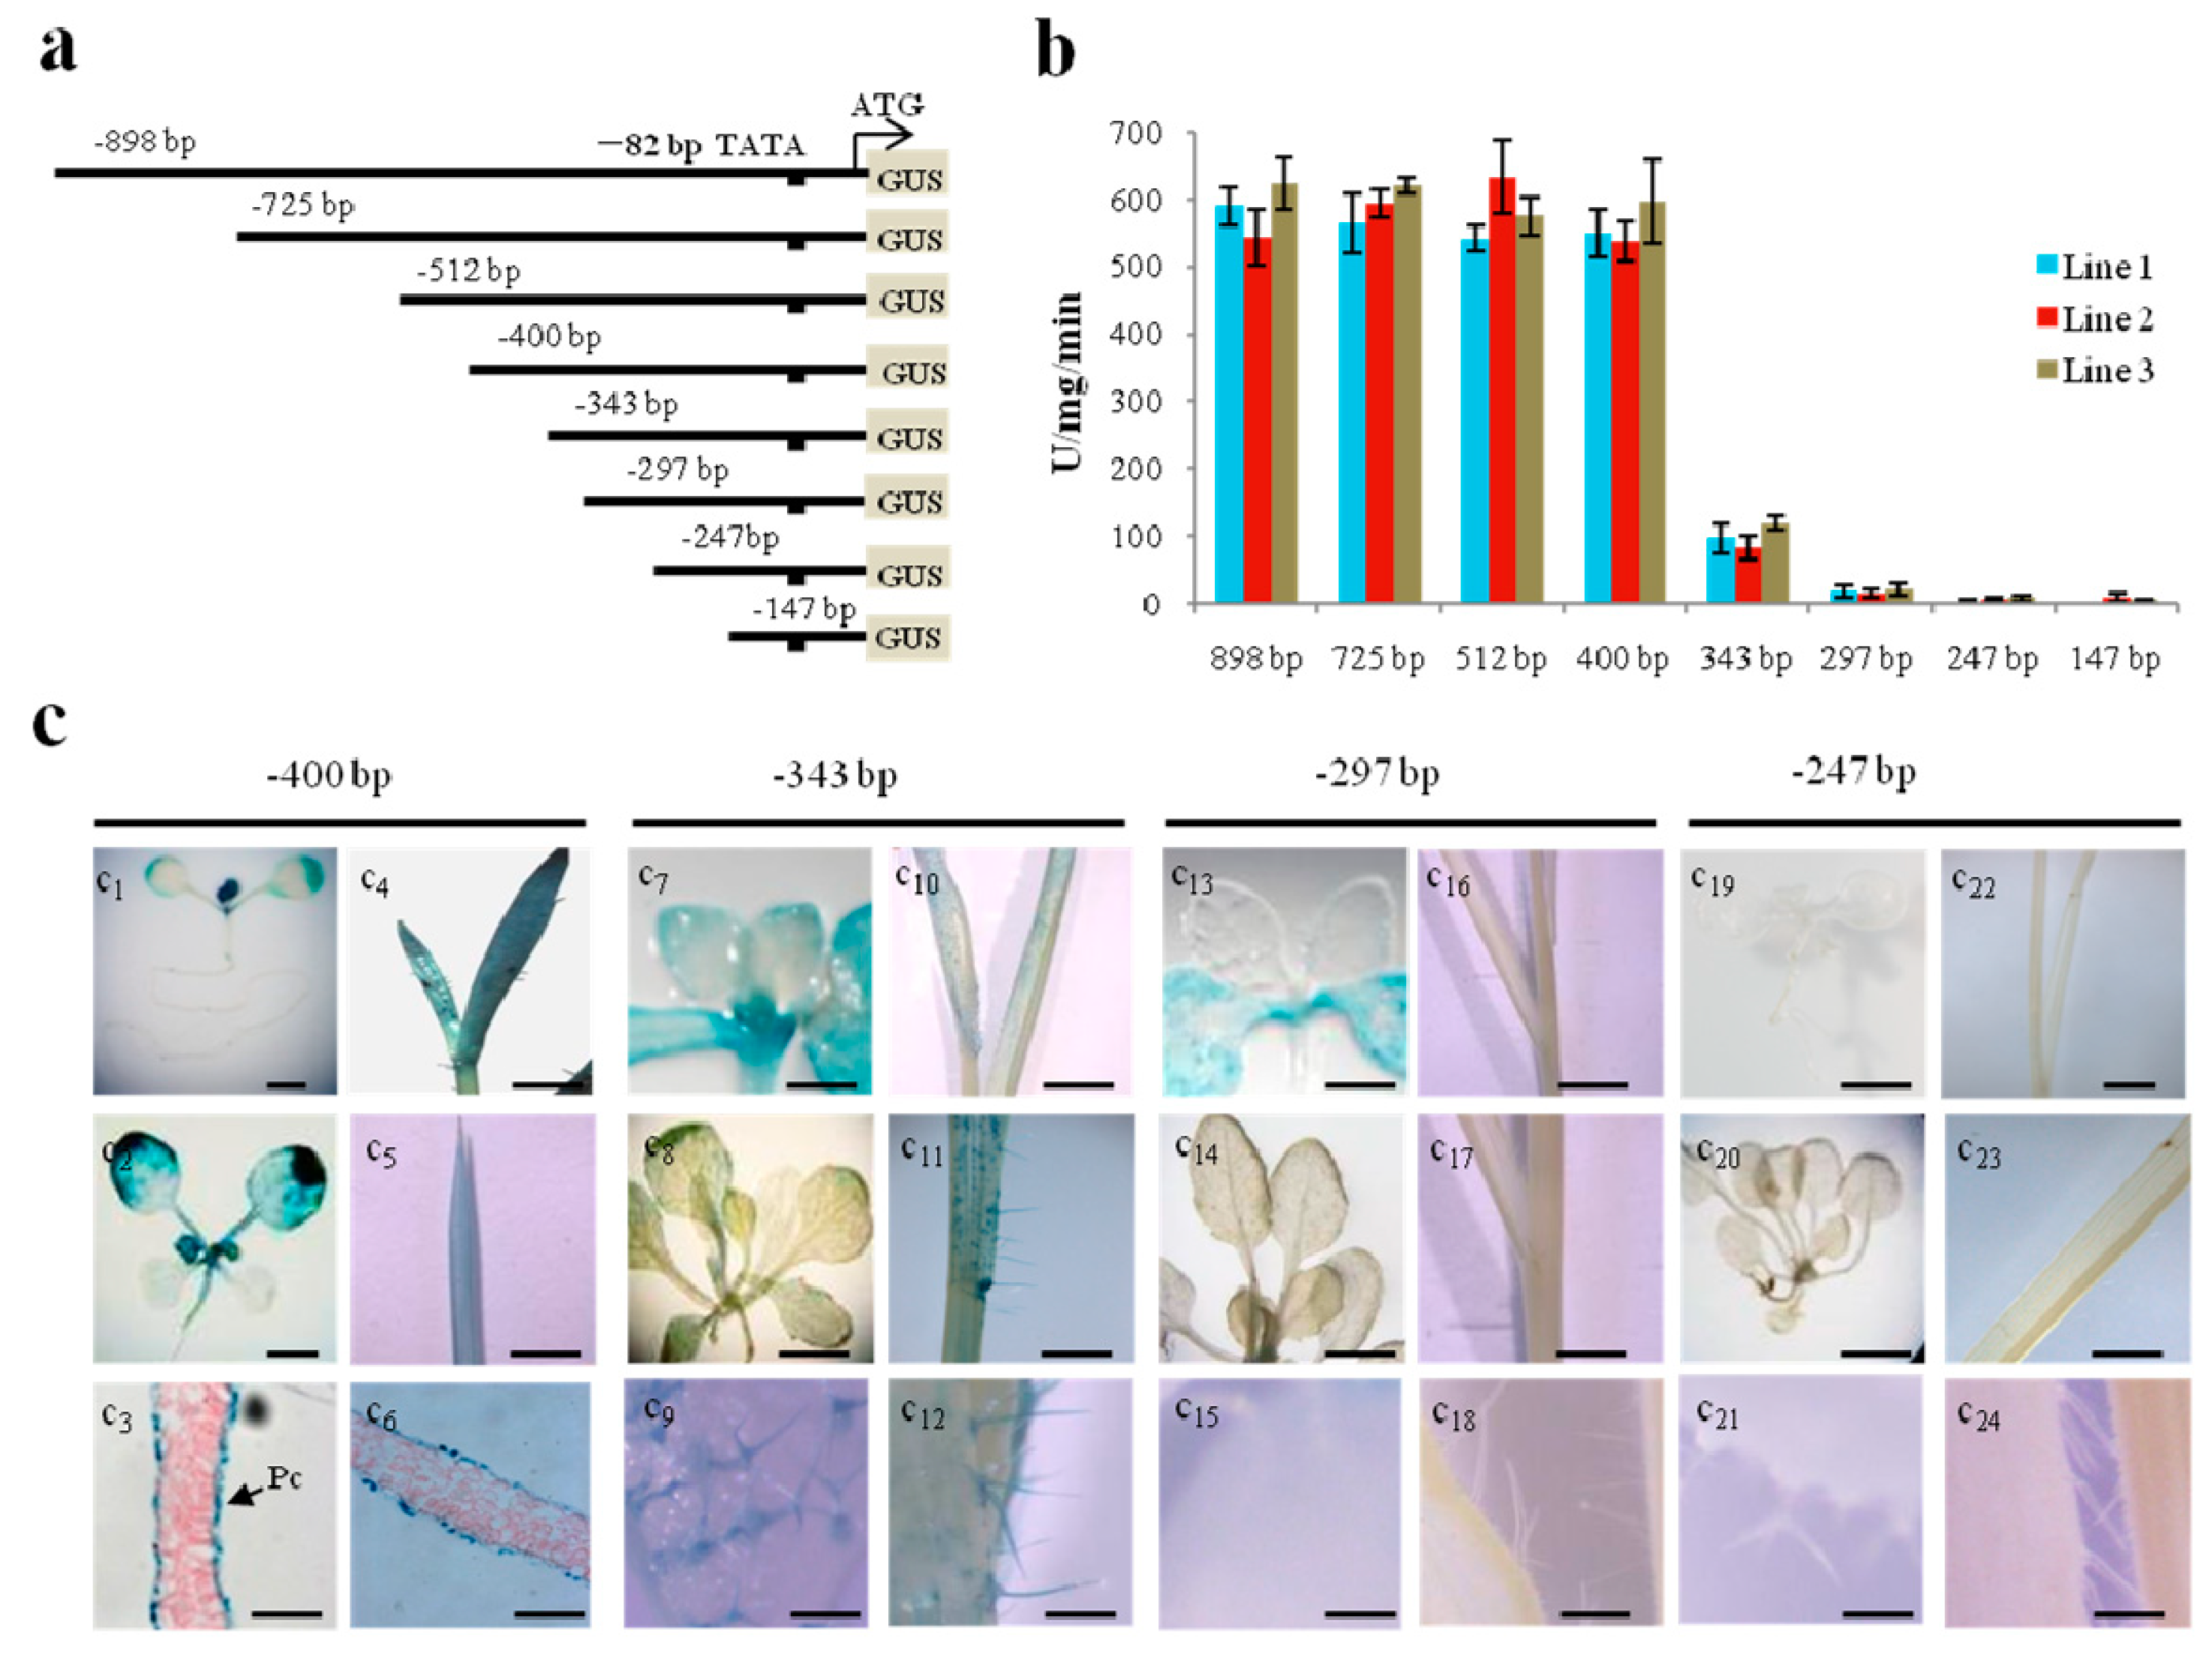
Abstract
:1. Introduction
2. Results
2.1. Mapping of a 5’upstream Region Regulating Epidermis-Specific Expression
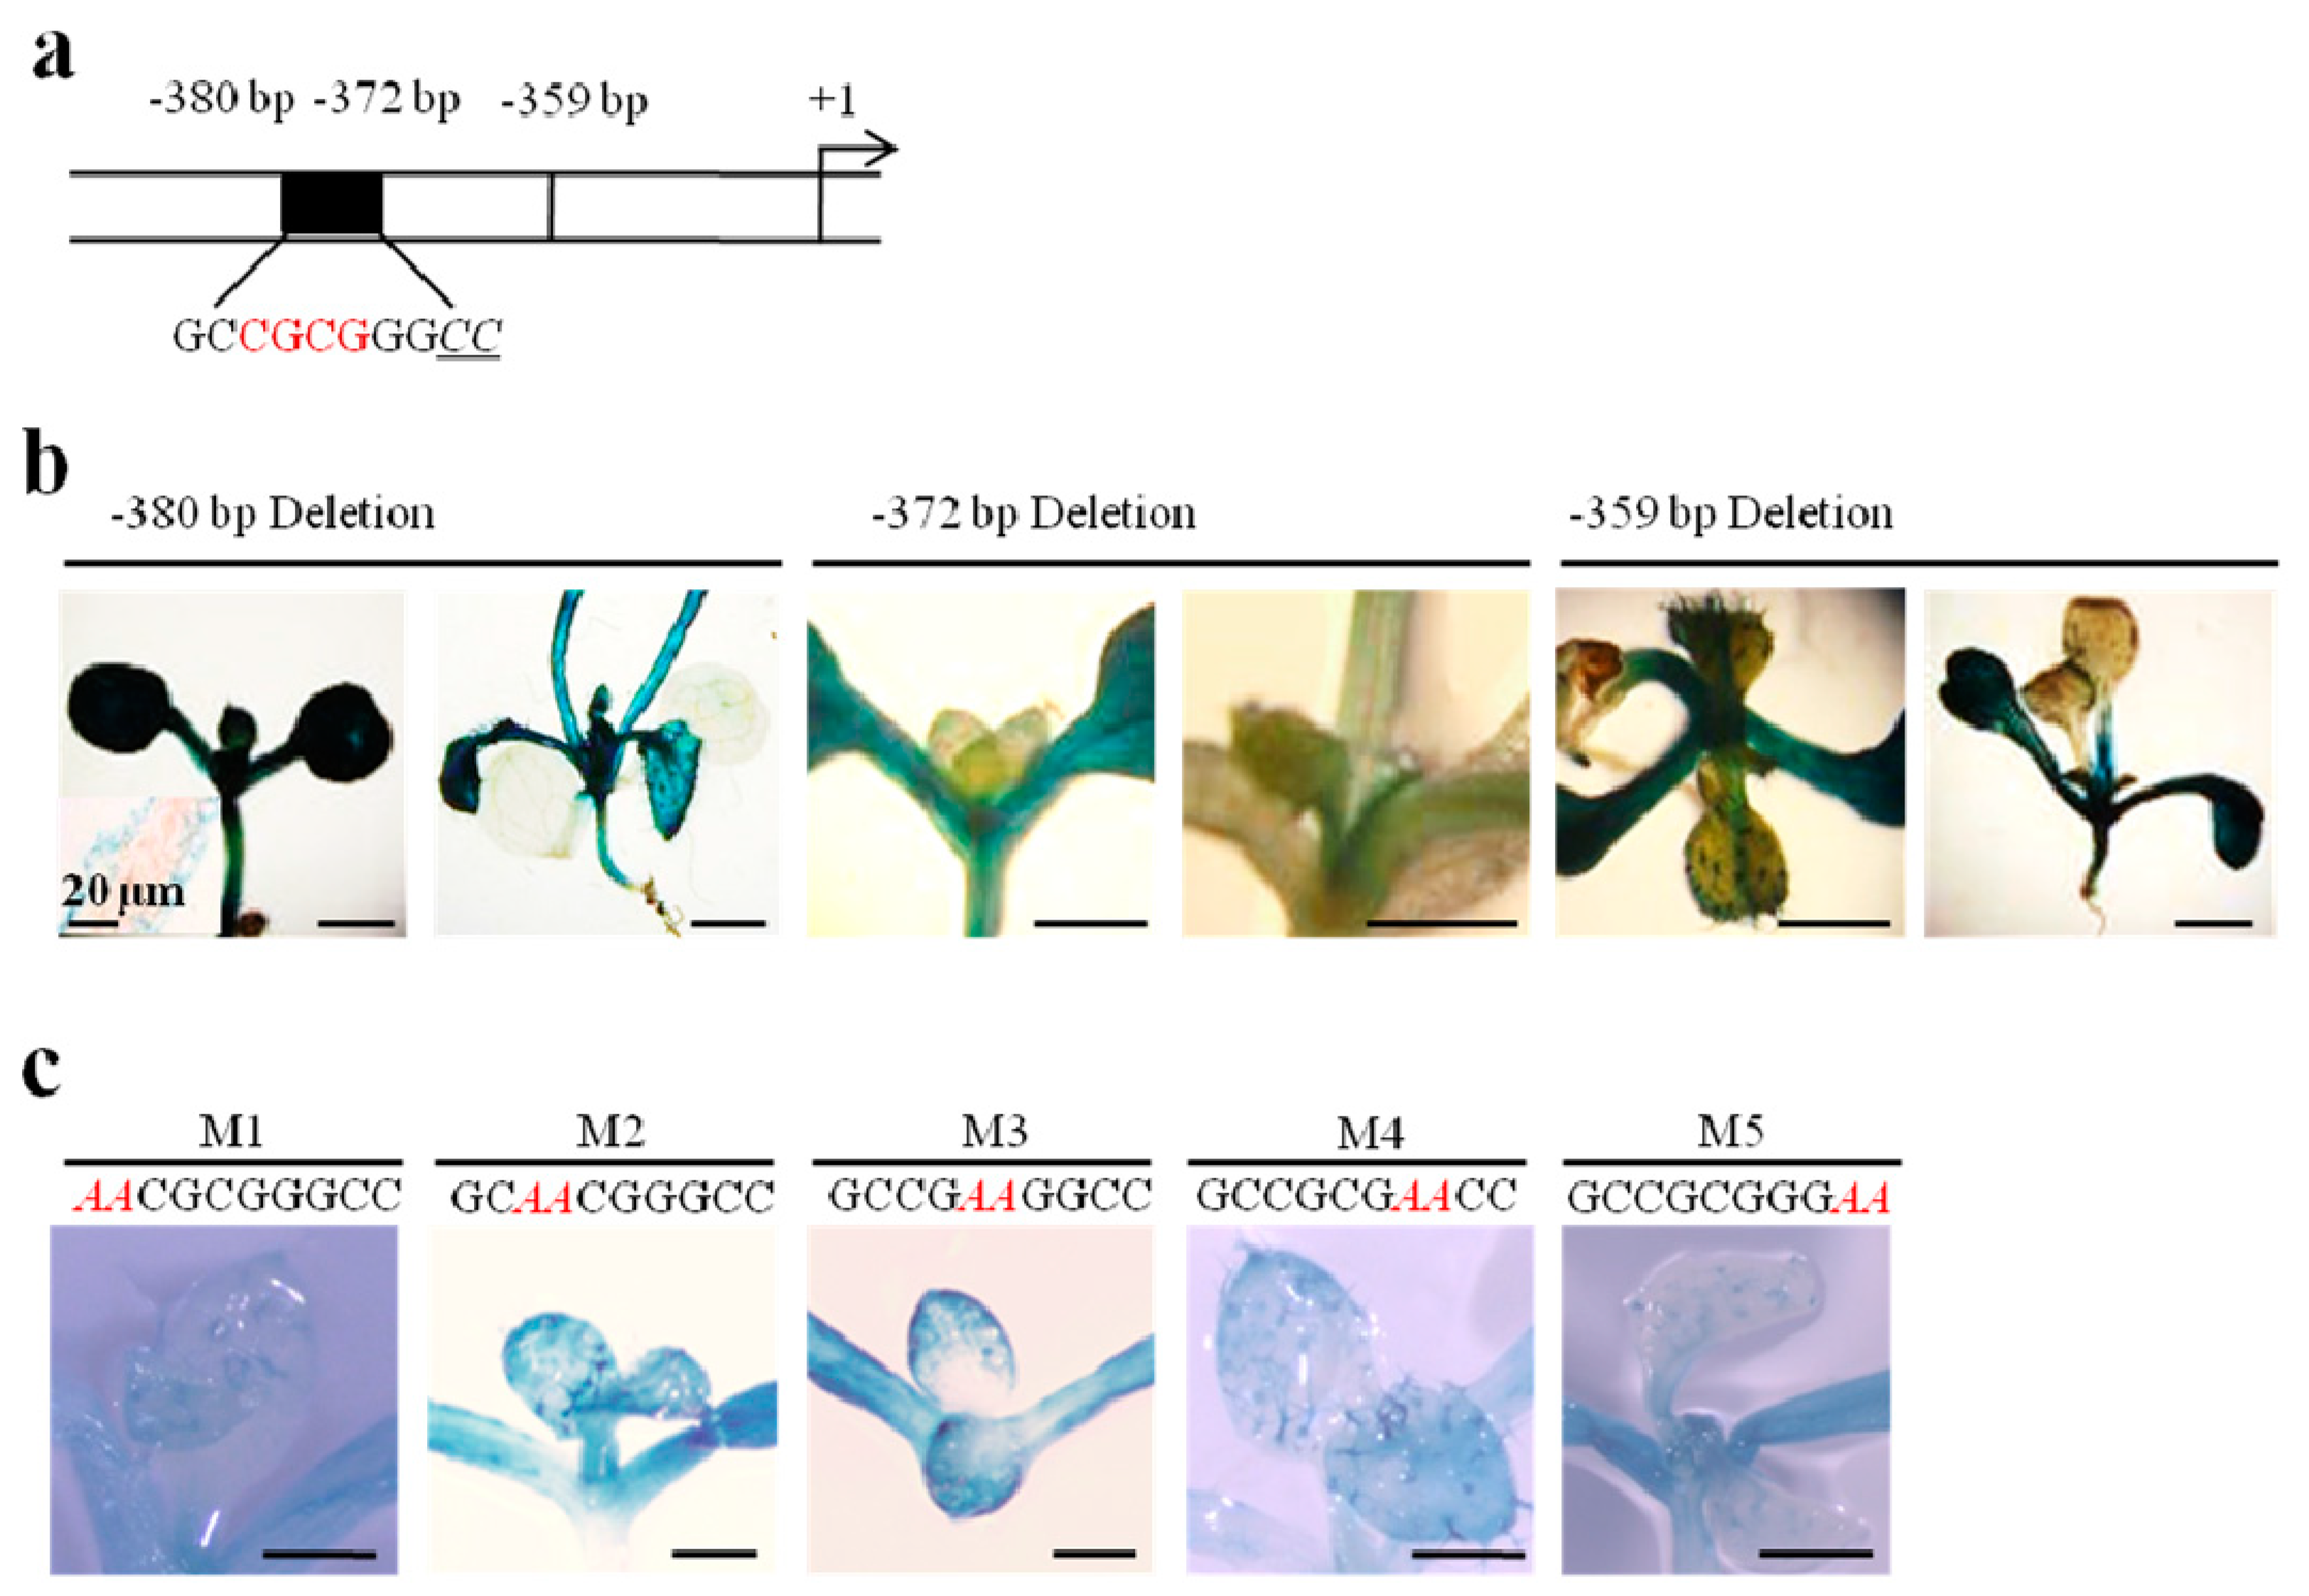
2.2. A GC (N4) GGCC Motif at −380 bp Is Involved in Regulating Pavement Cell-Specific Expression
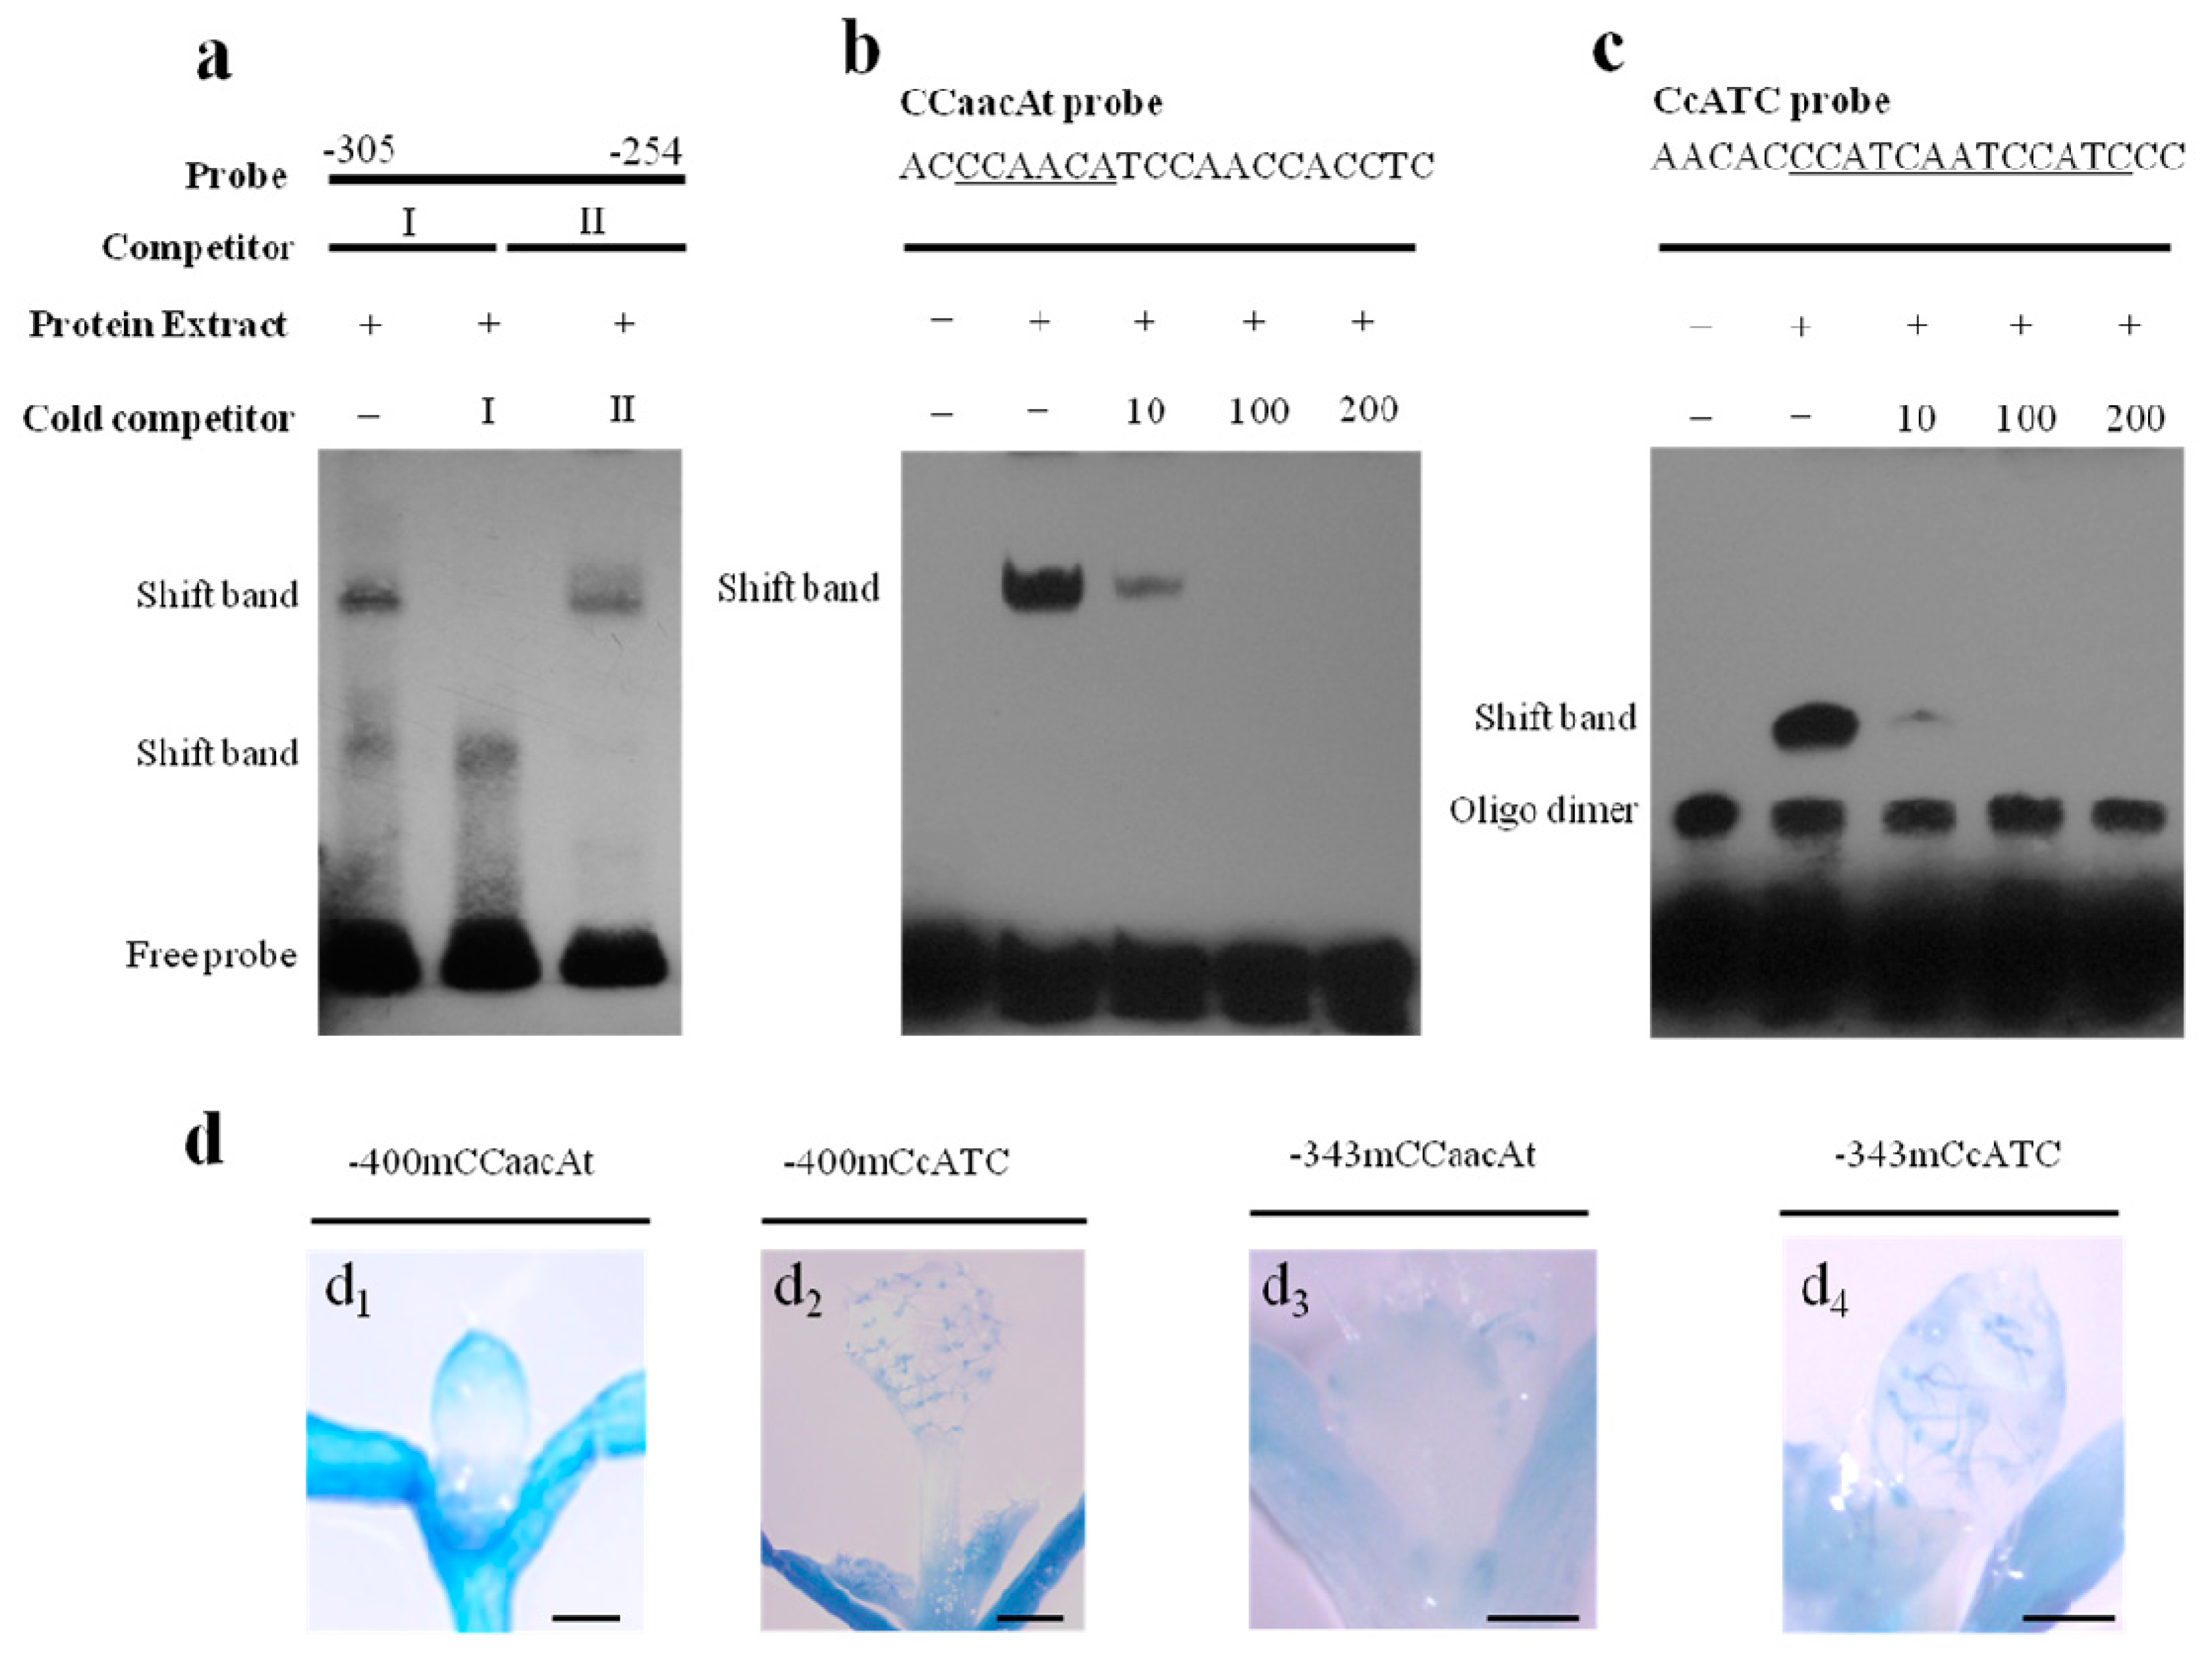
2.3. A CCaacAt Motif at −303 bp Regulates Trichome-Specific Expression
2.4. A CcATC Motif at 268 bp Is also Involved in Regulating Pavement Cell-Specific Expression
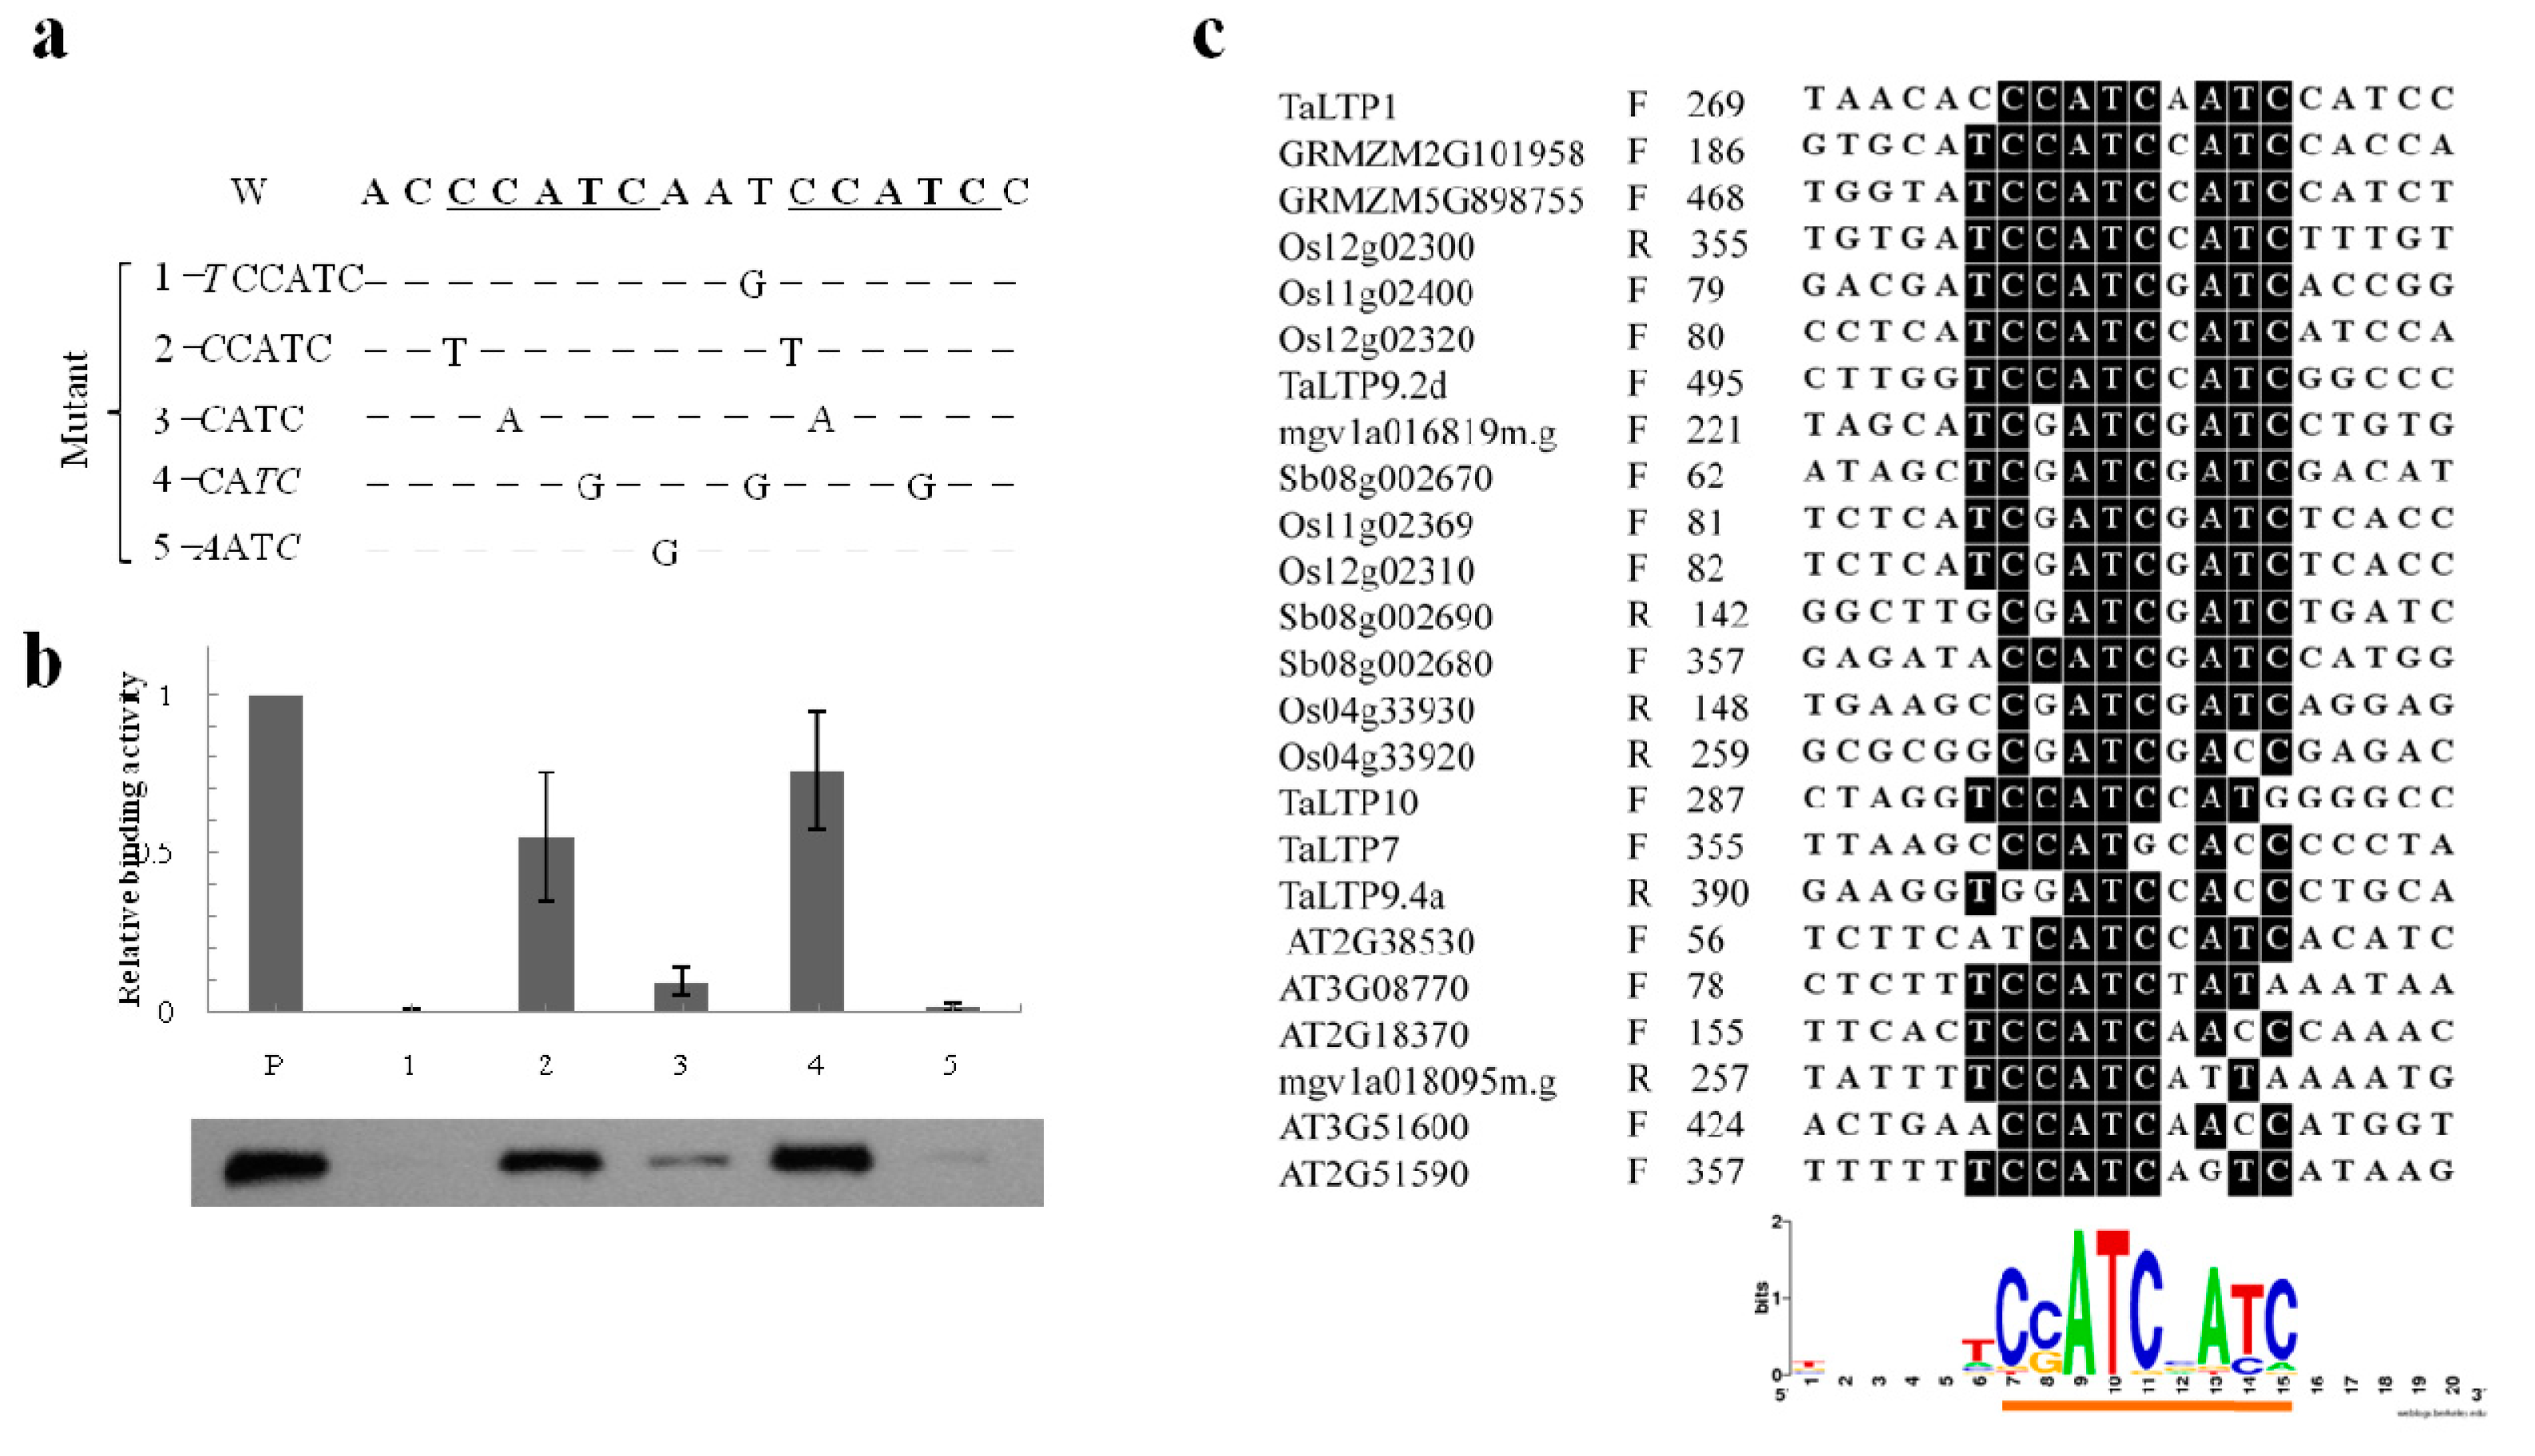
2.5. Characterization of the CcATC Motif
3. Discussion
4. Materials and Methods
4.1. Generation of Deletion and Nucleotide Substitution TaLTP1 Promoter Constructs
4.2. Plant Growth and Transformation
4.3. Expression Analysis by Real-Time qPCR
4.4. Histochemical GUS Analyses and Fluorometric Assays
4.5. Electrophoretic Mobility Shift Assay (EMSA)
Supplementary Materials
Author Contributions
Funding
Conflicts of Interest
References
- Savaldi-Goldstein, S.; Peto, C.; Chory, J. The epidermis both drives and restricts plant shoot growth. Nature 2007, 446, 199–202. [Google Scholar] [CrossRef] [PubMed]
- Javelle, M.; Vernoud, V.; Rogowsky, P.M.; Ingram, G.C. Epidermis: The formation and functions of a fundamental plant tissue. New Phytol. 2011, 189, 17–39. [Google Scholar] [CrossRef] [PubMed]
- Delude, C.; Moussu, S.; Joubes, J.; Ingram, G.; Domergue, F. Plant surface lipids and epidermis development. Subcell. Biochem. 2016, 86, 287–313. [Google Scholar] [PubMed]
- Blein, J.P.; Coutos-Thevenot, P.; Marion, D.; Ponchet, M. From elicitins to lipid-transfer proteins: A new insight in cell signalling involved in plant defence mechanisms. Trends Plant Sci. 2002, 7, 293–296. [Google Scholar] [CrossRef]
- Suh, M.C.; Samuels, A.L.; Jetter, R.; Kunst, L.; Pollard, M.; Ohlrogge, J.; Beisson, F. Cuticular lipid composition, surface structure, and gene expression in Arabidopsis stem epidermis. Plant Physiol. 2005, 139, 1649–1665. [Google Scholar] [CrossRef] [PubMed] [Green Version]
- Kim, H.; Choi, D.; Suh, M.C. Cuticle ultrastructure, cuticular lipid composition, and gene expression in hypoxia-stressed Arabidopsis stems and leaves. Plant Cell Rep. 2017, 36, 815–827. [Google Scholar] [CrossRef]
- Guimil, S.; Dunand, C. Cell growth and differentiation in Arabidopsis epidermal cells. J. Exp. Bot. 2007, 58, 3829–3840. [Google Scholar] [CrossRef] [Green Version]
- Ishida, T.; Kurata, T.; Okada, K.; Wada, T. A genetic regulatory network in the development of trichomes and root hairs. Annu. Rev. Plant Biol. 2008, 59, 365–386. [Google Scholar] [CrossRef]
- Nadeau, J.A. Stomatal development: New signals and fate determinants. Curr. Opin. Plant Biol. 2009, 12, 29–35. [Google Scholar] [CrossRef] [Green Version]
- Takada, S.; Jurgens, G. Transcriptional regulation of epidermal cell fate in the Arabidopsis embryo. Development 2007, 134, 1141–1150. [Google Scholar] [CrossRef] [Green Version]
- Javelle, M.; Vernoud, V.; Depege-Fargeix, N.; Arnould, C.; Oursel, D.; Domergue, F.; Sarda, X.; Rogowsky, P.M. Overexpression of the epidermis-specific homeodomain-leucine zipper IV transcription factor Outer Cell Layer1 in maize identifies target genes involved in lipid metabolism and cuticle biosynthesis. Plant Physiol. 2010, 154, 273–286. [Google Scholar] [CrossRef] [PubMed] [Green Version]
- Gao, L.; Tian, Y.; Chen, M.C.; Wei, L.; Gao, T.G.; Yin, H.J.; Zhang, J.L.; Kumar, T.; Liu, L.B.; Wang, S.M. Cloning and functional characterization of epidermis-specific promoter MtML1 from Medicago truncatula. J. Biotechnol. 2019, 300, 32–39. [Google Scholar] [CrossRef] [PubMed]
- Salminen, T.A.; Blomqvist, K.; Edqvist, J. Lipid transfer proteins: Classification, nomenclature, structure, and function. Planta 2016, 244, 971–997. [Google Scholar] [CrossRef] [PubMed] [Green Version]
- Liu, F.; Zhang, X.; Lu, C.; Zeng, X.; Li, Y.; Fu, D.; Wu, G. Non-specific lipid transfer proteins in plants: Presenting new advances and an integrated functional analysis. J. Exp. Bot. 2015, 66, 5663–5681. [Google Scholar] [CrossRef]
- Jang, C.S.; Yim, W.C.; Moon, J.C.; Hung, J.H.; Lee, T.G.; Lim, S.D.; Cho, S.H.; Lee, K.K.; Kim, W.; Seo, Y.W.; et al. Evolution of non-specific lipid transfer protein (nsLTP) genes in the Poaceae family: Their duplication and diversity. Mol. Genet. Genom. 2008, 279, 481–497. [Google Scholar] [CrossRef]
- Kader, J.C. Lipid-transfer proteins in plants. Annu. Rev. Plant Biol. 1996, 47, 627–654. [Google Scholar] [CrossRef] [Green Version]
- Carvalho Ade, O.; Gomes, V.M. Role of plant lipid transfer proteins in plant cell physiology—A concise review. Peptides 2007, 28, 1144–1153. [Google Scholar] [CrossRef]
- Thoma, S.; Hecht, U.; Kippers, A.; Botella, J.; De Vries, S.; Somerville, C. Tissue-specific expression of a gene encoding a cell wall-localized lipid transfer protein from Arabidopsis. Plant Physiol. 1994, 105, 35–45. [Google Scholar] [CrossRef] [Green Version]
- Guiderdoni, E.; Cordero, M.J.; Vignols, F.; Garcia-Garrido, J.M.; Lescot, M.; Tharreau, D.; Meynard, D.; Ferriere, N.; Notteghem, J.L.; Delseny, M. Inducibility by pathogen attack and developmental regulation of the rice Ltp1 gene. Plant Mol. Biol. 2002, 49, 683–699. [Google Scholar] [CrossRef]
- Wang, H.W.; Kwon, H.J.; Yim, W.C.; Lim, S.D.; Moon, J.C.; Lee, B.M.; Seo, Y.W.; Kim, W.; Jang, C.S. Expressional diversity of wheat nsLTP genes: Evidence of subfunctionalization via cis-regulatory divergence. Genetica 2010, 138, 843–852. [Google Scholar] [CrossRef]
- Kim, H.; Lee, S.B.; Kim, H.J.; Min, M.K.; Hwang, I.; Suh, M.C. Characterization of glycosylphosphatidylinositol-anchored lipid transfer protein 2 (LTPG2) and overlapping function between LTPG/LTPG1 and LTPG2 in cuticular wax export or accumulation in Arabidopsis thaliana. Plant Cell Physiol. 2012, 53, 1391–1403. [Google Scholar] [CrossRef] [PubMed] [Green Version]
- Wang, H.W.; Hwang, S.G.; Karuppanapandian, T.; Liu, A.; Kim, W.; Jang, C.S. Insight into the molecular evolution of non-specific lipid transfer proteins via comparative analysis between rice and sorghum. DNA Res. 2012, 19, 179–194. [Google Scholar] [CrossRef] [PubMed] [Green Version]
- Lee, S.B.; Go, Y.S.; Bae, H.J.; Park, J.H.; Cho, S.H.; Cho, H.J.; Lee, D.S.; Park, O.K.; Hwang, I.; Suh, M.C. Disruption of glycosylphosphatidylinositol-anchored lipid transfer protein gene altered cuticular lipid composition, increased plastoglobules, and enhanced susceptibility to infection by the fungal pathogen Alternaria brassicicola. Plant Physiol. 2009, 150, 42–54. [Google Scholar] [CrossRef] [Green Version]
- Nieuwland, J.; Feron, R.; Huisman, B.A.; Fasolino, A.; Hilbers, C.W.; Derksen, J.; Mariani, C. Lipid transfer proteins enhance cell wall extension in tobacco. Plant Cell 2005, 17, 2009–2019. [Google Scholar] [CrossRef] [PubMed] [Green Version]
- Tsuboi, S.; Osafune, T.; Tsugeki, R.; Nishimura, M.; Yamada, M. Nonspecific lipid transfer protein in castor bean cotyledon cells: Subcellular localization and a possible role in lipid metabolism. J. Biochem. 1992, 111, 500–508. [Google Scholar] [CrossRef] [PubMed]
- Sterk, P.; Booij, H.; Schellekens, G.A.; Van Kammen, A.; De Vries, S.C. Cell-specific expression of the carrot EP2 lipid transfer protein gene. Plant Cell 1991, 3, 907–921. [Google Scholar]
- Park, S.Y.; Jauh, G.Y.; Mollet, J.C.; Eckard, K.J.; Nothnagel, E.A.; Walling, L.L.; Lord, E.M. A lipid transfer-like protein is necessary for lily pollen tube adhesion to an in vitro stylar matrix. Plant Cell 2000, 12, 151–164. [Google Scholar]
- Buhot, N.; Douliez, J.P.; Jacquemard, A.; Marion, D.; Tran, V.; Maume, B.F.; Milat, M.L.; Ponchet, M.; Mikes, V.; Kader, J.C.; et al. A lipid transfer protein binds to a receptor involved in the control of plant defence responses. FEBS Lett. 2001, 509, 27–30. [Google Scholar] [CrossRef] [Green Version]
- Maldonado, A.M.; Doerner, P.; Dixon, R.A.; Lamb, C.J.; Cameron, R.K. A putative lipid transfer protein involved in systemic resistance signalling in Arabidopsis. Nature 2002, 419, 399–403. [Google Scholar] [CrossRef]
- Kristensen, A.K.; Brunstedt, J.; Nielsen, K.K.; Roepstorff, P.; Mikkelsen, J.D. Characterization of a new antifungal non-specific lipid transfer protein (nsLTP) from sugar beet leaves. Plant Sci. 2000, 155, 31–40. [Google Scholar] [CrossRef]
- Canevascini, S.; Caderas, D.; Mandel, T.; Fleming, A.J.; Dupuis, I.; Kuhlemeier, C. Tissue-specific expression and promoter analysis of the tobacco Itp1 gene. Plant Physiol. 1996, 112, 513–524. [Google Scholar] [CrossRef] [PubMed] [Green Version]
- Yu, G.; Hou, W.; Du, X.; Wang, L.; Wu, H.; Zhao, L.; Kong, L.; Wang, H. Identification of wheat non-specific lipid transfer proteins involved in chilling tolerance. Plant Cell Rep. 2014, 33, 1757–1766. [Google Scholar] [CrossRef] [PubMed]
- Crooks, G.E.; Hon, G.; Chandonia, J.M.; Brenner, S.E. WebLogo: A sequence logo generator. Genome Res. 2004, 14, 1188–1190. [Google Scholar] [CrossRef] [PubMed] [Green Version]
- Kagaya, Y.; Ohmiya, K.; Hattori, T. RAV1, a novel DNA-binding protein, binds to bipartite recognition sequence through two distinct DNA-binding domains uniquely found in higher plants. Nucleic Acids Res. 1999, 27, 470–478. [Google Scholar] [CrossRef]
- Zhang, X.; Henriques, R.; Lin, S.S.; Niu, Q.W.; Chua, N.H. Agrobacterium-mediated transformation of Arabidopsis thaliana using the floral dip method. Nat. Protoc. 2006, 1, 641–646. [Google Scholar] [CrossRef]
- Alves, S.C.; Worland, B.; Thole, V.; Snape, J.W.; Bevan, M.W.; Vain, P. A protocol for Agrobacterium-mediated transformation of Brachypodium distachyon community standard line Bd21. Nat. Protoc. 2009, 4, 638–649. [Google Scholar] [CrossRef]
- Jefferson, R.A.; Kavanagh, T.A.; Bevan, M.W. GUS fusions: Beta-glucuronidase as a sensitive and versatile gene fusion marker in higher plants. EMBO J. 1987, 6, 3901–3907. [Google Scholar] [CrossRef]


© 2020 by the authors. Licensee MDPI, Basel, Switzerland. This article is an open access article distributed under the terms and conditions of the Creative Commons Attribution (CC BY) license (http://creativecommons.org/licenses/by/4.0/).
Share and Cite
Wang, G.; Yu, G.; Hao, Y.; Cheng, X.; Zhao, J.; Sun, S.; Wang, H. Molecular Dissection of TaLTP1 Promoter Reveals Functional Cis-Elements Regulating Epidermis-Specific Expression. Int. J. Mol. Sci. 2020, 21, 2261. https://0-doi-org.brum.beds.ac.uk/10.3390/ijms21072261
Wang G, Yu G, Hao Y, Cheng X, Zhao J, Sun S, Wang H. Molecular Dissection of TaLTP1 Promoter Reveals Functional Cis-Elements Regulating Epidermis-Specific Expression. International Journal of Molecular Sciences. 2020; 21(7):2261. https://0-doi-org.brum.beds.ac.uk/10.3390/ijms21072261
Chicago/Turabian StyleWang, Guiping, Guanghui Yu, Yongchao Hao, Xinxin Cheng, Jinxiao Zhao, Silong Sun, and Hongwei Wang. 2020. "Molecular Dissection of TaLTP1 Promoter Reveals Functional Cis-Elements Regulating Epidermis-Specific Expression" International Journal of Molecular Sciences 21, no. 7: 2261. https://0-doi-org.brum.beds.ac.uk/10.3390/ijms21072261