Beneficial Effects of Melatonin on Apolipoprotein-E Knockout Mice by Morphological and 18F-FDG PET/CT Assessments

 , , , and
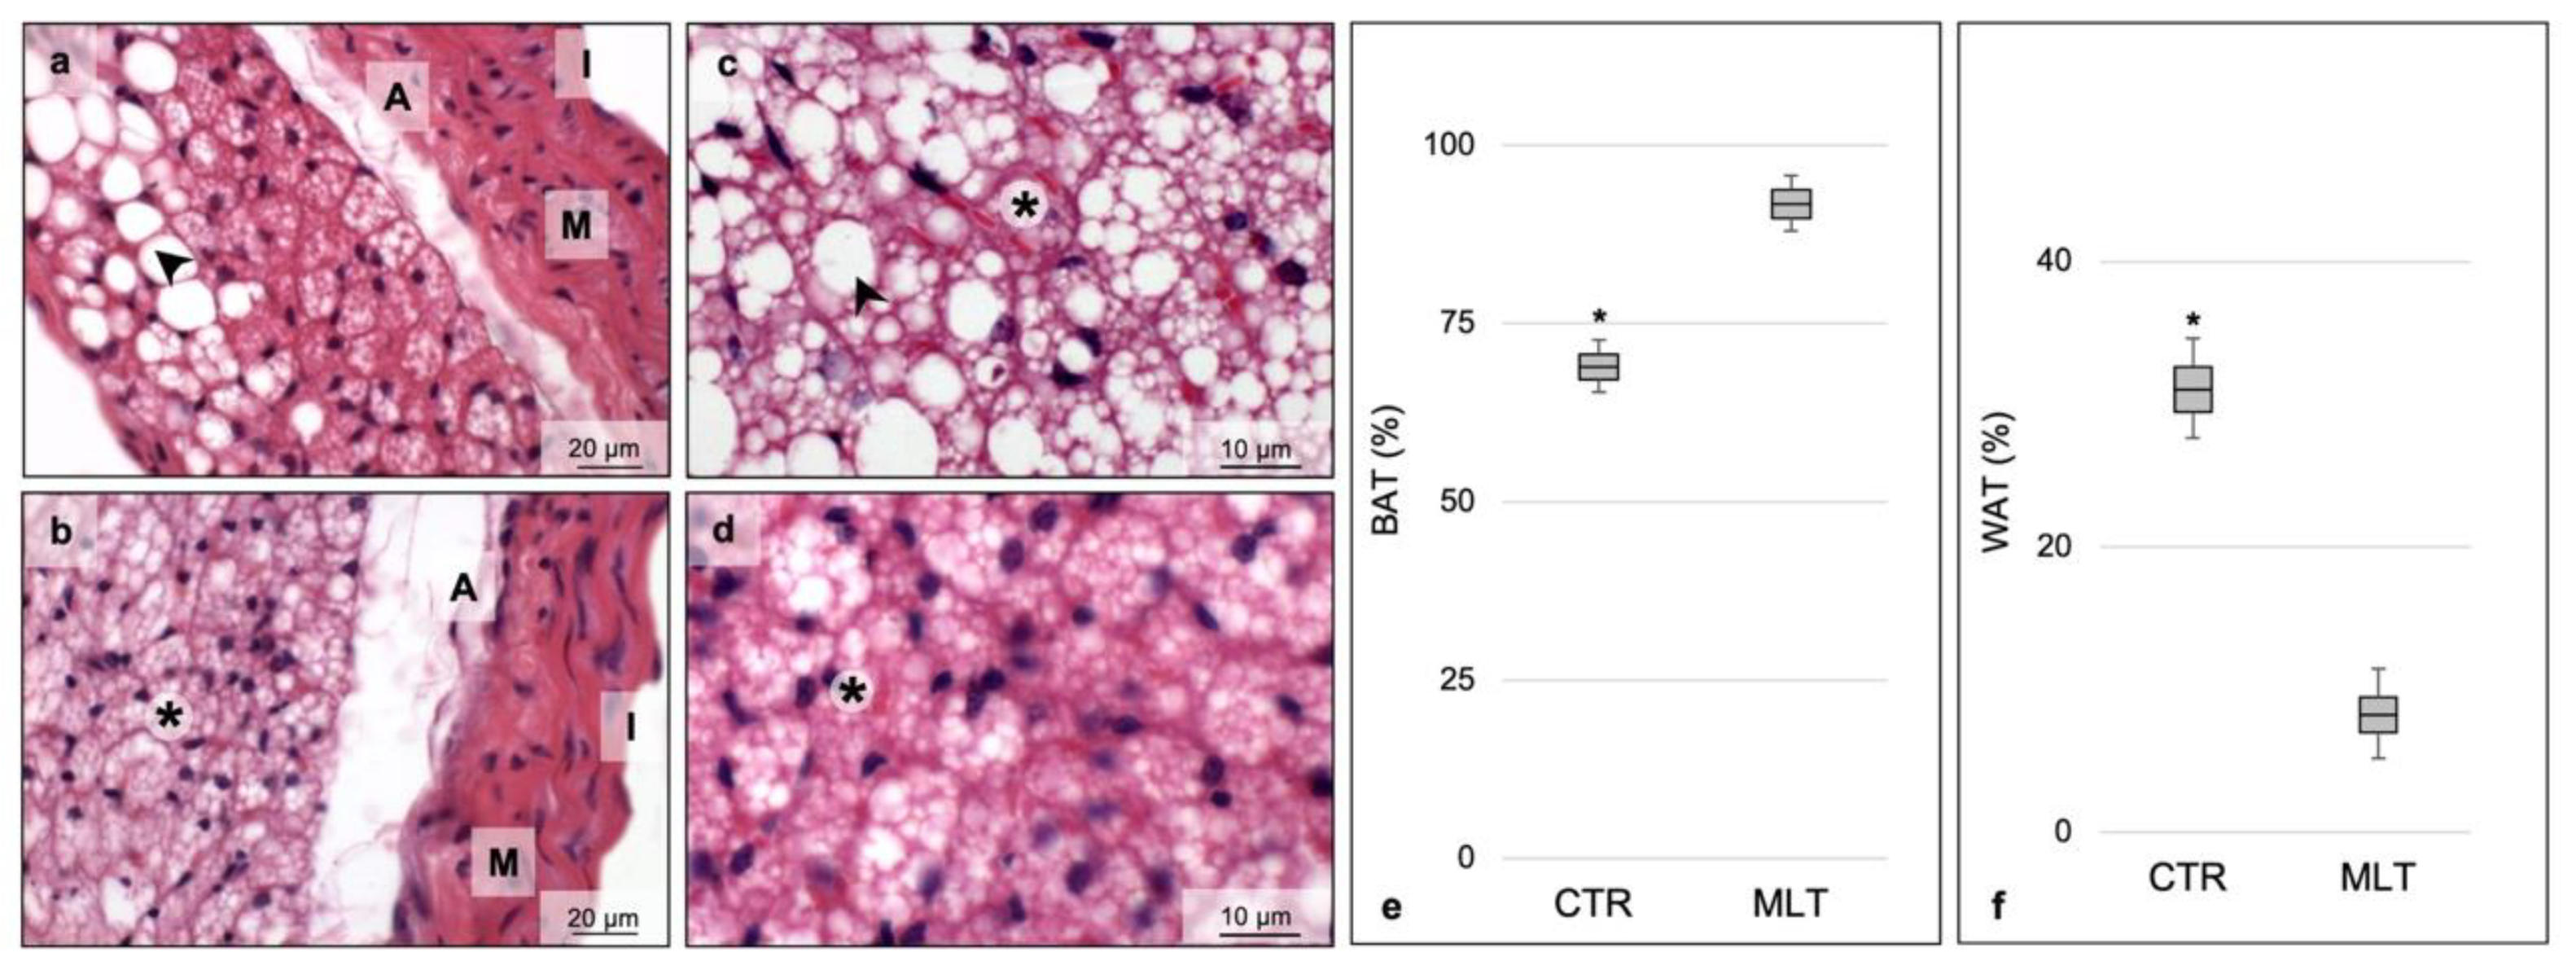
Abstract
:1. Introduction
2. Results
2.1. Melatonin Induces Browning of Periaortic Adipose Tissue
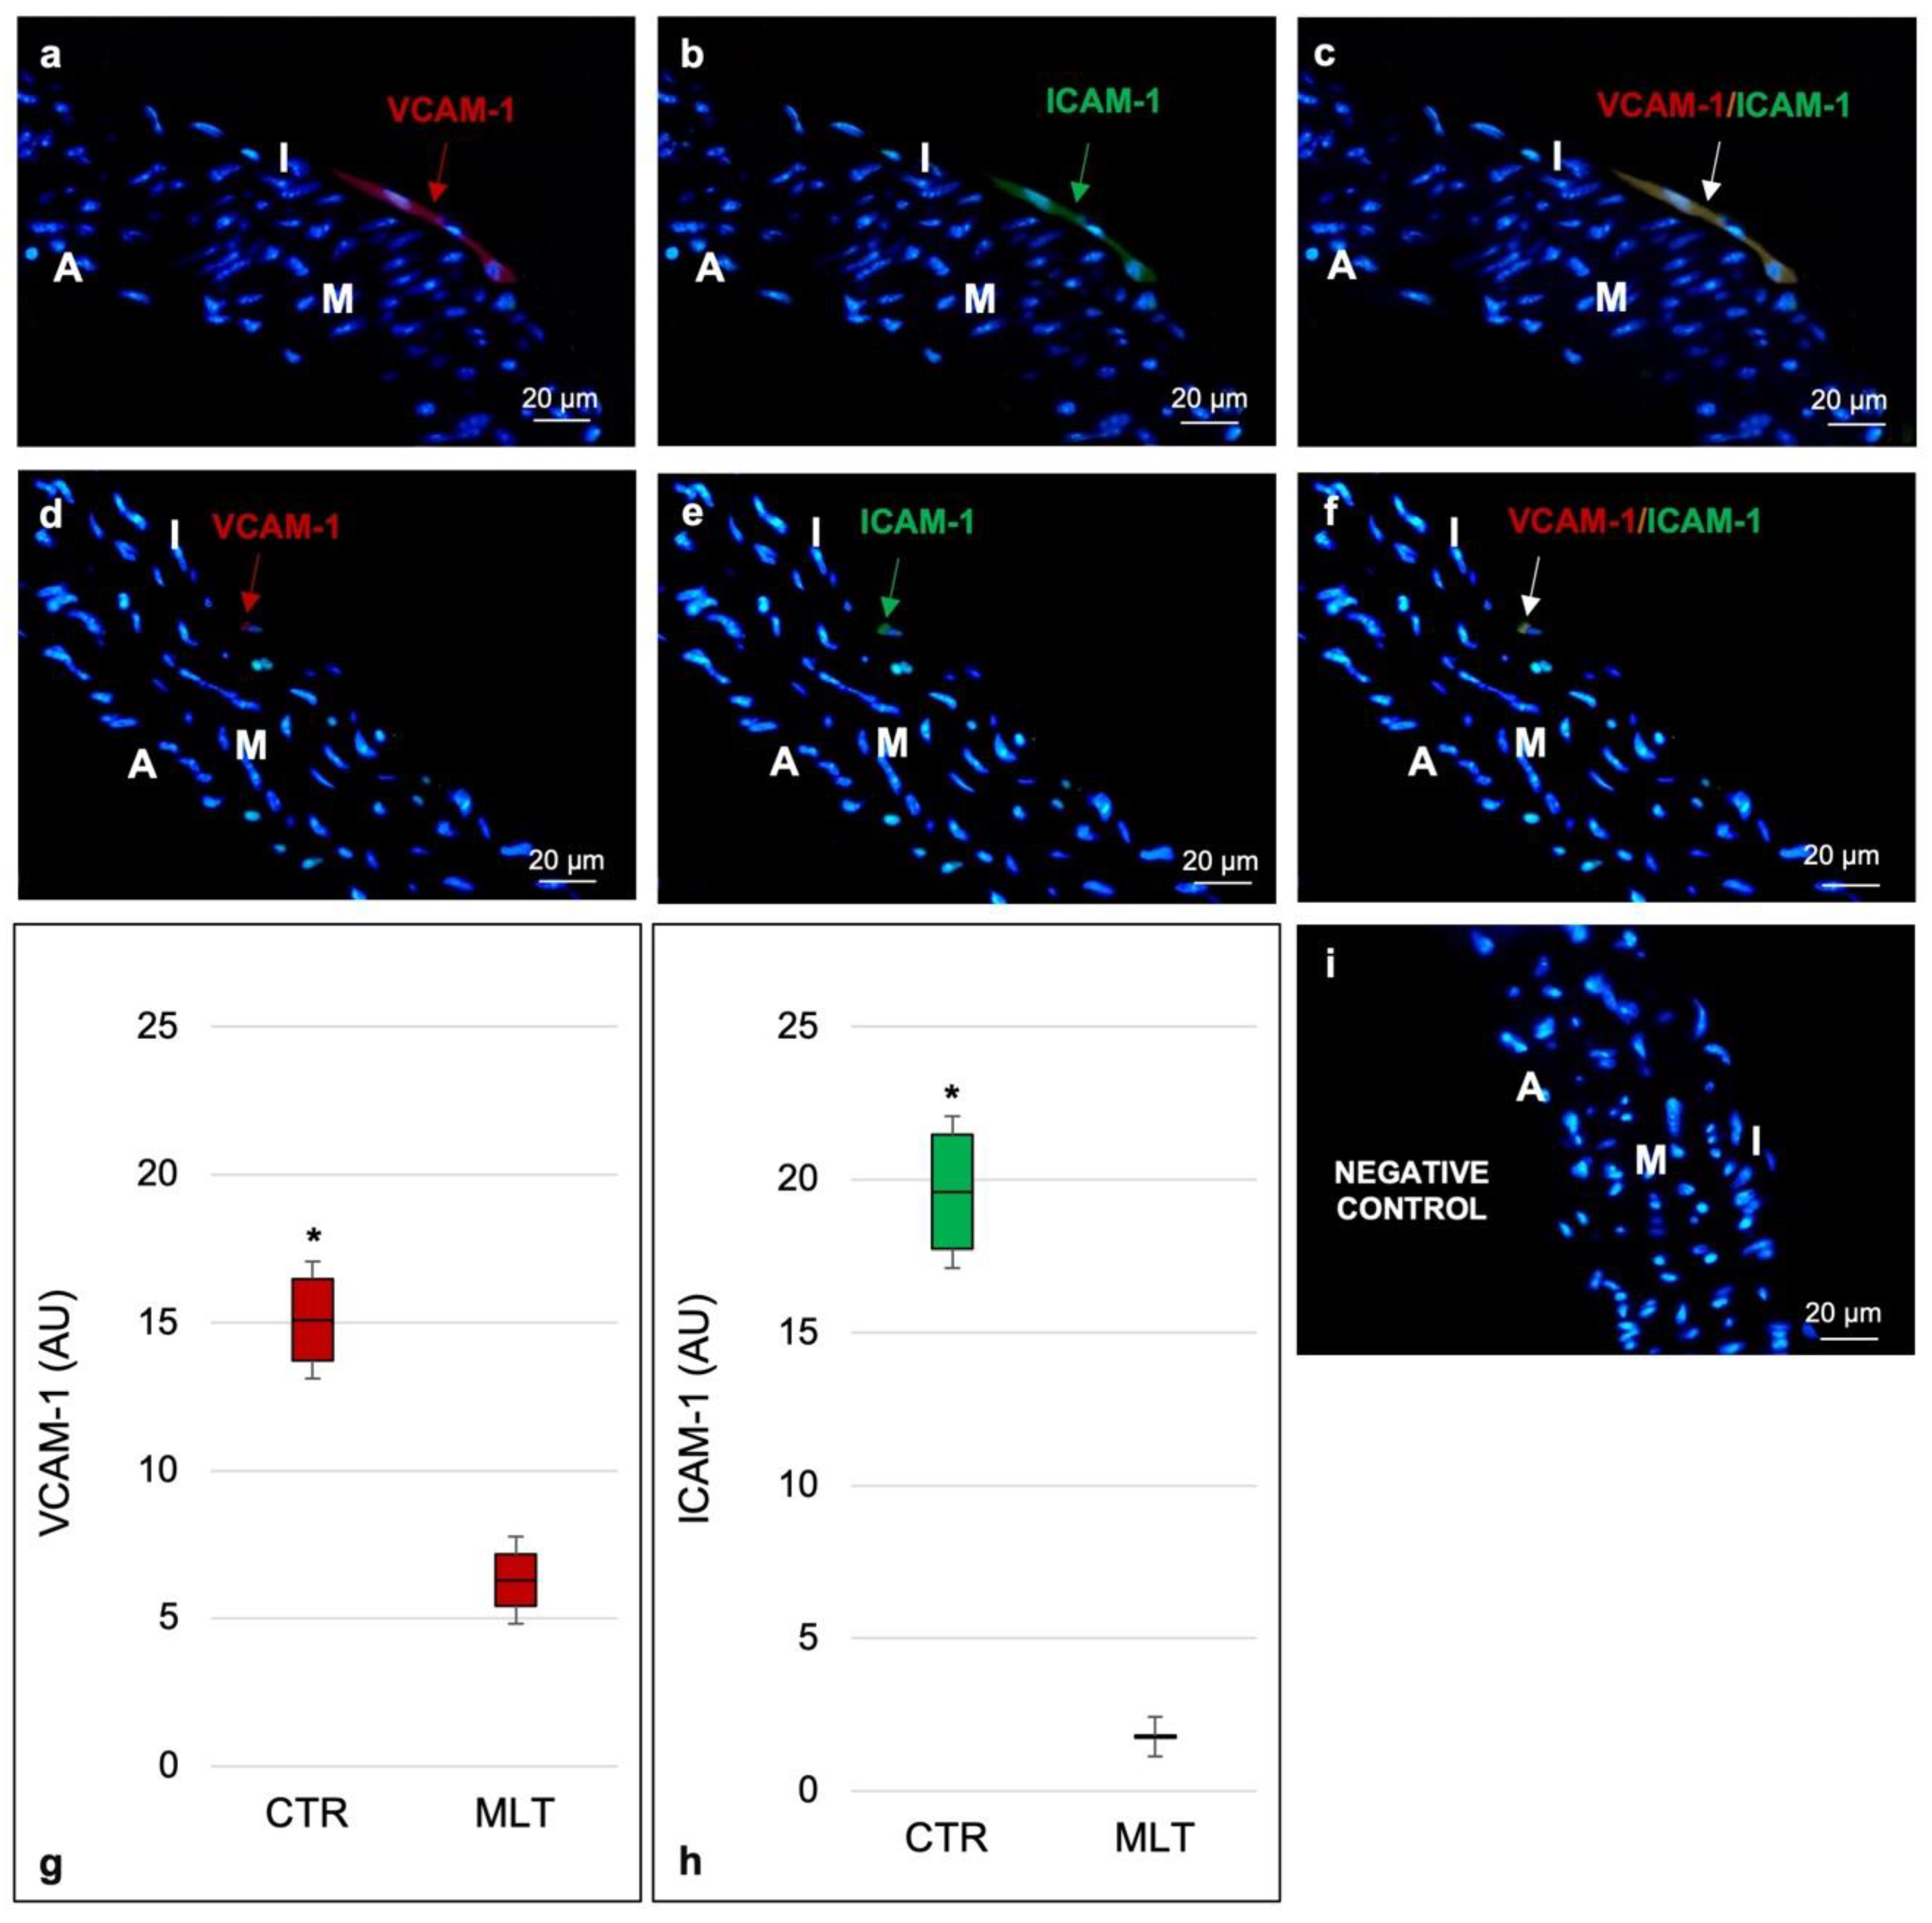
2.2. Aortic Inflammatory State
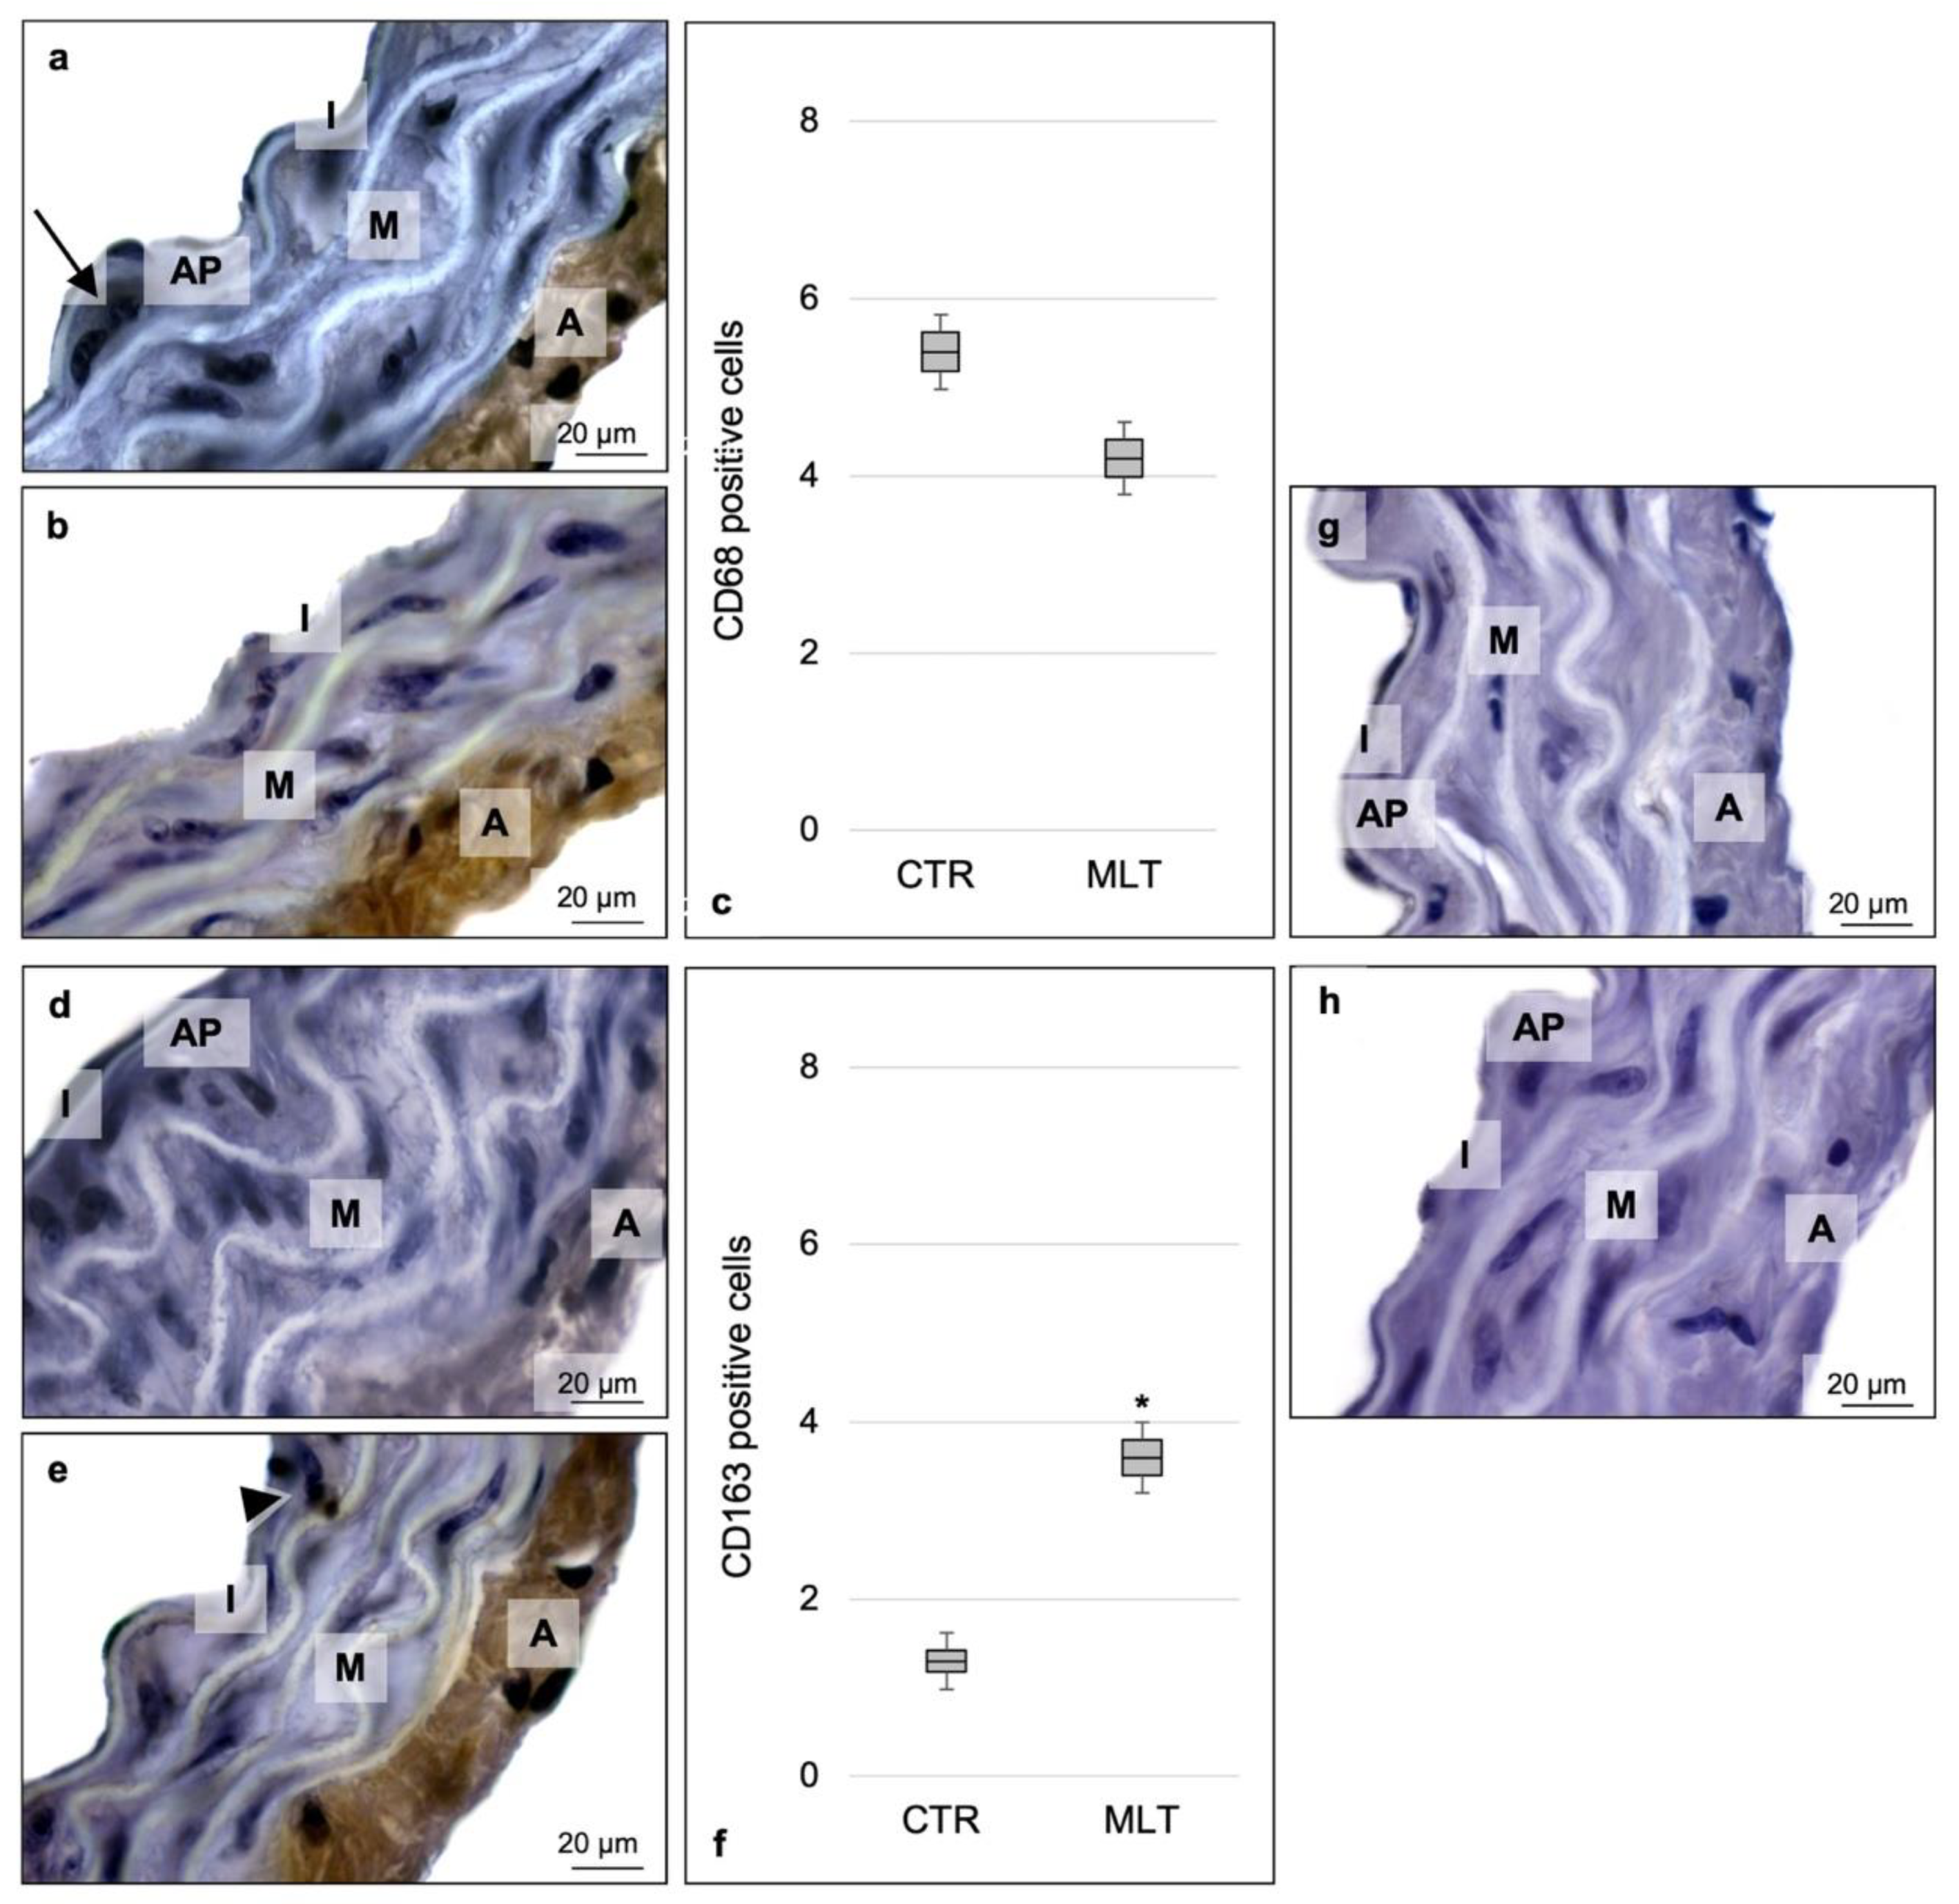
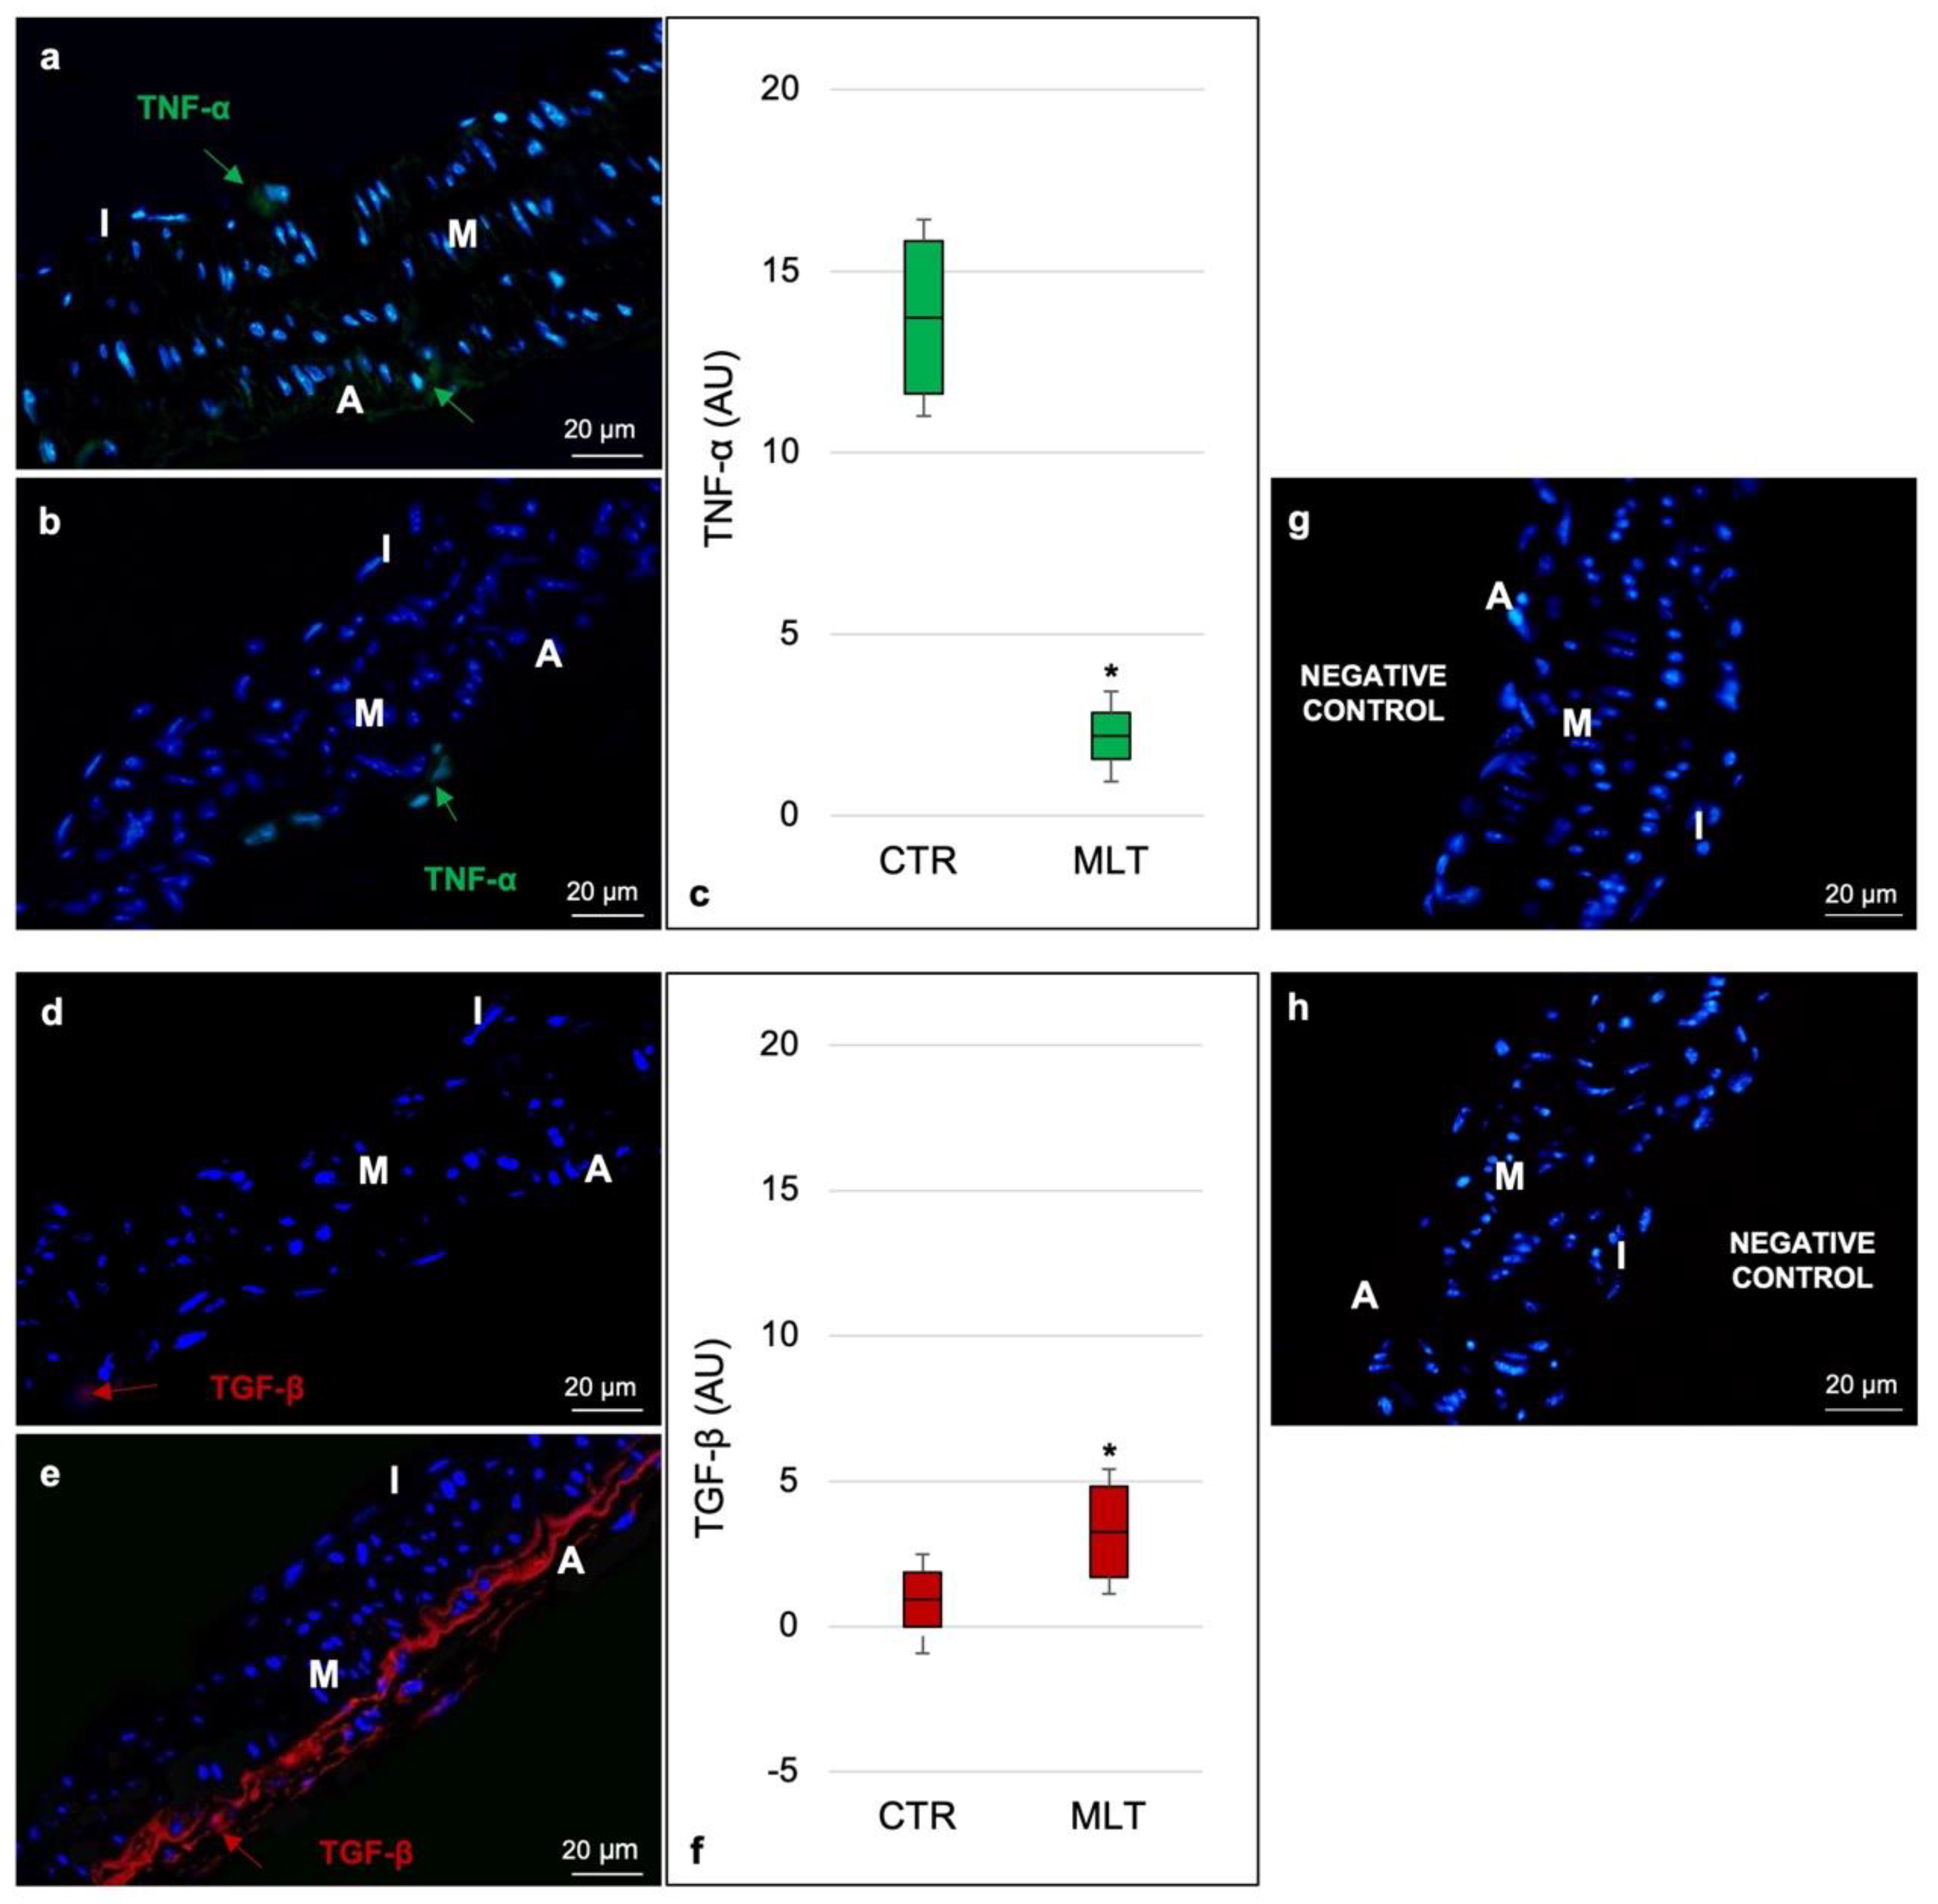
2.3. Macrophage Population and Related Cytokines
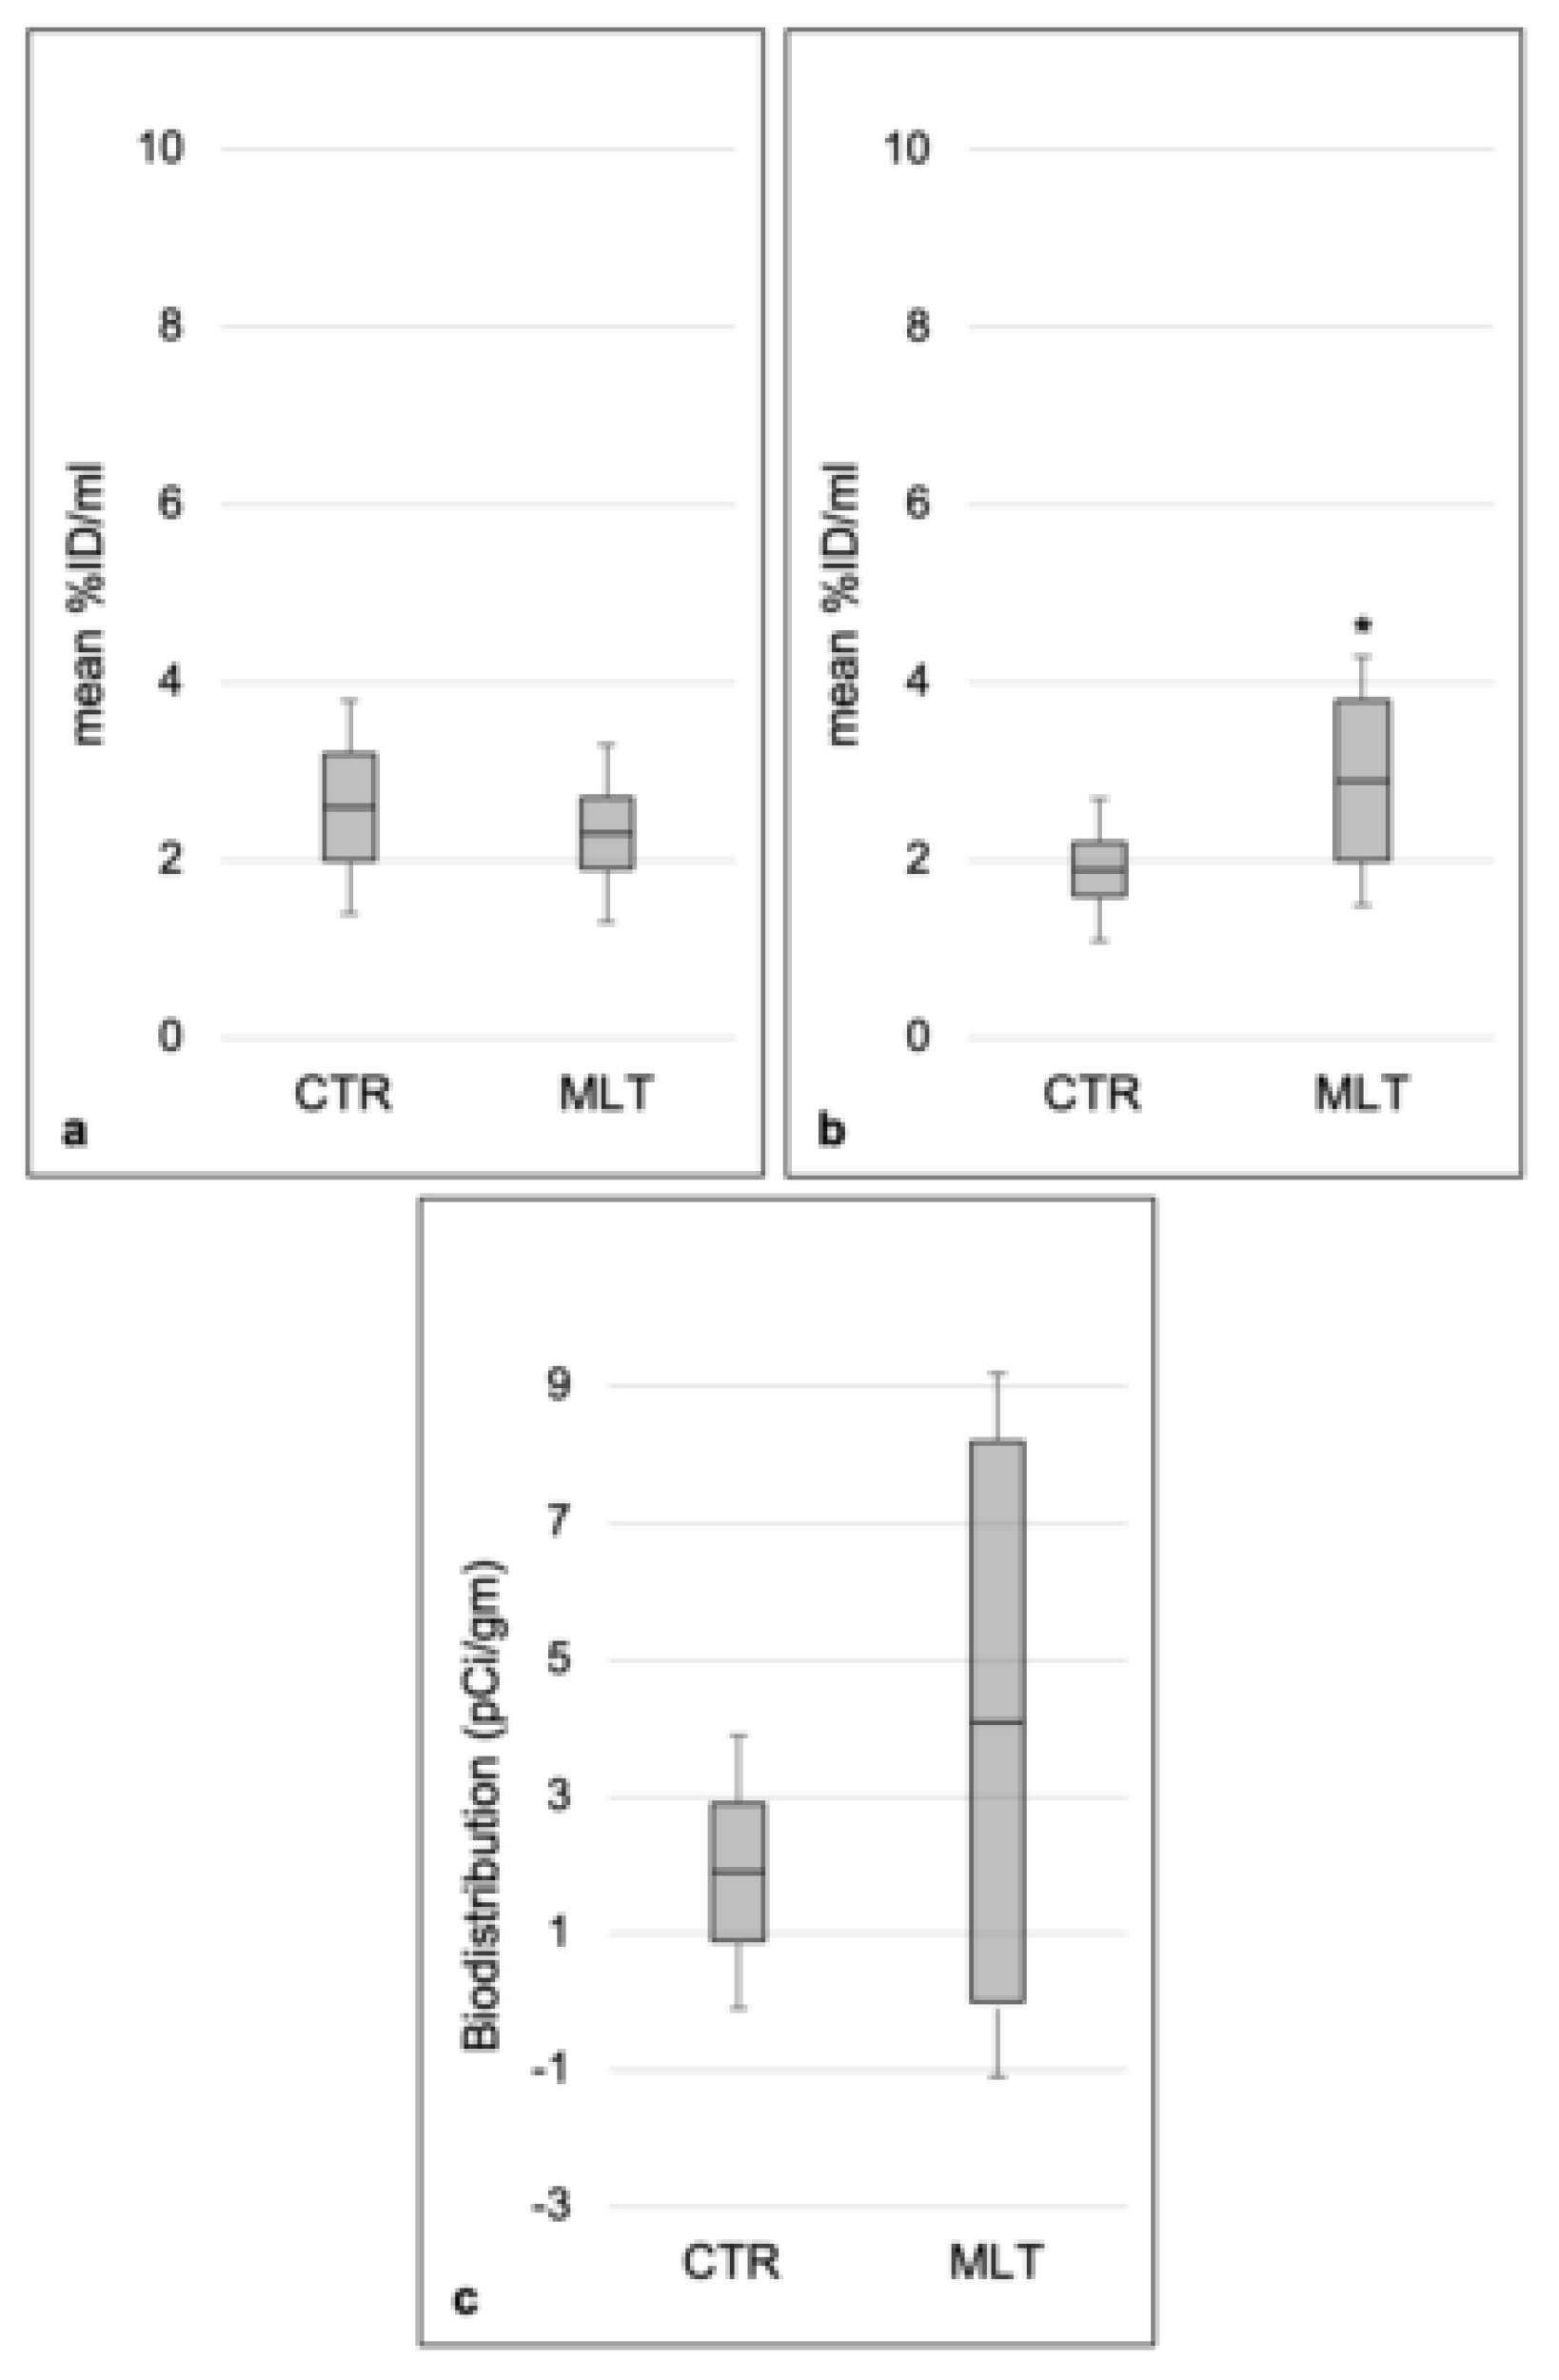
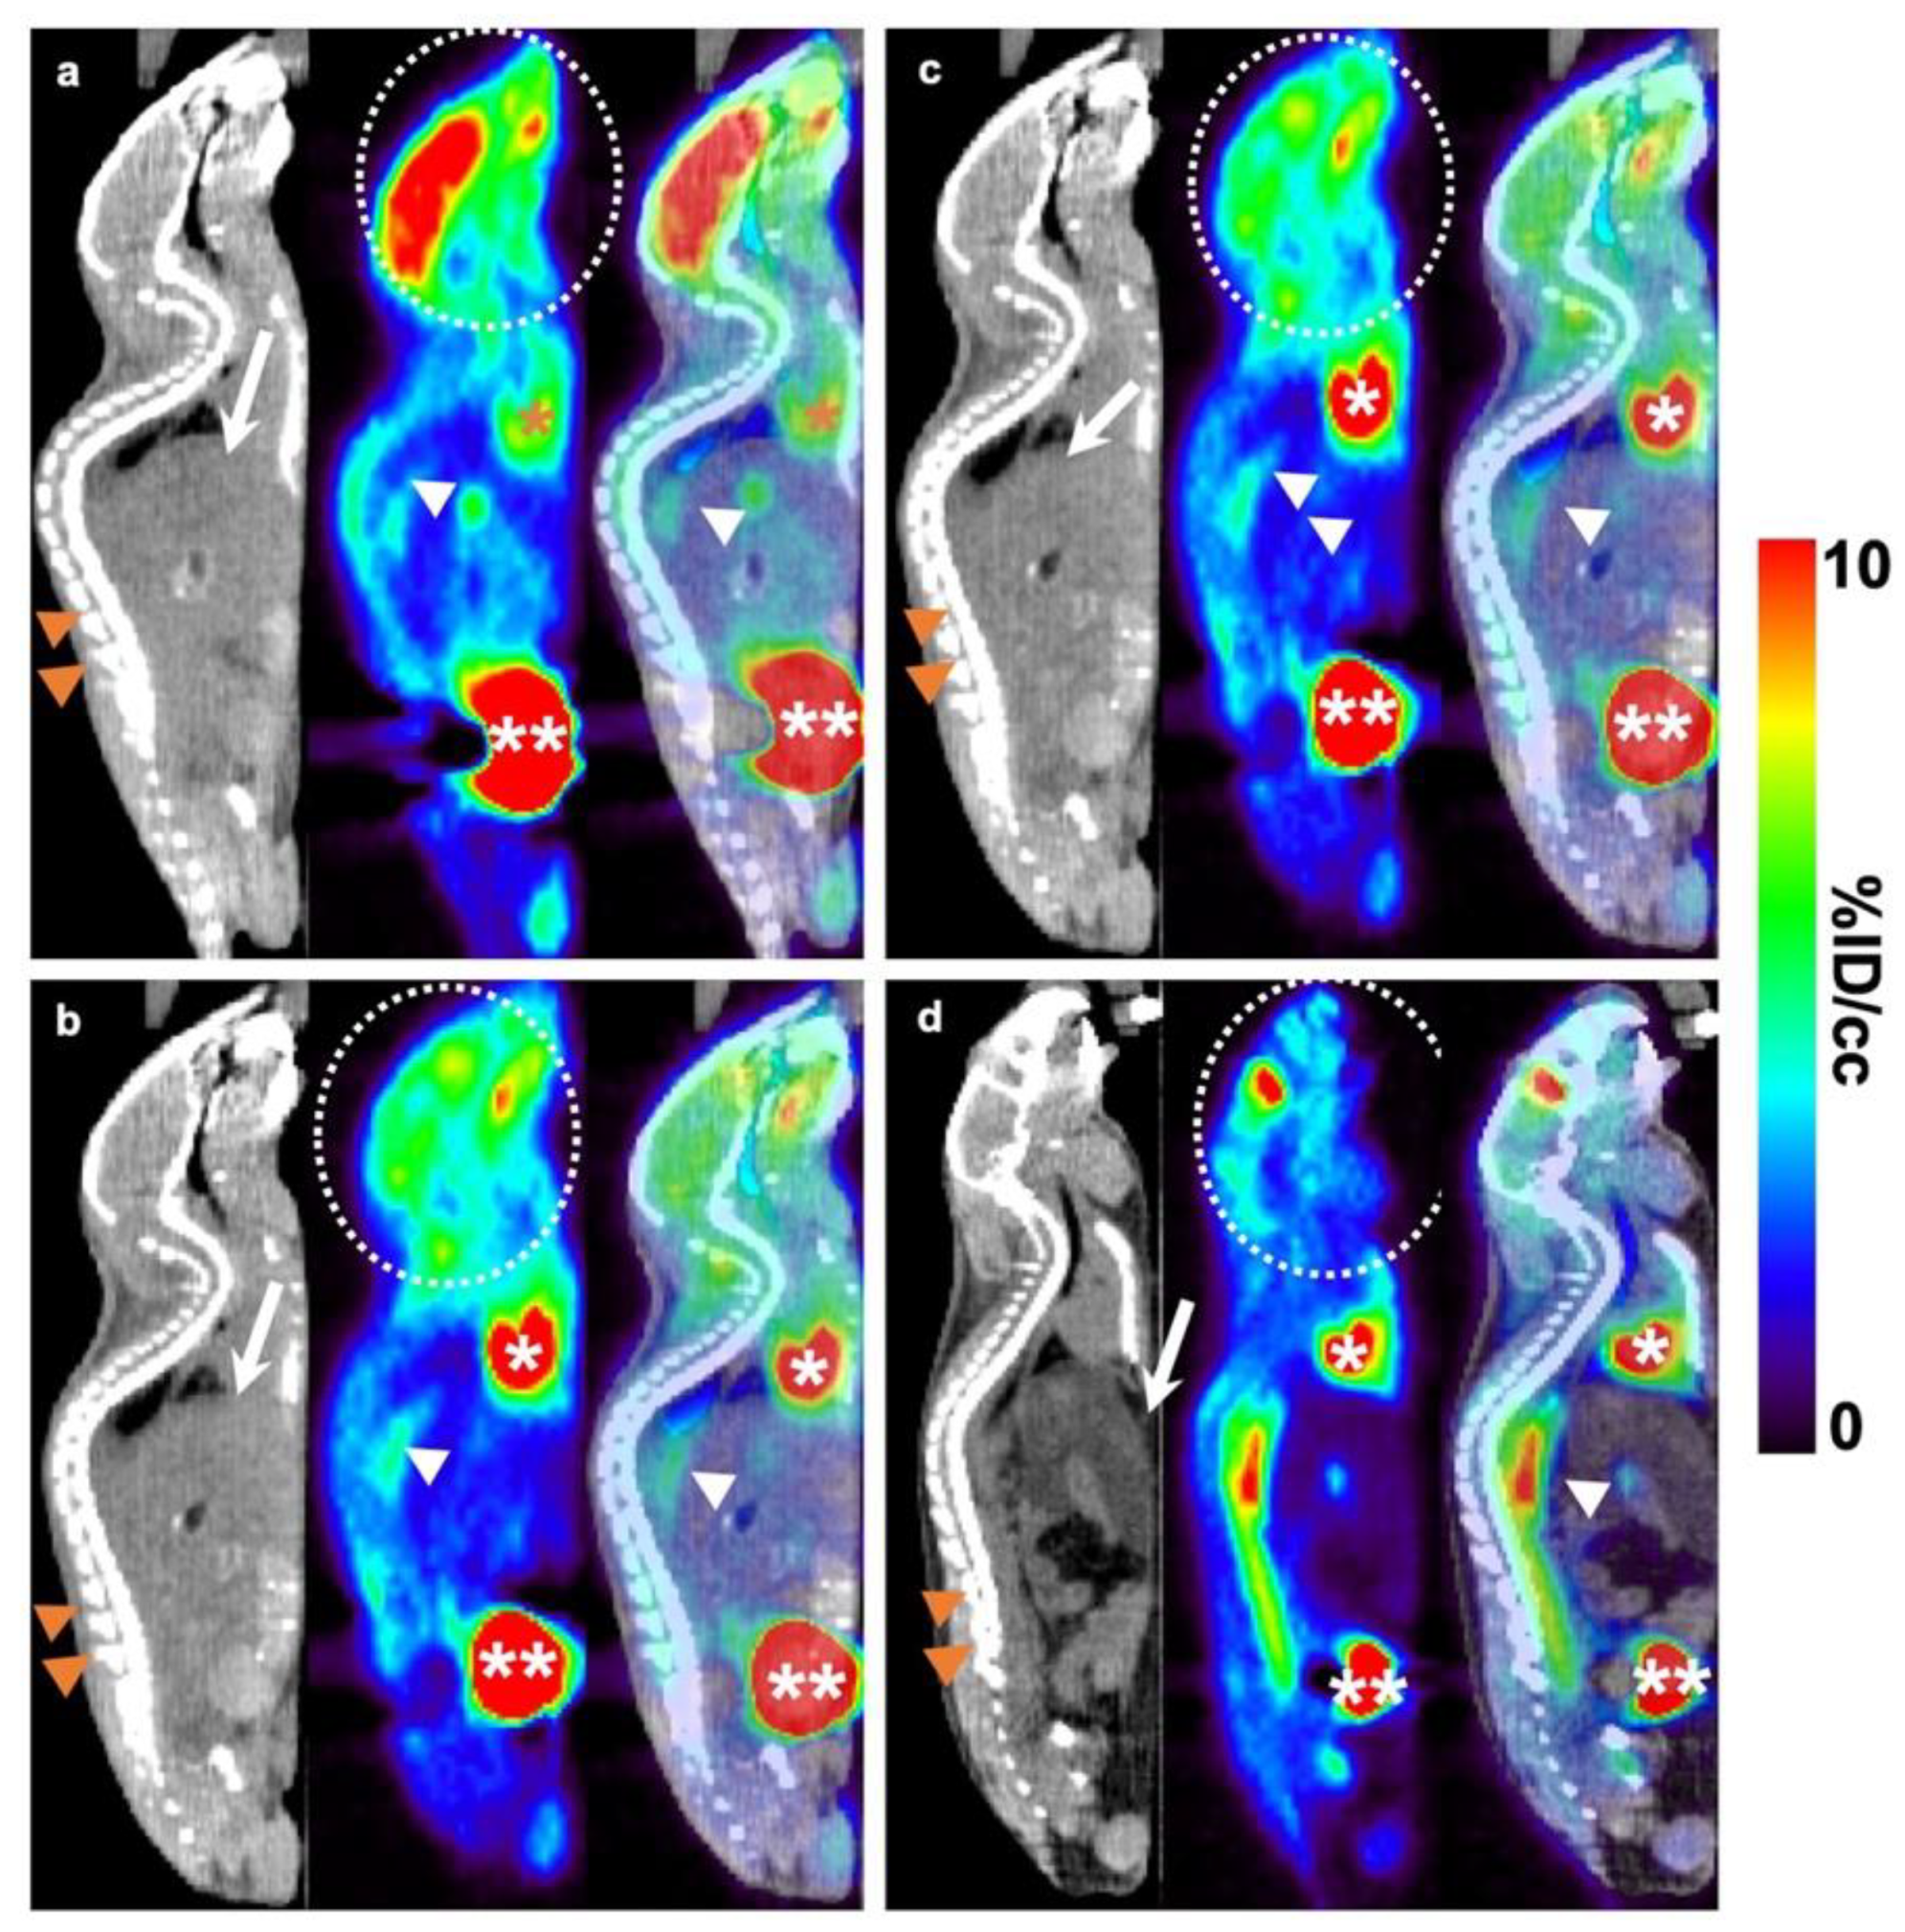
2.4. Aortic 18F-FDG PET/CT Evaluation
3. Discussion
4. Materials and Methods
4.1. Animals and Treatments
4.2. Histopathological Analyses
4.3. Morphometrical Analyses
4.4. Immunofluorescence, Immunohistochemistry, and Immunomorphometrical Analyses
4.5. 18F-FDG PET Imaging and Biodistribution
4.6. Statistical Analyses
Author Contributions
Funding
Acknowledgments
Conflicts of Interest
Abbreviations
| CVDs | Cardiovascular diseases |
| TNF-α | Tumor necrosis factor-α |
| TGF-β | Transforming growth factor-β |
| WAT | White adipose tissue |
| BAT | Brown adipose tissue |
| MLT | Melatonin |
| 18F-FDG | 18F- fluorodeoxyglucose |
| PET | Positron emission tomography |
| CT | Computed tomography |
| UCSF | University of California, San Francisco |
| IACUC | Institutional Animal Care and Use Committee |
| LARC | Laboratory Animal Research Center |
| AAALAC | Association for Assessment and Accreditation of Laboratory Animal Care |
| ApoE-/- | Apolipoprotein-E knockout |
| OSEM | Ordered subset expectation maximization |
| VOIs | Volumes of interest |
| %ID/ml | %injected dose per ml of tissue |
| pCi/g | Picocurie per gram |
| CD68 | Cluster of Differentiation 68 |
| CD163 | Cluster of Differentiation 163 |
| ICAM-1 | Intracellular adhesion molecule-1 |
| VCAM-1 | Vascular cellular adhesion molecule-1 |
| DAPI | 4′,6-diamidino-2-phenylindole |
| AU | Arbitrary units |
References
- Ridker, P.M.; Everett, B.M.; Thuren, T.; MacFadyen, J.G.; Chang, W.H.; Ballantyne, C.; Fonseca, F.; Nicolau, J.; Koenig, W.; Anker, S.D.; et al. Antiinflammatory Therapy with Canakinumab for Atherosclerotic Disease. N. Engl. J. Med. 2017, 377, 1119–1131. [Google Scholar] [CrossRef]
- Nahrendorf, M.; Swirski, F.K. Lifestyle effects on hematopoiesis and atherosclerosis. Circ. Res. 2015, 116, 884–894. [Google Scholar] [CrossRef] [PubMed] [Green Version]
- Chait, A.; den Hartigh, L.J. Adipose Tissue Distribution, Inflammation and Its Metabolic Consequences, Including Diabetes and Cardiovascular Disease. Front. Cardiovasc. Med. 2020, 7, 1–41. [Google Scholar] [CrossRef] [PubMed] [Green Version]
- Raggi, P.; Genest, J.; Giles, J.T.; Rayner, K.J.; Dwivedi, G.; Beanlands, R.S.; Gupta, M. Role of inflammation in the pathogenesis of atherosclerosis and therapeutic interventions. Atherosclerosis 2018, 276, 98–108. [Google Scholar] [CrossRef] [PubMed] [Green Version]
- Moriya, J. Critical roles of inflammation in atherosclerosis. J. Cardiol. 2019, 73, 22–27. [Google Scholar] [CrossRef] [PubMed] [Green Version]
- Ding, S.; Lin, N.; Sheng, X.; Zhao, Y.; Su, Y.; Xu, L.; Tong, R.; Yan, Y.; Fu, Y.; He, J.; et al. Melatonin stabilizes rupture-prone vulnerable plaques via regulating macrophage polarization in a nuclear circadian receptor RORα-dependent manner. J. Pineal. Res. 2019, 67, 12581–12596. [Google Scholar] [CrossRef] [PubMed]
- Barrett, T.J. Macrophages in Atherosclerosis Regression. Arterioscler. Thromb. Vasc. Biol. 2020, 40, 20–33. [Google Scholar] [CrossRef] [PubMed]
- Shapouri-Moghaddam, A.; Mohammadian, S.; Vazini, H.; Taghadosi, M.; Esmaeili, S.A.; Mardani, F.; Seifi, B.; Mohammadi, A.; Afshari, J.T.; Sahebkar, A. Macrophage plasticity, polarization, and function in health and disease. J. Cell. Physiol. 2018, 233, 6425–6440. [Google Scholar] [CrossRef]
- Queiroz, M.; Sena, C.M. Perivascular adipose tissue in age-related vascular disease. Aging Res. Rev. 2020, 59, 1–14, (Epub ahead of print). [Google Scholar] [CrossRef] [PubMed]
- Goldberg, I.J.; Sharma, G.; Fisher, E.A. Atherosclerosis: Making a U Turn. Annu. Rev. Med. 2020, 71, 191–201. [Google Scholar] [CrossRef] [Green Version]
- Tan, D.X.; Hardeland, R.; Manchester, L.C.; Korkmaz, A.; Ma, S.; Rosales-Corral, S.; Reiter, R.J. Functional roles of melatonin in plants, and perspectives in nutritional and agricultural science. J. Exp. Bot. 2012, 63, 577–597. [Google Scholar] [CrossRef] [PubMed]
- Meng, X.; Li, Y.; Li, S.; Zhou, Y.; Gan, R.Y.; Xu, D.P.; Li, H.B. Dietary Sources and Bioactivities of Melatonin. Nutrients 2017, 9, 367. [Google Scholar] [CrossRef] [PubMed] [Green Version]
- Li, H.; Li, J.; Jiang, X.; Liu, S.; Liu, Y.; Chen, W.; Yang, J.; Zhang, C.; Zhang, W. Melatonin enhances atherosclerotic plaque stability by inducing prolyl-4-hydroxylase α1 expression. J. Hypertens. 2019, 37, 964–971. [Google Scholar] [CrossRef] [PubMed]
- Favero, G.; Franceschetti, L.; Buffoli, B.; Moghadasian, M.H.; Reiter, R.J.; Rodella, L.F.; Rezzani, R. Melatonin: Protection against age-related cardiac pathology. Aging Res. Rev. 2017, 35, 336–349. [Google Scholar] [CrossRef] [PubMed]
- Favero, G.; Franceschetti, L.; Bonomini, F.; Rodella, L.F.; Rezzani, R. Melatonin as an Anti-Inflammatory Agent Modulating Inflammasome Activation. Int. J. Endocrinol. 2017, 2017, 1835195–1835208. [Google Scholar] [CrossRef] [PubMed] [Green Version]
- Hu, J.; Zhang, L.; Yang, Y.; Guo, Y.; Fan, Y.; Zhang, M.; Man, W.; Gao, E.; Hu, W.; Reiter, R.J.; et al. Melatonin alleviates postinfarction cardiac remodeling and dysfunction by inhibiting Mst1. J. Pineal Res. 2017, 62, 12368–12381. [Google Scholar] [CrossRef] [PubMed]
- Bonomini, F.; Borsani, E.; Favero, G.; Rodella, L.F.; Rezzani, R. Dietary Melatonin Supplementation Could Be a Promising Preventing/Therapeutic Approach for a Variety of Liver Diseases. Nutrients 2018, 10, 1135. [Google Scholar] [CrossRef] [Green Version]
- Hardeland, R. Melatonin and inflammation-Story of a double-edged blade. J. Pineal Res. 2018, 65, 12512–12538. [Google Scholar]
- Høilund-Carlsen, P.F.; Sturek, M.; Alavi, A.; Gerke, O. Atherosclerosis imaging with F-sodium fluoride PET: State-of-the-art review. Eur. J. Nucl. Med. Mol. Imag. 2019. (Epub ahead of print). [Google Scholar]
- Dunphy, M.P.; Freiman, A.; Larson, S.M.; Strauss, H.W. Association of vascular 18F-FDG uptake with vascular calcification. J. Nucl. Med. 2005, 46, 1278–1284. [Google Scholar]
- Rudd, J.H.; Myers, K.S.; Bansilal, S.; Machac, J.; Pinto, C.A.; Tong, C.; Rafique, A.; Hargeaves, R.; Farkouh, M.; Fuster, V.; et al. Atherosclerosis inflammation imaging with 18F-FDG PET: Carotid, iliac, and femoral uptake reproducibility, quantification methods, and recommendations. J. Nucl. Med. 2008, 49, 871–878. [Google Scholar] [PubMed] [Green Version]
- Al-Mashhadi, R.H.; Tolbod, L.P.; Bloch, L.Ø.; Bjørklund, M.M.; Nasr, Z.P.; Al-Mashhadi, Z.; Winterdahl, M.; Frøkiær, J.; Falk, E.; Bentzon, J.F. Fluorodeoxyglucose Accumulation in Arterial Tissues Determined by PET Signal Analysis. J. Am. Coll. Cardiol. 2019, 74, 1220–1232. [Google Scholar] [CrossRef] [PubMed]
- Ohashi, T.; Terasawa, K.; Aoki, M.; Akazawa, T.; Shibata, H.; Kuze, B.; Asano, T.; Kato, H.; Miyazaki, T.; Matsuo, M.; et al. The importance of FDG-PET/CT parameters for the assessment of the immune status in advanced HNSCC. Auris. Nasus. Larynx. 2020, in press. [Google Scholar] [CrossRef]
- Manieri, M.; Murano, I.; Fianchini, A.; Brunelli, A.; Cinti, S. Morphological and immunohistochemical features of brown adipocytes and preadipocytes in a case of human hibernoma. Nutr. Metab. Cardiovasc. Dis. 2010, 20, 567–574. [Google Scholar] [CrossRef]
- Favero, G.; Rodella, L.F.; Reiter, R.J.; Rezzani, R. Melatonin and its atheroprotective effects: A review. Mol. Cell. Endocrinol. 2014, 382, 926–937. [Google Scholar] [CrossRef]
- Li, H.Y.; Leu, Y.L.; Wu, Y.C.; Wang, S.H. Melatonin Inhibits In Vitro Smooth Muscle Cell Inflammation and Proliferation and Atherosclerosis in Apolipoprotein E-Deficient Mice. J. Agric. Food. Chem. 2019, 67, 1889–1901. [Google Scholar] [CrossRef]
- Gong, M.; Zhuo, X.; Ma, A. STAT6 Upregulation Promotes M2 Macrophage Polarization to Suppress Atherosclerosis. Med. Sci. Monit. Basic. Res. 2017, 15, 240–249. [Google Scholar] [CrossRef]
- de Gaetano, M.; Crean, D.; Barry, M.; Belton, O. M1- and M2-Type Macrophage Responses Are Predictive of Adverse Outcomes in Human Atherosclerosis. Front. Immunol. 2016, 7, 1–17. [Google Scholar] [CrossRef] [Green Version]
- Chinetti-Gbaguidi, G.; Baron, M.; Bouhlel, M.A.; Vanhoutte, J.; Copin, C.; Sebti, Y.; Derudas, B.; Mayi, T.; Bories, G.; Tailleux, A.; et al. Human atherosclerotic plaque alternative macrophages display low cholesterol handling but high phagocytosis because of distinct activities of the PPARγ and LXRα pathways. Circ. Res. 2011, 108, 985–995. [Google Scholar] [CrossRef]
- Chinetti-Gbaguidi, G.; Colin, S.; Staels, B. Macrophage subsets in atherosclerosis. Nat. Rev. Cardiol. 2015, 12, 10–17. [Google Scholar] [CrossRef]
- Bi, Y.; Chen, J.; Hu, F.; Liu, J.; Li, M.; Zhao, L. M2 Macrophages as a Potential Target for Antiatherosclerosis Treatment. Neural. Plast. 2019, 2019, 1–21. [Google Scholar] [CrossRef] [Green Version]
- Moos, M.P.; John, N.; Gräbner, R.; Nossmann, S.; Günther, B.; Vollandt, R.; Funk, C.D.; Kaiser, B.; Habenicht, A.J. The lamina adventitia is the major site of immune cell accumulation in standard chow-fed apolipoprotein E-deficient mice. Arterioscler. Thromb. Vasc. Biol. 2005, 25, 2386–2391. [Google Scholar] [CrossRef] [PubMed] [Green Version]
- Ahmadieh, S.; Kim, H.W.; Weintraub, N.L. Potential role of perivascular adipose tissue in modulating atherosclerosis. Clin. Sci. 2020, 134, 3–13. [Google Scholar] [CrossRef] [PubMed] [Green Version]
- Yang, S.; Yuan, H.Q.; Hao, Y.M.; Ren, Z.; Qu, S.L.; Liu, L.S.; Wei, D.H.; Tang, Z.H.; Zhang, J.F.; Jiang, Z.S. Macrophage polarization in atherosclerosis. Clin. Chim. Acta. 2020, 501, 142–146. [Google Scholar] [CrossRef] [PubMed]
- Masschelin, P.M.; Cox, A.R.; Chernis, N.; Hartig, S.M. The Impact of Oxidative Stress on Adipose Tissue Energy Balance. Front. Physiol. 2020, 10, 1–8. [Google Scholar] [CrossRef] [PubMed]
- You, M.; Fan, R.; Kim, J.; Shin, S.H.; Chung, S. Alpha-Linolenic Acid-Enriched Butter Promotes Fatty Acid Remodeling and Thermogenic Activation in the Brown Adipose Tissue. Nutrients 2020, 12, 136. [Google Scholar] [CrossRef] [PubMed] [Green Version]
- Raiko, J.; Orava, J.; Savisto, N.; Virtanen, K.A. High Brown Fat Activity Correlates with Cardiovascular Risk Factor Levels Cross-Sectionally and Subclinical Atherosclerosis at 5-Year Follow-up. Arterioscler. Thromb. Vasc. Biol. 2020. (Epub ahead of print). [Google Scholar] [CrossRef]
- Jiménez-Aranda, A.; Fernández-Vázquez, G.; Campos, D.; Tassi, M.; Velasco-Perez, L.; Tan, D.X.; Reiter, R.J.; Agil, A. Melatonin induces browning of inguinal white adipose tissue in Zucker diabetic fatty rats. J. Pineal Res. 2013, 55, 416–423. [Google Scholar] [CrossRef]
- De Souza, C.A.P.; Gallo, C.C.; de Camargo, L.S.; de Carvalho, P.V.V.; Olesçuck, I.F.; Macedo, F.; da Cunha, F.M.; Cipolla-Neto, J.; do Amaral, F.G. Melatonin multiple effects on brown adipose tissue molecular machinery. J. Pineal. Res. 2019, 66, 12549–12582. [Google Scholar] [CrossRef]
- Yao, Y.; Wang, Y.; Zhang, Y.; Li, Y.; Sheng, Z.; Wen, S.; Ma, G.; Liu, N.; Fang, F.; Teng, G.J. In vivo imaging of macrophages during the early stages of abdominal aortic aneurysm using high resolution MRI in ApoE mice. PLoS ONE 2012, 7, 33523–33532. [Google Scholar] [CrossRef]
- Blodgett, T.M.; Meltzer, C.C.; Townsend, D.W. PET/CT: Form and function. Radiology 2007, 242, 360–385. [Google Scholar] [CrossRef] [PubMed]
- Kim, I.J.; Kim, S.J.; Kim, Y.K. Age- and sex-associated changes in cerebral glucose metabolism in normal healthy subjects: Statistical parametric mapping analysis of F-18 fluorodeoxyglucose brain positron emission tomography. Acta. Radiol. 2009, 50, 1169–1174. [Google Scholar] [CrossRef] [PubMed]
- Büsing, K.A.; Schönberg, S.O.; Brade, J.; Wasser, K. Impact of blood glucose, diabetes, insulin, and obesity on standardized uptake values in tumors and healthy organs on 18F-FDG PET/CT. Nucl. Med. Biol. 2013, 40, 206–213. [Google Scholar] [CrossRef] [PubMed]
- Na, K.J.; Choi, H. Tumor Metabolic Features Identified by F-FDG PET Correlate with Gene Networks of Immune Cell Microenvironment in Head and Neck Cancer. J. Nucl. Med. 2018, 59, 31–37. [Google Scholar] [CrossRef] [PubMed] [Green Version]
- Hany, T.F.; Gharehpapagh, E.; Kamel, E.M.; Buck, A.; Himms-Hagen, J.; von Schulthess, G.K. Brown adipose tissue: A factor to consider in symmetrical tracer uptake in the neck and upper chest region. Eur. J. Nucl. Med. Mol. Imaging 2002, 29, 1393–1398. [Google Scholar] [CrossRef]
- Pace, L.; Nicolai, E.; Basso, L.; Garbino, N.; Soricelli, A.; Salvatore, M. Brown Adipose Tissue in Breast Cancer Evaluated by (F) FDG-PET/CT. Mol. Imaging. Biol. 2020. (Epub ahead of print). [Google Scholar] [CrossRef]
- Laurberg, J.M.; Olsen, A.K.; Hansen, S.B.; Bottcher, M.; Morrison, M.; Ricketts, S.A.; Falk, E. Imaging of vulnerable atherosclerotic plaques with FDG-microPET: No FDG accumulation. Atherosclerosis 2007, 192, 275–282. [Google Scholar] [CrossRef]
- Toczek, J.; Broisat, A.; Perret, P.; Desruet, M.D.; Fagret, D.; Riou, L.M.; Ghezzi, C. Periaortic brown adipose tissue as a major determinant of (¹⁸F)-fluorodeoxyglucose vascular uptake in atherosclerosis-prone, apoE-/- mice. PLoS ONE 2014, 9, 9941–9950. [Google Scholar] [CrossRef] [Green Version]
- Oliver, P.; Lombardi, A.; De Matteis, R. Editorial: Insights into Brown Adipose Tissue Functions and Browning Phenomenon. Front. Physiol. 2020, 11, 1–3. [Google Scholar] [CrossRef]
- Rezzani, R.; Favero, G.; Stacchiotti, A.; Rodella, L.F. Endothelial and vascular smooth muscle cell dysfunction mediated by cyclophylin A and the atheroprotective effects of melatonin. Life Sci. 2013, 92, 875–882. [Google Scholar] [CrossRef]
- Rodella, L.F.; Favero, G.; Foglio, E.; Rossini, C.; Castrezzati, S.; Lonati, C.; Rezzani, R. Vascular endothelial cells and dysfunctions: Role of melatonin. Front. Biosci. 2013, 5, 119–129. [Google Scholar]
- Favero, G.; Stacchiotti, A.; Castrezzati, S.; Bonomini, F.; Albanese, M.; Rezzani, R.; Rodella, L.F. Melatonin reduces obesity and restores adipokine patterns and metabolism in obese (ob/ob) mice. Nutr. Res. 2015, 35, 891–900. [Google Scholar] [CrossRef] [PubMed]
- Giordano, A.; Frontini, A.; Cinti, S. Convertible visceral fat as a therapeutic target to curb obesity. Nat. Rev. Drug. Discov. 2016, 15, 405–424. [Google Scholar] [CrossRef] [PubMed]
- Bonomini, F.; Taurone, S.; Parnigotto, P.; Zamai, L.; Rodella, L.F.; Artico, M.; Rezzani, R. Role of parnaparin in atherosclerosis. Int. J. Exp. Pathol. 2016, 97, 457–464. [Google Scholar] [CrossRef] [PubMed]
- Rodella, L.F.; Rossini, C.; Favero, G.; Foglio, E.; Loreto, C.; Rezzani, R. Nicotine-induced morphological changes in rat aorta: The protective role of melatonin. Cells Tissues Organs 2012, 195, 252–259. [Google Scholar] [CrossRef] [PubMed]
- Favero, G.; Trapletti, V.; Bonomini, F.; Stacchiotti, A.; Lavazza, A.; Rodella, L.F.; Rezzani, R. Oral Supplementation of Melatonin Protects against Fibromyalgia-Related Skeletal Muscle Alterations in Reserpine-Induced Myalgia Rats. Int. J. Mol. Sci. 2017, 18, 1389. [Google Scholar] [CrossRef] [Green Version]
- Oliveira, V.A.; Favero, G.; Stacchiotti, A.; Giugno, L.; Buffoli, B.; de Oliveira, C.S.; Lavazza, A.; Albanese, M.; Rodella, L.F.; Pereira, M.E.; et al. Acute mercury exposition of virgin, pregnant, and lactating rats: Histopathological kidney and liver evaluations. Environ. Toxicol. 2017, 32, 1500–1512. [Google Scholar] [CrossRef]
- Favero, G.; Paini, A.; De Ciuceis, C.; Rodella, L.F.; Moretti, E.; Porteri, E.; Rossini, C.; Ministrini, S.; Solaini, L.; Stefano, C.; et al. Changes in extracellular matrix in subcutaneous small resistance arteries of patients with essential hypertension. Blood Press. 2018, 27, 231–239. [Google Scholar] [CrossRef]
- Agabiti-Rosei, C.; Favero, G.; De Ciuceis, C.; Rossini, C.; Porteri, E.; Rodella, L.F.; Franceschetti, L.; Maria Sarkar, A.; Agabiti-Rosei, E.; Rizzoni, D.; et al. Effect of long-term treatment with melatonin on vascular markers of oxidative stress/inflammation and on the anticontractile activity of perivascular fat in aging mice. Hypertens. Res. 2017, 40, 41–50. [Google Scholar] [CrossRef]
- Bonomini, F.; Favero, G.; Rodella, L.F.; Moghadasian, M.H.; Rezzani, R. Melatonin modulation of sirtuin-1 attenuates liver injury in a hypercholesterolemic mouse model. Biomed. Res. Int. 2018, 2018, 1–9. [Google Scholar] [CrossRef] [Green Version]
- Loening, A.M.; Gambhir, S.S. AMIDE: A free software tool for multimodality medical image analysis. Mol. Imaging 2003, 2, 131–137. [Google Scholar] [PubMed]


© 2020 by the authors. Licensee MDPI, Basel, Switzerland. This article is an open access article distributed under the terms and conditions of the Creative Commons Attribution (CC BY) license (http://creativecommons.org/licenses/by/4.0/).
Share and Cite
Nardo, L.; Rezzani, R.; Facchetti, L.; Favero, G.; Franco, C.; Abdelhafez, Y.G.; Badawi, R.D.; Guindani, M.; Seo, Y.; Pampaloni, M. Beneficial Effects of Melatonin on Apolipoprotein-E Knockout Mice by Morphological and 18F-FDG PET/CT Assessments. Int. J. Mol. Sci. 2020, 21, 2920. https://0-doi-org.brum.beds.ac.uk/10.3390/ijms21082920
Nardo L, Rezzani R, Facchetti L, Favero G, Franco C, Abdelhafez YG, Badawi RD, Guindani M, Seo Y, Pampaloni M. Beneficial Effects of Melatonin on Apolipoprotein-E Knockout Mice by Morphological and 18F-FDG PET/CT Assessments. International Journal of Molecular Sciences. 2020; 21(8):2920. https://0-doi-org.brum.beds.ac.uk/10.3390/ijms21082920
Chicago/Turabian StyleNardo, Lorenzo, Rita Rezzani, Luca Facchetti, Gaia Favero, Caterina Franco, Yasser Gaber Abdelhafez, Ramsey Derek Badawi, Michele Guindani, Youngho Seo, and Miguel Pampaloni. 2020. "Beneficial Effects of Melatonin on Apolipoprotein-E Knockout Mice by Morphological and 18F-FDG PET/CT Assessments" International Journal of Molecular Sciences 21, no. 8: 2920. https://0-doi-org.brum.beds.ac.uk/10.3390/ijms21082920