
Metabolic Disturbances in Rat Sublines with Constitutionally Altered Serotonin Homeostasis

 , and
, and 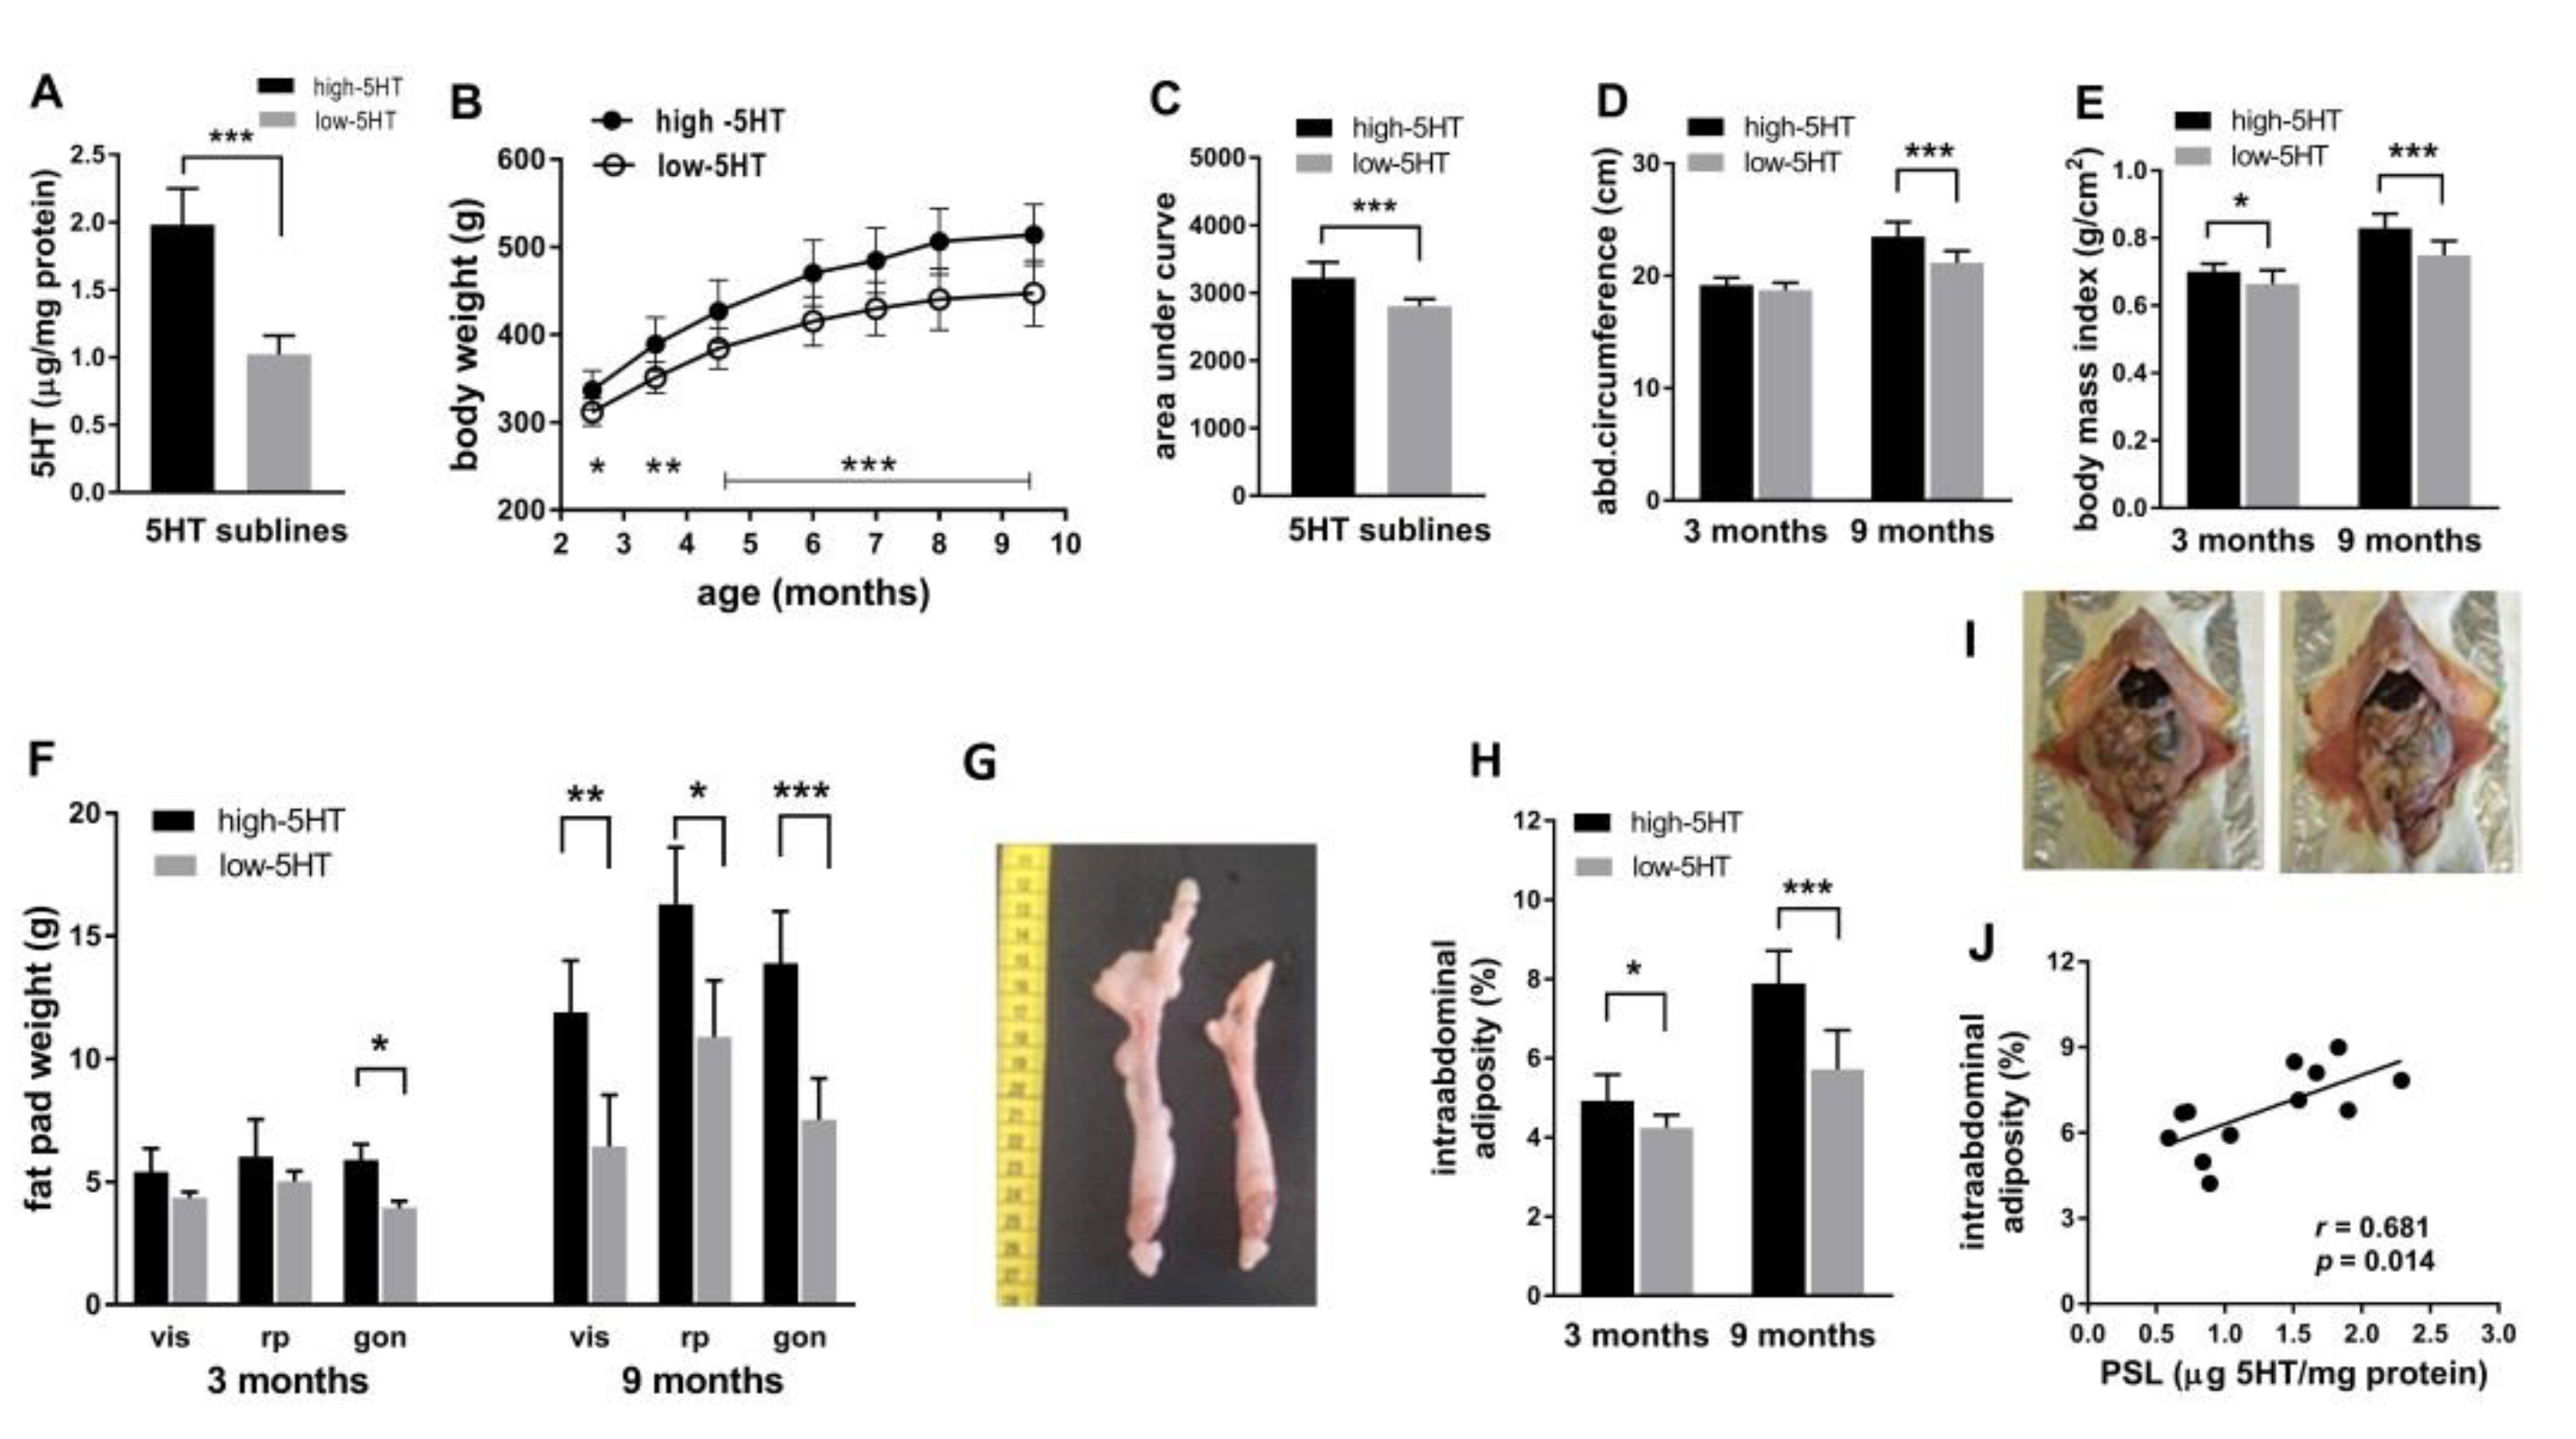
Abstract
:1. Introduction
2. Results
2.1. Body Weight and Composition across Lifespan
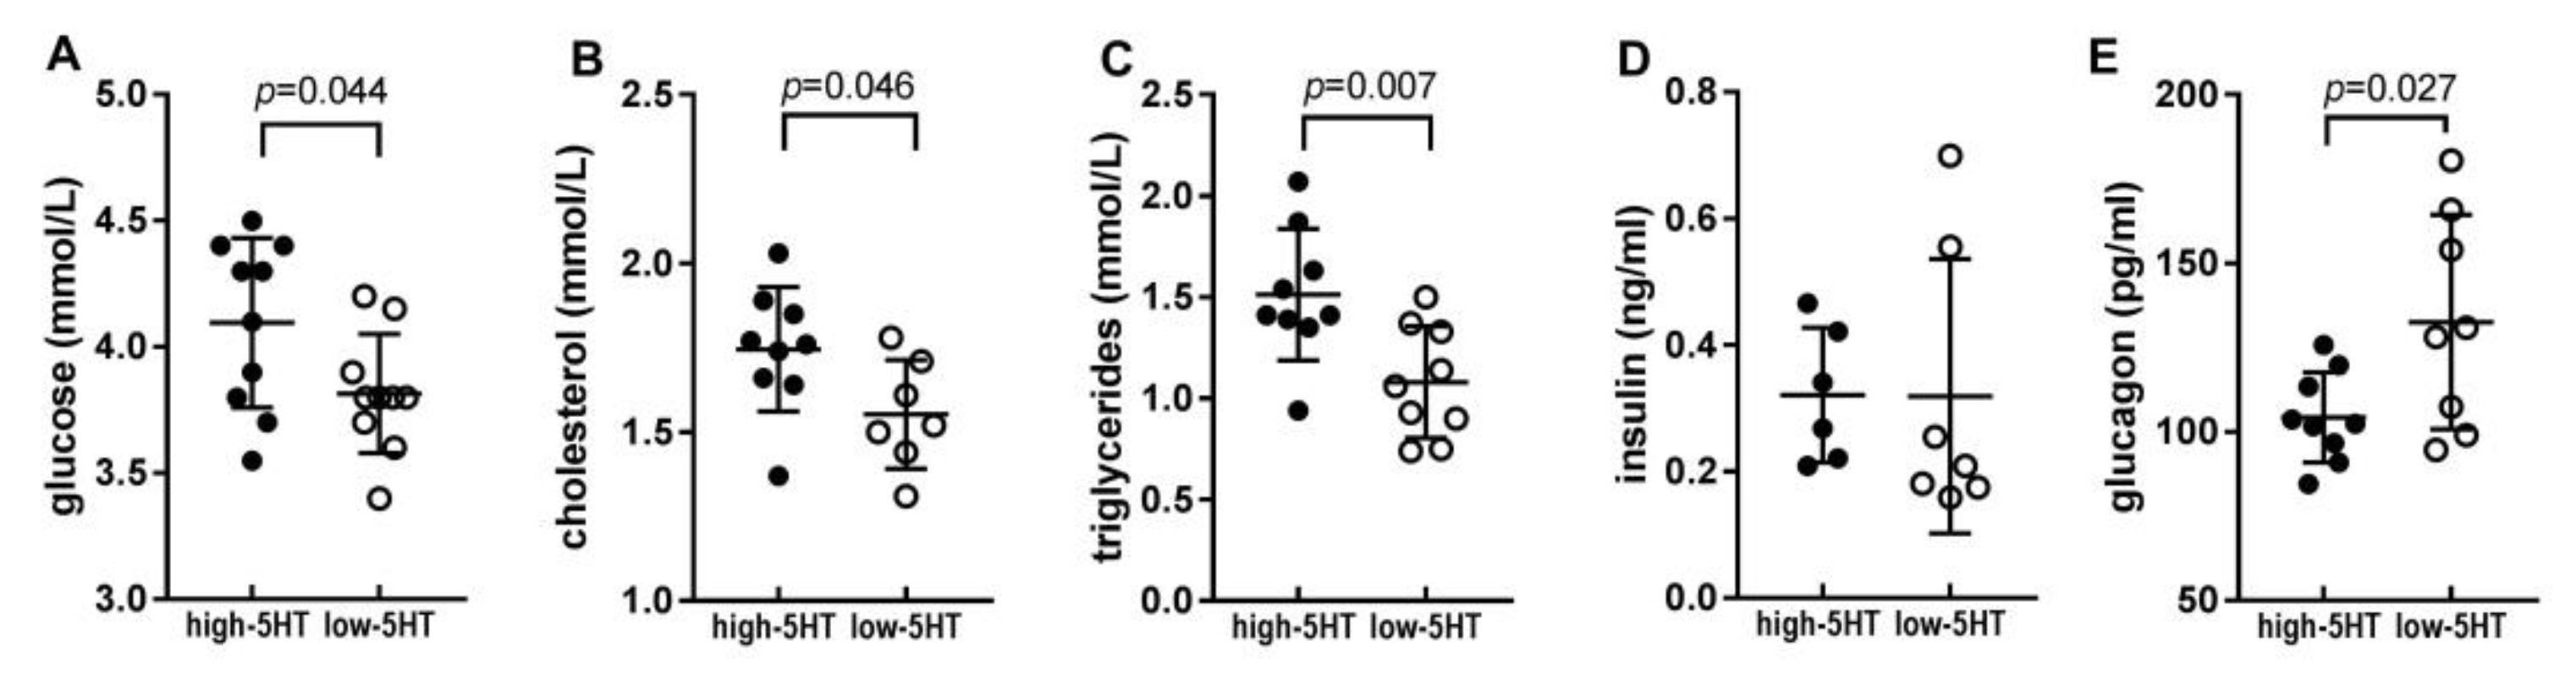
2.2. Blood Metabolic Parameters
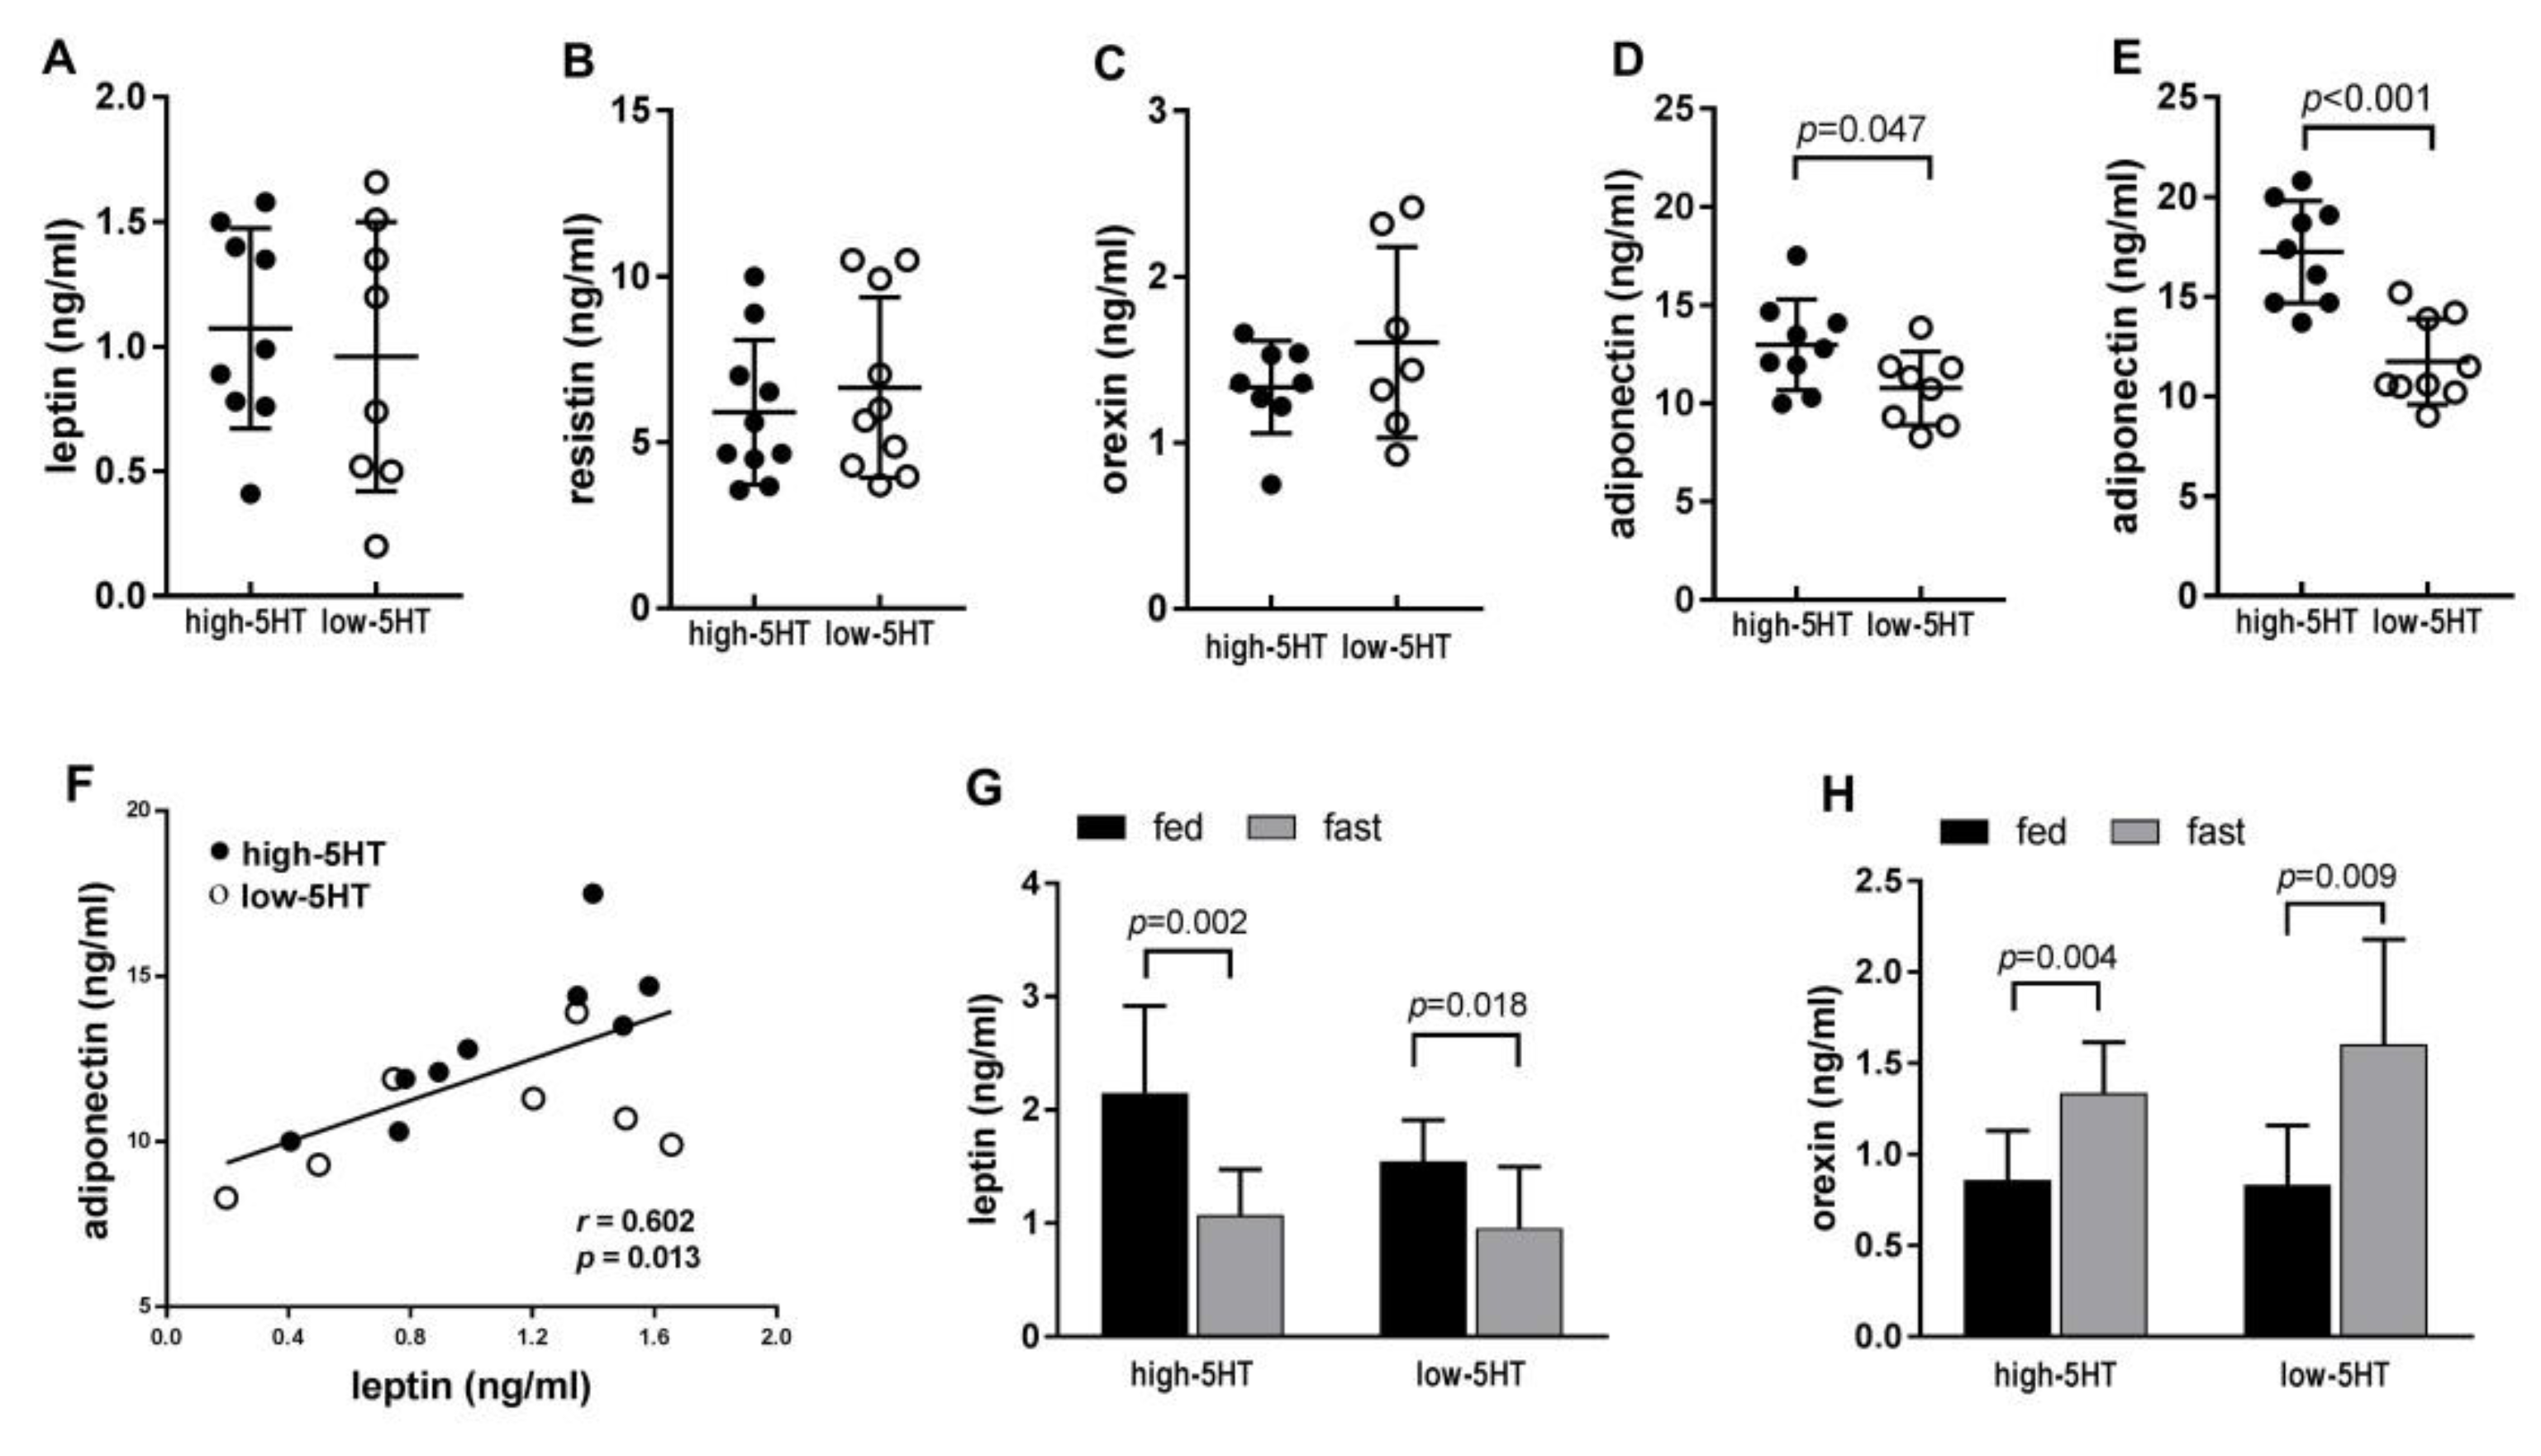
2.3. Adipokine Levels in the Blood
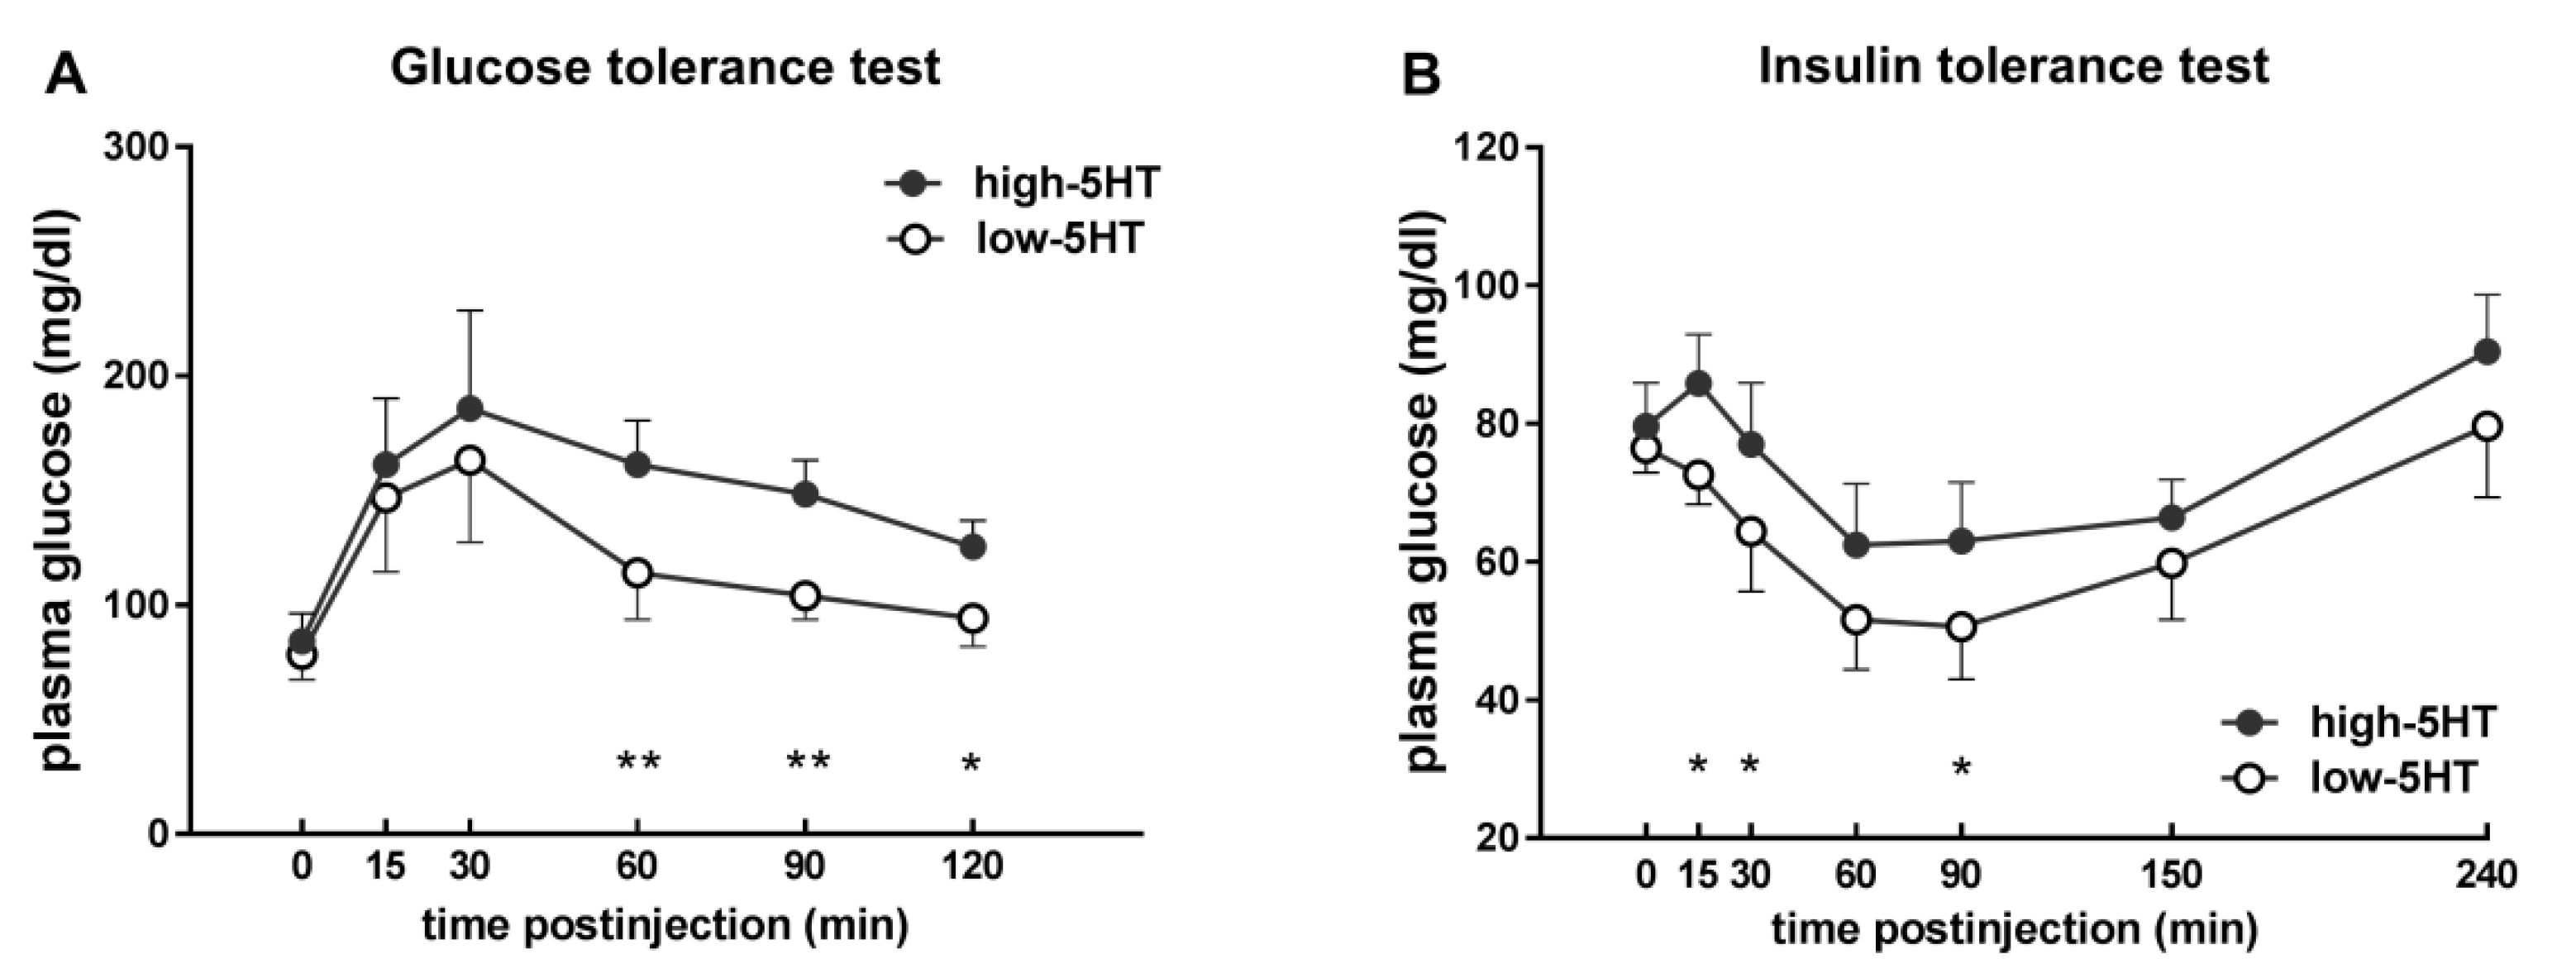
2.4. Glucose and Insulin Sensitivity
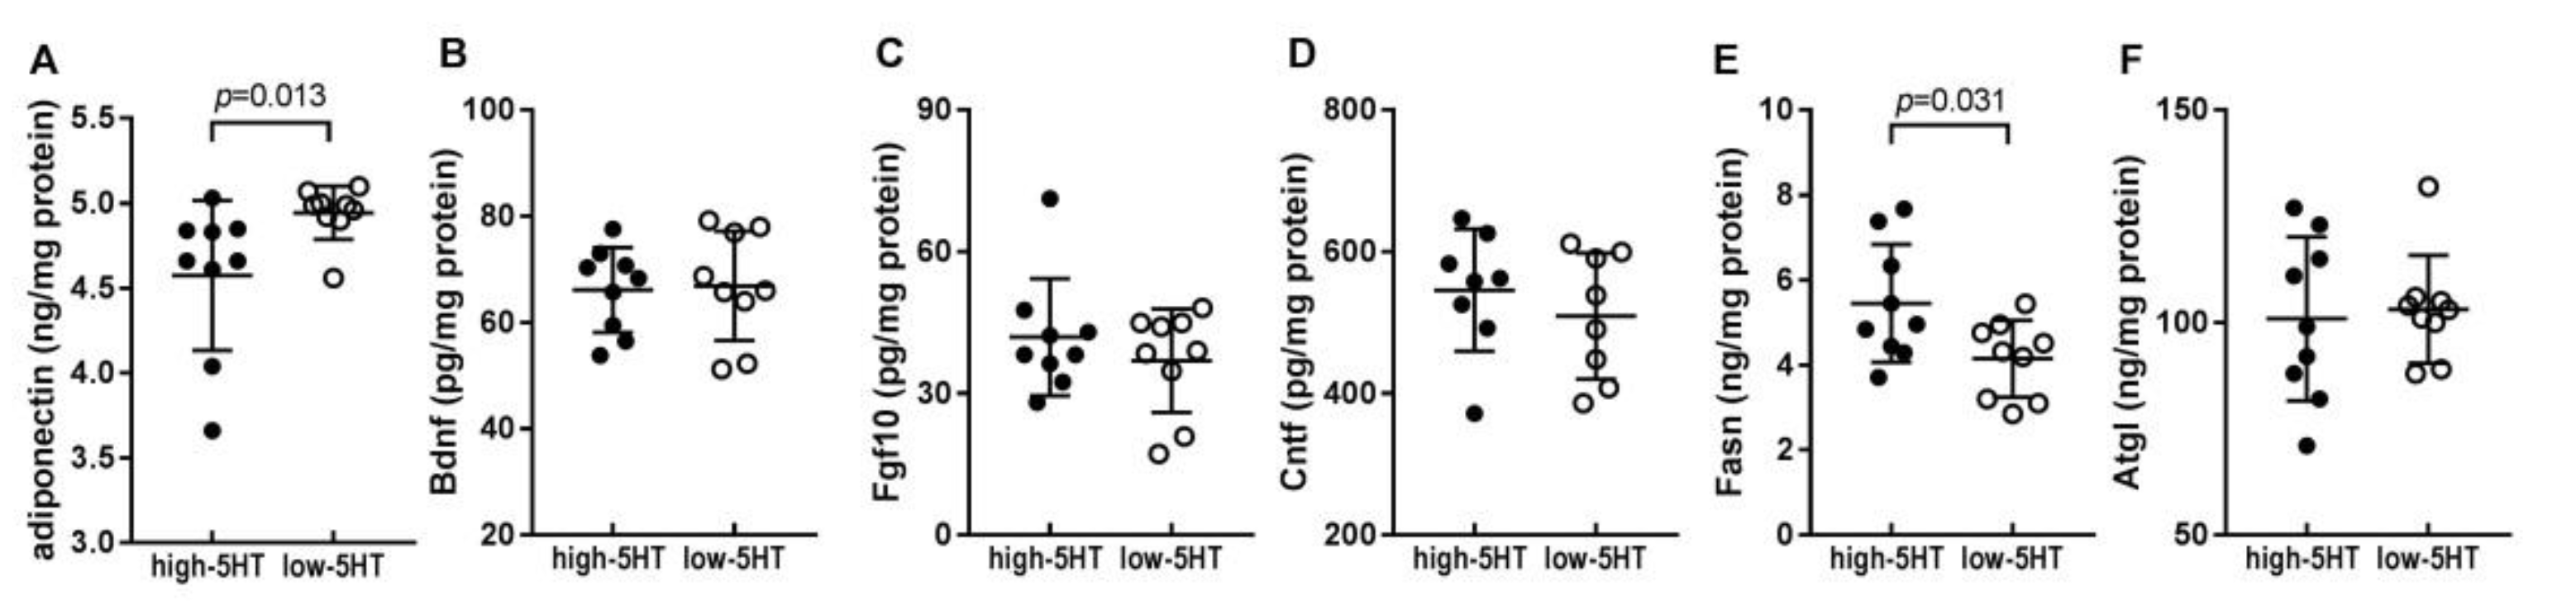
2.5. Levels of Body Weight-Related Proteins in WAT
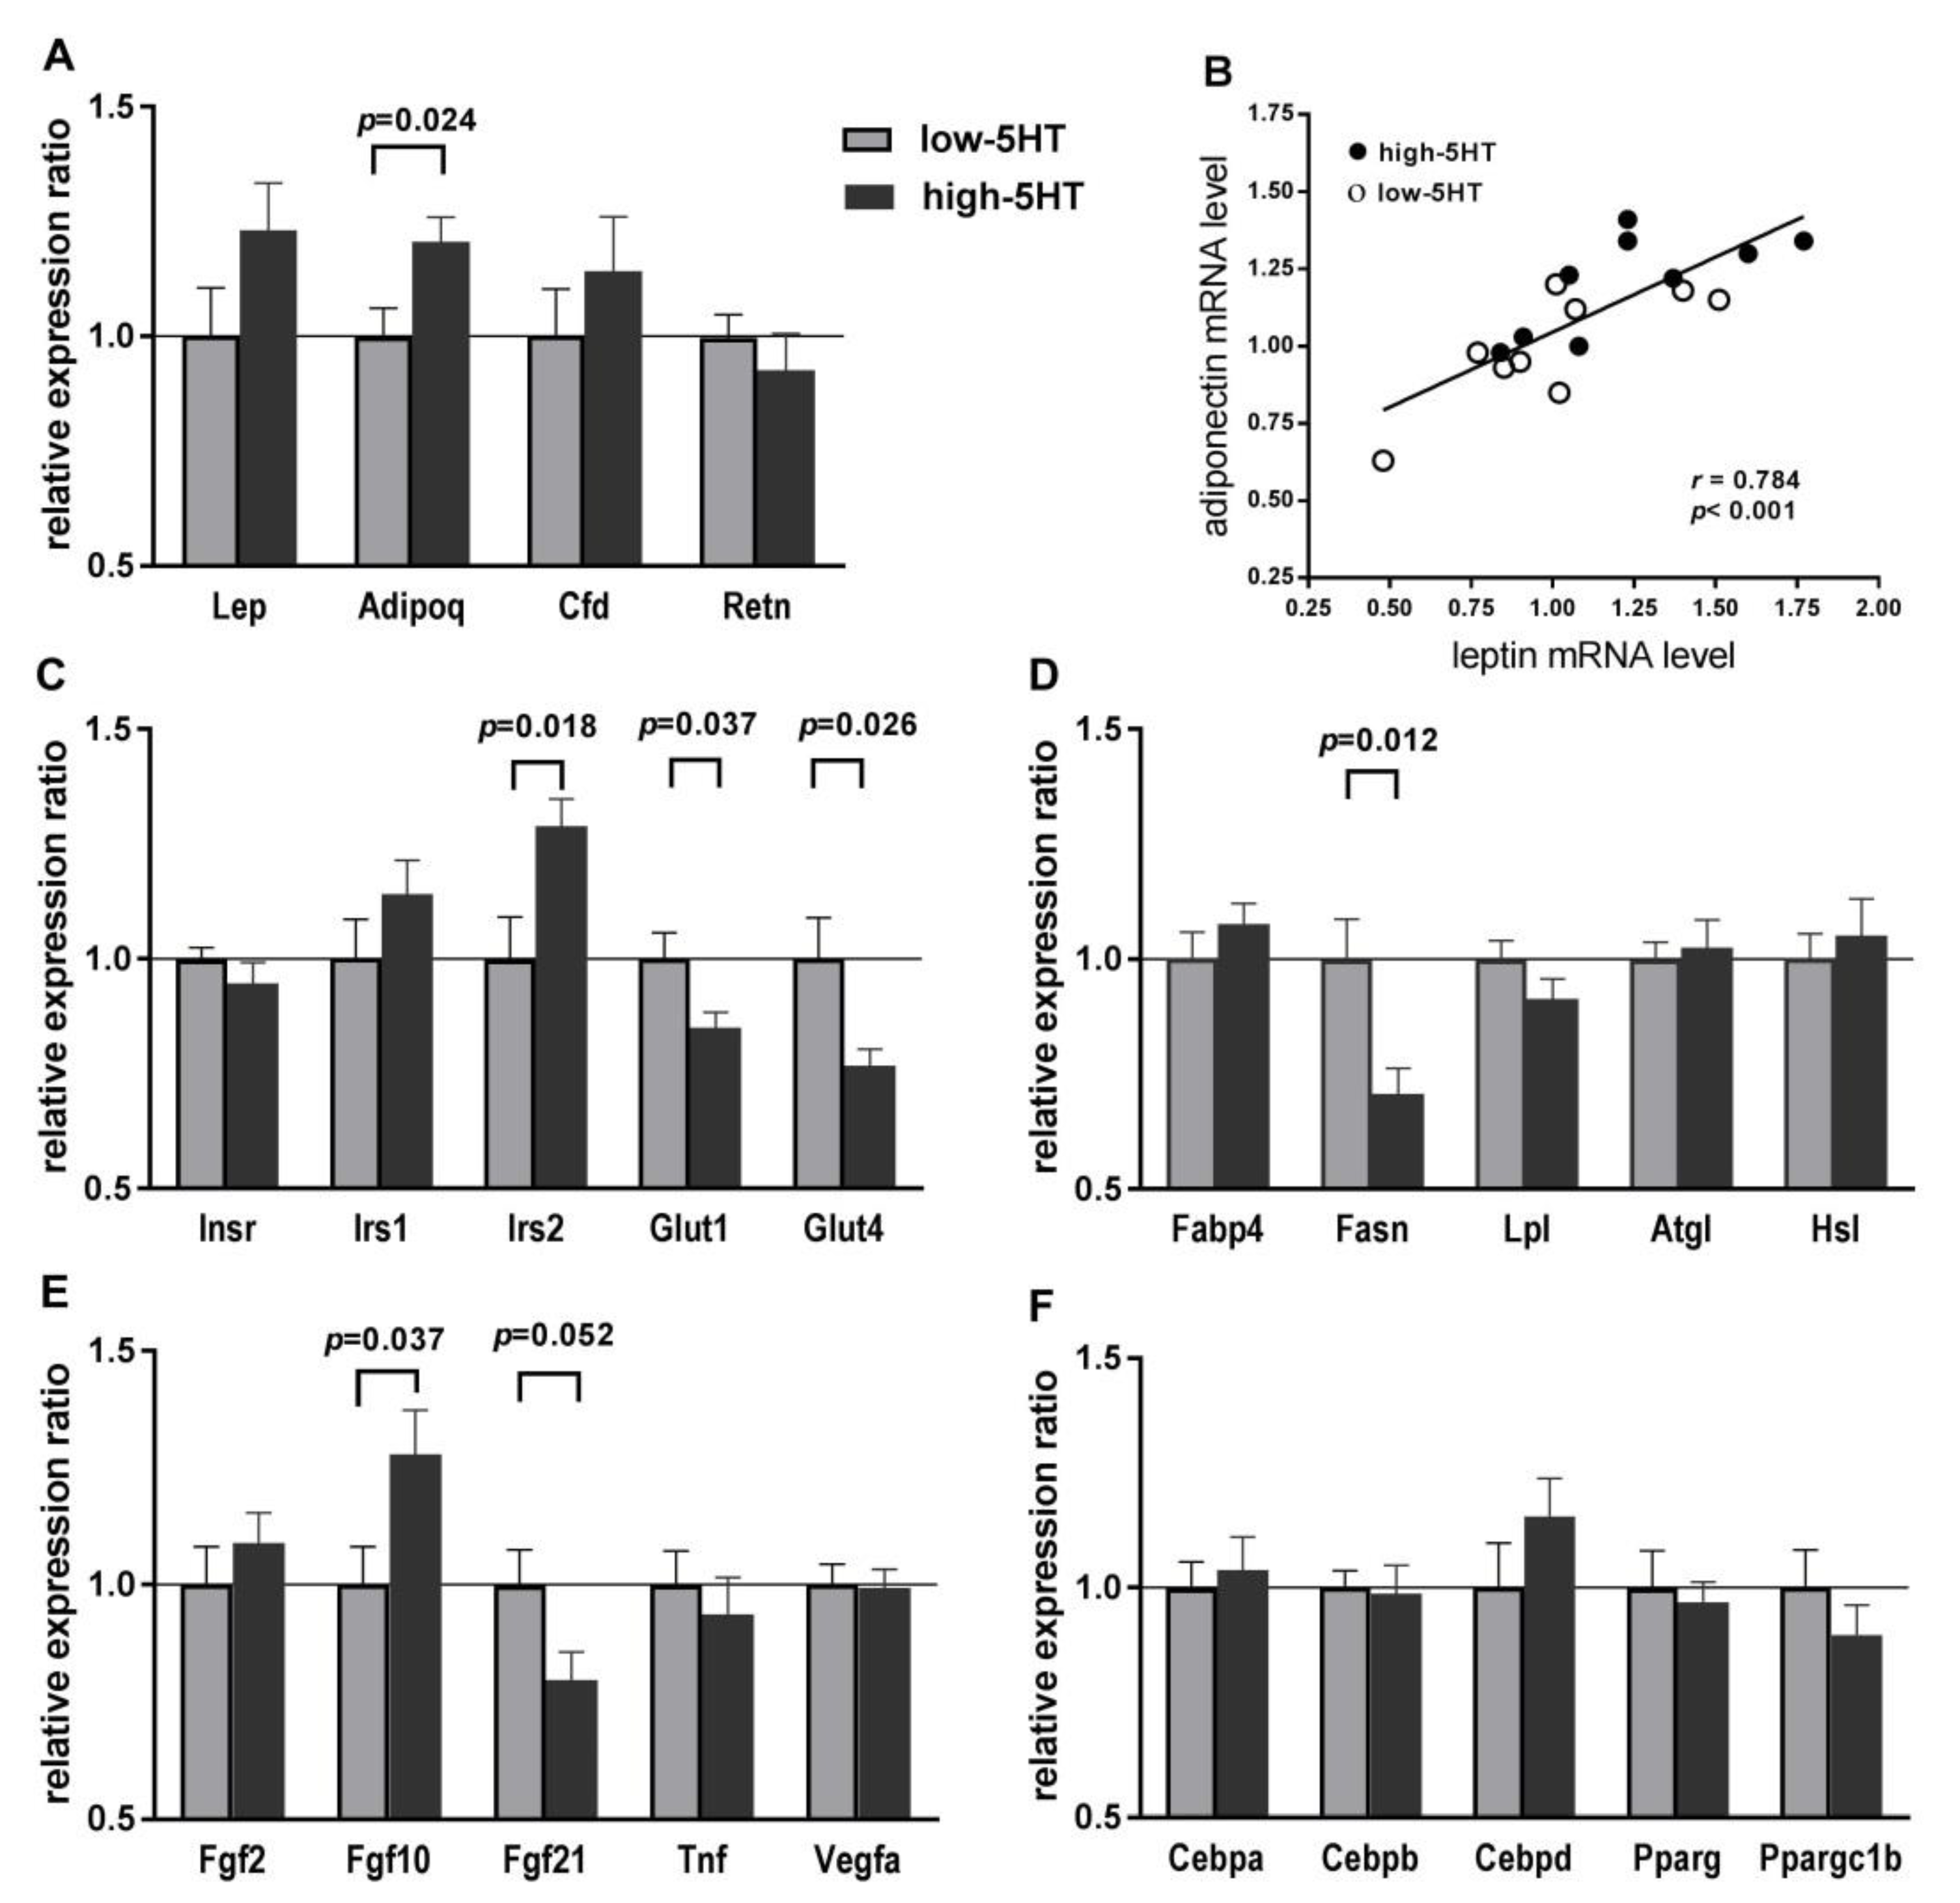
2.6. Expression Levels of Body Weight-Related Genes in WAT
2.7. Adipogenesis and Obesity PCR Arrays
3. Discussion
4. Materials and Methods
4.1. Animals
4.2. Body Weight Measurements and Phenotyping
4.3. Tissue/Sample Collection
4.4. Determination of Platelet 5HT Parameters
4.5. Biochemical Measurements
4.6. Metabolic Phenotyping
4.7. Gene Expression Analyses
4.8. Statistical Analysis
Supplementary Materials
Author Contributions
Funding
Institutional Review Board Statement
Informed Consent Statement
Data availability statement
Conflicts of Interest
Abbreviations
References
- Saller, C.F.; Stricker, E.M. Hyperphagia and increased growth in rats after intraventricular injection of 5,7-dihydroxytryptamine. Science 1976, 192, 385–387. [Google Scholar] [CrossRef]
- Garfield, A.S.; Heisler, L.K. Pharmacological targeting of the serotonergic system for the treatment of obesity. J. Physiol. 2009, 587, 49–60. [Google Scholar] [CrossRef] [PubMed]
- Namkung, J.; Kim, H.; Park, S. Peripheral serotonin: A new player in systemic energy homeostasis. Mol. Cells 2015, 38, 1023–1028. [Google Scholar] [PubMed]
- El-Merahbi, R.; Löffler, M.; Mayer, A.; Sumara, G. The roles of peripheral serotonin in metabolic homeostasis. FEBS Lett. 2015, 589, 1728–1734. [Google Scholar] [CrossRef] [Green Version]
- Oh, C.M.; Namkung, J.; Go, Y.; Shong, K.E.; Kim, K.; Kim, H.; Park, B.Y.; Lee, H.W.; Jeon, Y.H.; Song, J.; et al. Regulation of systemic energy homeostasis by serotonin in adipose tissues. Nat. Commun. 2015, 6, 1–12. [Google Scholar] [CrossRef]
- Yabut, J.M.; Crane, J.D.; Green, A.E.; Keating, D.J.; Khan, W.I.; Steinberg, G.R. Emerging roles for serotonin in regulating metabolism: New implications for an ancient molecule. Endocr. Rev. 2019, 40, 1092–1107. [Google Scholar] [CrossRef] [PubMed]
- Choi, W.; Moon, J.H.; Kim, H. Serotonergic regulation of energy metabolism in peripheral tissues. J. Endocrinol. 2020, 245, R1–R10. [Google Scholar] [CrossRef]
- Stunes, A.K.; Reseland, J.E.; Hauso, O.; Kidd, M.; Tømmerås, K.; Waldum, H.L.; Syversen, U.; Gustafsson, B.I. Adipocytes express a functional system for serotonin synthesis, reuptake and receptor activation. Diabetes Obes. Metab. 2011, 13, 551–558. [Google Scholar] [CrossRef] [PubMed]
- Watanabe, H.; Rose, M.T.; Aso, H. Role of peripheral serotonin in glucose and lipid metabolism. Curr. Opin. Lipidol. 2011, 22, 186–191. [Google Scholar] [CrossRef]
- Kim, K.; Oh, C.M.; Ohara-Imaizumi, M.; Park, S.; Namkung, J.; Yadav, V.K.; Tamarina, N.A.; Roe, M.W.; Philipson, L.H.; Karsenty, G.; et al. Functional role of serotonin in insulin secretion in a diet-induced insulin-resistant state. Endocrinology 2015, 156, 444–452. [Google Scholar] [CrossRef]
- Wyler, S.C.; Lord, C.C.; Lee, S.; Elmquist, J.K.; Liu, C. Serotonergic control of metabolic homeostasis. Front. Cell. Neurosci. 2017, 11, 277. [Google Scholar] [CrossRef] [PubMed] [Green Version]
- Kinoshita, M.; Ono, K.; Horie, T.; Nagao, K.; Nishi, H.; Kuwabara, Y.; Takanabe-Mori, R.; Hasegawa, K.; Kita, T.; Kimura, T. Regulation of adipocyte differentiation by activation of serotonin (5-HT) receptors 5-HT2AR and 5-HT2CR and involvement of microRNA-448-mediated repression of KLF5. Mol. Endocrinol. 2010, 24, 1978–1987. [Google Scholar] [CrossRef] [PubMed] [Green Version]
- Shong, K.E.; Oh, C.M.; Namkung, J.; Park, S.; Kim, H. Serotonin regulates de novo lipogenesis in adipose tissues through serotonin receptor 2a. Endocrinol. Metab. 2020, 35, 470–479. [Google Scholar] [CrossRef] [PubMed]
- Sumara, G.; Sumara, O.; Kim, J.K.; Karsenty, G. Gut-derived serotonin is a multifunctional determinant to fasting adaptation. Cell Metab. 2012, 16, 588–600. [Google Scholar] [CrossRef] [Green Version]
- Hansson, B.; Medina, A.; Fryklund, C.; Fex, M.; Stenkula, K.G. Serotonin (5-HT) and 5-HT2A receptor agonists suppress lipolysis in primary rat adipose cells. Biochem. Biophys. Res. Commun. 2016, 474, 357–363. [Google Scholar] [CrossRef] [PubMed]
- Paulmann, N.; Grohmann, M.; Voigt, J.P.; Bert, B.; Vowinckel, J.; Bader, M.; Skelin, M.; Jevšek, M.; Fink, H.; Rupnik, M.; et al. Intracellular serotonin modulates insulin secretion from pancreatic β-cells by protein serotonylation. PLoS Biol. 2009, 7, e1000229. [Google Scholar] [CrossRef] [Green Version]
- Crane, J.D.; Palanivel, R.; Mottillo, E.P.; Bujak, A.L.; Wang, H.; Ford, R.J.; Collins, A.; Blümer, R.M.; Fullerton, M.D.; Yabut, J.M.; et al. Inhibiting peripheral serotonin synthesis reduces obesity and metabolic dysfunction by promoting brown adipose tissue thermogenesis. Nat. Med. 2015, 21, 166–172. [Google Scholar] [CrossRef] [PubMed] [Green Version]
- Oh, C.M.; Park, S.; Kim, H. Serotonin as a new therapeutic target for diabetes mellitus and obesity. Diabetes Metab. J. 2016, 40, 89–98. [Google Scholar] [CrossRef] [Green Version]
- Watanabe, H.; Rose, M.; Kanayama, Y.; Shirakawa, H.; Aso, H. Energy homeostasis by the peripheral serotonergic system. In Serotonin—A Chemical Messenger Between All Types of Living Cells; Shad, K.F., Ed.; IntechOpen: London, UK, 2017; pp. 185–201. [Google Scholar]
- Martin, A.M.; Young, R.L.; Leong, L.; Rogers, G.B.; Spencer, N.J.; Jessup, C.F.; Keating, D.J. The diverse metabolic roles of peripheral serotonin. Endocrinology 2017, 158, 1049–1063. [Google Scholar] [CrossRef]
- Kesić, M.; Baković, P.; Horvatiček, M.; Proust, B.L.J.; Štefulj, J.; Čičin-Šain, L. Constitutionally high serotonin tone favors obesity: Study on rat sublines with altered serotonin homeostasis. Front. Neurosci. 2020, 14, 219. [Google Scholar] [CrossRef] [Green Version]
- Murphy, D.L.; Lesch, K.P. Targeting the murine serotonin transporter: Insights into human neurobiology. Nat. Rev. Neurosci. 2008, 9, 85–96. [Google Scholar] [CrossRef] [PubMed] [Green Version]
- Berger, M.; Gray, J.A.; Roth, B.L. The expanded biology of serotonin. Annu. Rev. Med. 2009, 60, 355–366. [Google Scholar] [CrossRef] [PubMed] [Green Version]
- Üçeyler, N.; Schütt, M.; Palm, F.; Vogel, C.; Meier, M.; Schmitt, A.; Lesch, K.P.; Mössner, R.; Sommer, C. Lack of the serotonin transporter in mice reduces locomotor activity and leads to gender-dependent late onset obesity. Int. J. Obes. 2010, 34, 701–711. [Google Scholar] [CrossRef] [PubMed] [Green Version]
- Homberg, J.R.; la Fleur, S.E.; Cuppen, E. Serotonin transporter deficiency increases abdominal fat in female, but not male rats. Obesity 2010, 18, 137–145. [Google Scholar] [CrossRef] [PubMed]
- Chen, X.; Margolis, K.J.; Gershon, M.D.; Schwartz, G.J.; Sze, J.Y. Reduced serotonin reuptake zransporter (SERT) function causes insulin resistance and hepatic steatosis independent of food intake. PLoS ONE 2012, 7, e32511. [Google Scholar]
- Zha, W.; Ho, H.T.B.; Hu, T.; Hebert, M.F.; Wang, J. Serotonin transporter deficiency drives edstrogen-dependent obesity and glucose intolerance. Sci. Rep. 2017, 7, 1137. [Google Scholar] [CrossRef] [Green Version]
- Yamada, J.; Sugimoto, Y.; Kimura, I.; Takeuchi, N.; Horisaka, K. Serotonin-induced hypoglycemia and increased serum insulin levels in mice. Life Sci. 1989, 45, 1931–1936. [Google Scholar] [CrossRef]
- Field, S.L.; Marrero, M.G.; Dado-Senn, B.; Skibiel, A.L.; Ramos, P.M.; Scheffler, T.L.; Laporta, J. Peripheral serotonin regulates glucose and insulin metabolism in Holstein dairy calves. Domest. Anim. Endocrinol. 2021, 74, 106519. [Google Scholar] [CrossRef]
- Patten, S.B.; Williams, J.V.A.; Lavorato, D.H.; Khaled, S.; Bulloch, A.G.M. Weight gain in relation to major depression and antidepressant medication use. J. Affect. Disord. 2011, 134, 288–293. [Google Scholar] [CrossRef]
- Vieweg, W.V.R.; Levy, J.R.; Fredrickson, S.K.; Chipkin, S.R.; Beatty-Brooks, M.; Fernandez, A.; Hasnain, M.; Pandurangi, A.K. Psychotropic drug considerations in depressed patients with metabolic disturbances. Am. J. Med. 2008, 121, 647–655. [Google Scholar] [CrossRef]
- Čičin-Šain, L.; Jernej, B. Wistar-Zagreb 5HT rats: A rodent model with constitutional upregulation/downregulation of serotonin transporter. In Experimental Models in Serotonin Transporter Research; Kalueff, A., LaPorte, J., Eds.; Cambridge University Press: Cambridge, UK, 2010; pp. 214–243. [Google Scholar]
- Romero, L.; Jernej, B.; Bel, N.; Čičin-Šain, L.; Cortés, R.; Artigas, F. Basal and stimulated extracellular serotonin concentration in the brain of rats with altered serotonin uptake. Synapse 1998, 28, 313–321. [Google Scholar] [CrossRef]
- Hranilović, D.; Čičin-Šain, L.; Bordukalo-Nikšić, T.; Jernej, B. Rats with constitutionally upregulated/downregulated platelet 5HT transporter: Differences in anxiety-related behavior. Behav. Brain Res. 2005, 165, 271–277. [Google Scholar] [CrossRef] [PubMed]
- Bordukalo-Nikšić, T.; Mokrović, G.; Štefulj, J.; Zivin, M.; Jernej, B.; Čičin-Šain, L. 5HT-1A receptors and anxiety-like behaviours: Studies in rats with constitutionally upregulated/downregulated serotonin transporter. Behav. Brain Res. 2010, 213, 238–245. [Google Scholar] [CrossRef] [PubMed]
- Kesić, M.; Tvrdeić, A.; Kolarić, D.; Stojković, R.; Čičin-Šain, L. Serotonergic modulation of pain and analgesic responses: A study in rats with constitutionally altered serotonin transporters. Eur. J. Pain 2015, 19, 508–515. [Google Scholar] [CrossRef] [PubMed]
- Erjavec, I.; Bordukalo-Nikšić, T.; Brkljačić, J.; Grčević, D.; Mokrović, G.; Kesić, M.; Rogić, D.; Zavadoski, W.; Paralkar, V.M.; Grgurević, L.; et al. Constitutively elevated blood serotonin is associated with bone loss and type 2 diabetes in rats. PLoS ONE 2016, 11, e0150102. [Google Scholar] [CrossRef] [PubMed] [Green Version]
- Malison, R.T.; Price, L.H.; Berman, R.; Van Dyck, C.H.; Pelton, G.H.; Carpenter, L.; Sanacora, G.; Owens, M.J.; Nemeroff, C.B.; Rajeevan, N.; et al. Reduced brain serotonin transporter availability in major depression as measured by [123I]-2β-carbomethoxy-3β-(4-iodophenyl)tropane and single photon emission computed tomography. Biol. Psychiatry 1998, 44, 1090–1098. [Google Scholar] [CrossRef]
- Castillo-Armengol, J.; Fajas, L.; Lopez-Mejia, I.C. Inter-organ communication: A gatekeeper for metabolic health. EMBO Rep. 2019, 20, e47903. [Google Scholar] [CrossRef]
- Kesić, M.; Baković, P.; Kolarić, D.; Štefulj, J.; Čičin-Šain, L. Adaptive thermogenesis in brown adipose tissue is affected by constitutive serotonergic tone: Study on Wistar-Zagreb 5HT rat model. Eur. J. Obes. 2019, 96. [Google Scholar]
- Young, R.L.; Lumsden, A.L.; Martin, A.M.; Schober, G.; Pezos, N.; Thazhath, S.S.; Isaacs, N.J.; Cvijanovic, N.; Sun, E.W.L.; Wu, T.; et al. Augmented capacity for peripheral serotonin release in human obesity. Int. J. Obes. 2018, 42, 1880–1889. [Google Scholar] [CrossRef] [PubMed]
- Martin, A.M.; Jones, L.A.; Jessup, C.F.; Sun, E.W.; Keating, D.J. Diet differentially regulates enterochromaffin cell serotonin content, density and nutrient sensitivity in the mouse small and large intestine. Neurogastroenterol. Motil. 2020, 32, e13869. [Google Scholar] [CrossRef]
- Kim, H.J.; Kim, J.H.; Noh, S.; Hur, H.J.; Sung, M.J.; Hwang, J.T.; Park, J.H.; Yang, H.J.; Kim, M.S.; Kwon, D.Y.; et al. Metabolomic analysis of livers and serum from high-fat diet induced obese mice. J. Proteome Res. 2011, 10, 722–731. [Google Scholar] [CrossRef]
- Le Beyec, J.; Pelletier, A.L.; Arapis, K.; Hourseau, M.; Cluzeaud, F.; Descatoire, V.; Ducroc, R.; Aparicio, T.; Joly, F.; Couvelard, A.; et al. Overexpression of gastric leptin precedes adipocyte leptin during high-fat diet and is linked to 5HT-containing enterochromaffin cells. Int. J. Obes. 2014, 38, 1357–1364. [Google Scholar] [CrossRef]
- Hodge, S.; Bunting, B.P.; Carr, E.; Strain, J.J.; Stewart-Knox, B.J. Obesity, whole blood serotonin and sex differences in healthy volunteers. Obes. Facts 2012, 5, 399–407. [Google Scholar] [CrossRef] [PubMed]
- Ritze, Y.; Schollenberger, A.; Hamze Sinno, M.; Bühler, N.; Böhle, M.; Bárdos, G.; Sauer, H.; Mack, I.; Enck, P.; Zipfel, S.; et al. Gastric ghrelin, GOAT, leptin, and leptinR expression as well as peripheral serotonin are dysregulated in humans with obesity. Neurogastroenterol. Motil. 2016, 28, 806–815. [Google Scholar] [CrossRef] [PubMed]
- Binetti, J.; Bertran, L.; Riesco, D.; Aguilar, C.; Martínez, S.; Sabench, F.; Porras, J.A.; Camaron, J.; Del Castillo, D.; Richart, C.; et al. Deregulated serotonin pathway in women with morbid obesity and NAFLD. Life 2020, 10, 245. [Google Scholar] [CrossRef]
- Marazziti, D.; Betti, L.; Baroni, S.; Palego, L.; Mucci, F.; Carpita, B.; Cremone, I.M.; Santini, F.; Fabbrini, L.; Pelosini, C.; et al. The complex interactions amongst serotonin, insulin, leptin and glycolipid metabolic parameters in human obesity. CNS Spectr. 2020, 1–10. [Google Scholar]
- Cataldo, L.R.; Suazo, J.; Olmos, P.; Bravo, C.; Galgani, J.E.; Fex, M.; Martínez, J.A.; Santos, J.L. Platelet serotonin levels are associated with plasma soluble leptin receptor concentrations in normoglycemic women. J. Diabetes Res. 2019, 2019, 2714049. [Google Scholar] [CrossRef] [PubMed] [Green Version]
- Frayn, K.N. Adipose tissue and the insulin resistance syndrome. Proc. Nutr. Soc. 2001, 60, 375–380. [Google Scholar] [CrossRef] [Green Version]
- Stern, J.H.; Smith, G.I.; Chen, S.; Unger, R.H.; Klein, S.; Scherer, P.E. Obesity dysregulates fasting-induced changes in glucagon secretion. J. Endocrinol. 2019, 243, 149–160. [Google Scholar] [CrossRef]
- Almaça, J.; Molina, J.; Menegaz, D.; Pronin, A.N.; Tamayo, A.; Slepak, V.; Berggren, P.O.; Caicedo, A. Human beta cells produce and release serotonin to inhibit glucagon secretion from alpha cells. Cell Rep. 2016, 17, 3281–3291. [Google Scholar] [CrossRef] [Green Version]
- Yamakawa, M.; Fukushima, A.; Sakuma, K.; Yanagisawa, Y.; Kagawa, Y. Serotonin transporter polymorphisms affect human blood glucose control. Biochem. Biophys. Res. Commun. 2005, 334, 1165–1171. [Google Scholar] [CrossRef] [PubMed]
- Ortega, F.J.; Mayas, D.; Moreno-Navarrete, J.M.; Catalán, V.; Gómez-Ambrosi, J.; Esteve, E.; Rodriguez-Hermosa, J.I.; Ruiz, B.; Ricart, W.; Peral, B.; et al. The gene expression of the main lipogenic enzymes is downregulated in visceral adipose tissue of obese subjects. Obesity 2010, 18, 13–20. [Google Scholar] [CrossRef] [PubMed]
- Nadler, S.T.; Stoehr, J.P.; Schueler, K.L.; Tanimoto, G.; Yandell, B.S.; Attie, A.D. The expression of adipogenic genes is decreased in obesity and diabetes mellitus. Proc. Natl. Acad. Sci. USA 2000, 97, 11371–11376. [Google Scholar] [CrossRef] [Green Version]
- Berndt, J.; Kovacs, P.; Ruschke, K.; Klöting, N.; Fasshauer, M.; Schön, M.R.; Körner, A.; Stumvoll, M.; Blüher, M. Fatty acid synthase gene expression in human adipose tissue: Association with obesity and type 2 diabetes. Diabetologia 2007, 50, 1472–1480. [Google Scholar] [CrossRef] [PubMed] [Green Version]
- Guichard, C.; Dugail, I.; Le Liepvre, X.; Lavau, M. Genetic Regulation of fatty acid synthetase expression in adipose tissue: Overtranscription of the gene in genetically obese rats. J. Lipid Res. 1992, 33, 679–687. [Google Scholar] [CrossRef]
- Galsgaard, K.D.; Pedersen, J.; Knop, F.K.; Holst, J.J.; Wewer Albrechtsen, N.J. Glucagon Receptor Signaling and Lipid Metabolism. Front. Physiol. 2019, 10, 413. [Google Scholar] [CrossRef]
- Wang, H.; Eckel, R.H. Lipoprotein lipase: From gene to obesity. Am. J. Physiol. Endocrinol. Metab. 2009, 297, E271–E288. [Google Scholar] [CrossRef] [Green Version]
- Uchida-Kitajima, S.; Yamauchi, T.; Takashina, Y.; Okada-Iwabu, M.; Iwabu, M.; Ueki, K.; Kadowaki, T. 5-Hydroxytryptamine 2A receptor signaling cascade modulates adiponectin and plasminogen activator inhibitor 1 expression in adipose tissue. FEBS Lett. 2008, 582, 3037–3044. [Google Scholar] [CrossRef] [Green Version]
- Choe, S.S.; Huh, J.Y.; Hwang, I.J.; Kim, J.I.; Kim, J.B. Adipose tissue remodeling: Its role in energy metabolism and metabolic disorders. Front. Endocrinol. 2016, 7, 30. [Google Scholar] [CrossRef] [Green Version]
- Engin, A. Adiponectin-resistance in obesity. In Obesity and Lipotoxicity. Advances in Experimental Medicine and Biology; Engin, A., Ed.; Springer: New York, NY, USA, 2017; Volume 960, pp. 415–441. [Google Scholar]
- Woo, Y.C.; Xu, A.; Wang, Y.; Lam, K.S.L. Fibroblast growth factor 21 as an emerging metabolic regulator: Clinical perspectives. Clin. Endocrinol. 2013, 78, 489–496. [Google Scholar] [CrossRef]
- Cuevas-Ramos, D.; Aguilar-Salinas, C.A. Modulation of energy balance by fibroblast growth factor 21. Horm. Mol. Biol. Clin. Investig. 2017, 30, 1–13. [Google Scholar] [CrossRef]
- Kharitonenkov, A.; Shiyanova, T.L.; Koester, A.; Ford, A.M.; Micanovic, R.; Galbreath, E.J.; Sandusky, G.E.; Hammond, L.J.; Moyers, J.S.; Owens, R.A.; et al. FGF-21 as a novel metabolic regulator. J. Clin. Investig. 2005, 115, 1627–1635. [Google Scholar] [CrossRef] [PubMed] [Green Version]
- Nonogaki, K.; Kaji, T. Pharmacologic inhibition of serotonin htr2b ameliorates hyperglycemia and the altered expression of hepatic FGF21, Sdf2l1, and htr2a in db/db mice and KKAy mice. Heliyon 2020, 6, e05774. [Google Scholar] [CrossRef]
- Ohta, H.; Itoh, N. Roles of FGFs as adipokines in adipose tissue development, remodeling, and metabolism. Front. Endocrinol. 2014, 5, 18. [Google Scholar] [CrossRef] [PubMed] [Green Version]
- Goetz, R. Metabolism: Adiponectin—a mediator of specific metabolic actions of FGF21. Nat. Rev. Endocrinol. 2013, 9, 506–508. [Google Scholar] [CrossRef] [PubMed]
- Lin, Z.; Tian, H.; Lam, K.S.L.; Lin, S.; Hoo, R.C.L.; Konishi, M.; Itoh, N.; Wang, Y.; Bornstein, S.R.; Xu, A.; et al. Adiponectin mediates the metabolic effects of FGF21 on glucose homeostasis and insulin sensitivity in mice. Cell Metab. 2013, 17, 779–789. [Google Scholar] [CrossRef] [PubMed] [Green Version]
- Kyrou, I.; Weickert, M.O.; Gharanei, S.; Randeva, H.S.; Tan, B.K. Fibroblast growth factors: New insights, new targets in the management of diabetes. Minerva Endocrinol. 2017, 42, 248–270. [Google Scholar]
- Waku, T.; Shiraki, T.; Oyama, T.; Maebara, K.; Nakamori, R.; Morikawa, K. The nuclear receptor PPARγ individually responds to serotonin-and fatty acid-metabolites. EMBO J. 2010, 29, 3395–3407. [Google Scholar] [CrossRef] [PubMed] [Green Version]
- Namkung, J.; Shong, K.E.; Kim, H.; Oh, C.M.; Park, S.; Kim, H. Inhibition of serotonin synthesis induces negative hepatic lipid balance. Diabetes Metab. J. 2018, 42, 233–243. [Google Scholar] [CrossRef] [PubMed] [Green Version]
- White, U.A.; Stephens, J.M. Transcriptional factors that promote formation of white adipose tissue. Mol. Cell. Endocrinol. 2010, 318, 10–14. [Google Scholar] [CrossRef] [Green Version]
- Čičin-Šain, L.; Perović, S.; Iskrić, S.; Jernej, B. Development of sublines of Wistar-derived rats with high or low platelet serotonin levels. Period. Biol. 1995, 97, 211–215. [Google Scholar]
- Čičin-Šain, L.; Froebe, A.; Bordukalo-Nikšić, T.; Jernej, B. Serotonin transporter kinetics in rats selected for extreme values of platelet serotonin level. Life Sci. 2005, 77, 452–461. [Google Scholar] [CrossRef] [PubMed]
- Jernej, B.; Froebe, A.; Hranilović, D.; Čičin-Šain, L. Platelet serotonin transporter: Ex vivo monitoring of kinetic parameters in the individual rat. Neurosci. Res. Commun. 1999, 24, 163–172. [Google Scholar] [CrossRef]
- Larionov, A.; Krause, A.; Miller, W.R. A Standard curve based method for relative real time PCR data processing. BMC Bioinform. 2005, 6, 1–16. [Google Scholar] [CrossRef] [PubMed] [Green Version]
- Livak, K.J.; Schmittgen, T.D. Analysis of relative gene expression data using real-time quantitative PCR and the 2-ΔΔCT Method. Methods 2001, 25, 402–408. [Google Scholar] [CrossRef]


Publisher’s Note: MDPI stays neutral with regard to jurisdictional claims in published maps and institutional affiliations. |
© 2021 by the authors. Licensee MDPI, Basel, Switzerland. This article is an open access article distributed under the terms and conditions of the Creative Commons Attribution (CC BY) license (https://creativecommons.org/licenses/by/4.0/).
Share and Cite
Kesić, M.; Baković, P.; Stojković, R.; Štefulj, J.; Čičin-Šain, L. Metabolic Disturbances in Rat Sublines with Constitutionally Altered Serotonin Homeostasis. Int. J. Mol. Sci. 2021, 22, 5400. https://0-doi-org.brum.beds.ac.uk/10.3390/ijms22105400
Kesić M, Baković P, Stojković R, Štefulj J, Čičin-Šain L. Metabolic Disturbances in Rat Sublines with Constitutionally Altered Serotonin Homeostasis. International Journal of Molecular Sciences. 2021; 22(10):5400. https://0-doi-org.brum.beds.ac.uk/10.3390/ijms22105400
Chicago/Turabian StyleKesić, Maja, Petra Baković, Ranko Stojković, Jasminka Štefulj, and Lipa Čičin-Šain. 2021. "Metabolic Disturbances in Rat Sublines with Constitutionally Altered Serotonin Homeostasis" International Journal of Molecular Sciences 22, no. 10: 5400. https://0-doi-org.brum.beds.ac.uk/10.3390/ijms22105400