
BRAF Inhibitors Induce Feedback Activation of RAS Pathway in Thyroid Cancer Cells

 , , ,
, , ,  , and
, and 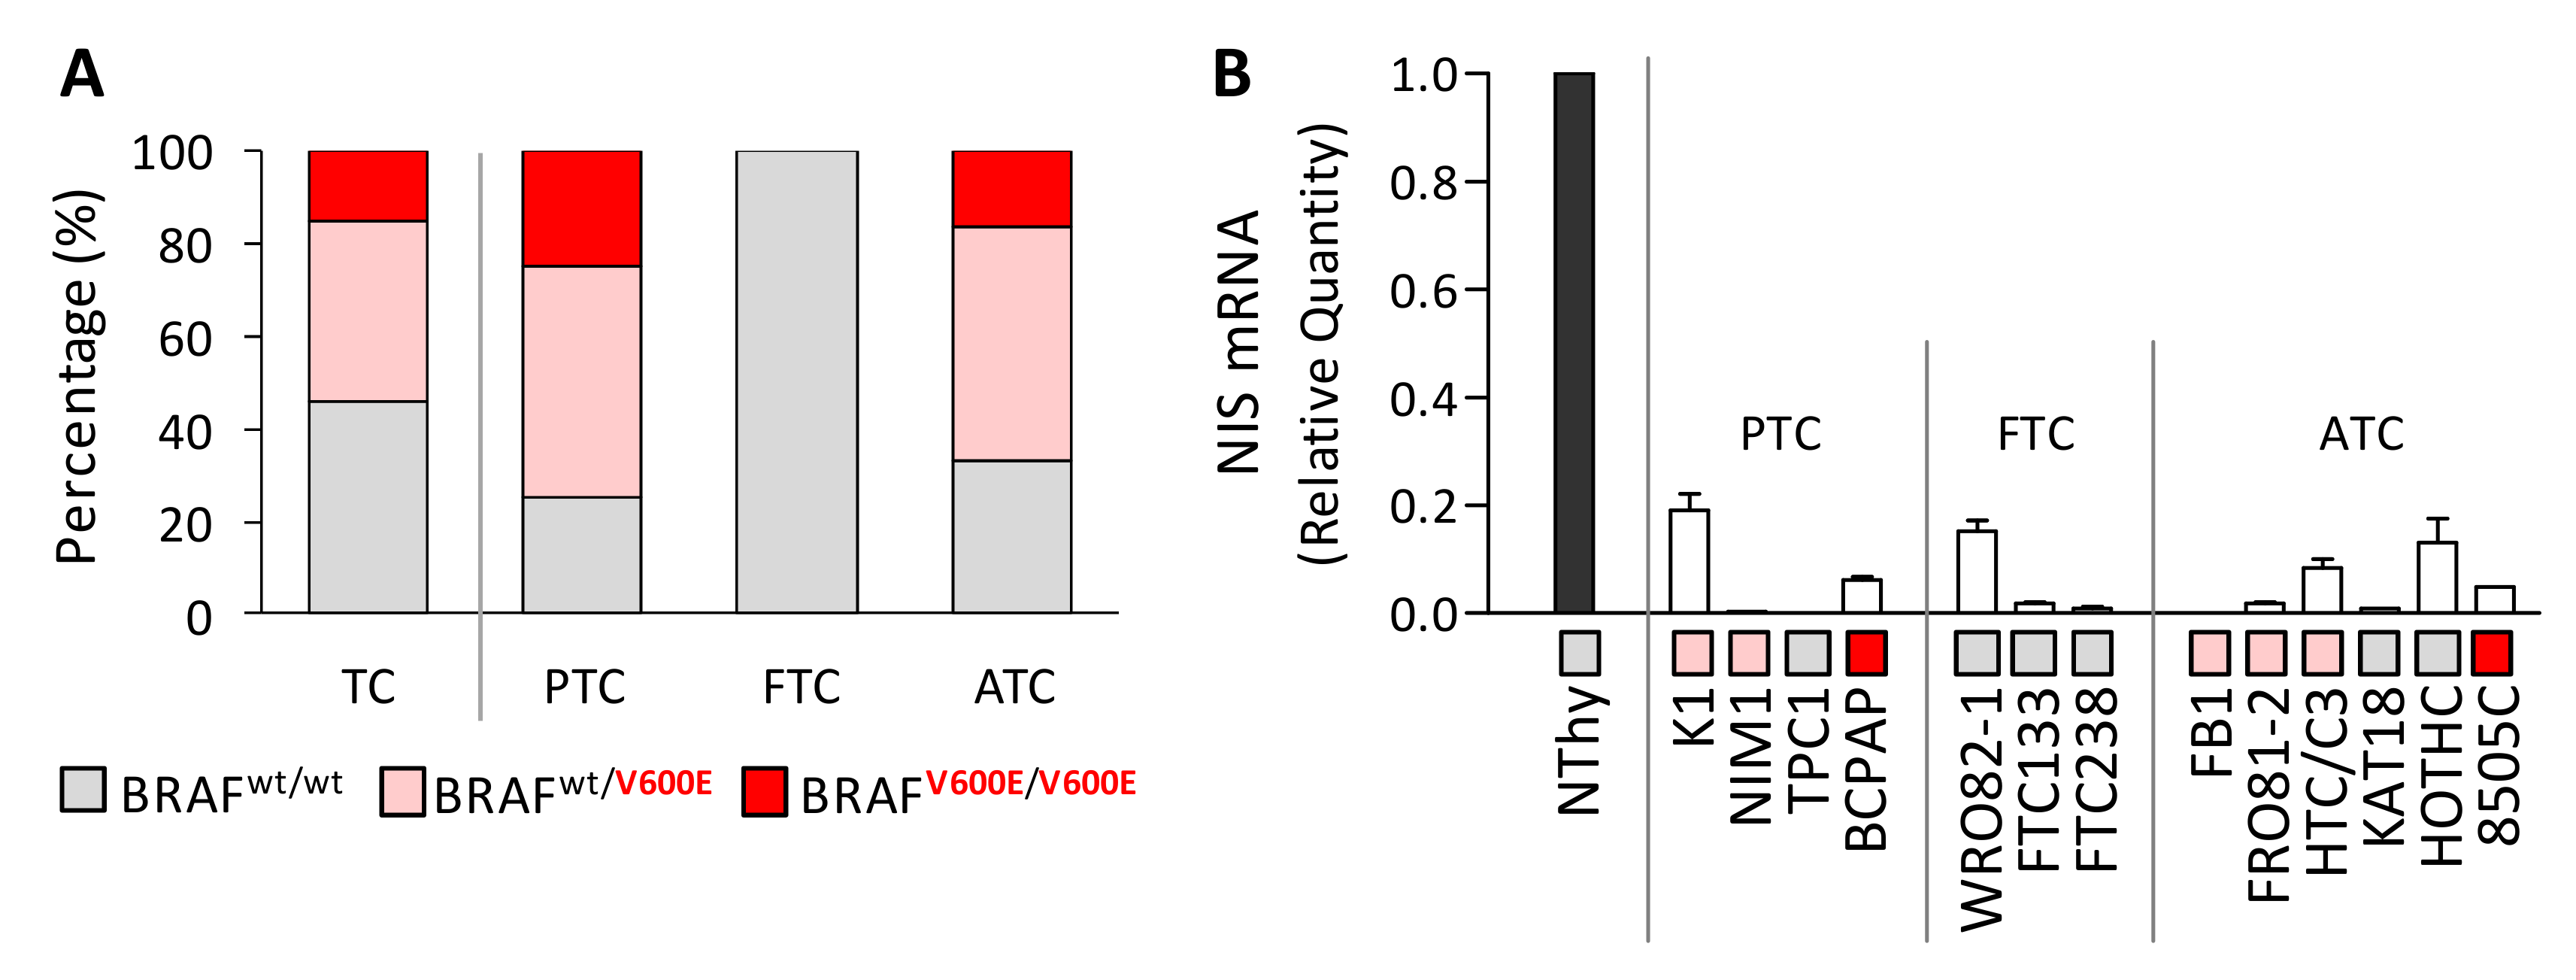
Abstract
:1. Introduction
2. Results
2.1. BRAFV600E Mutation and Reduced NIS Expression Are Found in Thyroid Cancer Cell Lines
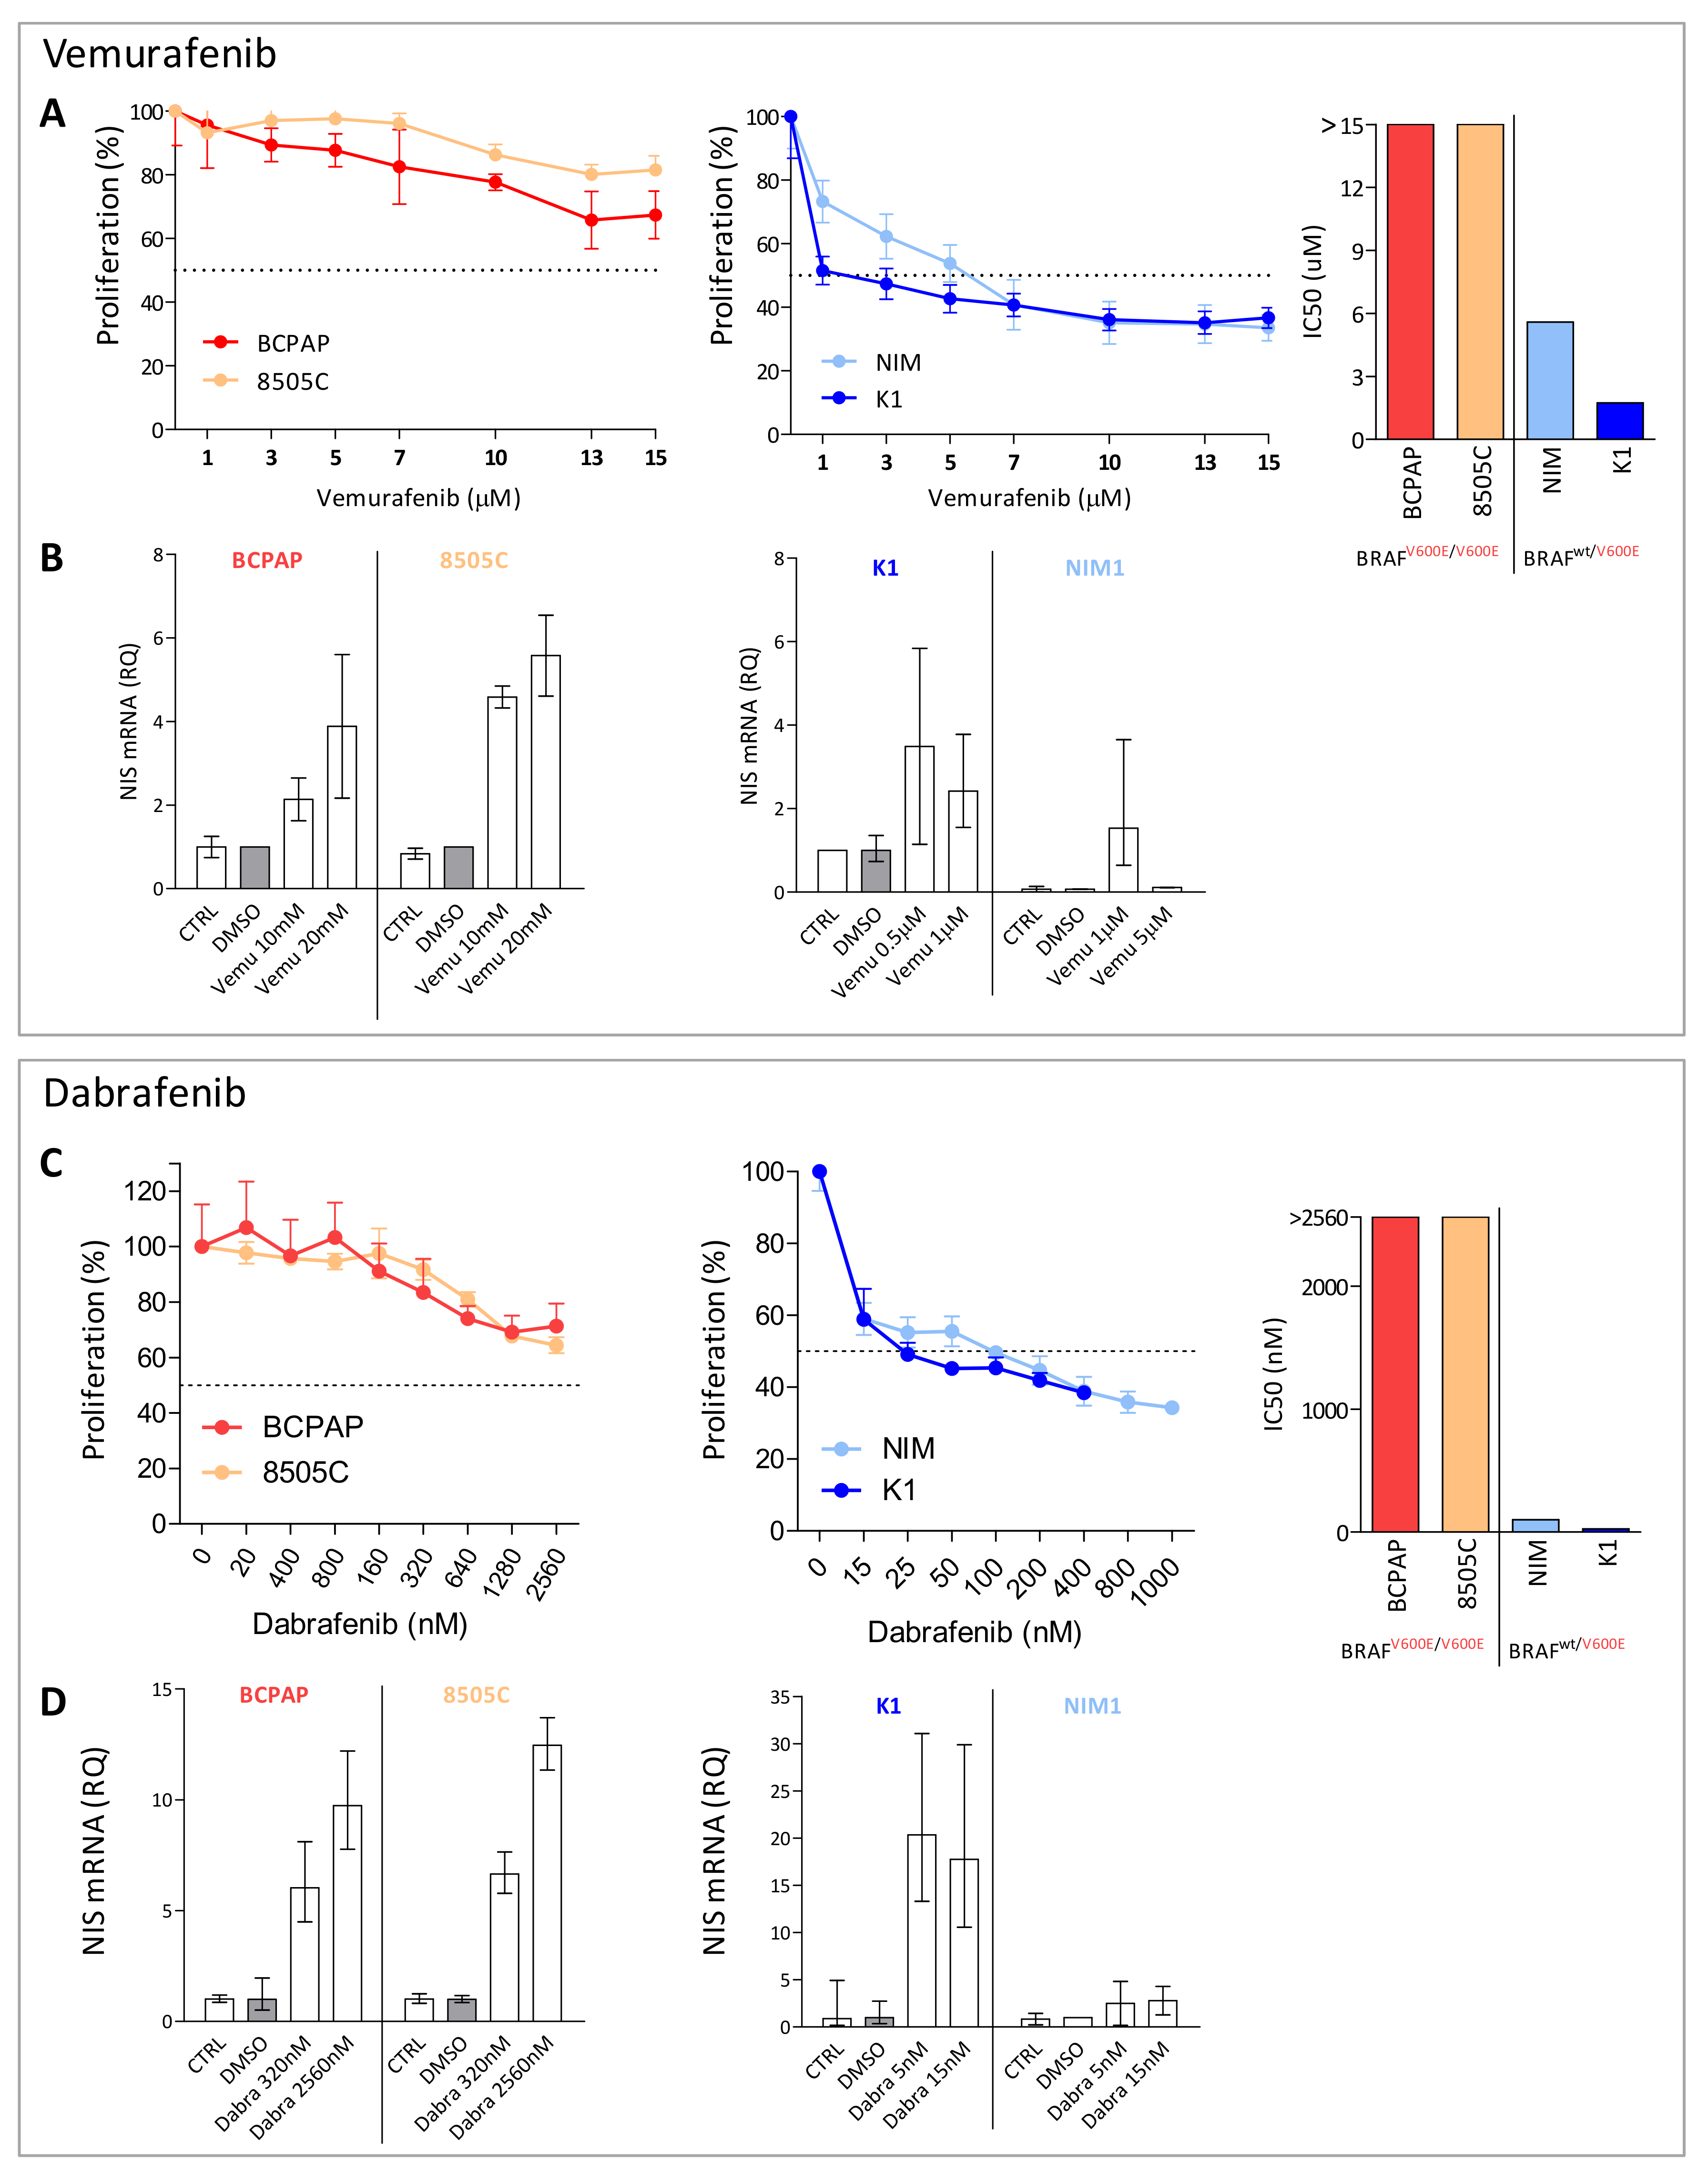
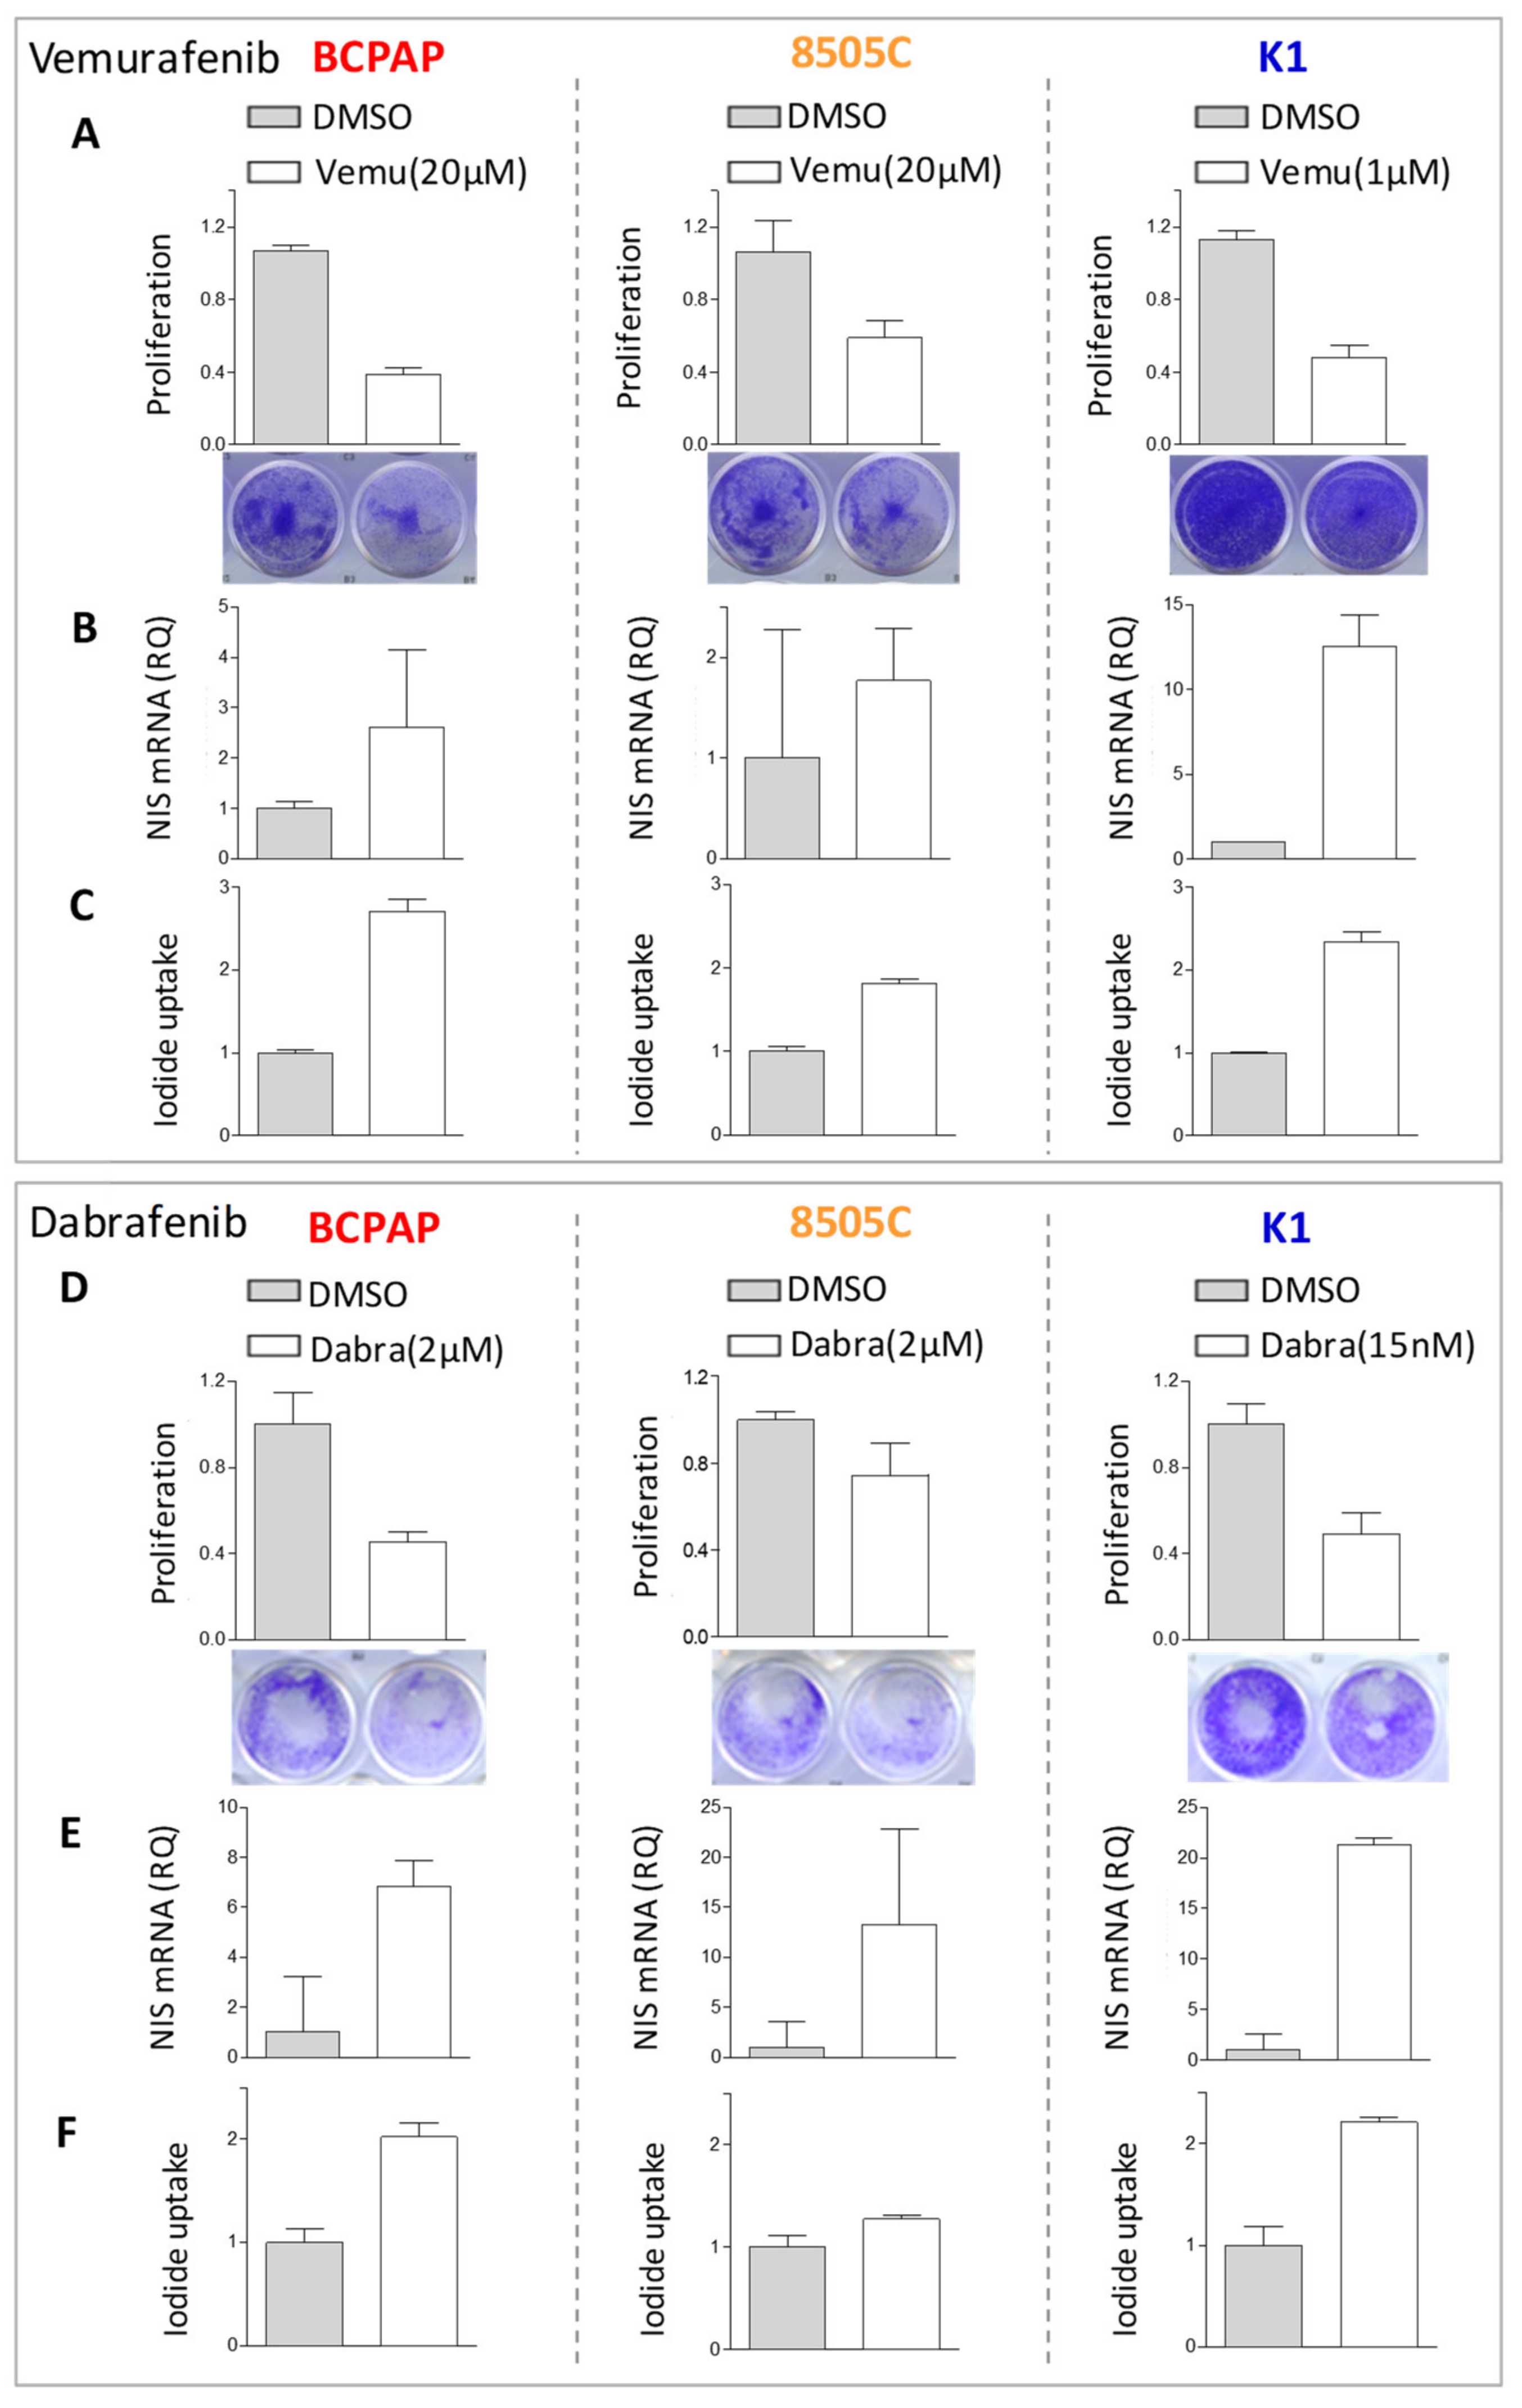
2.2. BRAF Inhibitors Affect Cell Proliferation, NIS Expression, and Activity in BRAFV600E Mutated Thyroid Cancer Cell Lines
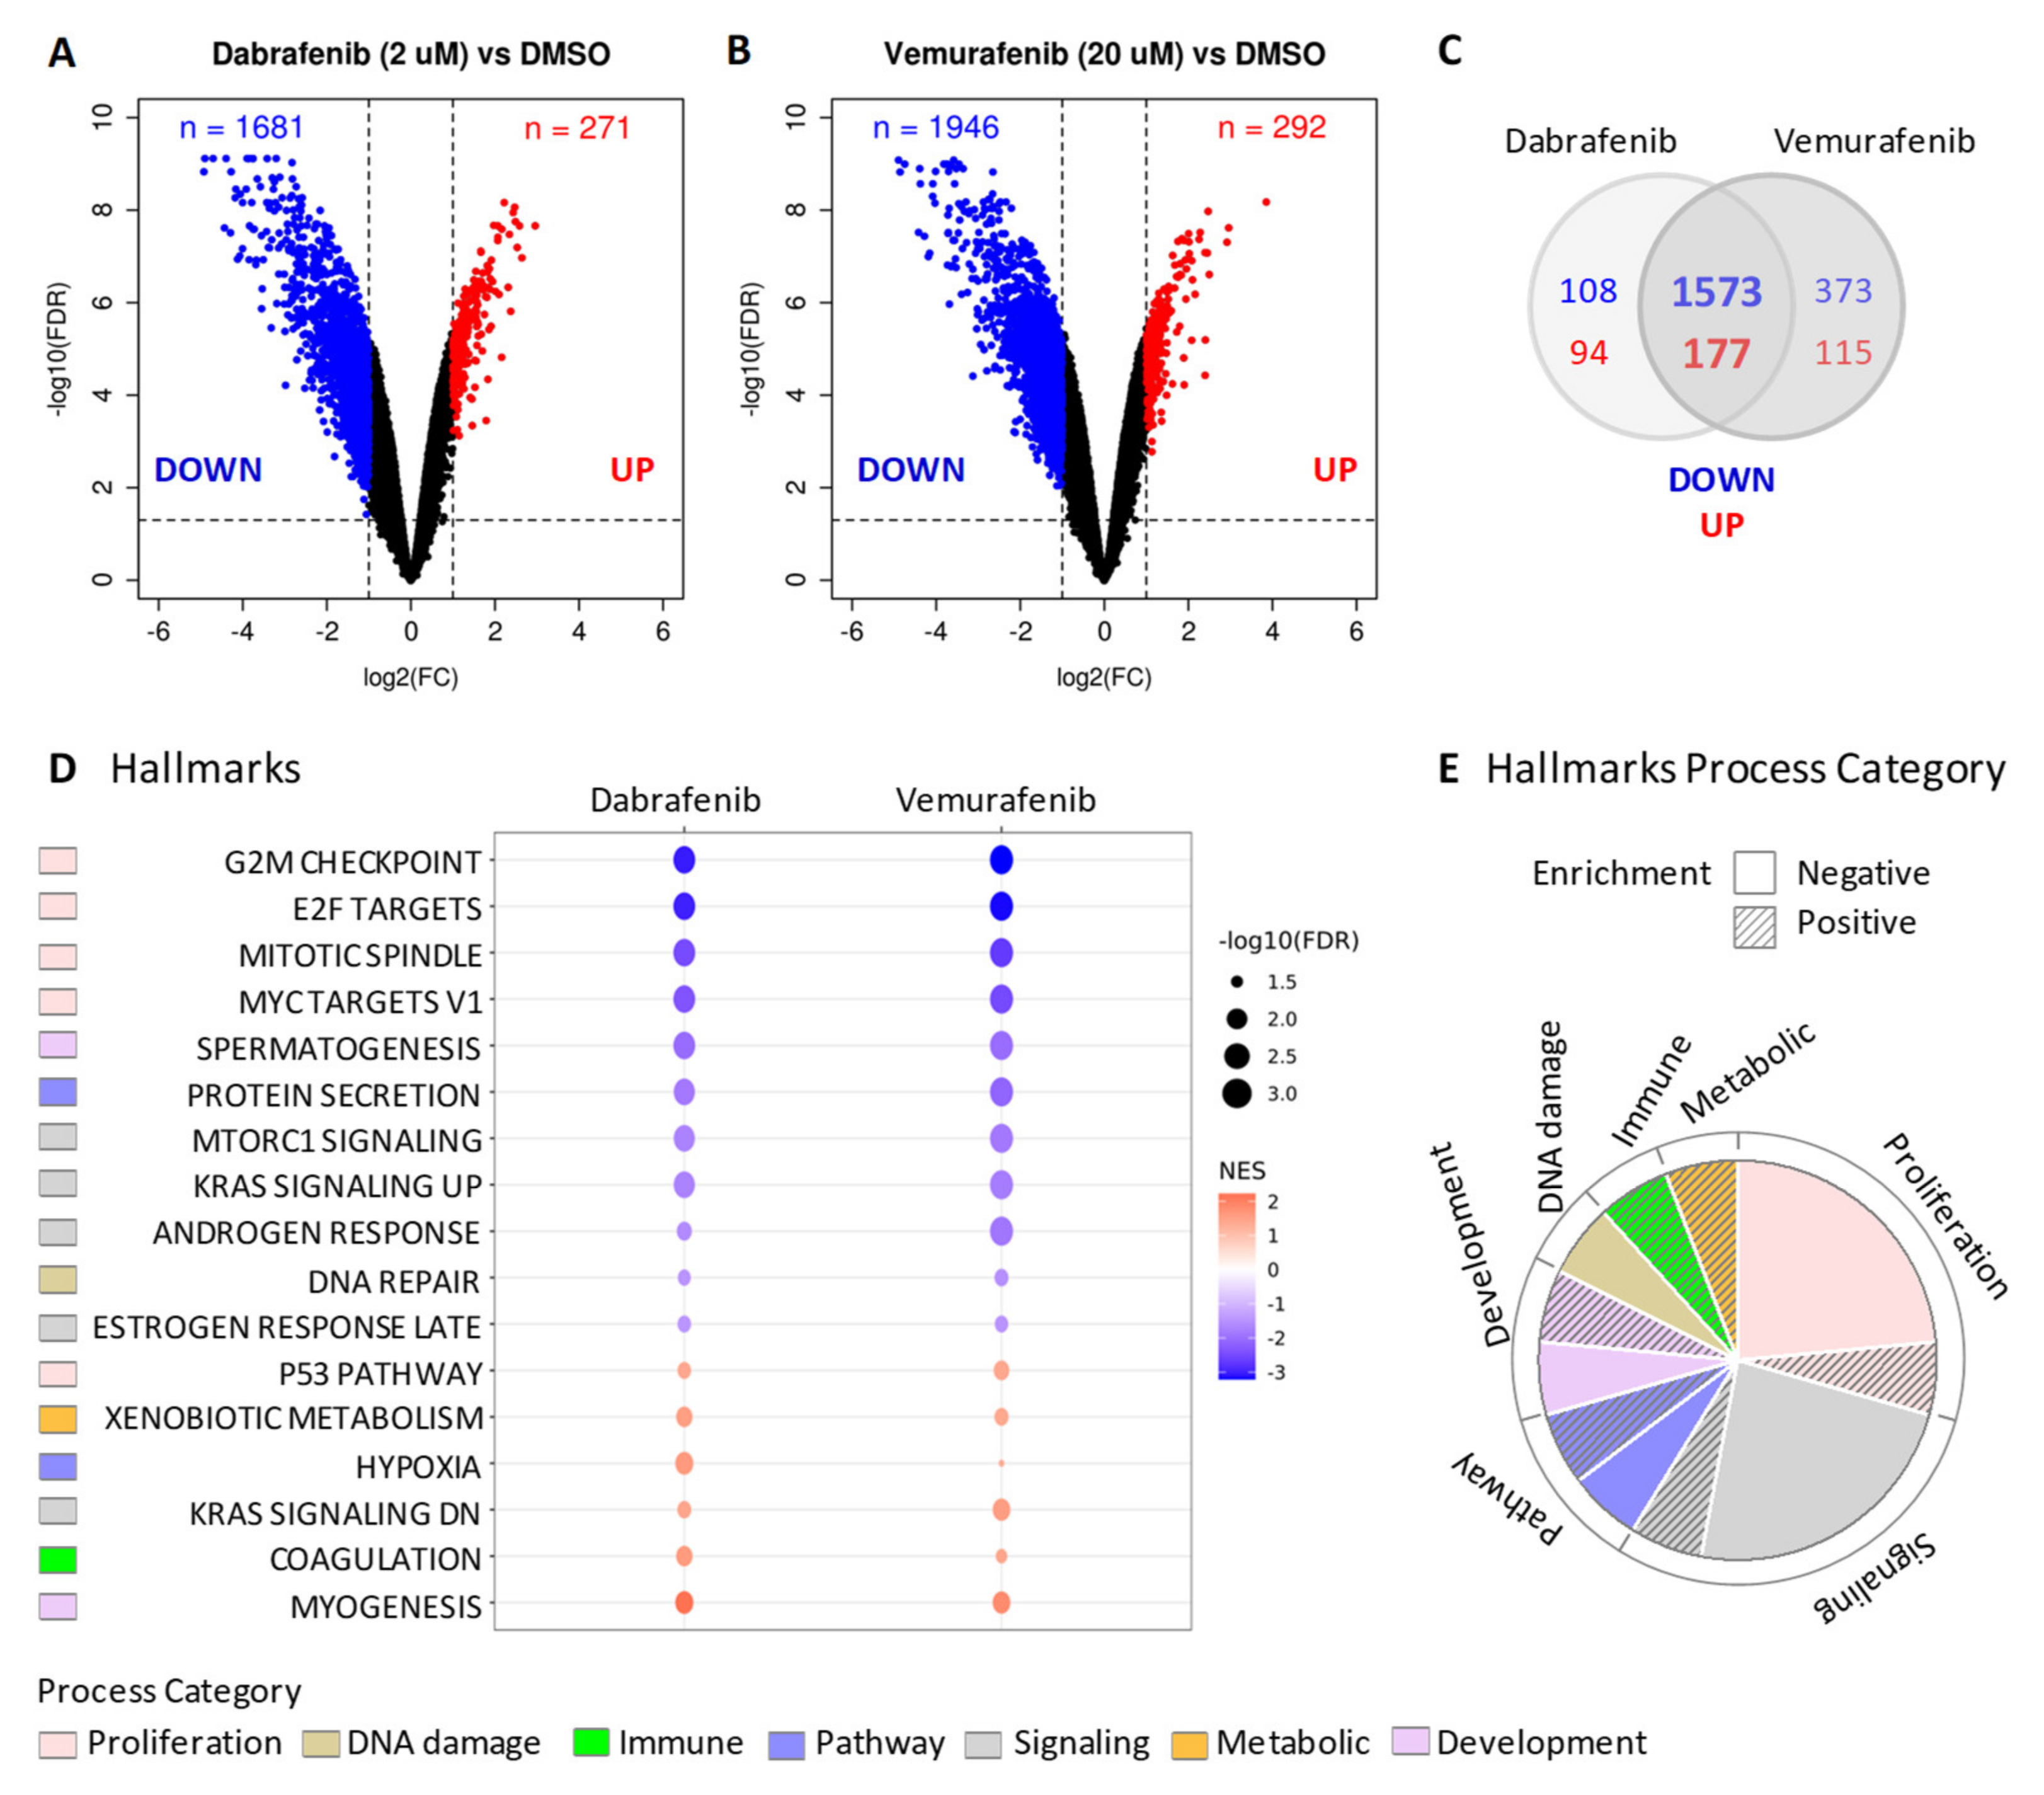
2.3. BRAF Inhibitors Induce Gene Expression Modulation and RAS Pathway Activation
3. Discussion
4. Materials and Methods
4.1. Thyroid Cell Cultures
4.2. BRAFV600E Mutation Assessment
4.3. Quantitative Real-Time Reverse Transcription PCR (qRT-PCR)
4.4. Pharmacological Treatments and Cell Proliferation Assay
4.5. Iodide Uptake Assay
4.6. Gene Profiling
4.7. Functional Enrichment Analysis
4.8. Gene Expression Scores Related to TCGA Derived Gene Signatures
4.9. Unsupervised Analysis of BCPAP Cell Lines and TC Tumors
4.10. Western Blot Analysis
Supplementary Materials
Author Contributions
Funding
Institutional Review Board Statement
Informed Consent Statement
Data Availability Statement
Acknowledgments
Conflicts of Interest
References
- Xing, M. Molecular pathogenesis and mechanisms of thyroid cancer. Nat. Rev. Cancer 2013, 13, 184–199. [Google Scholar] [CrossRef]
- Fagin, J.A.; Wells, S.A. Biologic and Clinical Perspectives on Thyroid Cancer. N. Engl. J. Med. 2016, 375, 1054–1067. [Google Scholar] [CrossRef]
- Agrawal, N.; Akbani, R.; Aksoy, B.A.; Ally, A.; Arachchi, H.; Asa, S.L.; Auman, J.T.; Balasundaram, M.; Balu, S.; Baylin, S.B.; et al. Integrated genomic characterization of papillary thyroid carcinoma. Cell 2014, 159, 676–690. [Google Scholar] [CrossRef] [PubMed]
- Pozdeyev, N.; Gay, L.M.; Sokol, E.S.; Hartmaier, R.; Deaver, K.E.; Davis, S.; French, J.D.; Borre, P.V.; LaBarbera, D.V.; Tan, A.-C.; et al. Genetic Analysis of 779 Advanced Differentiated and Anaplastic Thyroid Cancers. Clin. Cancer Res. 2018, 24, 3059–3068. [Google Scholar] [CrossRef] [PubMed]
- Landa, I.; Ibrahimpasic, T.; Boucai, L.; Sinha, R.; Knauf, J.A.; Shah, R.H.; Dogan, S.; Ricarte-Filho, J.C.; Krishnamoorthy, G.P.; Xu, B.; et al. Genomic and transcriptomic hallmarks of poorly differentiated and anaplastic thyroid cancers. J. Clin. Investig. 2016, 126, 1052–1066. [Google Scholar] [CrossRef]
- Yoo, S.-K.; Lee, S.; Kim, S.-J.; Jee, H.-G.; Kim, B.-A.; Cho, H.; Song, Y.S.; Cho, S.W.; Won, J.-K.; Shin, J.-Y.; et al. Comprehensive Analysis of the Transcriptional and Mutational Landscape of Follicular and Papillary Thyroid Cancers. PLoS Genet. 2016, 12, e1006239. [Google Scholar] [CrossRef] [PubMed]
- Kim, K.; Jeon, S.; Kim, T.-M.; Jung, C.K. Immune Gene Signature Delineates a Subclass of Papillary Thyroid Cancer with Unfavorable Clinical Outcomes. Cancers 2018, 10, 494. [Google Scholar] [CrossRef]
- Minna, E.; Brich, S.; Todoerti, K.; Pilotti, S.; Collini, P.; Bonaldi, E.; Romeo, P.; De Cecco, L.; Dugo, M.; Perrone, F.; et al. Cancer Associated Fibroblasts and Senescent Thyroid Cells in the Invasive Front of Thyroid Carcinoma. Cancers 2020, 12, 112. [Google Scholar] [CrossRef] [PubMed]
- Colombo, C.; Minna, E.; Gargiuli, C.; Muzza, M.; Dugo, M.; De Cecco, L.; Pogliaghi, G.; Tosi, D.; Bulfamante, G.; Greco, A.; et al. The molecular and gene/miRNA expression profiles of radioiodine resistant papillary thyroid cancer. J. Exp. Clin. Cancer Res. 2020, 39, 1–14. [Google Scholar] [CrossRef]
- Rusinek, D.; Pfeifer, A.; Cieslicka, M.; Kowalska, M.; Pawlaczek, A.; Krajewska, J.; Szpak-Ulczok, S.; Tyszkiewicz, T.; Halczok, M.; Czarniecka, A.; et al. TERT Promoter Mutations and Their Impact on Gene Expression Profile in Papillary Thyroid Carcinoma. Cancers 2020, 12, 1597. [Google Scholar] [CrossRef] [PubMed]
- Landa, I.; Pozdeyev, N.; Korch, C.; Marlow, L.A.; Smallridge, R.C.; Copland, J.A.; Henderson, Y.C.; Lai, S.Y.; Clayman, G.L.; Onoda, N.; et al. Comprehensive Genetic Characterization of Human Thyroid Cancer Cell Lines: A Validated Panel for Preclinical Studies. Clin. Cancer Res. 2019, 25, 3141–3151. [Google Scholar] [CrossRef]
- Dunn, L.A.; Sherman, E.J.; Baxi, S.S.; Tchekmedyian, V.; Grewal, R.K.; Larson, S.M.; Pentlow, K.S.; Haque, S.; Tuttle, R.M.; Sabra, M.M.; et al. Vemurafenib Redifferentiation of BRAF Mutant, RAI—Refractory Thyroid Cancers. J. Clin. Endocrinol. Metab. 2019, 104, 1417–1428. [Google Scholar] [CrossRef] [PubMed]
- Fröhlich, E.; Wahl, R. The current role of targeted therapies to induce radioiodine uptake in thyroid cancer. Cancer Treat. Rev. 2014, 40, 665–674. [Google Scholar] [CrossRef] [PubMed]
- Bible, K.C.; Ryder, M. Evolving molecularly targeted therapies for advanced-stage thyroid cancers. Nat. Rev. Clin. Oncol. 2016, 13, 403. [Google Scholar] [CrossRef]
- Narayanan, S.; Colevas, A.D. Current Standards in Treatment of Radioiodine Refractory Thyroid Cancer. Curr. Treat. Options Oncol. 2016, 17, 30. [Google Scholar] [CrossRef]
- Cabanillas, M.E.; McFadden, D.G.; Durante, C. Thyroid cancer. Lancet 2016, 388, 2783–2795. [Google Scholar] [CrossRef]
- Brose, M.S.; Cabanillas, M.E.; Cohen, E.E.; Wirth, L.J.; Riehl, T.; Yue, H.; Sherman, S.I.; Sherman, E.J. Vemurafenib in patients with BRAFV600E-positive metastatic or unresectable papillary thyroid cancer refractory to radioactive iodine: A non-randomised, multicentre, open-label, phase 2 trial. Lancet Oncol. 2016, 17, 1272–1282. [Google Scholar] [CrossRef]
- Rothenberg, S.M.; McFadden, D.G.; Palmer, E.L.; Daniels, G.H.; Wirth, L.J. Redifferentiation of iodine-refractory BRAF V600E-mutant metastatic papillary thyroid cancer with dabrafenib. Clin. Cancer Res. 2015, 21, 1028–1035. [Google Scholar] [CrossRef]
- Ho, A.L.; Grewal, R.K.; Leboeuf, R.; Sherman, E.J.; Pfister, D.G.; Deandreis, D.; Pentlow, K.S.; Zanzonico, P.B.; Haque, S.; Gavane, S.; et al. Selumetinib-Enhanced Radioiodine Uptake in Advanced Thyroid Cancer. N. Engl. J. Med. 2013, 368, 623–632. [Google Scholar] [CrossRef]
- Buffet, C.; Wassermann, J.; Hecht, F.; Leenhardt, L.; Dupuy, C.; Groussin, L.; Lussey-Lepoutre, C. Redifferentiation of radioiodine-refractory thyroid cancers. Endocr. Relat. Cancer 2020, 27, R113–R132. [Google Scholar] [CrossRef] [PubMed]
- Sabra, M.M.; Domínguez, J.M.; Grewal, R.K.; Larson, S.M.; Ghossein, R.A.; Tuttle, R.M.; Fagin, J.A. Clinical outcomes and molecular profile of differentiated thyroid cancers with radioiodine-avid distant metastases. J. Clin. Endocrinol. Metab. 2013, 98, E829–E836. [Google Scholar] [CrossRef]
- Chakravarty, D.; Santos, E.; Ryder, M.; Knauf, J.A.; Liao, X.-H.; West, B.L.; Bollag, G.; Kolesnick, R.; Thin, T.H.; Rosen, N.; et al. Small-molecule MAPK inhibitors restore radioiodine incorporation in mouse thyroid cancers with conditional BRAF activation. J. Clin. Investig. 2011, 121, 4700–4711. [Google Scholar] [CrossRef]
- Crispo, F.; Notarangelo, T.; Pietrafesa, M.; Lettini, G.; Storto, G.; Sgambato, A.; Maddalena, F.; Landriscina, M. BRAF Inhibitors in Thyroid Cancer: Clinical Impact, Mechanisms of Resistance and Future Perspectives. Cancers 2019, 11, 1388. [Google Scholar] [CrossRef] [PubMed]
- Saiselet, M.; Floor, S.; Tarabichi, M.; Dom, G.; Hébrant, A.; van Staveren, W.; Maenhaut, C. Thyroid cancer cell lines: An overview. Front. Endocrinol. 2012, 3, 133. [Google Scholar] [CrossRef]
- Liberzon, A.; Birger, C.; Thorvaldsdóttir, H.; Ghandi, M.; Mesirov, J.P.; Tamayo, P. The Molecular Signatures Database (MSigDB) hallmark gene set collection. Cell Syst. 2015, 1, 417–425. [Google Scholar] [CrossRef]
- Chapman, P.; Hauschild, A.; Robert, C.; Haanen, J.B.; Ascierto, P.; Larkin, J.; Dummer, R.; Garbe, C.; Testori, A.; Maio, M.; et al. Improved Survival with Vemurafenib in Melanoma with BRAF V600E Mutation. N. Engl. J. Med. 2011, 364, 2507–2516. [Google Scholar] [CrossRef]
- Hauschild, A.; Grob, J.-J.; Demidov, L.V.; Jouary, T.; Gutzmer, R.; Millward, M.; Rutkowski, P.; Blank, C.U.; Miller, W.H.; Kaempgen, E.; et al. Dabrafenib in BRAF-mutated metastatic melanoma: A multicentre, open-label, phase 3 randomised controlled trial. Lancet 2012, 380, 358–365. [Google Scholar] [CrossRef]
- Subbiah, V.; Kreitman, R.J.; Wainberg, Z.A.; Cho, J.Y.; Schellens, J.H.; Soria, J.C.; Wen, P.Y.; Zielinski, C.; Cabanillas, M.E.; Urbanowitz, G.; et al. Dabrafenib and Trametinib Treatment in Patients with Locally Advanced or Metastatic BRAF V600—Mutant Anaplastic Thyroid Cancer. J. Clin. Oncol. 2018, 36, 7–13. [Google Scholar] [CrossRef]
- Ho, A.; Dedecius, M.; Wirth, L.J.; Tuttle, R.; Tennyall, J.; So, K.; Carroll, D.; Hovey, T.; Thakre, B.; Fagin, J. ASTRA: A phase III, randomizes, placebo controlled study evaluating complete remission rate (CRR) with short-course Selumetinib plus adjuvant radioactive iodine (RAI) in patients (PTS) with differentiated thyroid cancer (DTC). In Proceedings of the 88th Annual Meeting of the American Thyroid Association, Washington, DC, USA, 3–7 October 2018. [Google Scholar]
- Johnson, D.B.; Menzies, A.M.; Zimmer, L.; Eroglu, Z.; Ye, F.; Zhao, S.; Rizos, H.; Sucker, A.; Scolyer, R.A.; Gutzmer, R.; et al. Acquired BRAF inhibitor resistance: A multicenter meta-analysis of the spectrum and frequencies, clinical behaviour, and phenotypic associations of resistance mechanisms. Eur. J. Cancer 2015, 51, 2792–2799. [Google Scholar] [CrossRef] [PubMed]
- Rizos, H.; Menzies, A.M.; Pupo, G.M.; Carlino, M.S.; Fung, C.; Hyman, J.; Haydu, L.E.; Mijatov, B.; Becker, T.M.; Boyd, S.C.; et al. BRAF Inhibitor Resistance Mechanisms in Metastatic Melanoma: Spectrum and Clinical Impact. Clin. Cancer Res. 2014, 20, 1965–1977. [Google Scholar] [CrossRef] [PubMed]
- Ahronian, L.G.; Corcoran, R.B. Effective MAPK Inhibition is critical for therapeutic responses in colorectal cancer with BRAF mutations. Mol. Cell. Oncol. 2015, 3, e1048405. [Google Scholar] [CrossRef] [PubMed]
- Haugen, B.R.; Alexander, E.K.; Bible, K.C.; Doherty, G.M.; Mandel, S.J.; Nikiforov, Y.E.; Pacini, F.; Randolph, G.W.; Sawka, A.M.; Schlumberger, M.; et al. 2015 American Thyroid Association Management Guidelines for Adult Patients with Thyroid Nodules and Differentiated Thyroid Cancer: The American Thyroid Association Guidelines Task Force on Thyroid Nodules and Differentiated Thyroid Cancer. Thyroid 2016, 26, 1–133. [Google Scholar] [CrossRef] [PubMed]
- Montero-Conde, C.; Ruiz-Llorente, S.; Dominguez, J.M.; Knauf, J.A.; Viale, A.; Sherman, E.J.; Ryder, M.; Ghossein, R.A.; Rosen, N.; Fagin, J.A. Relief of Feedback Inhibition of HER3 Transcription by RAF and MEK Inhibitors Attenuates Their Antitumor Effects in BRAF-Mutant Thyroid Carcinomas. Cancer Discov. 2013, 3, 520–533. [Google Scholar] [CrossRef]
- Cheng, L.; Jin, Y.; Liu, M.; Ruan, M.; Chen, L. HER inhibitor promotes BRAF/MEK inhibitor-induced redifferentiation in papillary thyroid cancer harboring BRAFV600E. Oncotarget 2017, 8, 19843–19854. [Google Scholar] [CrossRef]
- Byeon, H.K.; Na, H.J.; Yang, Y.J.; Kwon, H.J.; Chang, J.W.; Ban, M.J.; Kim, W.S.; Shin, D.Y.; Lee, E.J.; Koh, Y.W.; et al. c-Met-mediated reactivation of PI3K/AKT signaling contributes to insensitivity of BRAF(V600E) mutant thyroid cancer to BRAF inhibition. Mol. Carcinog. 2016, 55, 1678–1687. [Google Scholar] [CrossRef]
- Duquette, M.; Sadow, P.M.; Husain, A.; Sims, J.N.; Antonello, Z.A.; Fischer, A.H.; Song, C.; Castellanos-Rizaldos, E.; Makrigiorgos, G.M.; Kurebayashi, J.; et al. Metastasis-associated MCL1 and P16 copy number alterations dictate resistance to vemurafenib in a BRAFV600E patient-derived papillary thyroid carcinoma preclinical model. Oncotarget 2015, 6, 42445–42467. [Google Scholar] [CrossRef]
- Notarangelo, T.; Sisinni, L.; Condelli, V.; Landriscina, M. Dual EGFR and BRAF blockade overcomes resistance to vemurafenib in BRAF mutated thyroid carcinoma cells. Cancer Cell Int. 2017, 17, 86. [Google Scholar] [CrossRef]
- Danysh, B.P.; Rieger, E.Y.; Sinha, D.K.; Evers, C.V.; Cote, G.J.; Cabanillas, M.E.; Hofmann, M.-C. Long-term vemurafenib treatment drives inhibitor resistance through a spontaneous KRAS G12D mutation in a BRAF V600E papillary thyroid carcinoma model. Oncotarget 2016, 7, 30907–30923. [Google Scholar] [CrossRef]
- Paraiso, K.H.T.; Fedorenko, I.V.; Cantini, L.P.; Munko, A.C.; Hall, M.; Sondak, V.K.; Messina, J.L.; Flaherty, K.T.; Smalley, K.S.M. Recovery of phospho-ERK activity allows melanoma cells to escape from BRAF inhibitor therapy. Br. J. Cancer 2010, 102, 1724–1730. [Google Scholar] [CrossRef] [PubMed]
- Owen, D.H.; Konda, B.; Sipos, J.; Liu, T.; Webb, A.; Ringel, M.D.; Timmers, C.D.; Shah, M.H. KRAS G12V Mutation in Acquired Resistance to Combined BRAF and MEK Inhibition in Papillary Thyroid Cancer. J. Natl. Compr. Cancer Netw. 2019, 17, 409–413. [Google Scholar] [CrossRef]
- Cabanillas, M.E.; Dadu, R.; Iyer, P.; Wanland, K.B.; Busaidy, N.L.; Ying, A.; Gule-Monroe, M.; Wang, J.R.; Zafereo, M.; Hofmann, M.C. Acquired Secondary RAS Mutation in BRAF(V600E)-Mutated Thyroid Cancer Patients Treated with BRAF Inhibitors. Thyroid 2020, 30, 1288–1296. [Google Scholar] [CrossRef] [PubMed]
- Fiore, L.; Pollina, L.E.; Fontanini, G.; Casalone, R.; Berlingieri, M.T.; Giannini, R.; Pacini, F.; Miccoli, P.; Toniolo, A.; Fusco, A.; et al. Cytokine Production by a New Undifferentiated Human Thyroid Carcinoma Cell Line, FB-11. J. Clin. Endocrinol. Metab. 1997, 82, 4094–4100. [Google Scholar] [CrossRef]
- Frattini, M.; Ferrario, C.; Bressan, P.; Balestra, D.; De Cecco, L.; Mondellini, P.; Bongarzone, I.; Collini, P.; Gariboldi, M.; Pilotti, S.; et al. Alternative mutations of BRAF, RET and NTRK1 are associated with similar but distinct gene expression patterns in papillary thyroid cancer. Oncogene 2004, 23, 7436–7440. [Google Scholar] [CrossRef]
- Sensi, M.L.; Nicolini, G.; Petti, C.; Bersani, I.; Lozupone, F.; Molla, A.; Vegetti, C.; Nonaka, D.; Mortarini, R.; Parmiani, G.; et al. Mutually exclusive NRASQ61R and BRAFV600E mutations at the single-cell level in the same human melanoma. Oncogene 2006, 25, 3357–3364. [Google Scholar] [CrossRef] [PubMed]
- Minna, E.; Romeo, P.; Dugo, M.; De Cecco, L.; Todoerti, K.; Pilotti, S.; Perrone, F.; Seregni, E.; Agnelli, L.; Neri, A.; et al. miR-451a is underexpressed and targets AKT/mTOR pathway in papillary thyroid carcinoma. Oncotarget 2016, 7, 12731–12747. [Google Scholar] [CrossRef] [PubMed]
- Waltz, F.; Pillette, L.; Ambroise, Y. A nonradioactive iodide uptake assay for sodium iodide symporter function. Anal. Biochem. 2010, 396, 91–95. [Google Scholar] [CrossRef] [PubMed]
- McCall, M.N.; Bolstad, B.M.; Irizarry, R.A. Frozen robust multiarray analysis (fRMA). Biostatistics 2010, 11, 242–253. [Google Scholar] [CrossRef]
- Irizarry, R.A.; Hobbs, B.; Collin, F.; Beazer-Barclay, Y.D.; Antonellis, K.J.; Scherf, U.; Speed, T.P. Exploration, normalization, and summaries of high density oligonucleotide array probe level data. Biostatistics 2003, 4, 249–264. [Google Scholar] [CrossRef]
- Ritchie, M.E.; Phipson, B.; Wu, D.; Hu, Y.; Law, C.W.; Shi, W.; Smyth, G.K. limma powers differential expression analyses for RNA-sequencing and microarray studies. Nucleic Acids Res. 2015, 43, e47. [Google Scholar] [CrossRef]
- Benjamini, Y.; Hochberg, Y. Controlling the False Discovery Rate: A Practical and Powerful Approach to Multiple Testing. J. R. Stat. Soc. Ser. B 1995, 57, 289–300. [Google Scholar] [CrossRef]
- Korotkevich, G.; Sukhov, V.; Budin, N.; Shpak, B.; Artyomov, M.N.; Sergushichev, A. Fast gene set enrichment analysis. bioRxiv 2021, 060012. [Google Scholar] [CrossRef]
- Foroutan, M.; Bhuva, D.D.; Lyu, R.; Horan, K.; Cursons, J.; Davis, M.J. Single sample scoring of molecular phenotypes. BMC Bioinform. 2018, 19, 1–10. [Google Scholar] [CrossRef] [PubMed]
- Colombo, C.; Minna, E.; Rizzetti, M.G.; Romeo, P.; Lecis, D.; Persani, L.; Mondellini, P.; Pierotti, M.A.; Greco, A.; Fugazzola, L.; et al. The modifier role of RET-G691S polymorphism in hereditary medullary thyroid carcinoma: Functional characterization and expression/penetrance studies. Orphanet J. Rare Dis. 2015, 10, 1–9. [Google Scholar] [CrossRef] [PubMed]


Publisher’s Note: MDPI stays neutral with regard to jurisdictional claims in published maps and institutional affiliations. |
© 2021 by the authors. Licensee MDPI, Basel, Switzerland. This article is an open access article distributed under the terms and conditions of the Creative Commons Attribution (CC BY) license (https://creativecommons.org/licenses/by/4.0/).
Share and Cite
Bonaldi, E.; Gargiuli, C.; De Cecco, L.; Micali, A.; Rizzetti, M.G.; Greco, A.; Borrello, M.G.; Minna, E. BRAF Inhibitors Induce Feedback Activation of RAS Pathway in Thyroid Cancer Cells. Int. J. Mol. Sci. 2021, 22, 5744. https://0-doi-org.brum.beds.ac.uk/10.3390/ijms22115744
Bonaldi E, Gargiuli C, De Cecco L, Micali A, Rizzetti MG, Greco A, Borrello MG, Minna E. BRAF Inhibitors Induce Feedback Activation of RAS Pathway in Thyroid Cancer Cells. International Journal of Molecular Sciences. 2021; 22(11):5744. https://0-doi-org.brum.beds.ac.uk/10.3390/ijms22115744
Chicago/Turabian StyleBonaldi, Elisa, Chiara Gargiuli, Loris De Cecco, Arianna Micali, Maria Grazia Rizzetti, Angela Greco, Maria Grazia Borrello, and Emanuela Minna. 2021. "BRAF Inhibitors Induce Feedback Activation of RAS Pathway in Thyroid Cancer Cells" International Journal of Molecular Sciences 22, no. 11: 5744. https://0-doi-org.brum.beds.ac.uk/10.3390/ijms22115744