Article

Association of MALAT1 and PVT1 Variants, Expression Profiles and Target miRNA-101 and miRNA-186 with Colorectal Cancer: Correlation with Epithelial-Mesenchymal Transition

by
Abdullah F. Radwan
1,
Olfat G. Shaker
2,
Noha A. El-Boghdady
3 and
Mahmoud A. Senousy
3,*
1
Department of Biochemistry, Faculty of Pharmacy, Egyptian Russian University, Cairo 11829, Egypt
2
Department of Medical Biochemistry and Molecular Biology, Faculty of Medicine, Cairo University, Cairo 12613, Egypt
3
Department of Biochemistry, Faculty of Pharmacy, Cairo University, Cairo 11562, Egypt
*
Author to whom correspondence should be addressed.
Int. J. Mol. Sci. 2021, 22(11), 6147; https://0-doi-org.brum.beds.ac.uk/10.3390/ijms22116147
Submission received: 20 May 2021 / Revised: 28 May 2021 / Accepted: 4 June 2021 / Published: 7 June 2021
(This article belongs to the Section Molecular Oncology)

Abstract

:
The influence of PVT1 and MALAT1 variants on colorectal cancer (CRC) susceptibility and their impact on PVT1/miRNA-186/epithelial-mesenchymal transition (EMT) and MALAT1/miRNA-101/EMT axes in CRC are unknown. We investigated the influence of PVT1 rs13255292 and MALAT1 rs3200401 on the risk of CRC and adenomatous polyps (AP), their impact on the long noncoding RNAs PVT1 and MALAT1 expression and their target miRNA-186, miRNA-101/E-cadherin pathways, along with their potential as early CRC biomarkers. Overall, 280 individuals were recruited: 140 patients with CRC, 40 patients with AP, and 100 healthy volunteers. Genotyping and serum expression profiles were assessed using qPCR. The EMT biomarker, E-cadherin, was measured by ELISA. rs3200401 was associated with increased CRC risk, whereas rs13255292 was protective. Serum PVT1 and MALAT1 were upregulated in CRC and AP patients versus healthy controls, whereas, miRNA-186, miRNA-101 and E-cadherin were downregulated in CRC versus non-CRC groups. MALAT1 showed superior diagnostic potential for CRC and predicted CRC risk among non-CRC groups in the multivariate logistic analysis. PVT1, MALAT1, miRNA-186 and miRNA-101 levels were correlated with E-cadherin, tumor stage, lymph node and distant metastasis. E-cadherin was lost in metastatic vs. non-metastatic CRC. rs3200401CC genotype carriers showed higher E-cadherin levels than CC + CT carriers. rs3200401 was correlated with lymph node status. For the first time, rs13255292 and rs3200401 are potential genetic CRC predisposition markers, with rs3200401 possibly impacting the EMT process. Serum PVT1, MALAT1, miRNA-186 and miRNA-101 are novel non-invasive diagnostic biomarkers that could improve the clinical outcome of CRC.

Graphical Abstract

1. Introduction

Colorectal cancer (CRC) is among the most frequently diagnosed cancers worldwide, and it is a leading cause of cancer-related deaths around the world [1]. Advanced cases of CRC have poor prognosis and unsatisfactory survival rates [2]. We must make advances in the early detection and therapy of CRC to increase patient survival.
Because of the wide variety of biological processes that they play a part in, non-coding RNAs (ncRNAs) such as long ncRNAs (lncRNAs) and microRNAs (miRNAs) have recently received enough attention to merit mentioning. Mutations or the unnatural expression of ncRNAs are closely associated with many diseases, particularly cancer [3]. The crosstalk research between lncRNAs, miRNAs, and their master regulated proteins has become a newfangled passion for deciphering cancer’s molecular mechanism, including CRC.
An 8.5 kb lncRNA called lung adenocarcinoma transcript-1 (MALAT1) is located on chromosome 11q36. It has been reported that MALAT1 significantly subsidizes CRC development, progression, metastasis and survival rate [4]. It also functions as a miRNA sponge in CRC [5]. For instance, it can foster epithelial-mesenchymal transition (EMT) progression, which in turn boosts tumor growth by acting as a competing endogenous RNA (ceRNA) for miRNA-101 in CRC [6]. miRNA-101 is one of the small ncRNAs that has been found to act as a tumor suppressor in different types of cancer by targeting oncogenes and anti-oncogenes [7]. Although an established inverse significant correlation between MALAT1 and miRNA-101 was stated in different forms of cancer [8,9], the clinical relevance of this correlation in CRC remains to be scrutinized.
One of the most enticing features of miRNAs is their capacity to act as therapeutic targets in different diseases, making them particularly effective in regulating different cell processes important to malignant cell homeostasis which have brought hope for cancer patients [7]. miRNA-101 was found to target different pathways that promote breast cancer cell apoptosis by inhibiting the expression of Jak2, EYA1 and SOX2 acting as a potential therapeutic target in breast cancer [10]. In addition, miRNA-186 acts as a therapeutic agent in human esophageal squamous cell carcinoma by targeting HOXA9 [11]. However, they still need trials in CRC.
Because of the worthiness of new lncRNAs that were discovered and the thorough investigation into their roles in different types of cancer, the recently discovered oncogenic factor, lncRNA plasmacytoma variant translocation 1 (PVT1), is one of the proven overexpressed factors in CRC [12,13] and other types of cancer [14,15]. Additionally, PVT1 is related to miRNAs in cancer development. It is possible that PVT1 acting as a sequester for miRNA-186 leading to inhibition of its activities, affecting proliferation, invasion, and metastasis of cancer [15,16]. It is suggested that miRNA-186 downregulates Twist1, leading to overexpression of E-cadherin, thus suppressing the EMT process [16,17]. Reduced expression of E-Cadherin can promote the EMT process, which leads to the development of a tumor [18]. There is a paucity of literature on the correlation between PVT1 and miRNA-186 as an important diagnostic and prognostic parameter in CRC and other cancer types. Uncovering this correlation would allow for a better understanding of the disease biology. It would serve as a useful indicator for predicting critical diagnostic and prognostic parameters in cases of CRC.
Single nucleotide polymorphisms (SNPs) in lncRNAs and miRNAs genes may affect the risk, prognosis and treatment response in CRC. Identifying miRNA:mRNA interactions might aid in understanding the functions of many unknown SNPs [19]. CRC risk factors identified through genome-wide association studies have also reported genetic variants in the genomic regions of lncRNAs. These SNPs altered the expression and/or structure of lncRNA, as well as affected the mechanisms of lncRNA [4,20]. MALAT1 rs3200401 and PVT1 rs13255292 SNPs were assessed with different types of cancer [21,22], but not yet extensively investigated in CRC.
Therefore, this study aimed to investigate the association of MALAT1 rs3200401 and PVT1 rs13255292 SNPs with the susceptibility of CRC. Furthermore, we explored the relationship of these polymorphisms with MALAT1 and PVT1 expression and their target miRNA-101 and miRNA-186, respectively, in CRC. The impact of studied SNPs and the correlation of studied ncRNAs with E-cadherin as an EMT biomarker were also investigated. Moreover, we analyzed the correlations between studied parameters and the clinicopathological parameters of CRC and their potential in early diagnosis and prognosis of CRC.

2. Results

2.1. The Studied Groups’ Demographical and Clinicopathological Properties

As illustrated in Table 1, all of the various demographic, laboratory and pathological features of the examined groups are presented. Patients with AP are significantly younger than those with CRC (p < 0.0001) and healthy groups (p = 0.006). Gender was not significantly different (p = 0.86); however, a male preponderance in CRC and AP patients representing 64.2% and 62%, respectively, was observed. 30% and 20% of CRC and AP patients were tobacco smokers, respectively.
CRC cases included 11.4% poorly-differentiated, 70% moderately differentiated, and 18.6% well-differentiated tumors with regard to histopathological grading. Moreover, 73.5% of all CRC were located in the colon, while 26.5% were found in the rectum. Tumors varied in size (1.5 cm or greater). Overall, 93.5% of CRC tumors were adenocarcinoma. Only 17.1% of the patients had metastatic CRC, with hepatic focal lesions being present in all. Furthermore, 62.8% of CRC patients have been diagnosed with the American Joint Committee on Cancer (AJCC) early stages (I and II); however, 37.2% of the diagnosed CRC patients with late stages (III and IV). Approximately, 40% of the patients throughout the AP group had multiple (≥3) differential polyps. In contrast, the residual had either one or two polyps, and none of them were in one of the polyposis syndromes. In polyps, two-thirds were tubulovillous adenomas, with half showing dysplasia.

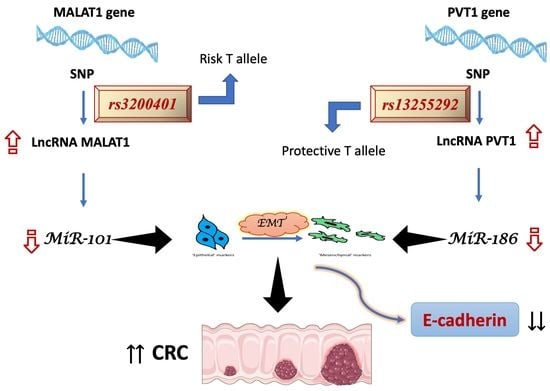
2.2. Association of rs3200401 (C/T) and rs13255292 (C/T) with the Risk of CRC and AP

Genotyping was handled without the participants being told that they were participating in a case-control analysis. For rs3200401 and rs13255292 SNPs, MAF in the controls was T = 0.34 and T = 0.42, respectively, which were slightly higher than the global MAF (T = 0.14 for rs3200401 and T = 0.20 for rs13255292), but was still close to the highest population MAF for both SNPs rs3200401 T = 0.31 and rs13255292 T = 0.43, reported in Ensembl release 102-November 2020 (Supplementary Table S1). The distribution of the rs3200401 and rs13255292 genotypes in control and patient groups did not stray significantly from HWE (p > 0.05) (Supplementary Table S2).
The allele frequencies and genotypes for rs3200401 and rs13255292 are displayed in Table 2. For rs3200401, the minor T allele was a 2.43-fold candidate risk factor for CRC (Tvs. C, adjusted OR = 2.43, p < 0.0001), as revealed in the allelic model. The genotype and allele frequencies of the major C and minor T alleles were not significantly different between the AP patients and controls (p > 0.05) (Supplementary Table S3). In CRC patients, the genotype and allele frequencies for rs3200401 (C/T) in the codominant model was significantly different than in healthy controls (CC, CT, TT: 22.1%, 44.3%, 33.6% in CRC patients vs. 42%, 48%, 10% in controls) with a minor homozygote TT genotype that showed a 6.79-fold increased risk of CRC (adjusted OR = 6.79, p < 0.0001). Moreover, the CT + TT (dominant model) and TT (recessive model) genotypes showed a 2.62 and 4.82-fold increased risk of CRC (adjusted OR = 2.62 and 4.82, respectively, p < 0.0001) after adjustments for age and sex (Table 2).
Regarding rs13255292, the genotype and allele frequencies were not significantly different between the AP patients and controls (p > 0.05) (Supplementary Table S4). However, the minor T allele was a candidate protective factor against the risk of CRC by 0.66-fold (T vs. C, adjusted OR = 0.66, p = 0.04), as revealed in the allelic model. In CRC patients, the genotype frequencies for rs13255292 in the codominant model were significantly different than in healthy controls (CC, CT, TT: 45.7%, 44.3%, 10% in CRC patients vs. 31%, 55%, 14% in controls) with a heterozygote CT genotype that showed a 0.56-fold decreased risk of CRC (adjusted OR = 0.56, p = 0.086). Furthermore, the CT + TT (dominant model) genotypes showed a 0.54-fold decreased risk of CRC (adjusted OR=0.54, 95% CI = 0.32–0.94, p = 0.021) after adjustments for age and sex (Table 2).

2.3. Association of MALAT1 rs3200401 and PVT1 rs13255292 with CRC vs. Non-CRC

The evaluation of the genotype and allele frequencies between CRC and non-CRC groups showed the same models’ significance for MALAT1 rs3200401 against the genotype and allele frequencies evaluation between CRC vs. healthy control groups. However, the genotype and allele frequencies during the evaluation of PVT1 rs13255292 in CRC vs. non-CRC groups showed only a significant difference in the dominant model (CT + TT vs. CC) as a protective predictor adjusted OR = 0.59, p = 0.034 (Table 2 and Table 3).

2.4. Selection of the Best Fit Models

Non-nested models can be compared using Akaike’s Information Criteria (AIC) and Bayesian Information Criteria (BIC) calculations. A lower AIC and BIC means that the model is more likely to be close to the model that fits the data best or the model that is most likely to predict results. For rs3200401, the allelic model represented the best fit model when comparing CRC vs. healthy control groups and CRC vs. non-CRC. For rs13255292, the dominant model was the best fit model when comparing CRC vs. healthy control and CRC vs. non-CRC (Table 2 and Table 3).

2.5. Haplotype Analysis

We looked at the combined effect of the analyzed gene polymorphisms regarding CRC risk (Table 4). We found that the rs13255292-rs3200401 CT haplotype was associated with increased CRC risk by 2.21-fold (CT vs. CC haplotype, adjusted OR = 2.21, p = 0.0032). Other haplotypes were not statistically associated with CRC risk (TC vs. CC, adjusted OR = 0.64, p = 0.17, TT vs. CC, adjusted OR = 1.5, p = 0.13).

2.6. Serum Expression Levels of MALAT1, PVT1, miRNA-101 and miRNA-186 in CRC and AP

Serum MALAT1 was significantly upregulated with a median (IQR) fold change of 102.5 (35.24–136.8) (p < 0.0001) and 20.50 (11.44–39.87) (p = 0.0234) in CRC and AP patients, respectively, compared to healthy controls. Moreover, serum MALAT1 levels were significantly higher in CRC than AP patients (p = 0.0232) (Figure 1A). Furthermore, serum PVT1 expression was upregulated significantly in CRC and AP patients compared to healthy controls, with a median (IQR) fold change of 117.6 (29.96–279.8) (p < 0.0001) and 23.03 (6.75–49.29) (p = 0.0148), respectively. Besides, serum PVT1 amounts were elevated significantly in CRC patients than AP (p = 0.0391) (Figure 1B).
Serum miRNA-101 and miRNA-186 were downregulated significantly in CRC patients compared to healthy controls, with a median (IQR) fold change of 0.263 (0.0074–0.8587) (p < 0.0031) and 0.1398 (0.01044–0.7203) (p = 0.0236), respectively (Figure 1C,D). Serum miRNA-101 and miRNA-186 levels were quantitatively lower in CRC than AP patients but did not reach statistical significance (p > 0.9) and (p = 0.1577), respectively. By joining the AP group with the control group and comparing them with the CRC group, serum miRNA-101 and miRNA-186 were significantly lower in CRC compared to non-CRC groups (AP + healthy controls) (p = 0.0045) and (p = 0.0025) (Figure 1E,F).

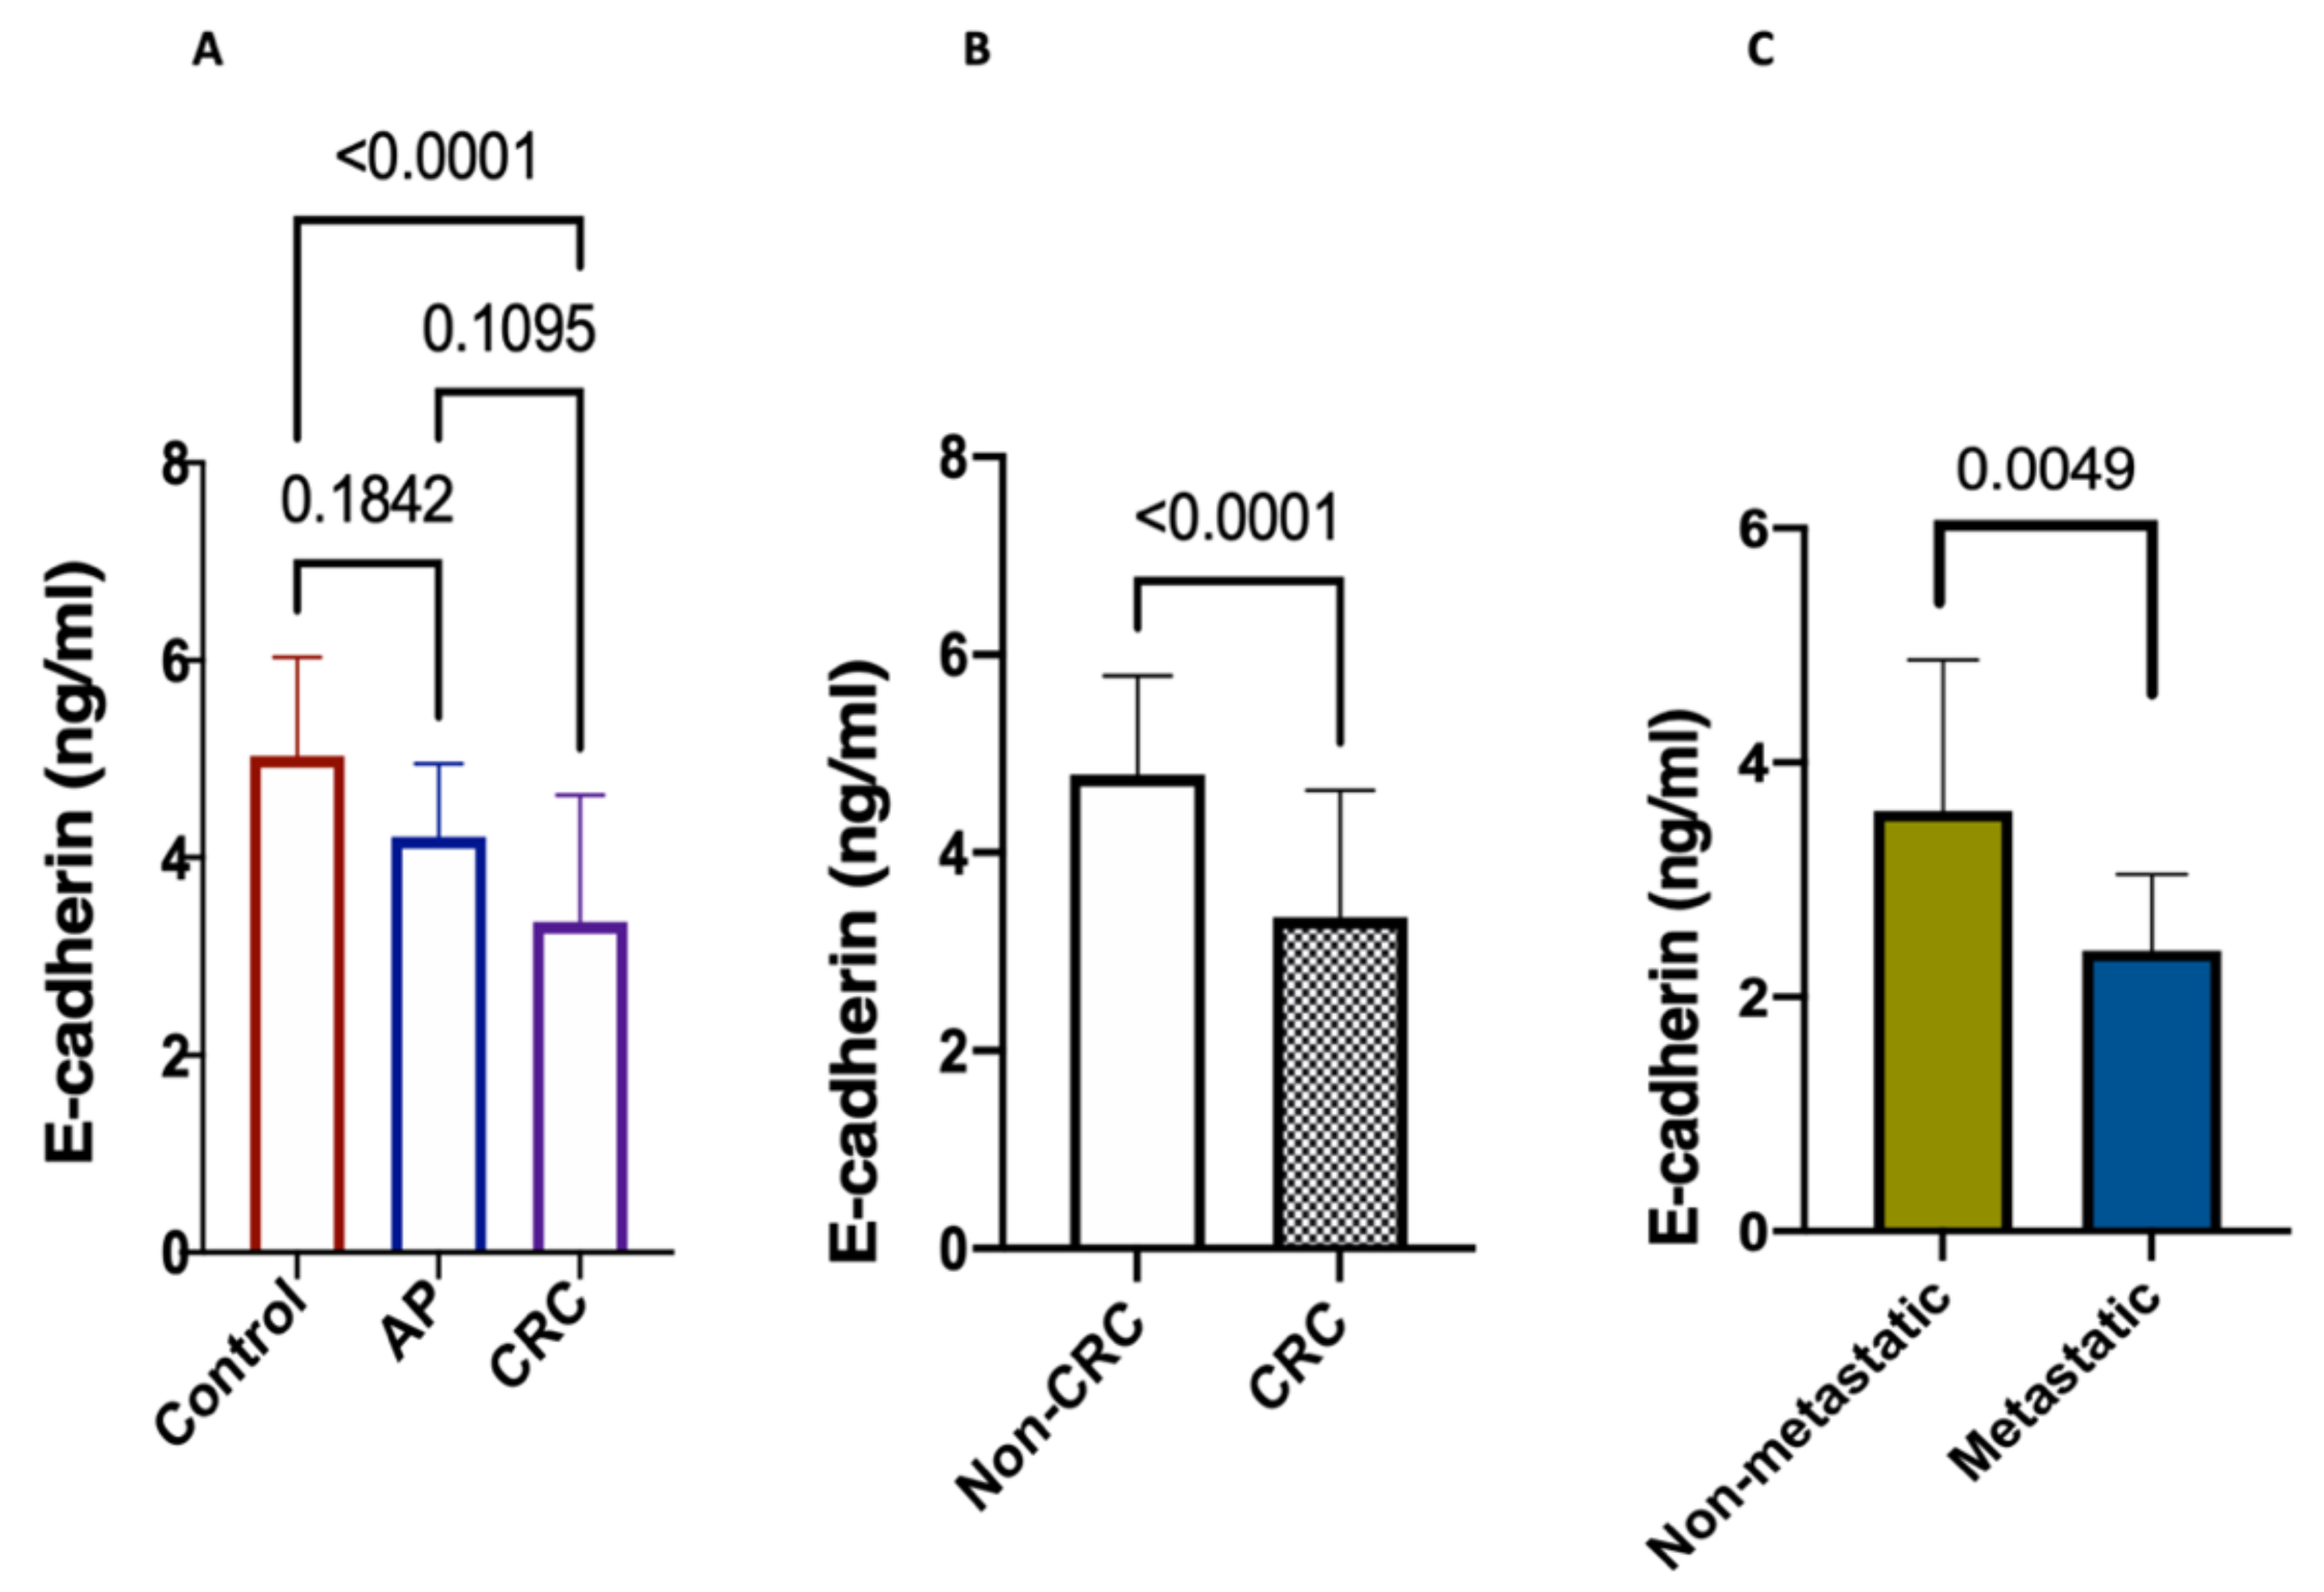
2.7. Serum Levels of E-Cadherin

E-cadherin revealed, in CRC, a significant difference from healthy control group (p < 0.0001), as illustrated in Figure 2A. However, E-cadherin failed to reveal a significant difference between the AP group and both the CRC group (p = 0.1095) and healthy control groups (p < 0.1842). Interestingly, it showed a more substantial decrease in CRC than in non-CRC groups (p < 0.0001) (Figure 2B).
When it comes to comparing E-cadherin levels within the CRC group between the metastasized and non-metastasized patients, we found a loss in E-cadherin expression in the CRC-metastatic group than the CRC-nonmetastatic one (p = 0.0049).

2.8. Association of rs3200401 and rs13255292 with Serum MALAT1, PVT1, miRNA-101, miRNA-186 and E-Cadherin Levels in CRC Patients

To investigate the mechanistic role of rs3200401 and rs13255292 in CRC, we determined serum MALAT1, PVT1, miRNA-101, miRNA-186 and E-cadherin levels in CRC patients carrying different SNP genotypes (Figure 3). We found that serum MALAT1 expression level was higher in the TT genotype carriers of rs3200401 than in the CC as well as TT + CT genotype carriers than in CC genotypes carriers but without reaching the statistical significance (p > 0.05) (Figure 3A), while serum PVT1 expression level was lower in the TT genotype carriers than in the CC and higher in CC genotype than CC + CT genotypes carriers, but without reaching statistical significance (p > 0.05) (Figure 3B). Regarding miRNA-101, we failed to find a significant difference in its expression among CRC patients with different rs3200401 genotypes (p > 0.05) (Figure 3C). Additionally, miRNA-186 expression failed to have a significant difference in its expression levels in the CRC group with different rs13255292 genotypes; however, TT genotype carriers were higher than CC and CC + CT genotypes (p > 0.05) (Figure 3D).
Referring to E-cadherin, there was a higher significant difference in E-cadherin expression levels in CC genotype carriers rs3200401 genotypes than CC + CT genotypes carriers (p = 0.039) (Figure 3F), suggesting an effect of rs3200401 on the EMT process. However, we failed to find a significant difference in its expression among CRC patients with different rs13255292 genotypes (p > 0.05) (Figure 3E).

2.9. Correlation between rs3200401 and rs13255292 and the Clinicopathological Characteristics

Association analyses between MALAT1 rs3200401 and anatomical site, TNM stage, lymph node status and metastasis were performed. MALAT1 rs3200401 showed significant correlation with the lymph node status only for the current models (codominant, recessive and log additive model). However, PVT1 rs13255292 was not significantly associated with the clinicopathological parameters of CRC (adjusted OR > 0.05) (Supplementary Table S5).

2.10. Diagnostic Performance of the Studied Parameters between the Studied Groups

Regarding lncRNAs, ROC analysis revealed that serum MALAT1 and PVT1 distinguished patients with CRC from healthy controls with an AUC = 0.965, 95% CI = 0.9261 to 0.991, p < 0.0001, with sensitivity of 89%, specificity of 95% at a cutoff > 10.70-fold and an AUC = 0.915, 95% CI = 0.8441 to 0.9859, p < 0.0001, with sensitivity of 90%, specificity of 95% at a cutoff > 13.96-fold, respectively.
Serum MALAT1 and PVT1 also discriminated CRC patients from AP with an AUC = 0.823, 95% CI = 0.7210 to 0.9255, p = 0.0004, with sensitivity of 74%, specificity of 92% at a cutoff > 55.6-fold and AUC = 0.769, 95% CI = 0.6581 to 0.8795, p = 0.0010, with sensitivity of 60%, specificity of 94% at a cutoff > 73.9-fold, respectively.
Furthermore, serum MALAT1 and PVT1 discriminated AP from healthy controls with an AUC = 0.965, 95% CI = 0.7639 to 0.9974, p < 0.0001, with sensitivity of 76%, specificity of 95% at a cutoff > 10.9-fold and an AUC = 0.935, 95% CI = 0 0.6581 to 0.8795, p < 0.0001, with sensitivity of 60%, specificity of 94% at a cutoff > 73.9-fold, respectively (Figure 4A–F).
Referring to miRNAs, ROC analysis showed that they discriminated CRC from healthy controls with an AUC = 0.747, 95% CI = 0.6238 to 0.8693, p = 0.0013, with sensitivity of 62%, specificity of 76% at a cutoff < 0.2888-fold for miRNA-101 and an AUC = 0.698, 95% CI = 0.5705 to 0.8247, p = 0.0087, with sensitivity of 54%, specificity of 77% at a cutoff < 0.204-fold for miRNA-186 (Figure 4G,H).
Denoting to E-cadherin, ROC analysis revealed that it could discriminate CRC from healthy controls with an AUC = 0.892, 95% CI = 0.8189 to 0.9646, p < 0.0001, with sensitivity of 70%, and specificity of 95% at a cutoff < 3.661 ng/mL (Figure 4I).

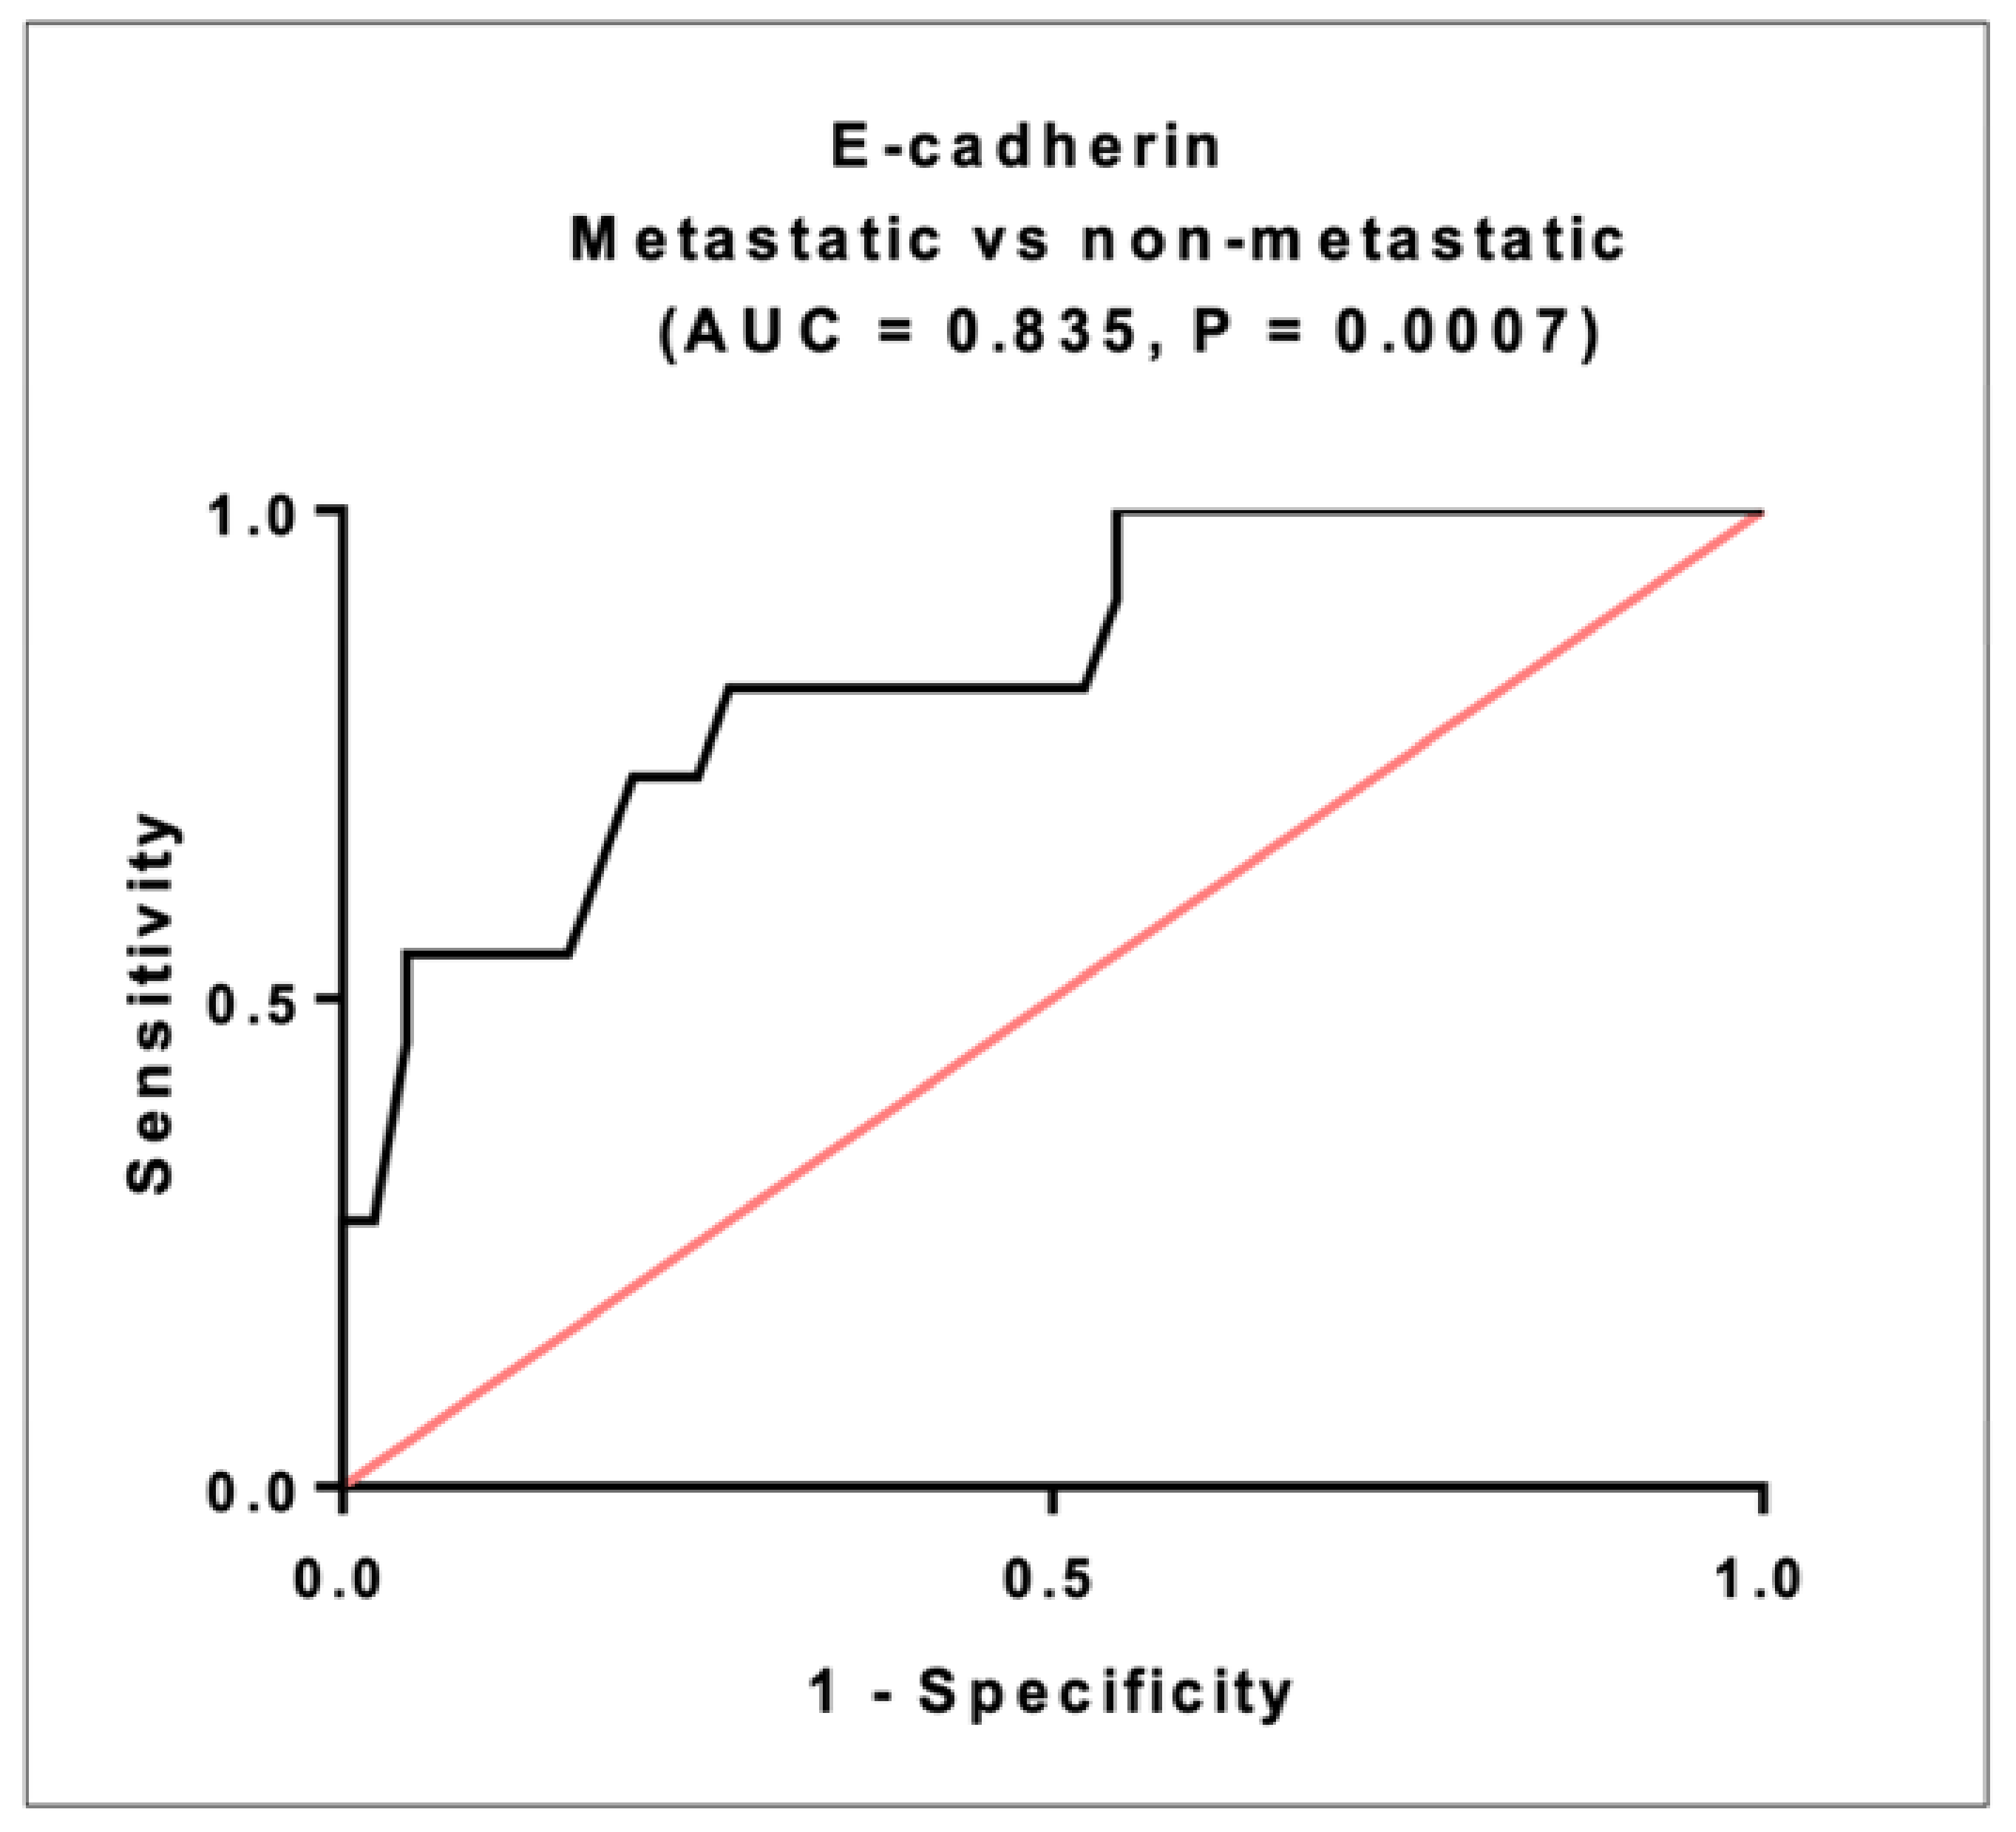
2.11. Prognostic Significance of E-Cadherin in CRC

E-cadherin ROC analysis discriminated metastatic from non-metastatic patients within CRC group with AUC = 0.835, 95% CI = 0.5721 to 0.8504, p = 0.0007. The sensitivity was 81.8% and thespecificity was72.7% at a cutoff < 2.86 ng/mL (Figure 5).

2.12. Diagnostic Performance of the Studied Parameters between CRC and Non-CRC

By comparing AUCs between CRC vs. non-CRC, it could be seen that MALAT1, PVT1 and E-cadherin with AUC = 0.907, 0.848 and 0.864, respectively, represented diagnostic performance superior to miRNA-101 and miRNA-186 with AUC = 0.686 and 0.702, respectively, in CRC diagnosis (Table 5).

2.13. Logistic Regression Analysis of the Studied Parameters

Univariate and multivariate logistic regression analyses were performed to select the predictor parameters associated with CRC risk among non-CRC groups diagnosis (Table 6). Expression levels of MALAT1, PVT1, miRNA-101, miRNA-186 and E-cadherin were selected as significant predictors associated with the chances of CRC diagnosis in the univariate analysis (p < 0.05). In a stepwise forward multivariate analysis, only MALAT1 turned out to be a significant predictor of the risk of being diagnosed with CRC (p = 0.0064).

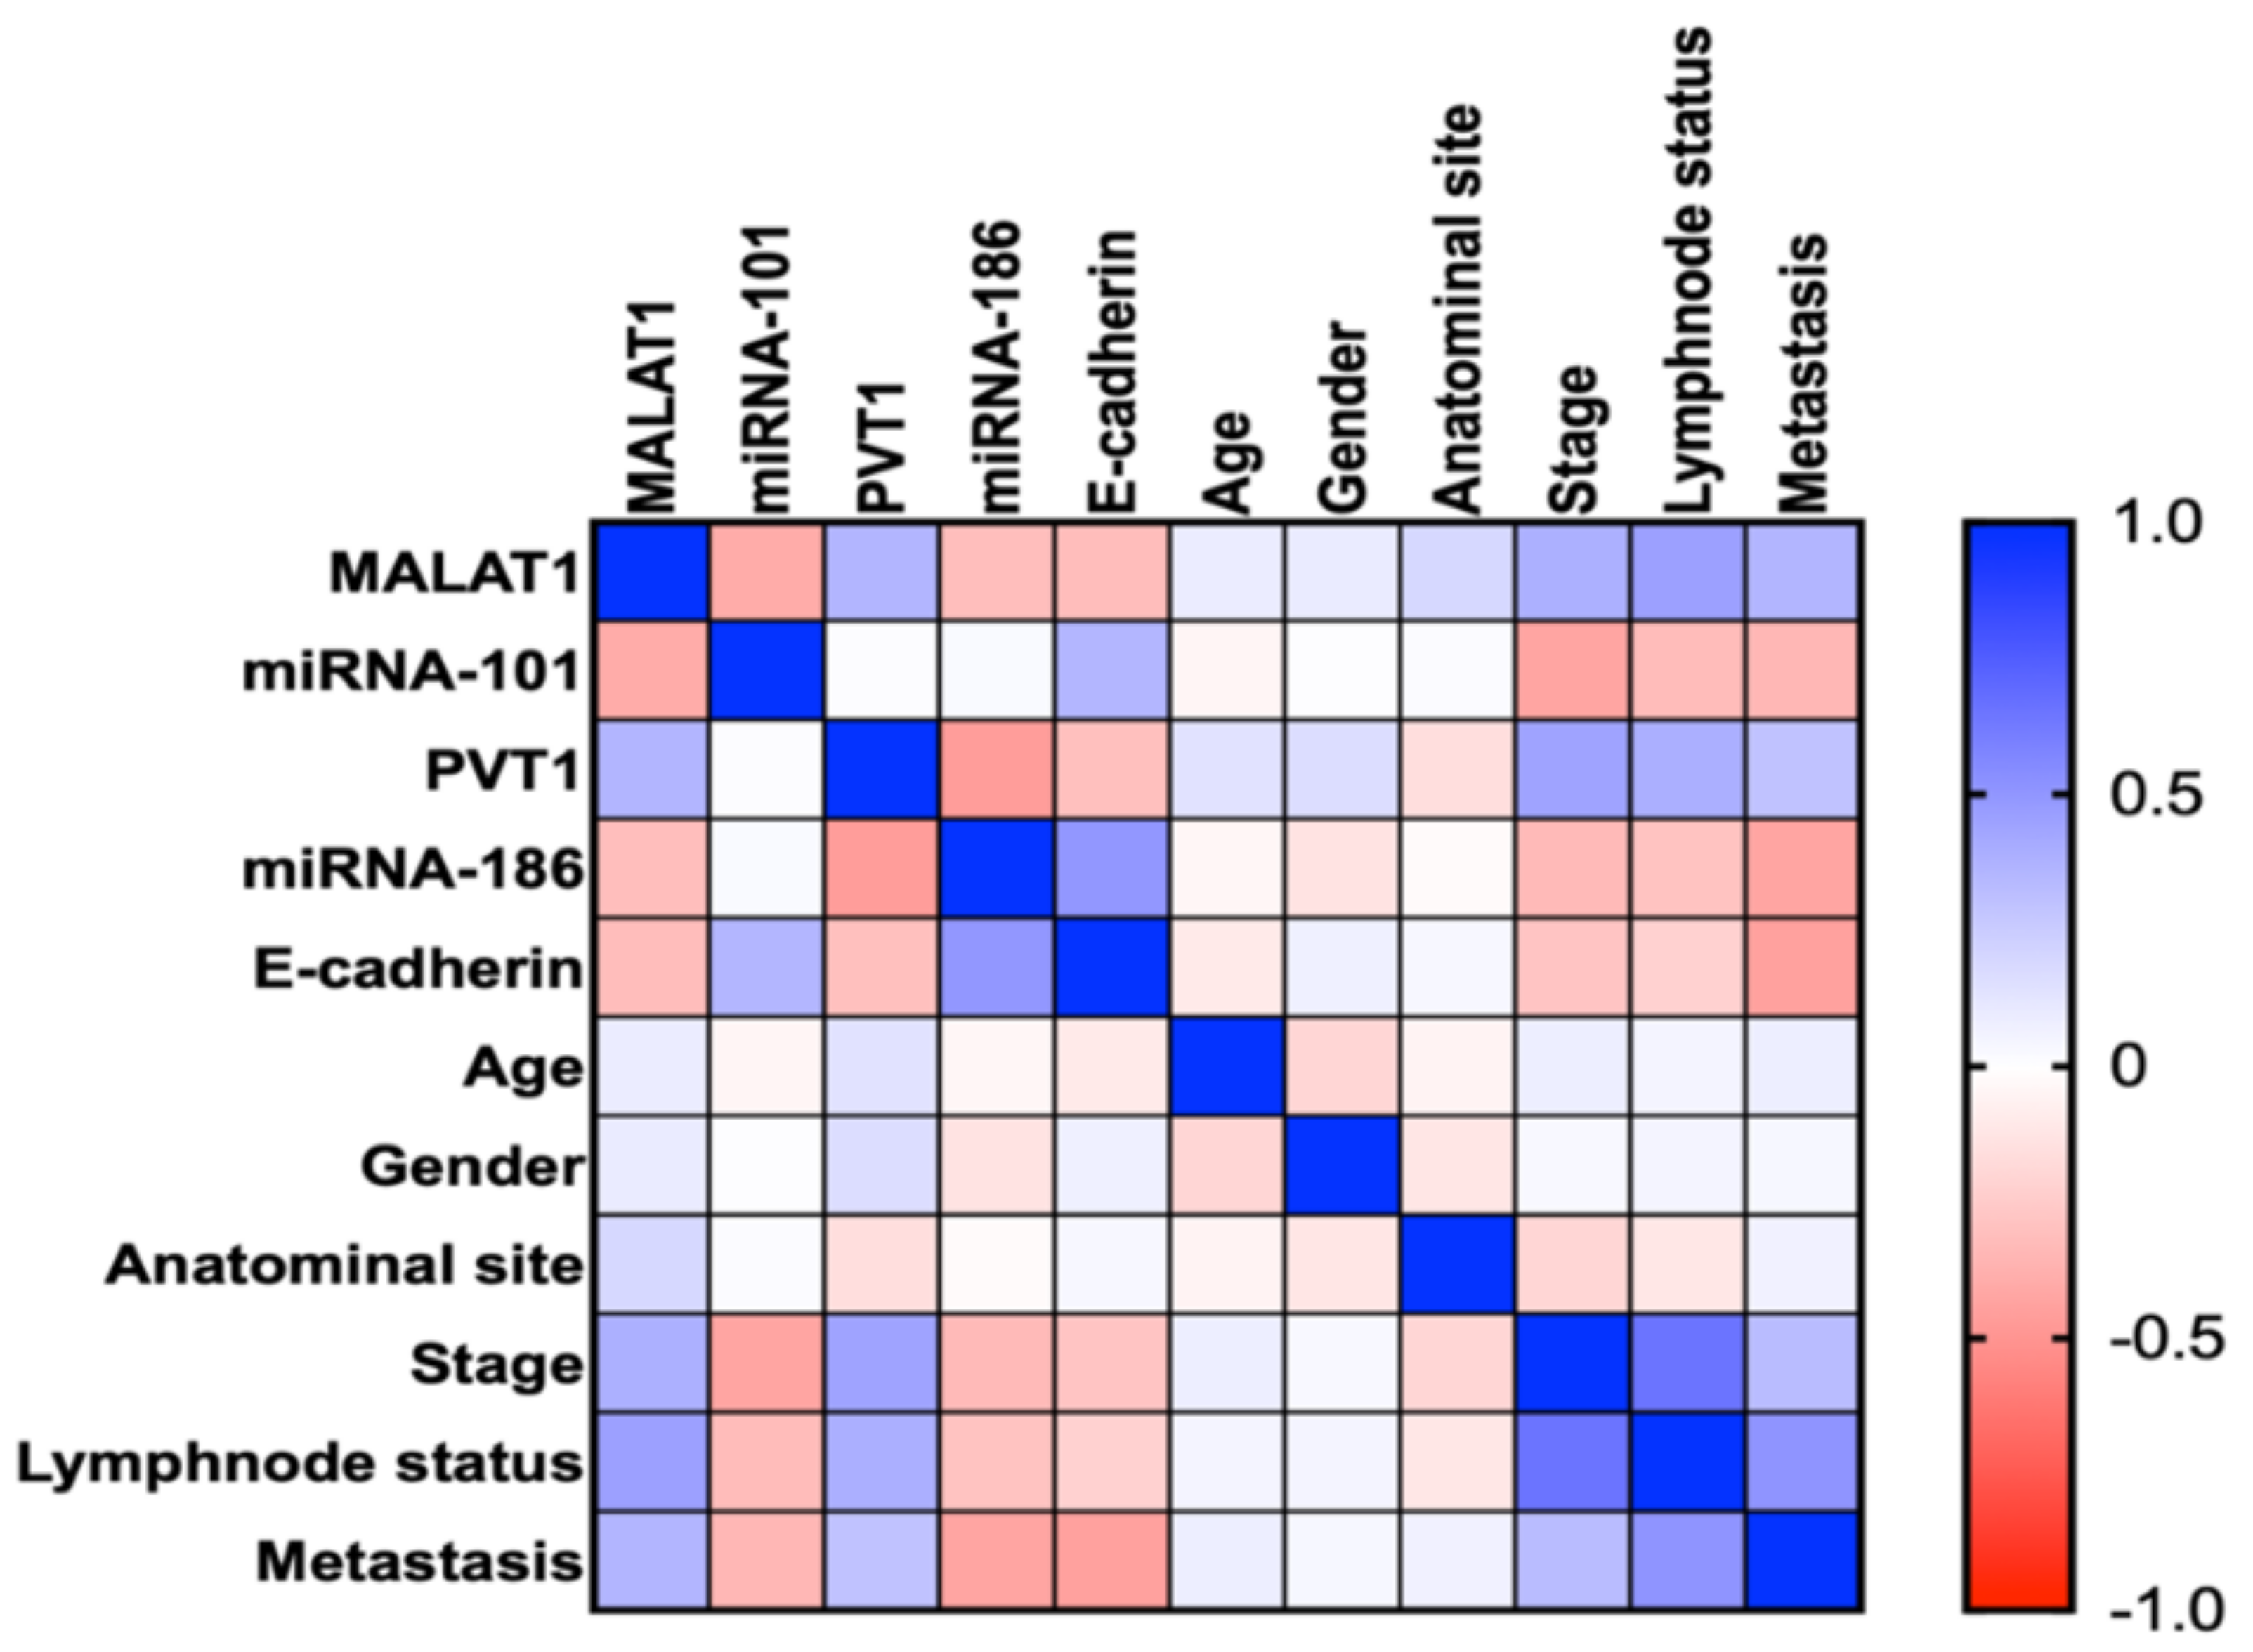
2.14. Correlation between the Studied Parameters and the Clinicopathological Characteristics

In CRC group, we found a significant inverse correlation when it comes to MALAT1 vs. miRNA-101 (r = −0.4025, p = 0.006) and PVT1 vs. miRNA-186 (r = −0.4688, p = 0.002). A significant positive correlation was found between MALAT1 and PVT1 in the CRC group (r = 0.3608, p = 0.014). We also found inverse correlations between MALAT1 and PVT1 with E-cadherin (r = −0.3236, p = 0.0343), (r = −0.3078, p = 0.0447), respectively, and positive correlations between miRNA-101 and miRNA-186 with E-cadherin (r = 0.3559, p = 0.0207), (r = −0.4688, p = 0.001), respectively (Figure 6) (Supplementary Table S6).
In addition, there was a positive correlation between MALAT1 and the clinicopathological parameters in CRC patients e.g., tumor stage (r = 0.3340, p = 0.0231), lymph node status (r = 0.3600, p = 0.019) and metastasis (r = 0.3062 p = 0.0385), respectively. A positive correlation between PVT1 with the tumor stage (r = 0.4412, p = 0.0021), the lymph node status (r = 0.3181, p = 0.0312) and the distant metastasis (r = 0.3018, p = 0.0415) of the CRC patients, respectively. Furthermore, a significant inverse correlation was found between miRNA-101 and miRNA-186 against stage (r = −0.4132, p = 0.0048), (r = −0.2976, p = 0.0588); lymph node status (r = −0.3390, p = 0.0227), (r = −0.1790, p = 0.2627); metastasis (r = −0.3377, p = 0.0233), (r = −0.4011, p = 0.0094), respectively (Figure 6) (Supplementary Table S6).

3. Discussion

There is an urgent need to investigate new biomarkers that could work as a robust panel for CRC diagnosis and screening. Carcinoembryonic antigen (CEA), the current conventional tumor marker in CRC management, is most elevated in the late metastatic stages. It has low sensitivity and specificity when used to distinguish early non-metastatic stages [23]; thus, it is recommended to be used as a biomarker for already confirmed metastasized diagnosed CRC. In clinical practice, the measurement of CEA proved to be a well-established biomarker, most useful in determining distant metastases [24] and monitoring the metastatic disease’s response to systemic therapy and detecting the recurrence of CRC [25]. Therefore, it is primarily used for prognosis [26] and in the surgical planning of CRC, not for new and early diagnosis [27]. Therefore, new diagnostic and prognostic markers are needed.
There is a lack of studies examining modifications in the expression of regulatory lncRNAs and their possible interaction with miRNAs. It is essential to clarify some miRNAs critical roles and their correlated potential host lncRNAs and explore colon cancer regulatory networks.
To date, the study of the SNPs role of MALAT1 rs3200401 and PVT1 rs13255292 in various oncological processes development is still unclear. This is particularly important when it comes to investigating their evidence on serum MALAT1 and PVT1; and their crosstalk with their inversely correlated miRNAs, miRNA-101 and miRNA-186. Besides their possible indirect effect on the EMT process in CRC patients.
The current study has demonstrated that genetic variants that include MALAT1 rs3200401 and PVT1 rs13255292 exhibited effects on the development and predisposition to CRC, but not the formation of the adenomatous polyp. Interestingly, the haplotype containing the two risk alleles of both SNPs was associated with increased CRC risk. In addition, serum MALAT1, PVT1, miRNA-101 and miRNA-186 expression levels seemed to be associated with these SNPs, but did not reach the significance level. These findings may contribute to the diverse nature and pathology of CRC and include these SNPs as possible genetic susceptibility markers for sporadic and non-inherited CRC via functional intonation of the expression of lncRNAs.
Firstly, to the best of our knowledge, the findings have shown that T allele carriers in PVT1 rs13255292 confer a protective effect against the growth and progression of CRC. Only one study testified rs13255292 in diffuse large B-cell lymphoma (DLBCL); by contrast, it was found that T allele PVT1 rs13255292 was the risk of DLBCL [28]. We need more studies to elaborate the exact rs13255292 action in different populations.
As far as we know, this is the first research to assess the MALAT1 rs3200401 variant in CRC. Patients in our research carrying the T allele in the MALAT1 rs3200401 variant were found to associate with the risk of CRC. The finding is harmonized with the studies that indicated that T allele carriers have a risk of different malignancies such as prostate cancer [29], esophageal squamous cell carcinoma [30] and gastric cancer [31]. However, other studies have shown that patients who are major T allele carriers can explain the decreased aggressiveness toward tumors, while also explaining the improved survival rates in various cancer forms, such as breast cancer [32] and advanced lung adenocarcinoma patients [33]. These discrepant results might be because of the assessment of other kinds of cancer and diverse populations.
The lncRNA SNP database, as stated by a research study, was used to envisage the possible roles of rs3200401 [34]. The C and T variation of rs3200401 events may modify the structural peculiarities of MALAT1, leading to a weakened interaction between MALAT1 and its binding protein SRSF2 (serine and arginine rich splicing factor 2) as a protein-coding gene [6]. Besides, MALAT1 was testified to accompany phosphorylation of SRSF2, interaction with SR proteins (i.e., RNA-binding proteins) as a “molecular sponge,” and alternate splicing pre-mRNAs regulation. Altogether, it was biologically conceivable that SNP rs3200401 C and T alleles could remodel cancer-associated genes’ expression degrees, consequently participating in the carcinogenesis and progression of cancer [30,35]. However, rs13255292 is identified in limited numbers of literature; consequently, its functional role and molecular mechanism regarding the alteration of PVT1 features remain unclear.
MALAT1 and PVT1 were recognized as oncogenic lncRNAs in various malignancies, they have been associated with reduced survival duration in several studies [33,36]. Thus, their biological roles have recently attracted interest in the production and advancement of CRC. In CRC patients, expression levels of MALAT1 and PVT1 were overexpressed compared to AP and healthy control, indicating a poor prognosis. However, only an association between MALAT1 rs3200401 and the lymph node status, suggesting that rs3200401 has a prognostic value. However, PVT1 rs13255292 and the clinicopathological factors were not related.
Nevertheless, there are rare reports of MALAT1 and PVT1 pathways involved in the tumorigenesis and growth of CRC. As a critical cellular program characterized by the loss of epithelial characteristics and mesenchymal phenotype acquisition, EMT is always identified as the crucial step of metastasis. Nonetheless, MALAT1 and PVT1 were reported through their sponging function, and have a critical regulating role on EMT [35,37], thereby promoting metastasis and CRC progression.
This study revealed that MALAT1 and PVT1 were overexpressed in CRC and negatively correlating with E-cadherin as one of the EMT process indicative markers and part of an EMT regulatory network, indicating that MALAT1 and PVT1 could act as potential prognostic markers. It has been ascertained that the phase of EMT is correlated with poor results and is valuable as a CRC prognostic indicator [38].
We found that miRNA-101 with E-cadherin decreased significantly in the CRC group more than AP and healthy control, which was matched with preceding research which reported that MALAT1 induces EMT through different mechanisms, e.g., the Wnt/β-catenin [35], Ezh2-Notch1 [39] and TGF-β signaling pathways [40]. Furthermore, it was identified that miRNA-101 could bind to complementary sequences in MALAT1 [41]. Increased expression of miRNA-101 contributes to the downregulation of MALAT1; upregulation of MALAT1 acting as an endogenous sponge gene decreased the expression of miRNA-101 in glioma [41] and liver fibrosis [42]. Because TGF-β was found to be a potent EMT inducer, CRC cells treated with TGF-β reported microscopic morphological changes consistent with EMT and showed decreased levels of E-cadherin [43]. Furthermore, because miRNA-101 plays a crucial role in TGF-β modulation [41,44], we assume that the upregulation of MALAT1 leads to the subsequent downregulation of miRNA-101, promoting the expression of TGF-β, leading to eventually diminishing E-cadherin, promoting metastasis and CRC progression.
In our research, miRNA-186 with E-cadherin concomitantly downregulated significantly in the CRC group more than AP and healthy control, indicating the promotion of CRC invasion, migration and metastasis. These findings are agreed with the reported assay of PVT1 functions in EMT, cancer metastasis and migration [16,45]. It has been established that PVT1 contributed to the PVT1/miRNA-186/Twist1 regulatory, confirming that PVT1 endorses the expression of Twist1 via its knockdown role, which is a transcription factor linked to the EMT process, thus promoting the EMT [37].
Regarding the studied markers’ diagnostic performance, circulating lncRNAs and miRNAs are easily accessible, valid and accurate genetic tests in different types of cancer, including CRC [46,47,48]. Here, we observed that serum MALAT1, PVT1, miRNA-101 and miRNA-186 were distinctively expressed between individuals with CRC and healthy control and/or non-CRC, besides being distinguished against CRC from other groups with moderate to high sensitivity and specificity, indicating serum MALAT1, PVT1, miRNA-101 and miRNA-186 as potential novel biomarkers for early and new CRC diagnosis. Nevertheless, serum MALAT1, PVT1, miRNA-101 and miRNA-186 in the CRC against non-CRC groups were significantly upregulated, and ROC analysis differentiated the two groups. Remarkably, MALAT1 and PVT1 showed higher accuracy, superior sensitivity and specificity than miRNA-101 and miRNA-186. These findings associate serum MALAT1 and PVT1 as reliable non-invasive early biomarkers and promising therapeutic targets for CRC treatment. Although the combination of MALAT1 and PVT1 with other tumor markers may improve the early CRC diagnosis, this needs further investigation.
Even so, a significant positive association was also observed between serum MALAT1 and PVT1, indicating their concomitant expression in CRC. Besides, associations between these lncRNAs and CRC clinicopathological parameters were found, such as stage, nodal and distant metastases, suggesting that MALAT1 and PVT1 play a crucial role in directly contributing to tumor progression. Consistent with other similar studies that reported MALAT1 and PVT1 were correlated with CRC nodal and/or distant metastases and different types of cancer [36,49,50]. The identification of MALAT1 and PVT1 downstream targets played an essential role in assuming their probable mechanisms. Previous studies have stated that MALAT1 targets RUNX2, β-catenin, AKAP-9 and Akt/mTOR signaling [51,52,53] and PVT1 targets MYC, YAP1 and LASP1 [54,55], respectively, promoting tumorigenesis.
Our research maintained a substantial negative association between serum miRNA-101 and miRNA-186, CRC tumor-related records, stage, nodal, and metastases. These results confirmed that miRNA-101 and miRNA-186 were tumor suppressive miRNAs in CRC. What is agreed with different studies that reported miRNA-101 and miRNA-186 were correlated inversely with stage, nodal and/or CRC distant metastases and other tumors [10,11,56]. As miRNAs typically use their influence on their downstream targets, the identification of miRNA-101 and miRNA-186 downstream targets played an essential role in understanding their probable mechanisms. The miRNA-101 has been documented to target EZH2, c-FOS, CXCR7, Rac1, COX2 and SOX9 and miRNA-186 has been reported to target YAP1, NR5A2, MTSS1 and NSBP1 in different kinds of malignancies [10,57], thus, suppressing cell proliferation, inducing apoptosis, thus acting as promising therapeutic targets.
Referring to the diagnostic and prognostic performance of E-cadherin, it exhibited high sensitivity and specificity, showing potential diagnostic and prognostic performance. Moreover, it showed a positive correlation with miRNA-101 and miRNA-186 and an inverse correlation with MALAT1 and PVT1; these correlations may prove that a decrease in E-cadherin expression in the primary tumor is correlated with the ability of the tumor to spread, implying PVT1/miRNA-186 and MALAT1/ miRNA-101 in this context. This may be a prognostic factor for the further development of cancer.
However, the gold standard for CRC screening is colonoscopy; new and efficient non-invasive diagnostic and prognostic biomarkers are better and simpler to use than the invasive method of a colonoscopy, which appears to be reproducible and cost-effective. Noticeably, the limitations of our study should not be ignored. The sample size of our research which includes 280 volunteers may led to a limited statistics power. Thus, this research needed to be testified on a broader scale or population with a larger number of participants and different racial groups.
In conclusion, this study is the first to assess MALAT1 rs3200401 and PVT1 rs13255292 SNPs in CRC and introduce them as genetic biomarkers of CRC. Furthermore, lncRNAs MALAT1 and PVT1 may act as robust diagnostic and prognostic markers; furthermore, miRNA-101 and miRNA-186 may serve as markers with powerful diagnostic and predictive capabilities. Notwithstanding, our results involve MALAT1 rs3200401 and PVT1 rs13255292 as potential genetic markers of CRC predisposition. MALAT1 is an independent predictor and could be of clinical value in CRC diagnosis.
Among non-CRC classes, MALAT1 rs3200401 could predict the risk of CRC diagnosis. CRC screening, genetic therapy, and hope for large-scale use are potential implications of our data. Eventually, the association of the studied ncRNAs with CRC environmental risk factors should be assessed in the future.

4. Materials and Methods

4.1. Patients

This hospital-based case control research paper included 280 individuals classified as 140 CRC cases, most of them with adenocarcinoma type, 40 patients with adenomatous polyps (AP), and 100 cancer-free controls. A follow-up colonoscopy and the positive results corroborated by pathology confirmed that the recruited personnel were assorted. All participators who did attend the Gastrointestinal (GI) Endoscopy Unit in Kasr Al-Ainy Hospital, Cairo University were all grownup (>18 years old), CRC and AP groups (n = 180). Colonoscopy was recommended for screening symptoms of the lower GI tract, including chronic constipation and diarrhea, alternating or mixed-type irritable bowel syndromes and rectum bleeding, which may indicate the presence of CRC. Additionally, worry of CRC symptoms and signs, such as severe unexplained weight loss and unexplained anemia, were addressed.
Each patient’s clinical data were fully compiled, including their full medical history, blood count, sedimentation rate of erythrocyte (ESR), fecal occult blood test, and biochemical liver profile. CRC patients’ clinical characteristics, including TNM stage, lymph node status, metastasis level, and tumor grade, were also reviewed from health records documentation. In addition, the differentiation criteria between metastatic and non-metastatic patients depend on computerized tomography (CT) scan, positron emission tomography (PET) scan or magnetic resonance imaging (MRI). In-person interviews were conducted to collect epidemiological information among first-degree relatives, such as gender, age, smoking status, and cancer history. The primary clinical data for all participants are included in Table 1. Patients who had cancer at any other site, previously undergoing chemotherapy and/or radiotherapy for CRC, and/or having been diagnosed with inflammatory bowel disease (IBD) were rejected.
Compatible controls were of matched age and sex for the patient population. Malignancy, polyps, or IBD were screened during the colonoscopy, and the test results of healthy controls were therefore negative. They had no genetic predisposition to hereditary adenomatous polyposis and familial non-polyposis CRC. Simultaneously, as CRC patients were registered, they were randomly chosen from physical examination populations in the same hospital.
The whole study and experimentations have been done in compliance with the applicable regulations and guidelines. All patients and controls or their legal representatives received a formal informed consent agreement. The Ethics Committee of the Faculty of Pharmacy, Cairo University approved the study protocol under approval no. (BC2553) and the informed consent in correspondence to the ethical principles of the Declaration of Helsinki.

4.2. Blood Collection and Storage

Blood samples of sex milliliters were withdrawn and separated into two vacutainers. The first 3 mL were collected into EDTA vacutainers for DNA extraction and genotyping; the rest of the blood was preserved in yellow gel vacutainers; after 30 min, the yellow vacutainers were subjected to centrifugation at 4000 rpm for 10 min to get the sera separated from clotted whole blood. Sera were divided into two aliquots, the first aliquoted sera were utilized for RNA extraction, and the other ones were used for the assay of E-cadherin. All aliquots were kept frozen at −80 °C until use.

4.3. SNPs Position

The substitution of cytosine with thymine at the 65504361 site of chromosome 11 is the essence of the rs3200401 SNP of the MALAT1 gene, whereas the substitution of cytosine with thymine at the 128064327 site of chromosome 8 is the essence of the rs13255292 SNP of the PVT1 gene. In addition, rs3200401 is considered a noncoding transcript variant in contrast to rs13255292, which is considered an intron variant.

4.4. Selection of SNPs

We elected SNPs depending on the criteria of the global minor allele frequency MAF > 0.1, reported functional resemblance with their product, and previously reported correlations with cancer, knowing that the selected SNPs were not extensively studied in CRC and its related hallmarks. According to the SNPedia and NCBI dbSNP database, there are 24 prevalent SNPs located on the MALAT1 gene. Almost all of them have the MAF < 0.10 according to Ensembl release 102—November 2020. However, rs3200401, rs4102217, rs591291, rs1194338, rs7133268 and rs7763881 are the only 6 SNPs that have global MAF > 0.1; of which the rs3200401 was the only relevant SNP. Furthermore, the lncRNA MALAT1 has many reported functional analyses with rs3200401 in many cancer types, such as gastric cancer, bladder cancer, lung carcinoma and breast cancer. Furthermore, rs3200401 had an apparent influence on the secondary structural characteristics and stability of MALAT1 [58] and relevant to CRC [32]. Referring to PVT1 SNPs, rs13255292, rs2608053 and rs1561927 are the only SNPs with MAF > 0.1 rs13255292 is the most functional reported one, and it is reported in a closely related disease, which is ovarian cancer [22].

4.5. DNA Extraction and Genotyping

From whole EDTA blood samples, genomic DNA was extracted from all participants using the QIAamp DNA Mini Kit, according to the manufacturer’s instructions (Qiagen, Valencia, CA, USA). The yield purity and quantity were measured by the NanoDrop 2000 c model (Thermo Fisher Scientific, Waltham, MA, USA). Utilizing pre-designed primer/probe sets for rs3200401 (C/T) [Assay ID: C_3246069_10, Catalog number: 4351379] and rs13255292 (C/T) [Assay ID: C_3023274_10, Catalog number: 4351379] (Thermo Fisher Scientific, Waltham, MA, USA), genotyping was conducted using real-time PCR with the TaqMan allelic discrimination assay. DNA amplification was performed using a TaqMan Master Mix, containing 12.5 μL of TaqMan and 1.25 μL of TaqMan and probe/primer solution in a volume of 25 μL, one μL of DNA, and 10.25 μL of H2O. Real-time PCR was conducted applying Qiagen Rotor-Gene Q System; the following was implemented: 95 °C for ten minutes, then cycles of 92 °C for fifteen seconds and 60 °C for ninety seconds.

4.6. Assay of Serum MALAT1, PVT1, miRNA-186 and miRNA-101 by RT-qPCR

The miRNeasy extraction kit (Qiagen, Valencia, CA, USA) was used to deduce the total RNA from 200 μL hemolysis-free serum using one mL of QIAzol lysis reagent, as directed by the production company. To assess RNA concentration and purity, the NanoDrop 2000 c model (Thermo Fisher Scientific, Waltham, MA, USA) was used. In both lncRNA and miRNA expression analysis, the extracted RNA was used.
In a final volume of twenty μL RT reactions using the RT2 first strand kit (Qiagen, Valencia, CA, USA), the reverse transcription (RT) for MALAT1 and PVT1 was performed using 0.1 μg of total RNA, as instructed by the manufacturer. The RT products were diluted with fifty µL RNase-free water before real-time PCR. Serum expression of the studied lncRNAs was assessed employing GAPDH as an internal control using custom-made primers and the PCR Maxima SYBR Green kit (Thermo Fisher Scientific, Waltham, MA, USA) as previously described [59]. The primers used in this study were as follows: MALAT1 forward, 5′-GCAGGGAGAATTGCGTCATT-3′ and reverse, 5′-TTCTTCGCCTTCCCGTACTT-3′ [35]; PVT1 forward, 5′- TGAGAACTGTCCTTACGTGACC-3′, reverse, 5′-AGAGC ACCAAGACTGGCTCT −3′ (Invitrogen) [60]. Moreover, the primer sequences of GAPDH were forward, 5′-CCCTTCATTGACCTCAACTA-3′, reverse, 5′-TGGAAGATGGTGATGGGATT-3′. In short, real-time PCR was performed on twenty μL of reaction mixtures prepared by mixing ten μL of the master mix, one μL of the forward primer, one μL of reverse primer, 2.5 μL of dilute cDNA and 5.5 μL of RNase-free water with the Qiagen Rotor-Gene Q System. The program was run for ten minutes at 95 °C, followed by 45 cycles for fifteen seconds at 95 °C and sixty seconds at 60 °C. Cycle threshold (Ct) is the number of cycles needed to reach the fluorescent signal above real-time PCR threshold. For relative quantification, the fold change was calculated using 2−∆∆Ct.
The miScript II RT Kit (Qiagen) was used to perform RT for miRNA-186 and miRNA-101. The cDNA samples were amplified according to the manufacturer’s instructions using the miScript SYBR Green PCR kit (Qiagen), the supplied miScript Universal Primer (reverse primer), along with miRNA-186 and miRNA-101 specific primers (forward primer). Shortly, real-time PCR was performed in twenty μL reaction mixtures where 5.5 μL of RNase free water, ten μL of miScript SYBR Green PCR Master Mix, and two μL of miScript forward and reverse primers were mixed with 2.5 μL of appropriately diluted cDNA template. In the Rotor-Gene Q equipment, PCR runs were performed under the following conditions: 95 °C for thirty minutes, followed by 40 cycles at 94 °C for fifteen seconds, 55 °C for thirty seconds, and 70 °C for thirty seconds. As previously mentioned, miRNA SNORD68, the housekeeping miScript PCR control, was used as an endogenous control [20].

4.7. Assessment of Serum E-Cadherin by Enzyme-Linked Immunosorbent Assay (ELISA)

A human E-cadherin ELISA kit (ab233611) for the quantitative assessment of human E-cadherin was provided by Abcam (Trumpington, Cambridge, UK).

4.8. Statistical Methods

Data were analyzed using GraphPad Prism 9.0 statistics software (San Diego, CA, USA) and SPSS software (Chicago, IL, USA) version-25. Qualitative data were expressed as number and percentage. while numerical data were described in terms of mean ± SD and median, interquartile range (IQR) or range as appropriate. Testing for normality was applied using Kolmogorov–Smirnov, D’Agostino and Pearson, and Shapiro–Wilk tests. We compared normally distributed variables using student’s t-test or one-way ANOVA followed by Tukey’s post hoc test when appropriate. However, not normally distributed variables, their comparisons tested using the Mann–Whitney U test or the Kruskal–Wallis test followed by a post hoc test if significant when appropriate. For genotypes investigation in controls and patient groups, the Hardy–Weinberg equilibrium (HWE) was used, complying with a goodness-of-fit chi-square test. When appropriate, Chi-square or Fisher’s exact tests were used to compare categorical data. Associations between SNPs and CRC risk have been evaluated in unconditional logistic regression models by odds ratios (ORs) and corresponding 95% confidence intervals (95% CIs). Spearman’s rho correlation coefficient were calculated as appropriate to evaluate the relationship between the measurements. Receiver-operating-characteristic (ROC) curve was used to evaluate the studied parameters’ diagnostic accuracy, and the area under the curve (AUC) was determined. When AUC < 0.6, it was regarded as inconsequential; on the other hand, between 0.7–0.89, a potential or promising discriminator was considered, even though AUC > 0.9 was supposed to be a significant discriminator. SNPs analysis, SNPs correlation with clinicopathological parameters and haplotype analysis (allelic combinations) were carried out using the online SNPstats software (https://snpstats.net/, accessed on 15 May 2021) in logistic regression models. The variables of age and sex were used to account for variation in SNP results due to outside influences. For the adjustment of the data to the confounding factors, age and sex were included as covariates. Significant predictor variables in the univariate analysis were included in a stepwise forward multivariate analysis to determine the final predictor variables for the probability of being diagnosed with CRC. An internal 10-fold cross-validation was conducted to confirm the reproducibility of the results. When the p-value is equal to or less than 0.05, we regard the results as statistically significant. All tests were two-tailed.

Supplementary Materials

Data can be found in the supplementary materials document which are available online at https://0-www-mdpi-com.brum.beds.ac.uk/article/10.3390/ijms22116147/s1. Table S1: Minor allele frequencies of the studied SNPs. Table S2: Hardey-Winberg equilibrium of rs3200401 and rs13255292 in CRC group. Table S3: MALAT1 rs3200401 C/T association with control and AP groups. Table S4: PVT rs13255292 C/T association with control and AP groups. Table S5: Correlation between the studied SNPs and clinicopathological factors. Table S6: Correlation between the studied parameters and clinicopathological factors.

Author Contributions

A.F.R.; Investigation, Methodology, Resources, Data Curation, Formal analysis, Visualization, Writing—Original Draft. O.G.S.; Investigation, Methodology, Resources, Funding acquisition. N.A.E.-B.; Conceptualization, Supervision, Project administration, Writing—Review & Editing. M.A.S.; Conceptualization, Supervision, Methodology, Data Curation, Formal analysis, Visualization, Writing—Review and Editing. All authors have read and agreed to the published version of the manuscript.

Funding

This work was supported by a project funded by Cairo University entitled “long noncoding RNA signature in CRC”.

Institutional Review Board Statement

The whole study and experimentations have been done in compliance with the applicable regulations and guidelines. All patients and controls or their legal representatives have received a formal informed consent agreement. The Ethics Committee of the Faculty of Pharmacy of the University of Cairo approved the study protocol under approval no. (BC2553) and the informed consent in correspondence to the ethical principles of the Declaration of Helsinki.

Informed Consent Statement

Informed consent was obtained from all subjects involved in the study. Written informed consent has been obtained from the patients to publish this paper.

Data Availability Statement

All data generated or analyzed during this study are included in this published article and its supplementary information files.

Acknowledgments

The authors express their gratitude to all of the patients and subjects who took part in this study.

Conflicts of Interest

The authors declare no conflict of interest.

References

  1. Siegel, R.L.; Mph, K.D.M.; Sauer, A.G.; Fedewa, S.A.; Butterly, L.F.; Anderson, J.C.; Cercek, A.; Smith, R.A.; Jemal, A. Colorectal cancer statistics, 2020. CA A Cancer J. Clin. 2020, 70, 145–164. [Google Scholar] [CrossRef] [PubMed] [Green Version]
  2. Keum, N.; Giovannucci, E. Global burden of colorectal cancer: Emerging trends, risk factors and prevention strategies. Nat. Rev. Gastroenterol. Hepatol. 2019, 16, 713–732. [Google Scholar] [CrossRef] [PubMed]
  3. Grillone, K.; Riillo, C.; Scionti, F.; Rocca, R.; Tradigo, G.; Guzzi, P.H.; Alcaro, S.; Di Martino, M.T.; Tagliaferri, P.; Tassone, P. Non-coding RNAs in cancer: Platforms and strategies for investigating the genomic “dark matter”. J. Exp. Clin. Cancer Res. 2020, 39, 1–19. [Google Scholar] [CrossRef]
  4. Ji, X.; Zhang, J.; Liu, L.; Lin, Z.; Pi, L.; Lin, Z.; Tian, N.; Lin, X.; Chen, S.; Yu, X.; et al. Association of tagSNPs at lncRNA MALAT-1 with HCC Susceptibility in a Southern Chinese Population. Sci. Rep. 2019, 9, 1–7. [Google Scholar] [CrossRef] [PubMed]
  5. Zhuang, M.; Zhao, S.; Jiang, Z.; Wang, S.; Sun, P.; Quan, J.; Yan, D.; Wang, X. MALAT1 sponges miR-106b-5p to promote the invasion and metastasis of colorectal cancer via SLAIN2 enhanced microtubules mobility. EBioMedicine 2019, 41, 286–298. [Google Scholar] [CrossRef] [PubMed] [Green Version]
  6. Li, Z.-X.; Zhu, Q.-N.; Zhang, H.-B.; Hu, Y.; Wang, G.; Zhu, Y.-S. MALAT1: A potential biomarker in cancer. Cancer Manag. Res. 2018, ume 10, 6757–6768. [Google Scholar] [CrossRef] [Green Version]
  7. Wang, C.-Z.; Deng, F.; Li, H.; Wang, D.-D.; Zhang, W.; Ding, L.; Tang, J.-H. MiR-101: A potential therapeutic target of cancers. Am. J. Transl. Res. 2018, 10, 3310–3321. [Google Scholar]
  8. Wang, X.; Li, M.; Wang, Z.; Han, S.; Tang, X.; Ge, Y.; Zhou, L.; Zhou, C.; Yuan, Q.; Yang, M. Silencing of Long Noncoding RNA MALAT1 by miR-101 and miR-217 Inhibits Proliferation, Migration, and Invasion of Esophageal Squamous Cell Carcinoma Cells. J. Biol. Chem. 2015, 290, 3925–3935. [Google Scholar] [CrossRef] [Green Version]
  9. Si, Y.; Yang, Z.; Ge, Q.; Yu, L.; Yao, M.; Sun, X.; Ren, Z.; Ding, C. Long non-coding RNA Malat1 activated autophagy, hence promoting cell proliferation and inhibiting apoptosis by sponging miR-101 in colorectal cancer. Cell. Mol. Biol. Lett. 2019, 24, 1–12. [Google Scholar] [CrossRef]
  10. Wang, J.; Zeng, H.; Li, H.; Chen, T.; Wang, L.; Zhang, K.; Chen, J.; Wang, R.; Li, Q.; Wang, S. MicroRNA-101 Inhibits Growth, Proliferation and Migration and Induces Apoptosis of Breast Cancer Cells by Targeting Sex-Determining Region Y-Box 2. Cell. Physiol. Biochem. 2017, 43, 717–732. [Google Scholar] [CrossRef]
  11. Xu, C.; Li, B.; Zhao, S.; Jin, B.; Jia, R.; Ge, J.; Xu, H. MicroRNA-186-5p Inhibits Proliferation And Metastasis Of Esophageal Cancer By Mediating HOXA9. OncoTargets Ther. 2019, ume 12, 8905–8914. [Google Scholar] [CrossRef] [Green Version]
  12. Fan, H.; Zhu, J.-H.; Yao, X.-Q. Long non-coding RNA PVT1 as a novel potential biomarker for predicting the prognosis of colorectal cancer. Int. J. Biol. Markers 2018, 33, 415–422. [Google Scholar] [CrossRef] [PubMed] [Green Version]
  13. Ping, G.; Xiong, W.; Zhang, L.; Li, Y.; Zhang, Y.; Zhao, Y. Silencing long noncoding RNA PVT1 inhibits tumorigenesis and cisplatin resistance of colorectal cancer. Am. J. Transl. Res. 2018, 10, 138–149. [Google Scholar] [PubMed]
  14. Martínez-Barriocanal, Á.; Arango, D.; Dopeso, H. PVT1 Long Non-coding RNA in Gastrointestinal Cancer. Front. Oncol. 2020, 10, 38. [Google Scholar] [CrossRef] [PubMed] [Green Version]
  15. Ma, Y.; Wang, P.; Xue, Y.; Qu, C.; Zheng, J.; Liu, X.; Ma, J.; Liu, Y. PVT1 affects growth of glioma microvascular endothelial cells by negatively regulating miR-186. Tumor Biol. 2017, 39, 1–18. [Google Scholar] [CrossRef] [PubMed] [Green Version]
  16. Chang, Z.; Cui, J.; Song, Y. Long noncoding RNA PVT1 promotes EMT via mediating microRNA-186 targeting of Twist1 in prostate cancer. Gene 2018, 654, 36–42. [Google Scholar] [CrossRef]
  17. Zhu, X.; Shen, H.; Yin, X.; Long, L.; Xie, C.; Liu, Y.; Hui, L.; Lin, X.; Fang, Y.; Cao, Y.; et al. miR-186 regulation of Twist1 and ovarian cancer sensitivity to cisplatin. Oncogene 2016, 35, 323–332. [Google Scholar] [CrossRef]
  18. Cepowicz, D.; Zaręba, K.; Pryczynicz, A.; Dawidziuk, T.; Żurawska, J.; Hołody-Zaręba, J.; Gryko, M.; Kędra, B. Blood serum levels of E-cadherin in patients with colorectal cancer. Gastroenterol. Rev. 2017, 12, 186–191. [Google Scholar] [CrossRef] [Green Version]
  19. Yin, Q.; Feng, W.; Shen, X.; Ju, S. Regulatory effects of lncRNAs and miRNAs on autophagy in malignant tumorigenesis. Biosci. Rep. 2018, 38, 1–12. [Google Scholar] [CrossRef]
  20. Senousy, M.A.; Helmy, H.S.; Fathy, N.; Shaker, O.G.; Ayeldeen, G.M. Association of MTMR3 rs12537 at miR-181a binding site with rheumatoid arthritis and systemic lupus erythematosus risk in Egyptian patients. Sci. Rep. 2019, 9, 1–11. [Google Scholar] [CrossRef] [Green Version]
  21. Orlandi, E.; Zanot, C.; Poli, A.; Nicolis, M.; Rodolfo, M.; Turco, A.; Sangalli, A.; Lira, M.G. Lack of association of metastasis-associated lung adenocarcinoma transcript 1 variants with melanoma skin cancer risk. Melanoma Res. 2019, 29, 660–663. [Google Scholar] [CrossRef] [PubMed]
  22. Kim, S.; Wang, M.; Tyrer, J.P.; Jensen, A.; Wiensch, A.; Liu, G.; Lee, A.; Ness, R.B.; Salvatore, M.; Tworoger, S.S.; et al. A comprehensive gene-environment interaction analysis in Ovarian Cancer using genome-wide significant common variants. Int. J. Cancer 2019, 144, 2192–2205. [Google Scholar] [CrossRef] [PubMed] [Green Version]
  23. Shinkins, B.; Nicholson, B.D.; Primrose, J.; Perera, R.; James, T.; Pugh, S.; Mant, D. The diagnostic accuracy of a single CEA blood test in detecting colorectal cancer recurrence: Results from the FACS trial. PLoS ONE 2017, 12, e0171810. [Google Scholar] [CrossRef]
  24. Radwan, A.F.; Ismael, O.E.; Fawzy, A.; El-Mesallamy, H.O. Evaluation of Serum Integrin αvβ3 & Vitronectin in the Early Diagnosis of Breast Cancer. Clin. Lab. 2019, 65, 1185–1193. [Google Scholar] [CrossRef]
  25. Goldstein, M.J.; Mitchell, E.P. Carcinoembryonic Antigen in the Staging and Follow-up of Patients with Colorectal Cancer. Cancer Investig. 2005, 23, 338–351. [Google Scholar] [CrossRef] [PubMed]
  26. Tong, G.; Xu, W.; Zhang, G.; Liu, J.; Zheng, Z.; Chen, Y.; Niu, P.; Xu, X. The role of tissue and serum carcinoembryonic antigen in stages I to III of colorectal cancer-A retrospective cohort study. Cancer Med. 2018, 7, 5327–5338. [Google Scholar] [CrossRef]
  27. Beck, D.E.; Roberts, P.L.; Rombeau, J.L.; Stamos, M.J.; Wexner, S.D. Anatomy and Embryology of the Colon, Rectum, and Anus; Springer Science and Business Media: New York, NY, USA, 2009; pp. 1–29. [Google Scholar]
  28. Bassig, B.A.; Cerhan, J.R.; Au, W.-Y.; Kim, H.N.; Sangrajrang, S.; Hu, W.; Tse, J.; Berndt, S.; Zheng, T.; Zhang, H.; et al. Genetic susceptibility to diffuse large B-cell lymphoma in a pooled study of three Eastern Asian populations. Eur. J. Haematol. 2015, 95, 442–448. [Google Scholar] [CrossRef]
  29. Andrii, V.; Yaroslav, C.; Viktoriia, H.; Alexander, A. Analysis of Association Between Rs3200401 Long Non- Coding RNA MALAT1 Gene Polymorphism and Prostate Adenocarcinoma Development in Ukrainian Population. J. Urol. Nephrol. Stud. 2019, 1, 99–102. [Google Scholar] [CrossRef]
  30. Qu, Y.; Shao, N.; Yang, W.; Wang, J.; Cheng, Y. Association of polymorphisms in MALAT1 with the risk of esophageal squamous cell carcinoma in a Chinese population. OncoTargets Ther. 2019, 12, 2495–2503. [Google Scholar] [CrossRef] [Green Version]
  31. Petkevicius, V.; Streleckiene, G.; Balciute, K.; Link, A.; Leja, M.; Malfertheiner, P.; Skieceviciene, J.; Kupcinskas, J. Association of Long Non-Coding RNA Polymorphisms with Gastric Cancer and Atrophic Gastritis. Genes 2020, 11, 1505. [Google Scholar] [CrossRef]
  32. Peng, R.; Luo, C.; Guo, Q.; Cao, J.; Yang, Q.; Dong, K.; Wang, S.; Wang, K.; Song, C. Association analyses of genetic variants in long non-coding RNA MALAT1 with breast cancer susceptibility and mRNA expression of MALAT1 in Chinese Han population. Gene 2018, 642, 241–248. [Google Scholar] [CrossRef]
  33. Wang, J.-Z.; Xiang, J.-J.; Wu, L.-G.; Bai, Y.-S.; Chen, Z.-W.; Yin, X.-Q.; Wang, Q.; Guo, W.-H.; Peng, Y.; Guo, H.; et al. A genetic variant in long non-coding RNA MALAT1 associated with survival outcome among patients with advanced lung adenocarcinoma: A survival cohort analysis. BMC Cancer 2017, 17, 167. [Google Scholar] [CrossRef] [PubMed] [Green Version]
  34. Xie, Z.-C.; Dang, Y.-W.; Wei, D.-M.; Chen, P.; Tang, R.-X.; Huang, Q.; Liu, J.-H.; Luo, D.-Z. Clinical significance and prospective molecular mechanism of MALAT1 in pancreatic cancer exploration: A comprehensive study based on the GeneChip, GEO, Oncomine, and TCGA databases. OncoTargets Ther. 2017, 10, 3991–4005. [Google Scholar] [CrossRef] [Green Version]
  35. Liang, J.; Liang, L.; Ouyang, K.; Li, Z.; Yi, X. MALAT1 induces tongue cancer cells’ EMT and inhibits apoptosis through Wnt/β-catenin signaling pathway. J. Oral Pathol. Med. 2017, 46, 98–105. [Google Scholar] [CrossRef]
  36. Niu, J.; Song, X.; Zhang, X. Regulation of lncRNA PVT1 on miR-125 in metastasis of gastric cancer cells. Oncol. Lett. 2019, 19, 1261–1266. [Google Scholar] [CrossRef]
  37. Wang, W.; Zhou, R.; Wu, Y.; Liu, Y.; Su, W.; Xiong, W.; Zeng, Z. PVT1 Promotes Cancer Progression via MicroRNAs. Front. Oncol. 2019, 9, 609. [Google Scholar] [CrossRef] [Green Version]
  38. Roelands, J.; Kuppen, P.J.K.; Vermeulen, L.; Maccalli, C.; Decock, J.; Wang, E.; Marincola, F.M.; Bedognetti, D.; Hendrickx, W. Immunogenomic Classification of Colorectal Cancer and Therapeutic Implications. Int. J. Mol. Sci. 2017, 18, 2229. [Google Scholar] [CrossRef] [Green Version]
  39. Chen, M.; Xia, Z.; Chen, C.; Hu, W.; Yuan, Y. LncRNA MALAT1 promotes epithelial-to-mesenchymal transition of esophageal cancer through Ezh2-Notch1 signaling pathway. Anti-Cancer Drugs 2018, 29, 767–773. [Google Scholar] [CrossRef] [PubMed]
  40. Huang, C.; Xiao, X.; Yang, Y.; Mishra, A.; Liang, Y.; Zeng, X.; Yang, X.; Xu, D.; Blackburn, M.R.; Henke, C.A.; et al. MicroRNA-101 attenuates pulmonary fibrosis by inhibiting fibroblast proliferation and activation. J. Biol. Chem. 2017, 292, 16420–16439. [Google Scholar] [CrossRef] [PubMed] [Green Version]
  41. Fu, Z.; Luo, W.; Wang, J.; Peng, T.; Sun, G.; Shi, J.; Li, Z.; Zhang, B. Malat1 activates autophagy and promotes cell proliferation by sponging miR-101 and upregulating STMN1, RAB5A and ATG4D expression in glioma. Biochem. Biophys. Res. Commun. 2017, 492, 480–486. [Google Scholar] [CrossRef]
  42. Yu, F.; Lu, Z.; Cai, J.; Huang, K.; Chen, B.; Li, G.; Dong, P.; Zheng, J. MALAT1 functions as a competing endogenous RNA to mediate Rac1 expression by sequestering miR-101b in liver fibrosis. Cell Cycle 2015, 14, 3885–3896. [Google Scholar] [CrossRef] [PubMed] [Green Version]
  43. Zhu, S.; Zhao, G.; Zhao, X.; Zhan, X.; Cai, M.; Geng, C.; Pu, Q.; Zhao, Q.; Fu, Q.; Huang, C.; et al. Elevated soluble E-cadherin during the epithelial-mesenchymal transition process and as a diagnostic marker in colorectal cancer. Gene 2020, 754, 144899. [Google Scholar] [CrossRef] [PubMed]
  44. Zhao, X.; Wang, K.; Liao, Y.; Zeng, Q.; Li, Y.; Yuhua, L.; Liu, Y.; Meng, K.; Qian, C.; Zhang, Q.; et al. MicroRNA-101a Inhibits Cardiac Fibrosis Induced by Hypoxia via Targeting TGFβRI on Cardiac Fibroblasts. Cell. Physiol. Biochem. 2015, 35, 213–226. [Google Scholar] [CrossRef] [PubMed]
  45. He, F.; Song, Z.; Chen, H.; Chen, Z.; Yang, P.; Li, W.; Yang, Z.; Zhang, T.; Wang, F.; Wei, J.; et al. Long noncoding RNA PVT1-214 promotes proliferation and invasion of colorectal cancer by stabilizing Lin28 and interacting with miR-128. Oncogene 2019, 38, 164–179. [Google Scholar] [CrossRef] [PubMed] [Green Version]
  46. Waller, P.; Blann, A. Non-coding RNAs–A primer for the laboratory scientist. Br. J. Biomed. Sci. 2019, 76, 157–165. [Google Scholar] [CrossRef] [PubMed]
  47. Zeng, Y.; Wang, T.; Liu, Y.; Su, Z.; Lu, P.; Chen, X.; Hu, D. LncRNA PVT1 as an effective biomarker for cancer diagnosis and detection based on transcriptome data and meta-analysis. Oncotarget 2017, 8, 75455–75466. [Google Scholar] [CrossRef] [PubMed] [Green Version]
  48. Graham, L.D.; Pedersen, S.K.; Brown, G.S.; Ho, T.; Kassir, Z.; Moynihan, A.T.; Vizgoft, E.K.; Dunne, R.; Pimlott, L.; Young, G.; et al. Colorectal Neoplasia Differentially Expressed (CRNDE), a Novel Gene with Elevated Expression in Colorectal Adenomas and Adenocarcinomas. Genes Cancer 2011, 2, 829–840. [Google Scholar] [CrossRef] [PubMed] [Green Version]
  49. Ren, X.; Cao, D.; Yang, L.; Li, X.; Zhang, W.; Xiao, Y.; Xi, Y.; Li, F.; Li, D.; Pan, Z. High Expression of long non-coding RNA PVT1 predicts metastasis in Han and Uygur Patients with Gastric Cancer in Xinjiang, China. Sci. Rep. 2019, 9, 1–11. [Google Scholar] [CrossRef]
  50. Zhang, Y.; Wang, T.; Huang, H.-Q.; Li, W.; Cheng, X.-L.; Yang, J. Human MALAT-1 long non-coding RNA is overexpressed in cervical cancer metastasis and promotes cell proliferation, invasion and migration. J. Balk. Union Oncol. 2016, 20, 1497–1503. [Google Scholar]
  51. Ji, Q.; Cai, G.; Liu, X.; Zhang, Y.; Wang, Y.; Zhou, L.; Sui, H.; Li, Q. MALAT1 regulates the transcriptional and translational levels of proto-oncogene RUNX2 in colorectal cancer metastasis. Cell Death Dis. 2019, 10, 1–17. [Google Scholar] [CrossRef]
  52. Wang, S.-H.; Zhang, W.-J.; Wu, X.-C.; Zhang, M.-D.; Weng, M.-Z.; Zhou, D.; Wang, J.-D.; Quan, Z.-W. Long non-coding RNA Malat1 promotes gallbladder cancer development by acting as a molecular sponge to regulate miR-206. Oncotarget 2016, 7, 37857–37867. [Google Scholar] [CrossRef] [PubMed] [Green Version]
  53. Yang, M.-H.; Min-Hui, Y.; Xu, C.; Xie, L.-Y.; Wang, X.-Y.; Chen, S.-Y.; Lin-Ying, X. MALAT1 promotes colorectal cancer cell proliferation/migration/invasion via PRKA kinase anchor protein 9. Biochim. Biophys. Acta (BBA) Mol. Basis Dis. 2015, 1852, 166–174. [Google Scholar] [CrossRef] [PubMed] [Green Version]
  54. Onagoruwa, O.T.; Pal, G.; Ochu, C.; Ogunwobi, O.O. Oncogenic Role of PVT1 and Therapeutic Implications. Front. Oncol. 2020, 10, 17. [Google Scholar] [CrossRef] [PubMed] [Green Version]
  55. Jin, L.; Cai, Q.; Wang, S.; Wang, S.; Wang, J.; Quan, Z. Long noncoding RNA PVT1 promoted gallbladder cancer proliferation by epigenetically suppressing miR-18b-5p via DNA methylation. Cell Death Dis. 2020, 11, 1–14. [Google Scholar] [CrossRef] [PubMed]
  56. Zu, X.; Zhang, H.; Qi, F.; Cao, Y.; Chen, M. Down-regulated microRNA-101 in bladder transitional cell carcinoma is associated with poor prognosis. Med. Sci. Monit. 2014, 20, 812–817. [Google Scholar] [CrossRef] [PubMed] [Green Version]
  57. Wang, Z.; Sha, H.-H.; Li, H.-J. Functions and mechanisms of miR-186 in human cancer. Biomed. Pharmacother. 2019, 119, 109428. [Google Scholar] [CrossRef]
  58. Roshchupkin, A.; Chumachenko, Y.; Ataman, A. Association of MALAT1 rs3200401 gene polymorphism with kidney cancer in Ukrainian population. East. Ukr. Med. J. 2019, 7, 121–125. [Google Scholar]
  59. Senousy, M.A.; El-Abd, A.M.; Abdel-Malek, R.R.; Rizk, S.M. Circulating long non-coding RNAs HOTAIR, Linc-p21, GAS5 and XIST expression profiles in diffuse large B-cell lymphoma: Association with R-CHOP responsiveness. Sci. Rep. 2021, 11, 1–15. [Google Scholar] [CrossRef] [PubMed]
  60. Ali, M.A.; Shaker, O.G.; Khalefa, A.A.; Abdelwahed, M.Y.; Ali, E.; Ezzat, E.M.; Elghobary, H.A.; Awaji, A.A.; Fouad, N.A.; Ayoub, S.E. Serum long noncoding RNAs FAS-AS1 & PVT1 are novel biomarkers for systemic lupus erythematous. Br. J. Biomed. Sci. 2020, 77, 208–212. [Google Scholar] [CrossRef]
Figure 1. Serum expression levels of MALAT1, PVT1, miRNA-101 and miRNA-186. (AD) Fold change of serum MALAT1, PVT1, miRNA-101 and miRNA-186 expression levels in patients with CRC (n = 140) and adenomatous polyps (n = 40) compared with healthy controls (n = 100). (E,F) Fold change of miRNA-101 and miRNA-186 expression levels in CRC (n = 140) versus non-CRC (n = 140). For the control samples, the 2−∆∆ct was calculated by subtracting each control value from the average control. Data were expressed as box blot; the box represents the 25–75% percentiles; the line inside the box represents the median and the upper and lower lines representing the 10–90% percentiles. p < 0.05 means statistical significance.
Ijms 22 06147 g001
Figure 2. Serum levels of E-cadherin. Data expressed as mean ± SD. p < 0.05 means statistical significance. (A) CRC (n = 140), adenomatous polyps (n = 40) and healthy controls (n = 100), (B) CRC (n = 140) vs. non-CRC groups (n = 140), (C) metastatic (n = 24) vs. non-metastatic (n = 116).
Ijms 22 06147 g002
Figure 3. Serum MALAT1, PVT1, miRNA-101, miRNA-186 and E-cadherin expression levels in CRC patients with different rs3200401 and rs13255292 genotypes. The box represents the 25%–75% percentiles; the line inside the box represents the median and the upper and lower lines representing the 10%–90% percentiles of the fold change of serum (A) MALAT1I, (B) PVT1, (C) miRNA-101 and (D) miRNA-186. (E,F) The bars represent the mean and SD of serum E-cadherin.* means statistical significance p < 0.05.
Ijms 22 06147 g003
Figure 4. Diagnostic performance of serum (AC) MALAT1, (DF) PVT1, (G) miRNA-101, (H) miRNA-186 and (I) E-cadherin. Using ROC curve analysis, CRC (n = 140), AP (n = 40), healthy controls (n = 100).
Ijms 22 06147 g004
Figure 5. The prognostic performance of serum E-cadherin. Using ROC curve analysis, metastatic patients (n = 24), non-metastatic patients (n = 116).
Ijms 22 06147 g005
Figure 6. Correlations between studied serum markers with each other and with clinical data in CRC group. A correlation map with a blue-red (cold-hot) scale. The blue color corresponds to a correlation close to 1 and the red color corresponds to a correlation close to −1. White corresponds to a correlation close to 0. Correlations are made by spearman correlation.
Ijms 22 06147 g006
Table 1. Values of the demographic and clinicopathological data of the studied groups.
CRC (n = 140)AP (n = 40)Healthy Controls (n = 100)p Value
Age (years)
Age range
50 ± 12
(25–73)
37 ± 16
(19–75)
49 ± 8.2
(30–65)
<0.0001 a
0.888 b
0.006 c
Sex, n (%)Male90 (64.3%)24 (60%)62 (62%)0.861
Female50 (35.7%)16 (40%)38 (38%)
Smokers42 (30%)8 (20%)19 (19%)0.084
Hemoglobin (g/dL)10.94 ± 2.75 11.98 ± 1.3712.22 ± 1.450.04 a
0.009 b
0.88 c
Platelet count × 103/mm3276.6 ± 94.48 261.1 ± 40248.6 ± 39.980.156
TLC × 103/mm36.98 ± 2.635.66 ± 1.056.44 ± 1.330.071
ESR (mm/h)46 ± 31.3822 ± 1520.1 ± 11<0.001 a,b
>0.99
Anatomical Site, n (%)
Proximal colon58 (41.4%)8 (20%)--
Distal colon45 (32.1%)17 (42.5%)--
Rectum37 (26.5%)15 (37.5%)--
Stage, n (%)
Stage I, II (Early)88 (62.8%) ---
Stage III, IV (Late)52 (37.2%) ---
Tumor Grade, n (%)
Well-differentiated26 (18.6%)---
Moderately differentiated98 (70%)---
Poorly-differentiated16 (11.4%)---
Lymphatic Metastasis, n (%)
Present52 (37.1%)---
Absent85 (57.8%)---
Cannot be Assessed3 (2.1%)---
Distant Metastasis, n (%)
Present 24 (17.1%)---
Absent116 (82.9%)---
Tissue Type
Adenocarcinoma131 (93.5%)---
Non-adenocarcinoma9 (6.5%)---
Data of the studied groups are expressed as mean ± SD or number (percentage). AP: adenomatous polyps; CRC: colorectal cancer; ESR: erythrocyte sedimentation rate; TLC: total leukocyte count. p values in bold are statistically significant (p < 0.05). a CRC vs. AP. b CRC vs. Control. c AP vs. Control.
Table 2. Genotype and Allele Frequencies of MALAT1 rs3200401 (C/T) and PVT1 rs13255292 (C/T) in CRC and Healthy Controls.
MALAT1 rs3200401 (C/T) (n = 280, Adjusted Analysis)
ModelGenotypeControl (n = 100)CRC (n = 140)Adjusted OR (95% CI)p Value aAIC aBIC a
CodominantCC42 (42%)31 (22.1%)1<0.0001 306323.4
CT48 (48%)62 (44.3%)1.78 (0.97–3.27)
TT10 (10%)47 (33.6%)6.79 (2.92–15.80)
DominantCC42 (42%)31 (22.1%)1<0.0001316.3330.2
CT-TT58 (58%)109 (77.9%)2.62 (1.48–4.64)
RecessiveCC-CT90 (90%)93 (66.4%)1<0.0001307.5321.4
TT10 (10%)47 (33.6%)4.82 (2.25–10.31)
OverdominantCC-TT52 (52%)78 (55.7%)10.6327341
CT48 (58%)62 (44.3%)0.87 (0.51–1.47)
AllelicC132 (53%)124 (44%)2.43 (1.64–3.61)<0.0001 305.8319.7
T68 (34%)156 (56%)
PVT1 rs13255292 (C/T) (n = 280, Adjusted Analysis)
ModelGenotypeControl (n = 100)CRC (n = 140)Adjusted OR (95% CI)p Value aAIC aBIC a
CodominantCC31 (31%)64 (45.7%)10.086324.4341.8
CT55 (55%)62 (44.3%)0.56 (0.31–0.98)
TT14 (14%)14 (10%)0.50 (0.21–1.19)
DominantCC31 (31%)64 (45.7%)10.028322.5336.4
CT-TT69 (69%)76 (54.3%)0.54 (0.32–0.94)
RecessiveCC-CT86 (86%)126 (90%)10.38326.6340.5
TT14 (14%)14 (10%)0.70 (0.31–1.56)
OverdominantCC-TT45 (45%)78 (55.7%)10.12324.8338.8
CT55 (55%)62 (44.3%)0.66 (0.39–1.11)
AllelicC117 (58%)190 (68%)0.66 (0.44–0.98)0.04 323.1337
T83 (42%)90 (32%)
Values are expressed as number (percentage). a adjusted for age and sex in a logistic regression model. p < 0.05 means statistical significance. AIC: Akaike’s Information Criteria, BIC: Bayesian Information Criteria.
Table 3. Genotype and Allele Frequencies of MALAT1 rs3200401 (C/T) and PVT1 rs13255292 (C/T) in CRC and Non-CRC.
MALAT1 rs3200401 (C/T) (n = 280, Adjusted Analysis)
ModelGenotypeNon-CRC (n = 140)CRC (n = 140)Adjusted OR (95% CI)p Value aAIC aBIC a
CodominantCC59 (42.1%)31 (22.1%)1<0.0001 362.2380.4
CT63 (45%)62 (44.3%)1.82 (1.03–3.23)
TT18 (12.9%)47 (33.6%)5.12 (2.49–10.51)
DominantCC59 (42.1%)31 (22.1%)1<0.0001 369.8384.4
CT-TT81 (57.9%)109 (77.9%)2.53 (1.48–4.32)
RecessiveCC-CT122 (87.1%)93 (66.4%)1<0.0001 364.5379
TT18 (12.9%)47 (33.6%)3.60 (1.92–6.77)
OverdominantCC-TT77 (55%)78 (55.7%)10.83381.8396.3
CT63 (45%)62 (44.3%)0.95 (0.58–1.54)
AllelicC181 (65%)124 (44%)2.21 (1.55–3.14)<0.0001 360.9375.4
T99 (35%)156 (56%)
PVT1 rs13255292 (C/T) (n = 280, Adjusted Analysis)
ModelGenotypeNon-CRC (n = 140)CRC (n = 140)OR (95% CI)p ValueAICBIC
CodominantCC47 (33.6%)64 (45.7%)10.1379.3397.4
CT75 (53.6%)62 (44.3%)0.59 (0.35–1.00)
TT18 (12.9%)14 (10%)0.55 (0.24–1.24)
DominantCC47 (33.6%)64 (45.7%)10.034 377.3391.9
CT-TT93 (66.4%)76 (54.3%)0.59 (0.36–0.96)
RecessiveCC-CT122 (87.1%)126 (90%)10.42381.2395.7
TT18 (12.9%)14 (10%)0.73 (0.34–1.57)
OverdominantCC-TT65 (46.4%)78 (55.7%)10.12379.4393.9
CT75 (53.6%)62 (44.3%)0.68 (0.42–1.10)
AllelicC169 (60%)190 (68%)0.70 (0.49–1.01)0.048 377.9392.5
T111 (40%)90 (32%)
Values are expressed as number (percentage). a adjusted for age and sex in a logistic regression model. p < 0.05 means statistical significance. AIC: Akaike’s Information Criteria, BIC: Bayesian Information Criteria.
Table 4. Association of haplotypes with CRC risk.
HaplotypeTotal Frequency Frequency in
Non-CRC Group
(n = 140)
Frequency in CRC Patients
(n = 140)
Adjusted OR (95% CI)p Value
PVT1 rs13255292MALAT1 rs3200401
C aC0.35740.4040.31851.00-
C aT a0.28360.19950.36012.21 (1.31–3.72)0.0032 *
TC0.18720.24240.12440.64 (0.34–1.20)0.17
TT a0.17170.1540.1971.50 (0.89–2.51)0.13
Adjusted by age and sex in a logistic regression model using SNPstats online software. Global haplotype association p value < 0.0001. a risk allele. * Statistically significant p < 0.05.
Table 5. Diagnostic accuracy of the studied markers between CRC and non-CRC groups.
MarkerCutoffAUCp ValueSensitivitySpecificityPPVNPV95% CI
MALAT1>23.71-fold0.907<0.000182%88%90%78%0.8435 to 0.9707
PVT1>13.96-fold0.848<0.000190%70%80%84%0.7641 to 0.9316
miRNA-101<0.28-fold0.6860.004962%67%72%56%0.5697 to 0.8015
miRNA-186<0.20-fold0.7020.002854%80%78%55%0.5861 to 0.8172
E-Cadherin<3.81 ng/mL0.864<0.000176%90%91%73%0.7837 to 0.9442
AUC—area under the curve, (PPV)—positive predictive value, (NPV)—negative predictive value, (CI)—confidence interval. p < 0.05 means statistical significance.
Table 6. Logistic regression analysis to predict the risk of CRC in non-CRC groups.
ParameterBeta CoefficientSEp ValueOROR (95% CI)
Univariate
MALAT10.050.013<0.00011.0521.052–1.078
PVT10.03160.3760.00271.0321.011–1.053
miRNA-101−0.540.2540.03250.580.3529–0.955
miRNA-186−1.120.390.00390.3240.1512–0.697
E-Cadherin−1.260.313<0.00010.28110.1523–0.518
Multivariate
MALAT10.03980.0150.00641.04031.0112–1.070
PVT10.01870.0110.08771.01880.9973–1.040
miRNA-101−1.39310.7590.06640.24830.0561–1.386
miRNA-186−1.24100.7500.09800.28910.0665–1.208
E-Cadherin−0.78580.4500.08050.45320.1856–1.106
Constant2.62
Log likelihood of the stepwise multivariate logistic regression model = −17.966, −2 Log likelihood =35.9339, p < 0.0001. p value in multivariate analysis adjusted for age and sex. CRC, n = 140, non-CRC (Healthy controls + AP), n = 140. p values in bold are statistically significant p < 0.05.
Publisher’s Note: MDPI stays neutral with regard to jurisdictional claims in published maps and institutional affiliations.

