
Evidence of the CH···O HydrogenBonding in Imidazolium-Based Ionic Liquids from Far-Infrared Spectroscopy Measurements and DFT Calculations

 , , ,
, , ,
Abstract
:1. Introduction
2. Materials and Methods
3. Results
3.1. Computational Results
3.2. Experimental Results
3.2.1. Occurrence of Phase Transitions
3.2.2. Intramolecular Interactions
4. Discussion
5. Conclusions
Supplementary Materials
Author Contributions
Funding
Institutional Review Board Statement
Informed Consent Statement
Data Availability Statement
Conflicts of Interest
References
- Palumbo, O.; Trequattrini, F.; Appetecchi, G.B.; Paolone, A. The influence of the alkyl chain length on the microscopic configurations of the anion in the crystalline phases of PYR1A TFSI. J. Phys. Chem. C 2017, 121, 11129–11135. [Google Scholar] [CrossRef]
- Palumbo, O.; Trequattrini, F.; Navarra, M.A.; Brubach, J.-B.; Roy, P.; Paolone, A. Tailoring the physical properties of the mixtures of ionic liquids: A microscopic point of view. Phys. Chem. Chem. Phys. 2017, 19, 8322–8329. [Google Scholar] [CrossRef] [PubMed]
- Tsurumaki, A.; Trequattrini, F.; Palumbo, O.; Panero, S.; Paolone, A.; Navarra, M.A. The effect of ether-functionalisation in ionic liquids analysed by DFT calculation, infrared spectra, and Kamlet-Taft parameters. Phys. Chem. Chem. Phys. 2018, 20, 7989–7997. [Google Scholar] [CrossRef] [PubMed]
- Roth, C.; Chatzipapadopoulos, S.; Kerle, D.; Friedriszik, F.; Lütgens, M.; Lochbrunner, S.; Kühn, O.; Ludwig, R. Hydrogen bonding in ionic liquids probed by linear and nonlinear vibrational spectroscopy. New. J. Phys. 2012, 14, 105026. [Google Scholar] [CrossRef] [Green Version]
- Hunt, P.A.; Ashworth, C.R.; Matthews, R.P. Hydrogen bonding in ionic liquids. Chem. Soc. Rev. 2015, 44, 1257–1288. [Google Scholar] [CrossRef]
- Greaves, T.L.; Drummond, J. Protic ionic liquids: Evolving structure–property relationships and expanding applications. Chem. Rev. 2015, 115, 11379–11448. [Google Scholar] [CrossRef]
- Armand, M.; Endres, F.; MacFarlane, D.R.; Ohno, H.; Scrosati, B. Ionic-liquid materials for the electrochemical challenges of the future. Nat. Mat. 2009, 8, 621–629. [Google Scholar] [CrossRef]
- Palumbo, O.; Cimini, A.; Trequattrini, F.; Brubach, J.-B.; Roy, P.; Paolone, A. The infrared spectra of protic ionic liquids: Performances of different computational models to predict hydrogen bonds and conformer evolution. Phys. Chem. Chem. Phys. 2020, 22, 7497–7506. [Google Scholar] [CrossRef]
- Fumino, K.; Fossog, V.; Wittler, K.; Hempelmann, R.; Ludwig, R. Dissecting anion–cation interaction energies in protic ionic liquids. Angew. Chem. Int. Ed. 2013, 52, 2368–2372. [Google Scholar] [CrossRef]
- Banerjee, P.; Chakraborty, T. Weak hydrogen bonds: Insights from vibrational spectroscopic studies. Int. Rev. Phys. Chem. 2018, 37, 83–123. [Google Scholar] [CrossRef]
- Wulf, A.; Fumino, K.; Ludwig, R. Comment on “new interpretation of the CH stretching vibrations in imidazolium-based ionic liquids”. J. Phys. Chem. A 2010, 114, 685–686. [Google Scholar] [CrossRef]
- Aakeröy, C.B.; Seddon, K.R. The hydrogen bond and crystal engineering. Chem. Soc. Rev. 1993, 82, 397–407. [Google Scholar] [CrossRef]
- Holbrey, J.; Reichert, W.M.; Rogers, R.D. Crystal structures of imidazolium bis(trifluoromethanesulfonyl)imide ‘ionic liquid’ salts: The first organic salt with a cis-TFSI anion conformation. DaltonTrans 2004, 15, 2267–2271. [Google Scholar] [CrossRef]
- Niemann, T.; Strate, A.; Ludwig, R.; Zeng, H.J.; Menges, F.S.; Johnson, M.A. Spectroscopic evidence for an attractive cation–cation interaction in hydroxy-functionalized ionic liquids: A hydrogen-bonded chainlike trimer. Angew. Chem. Int. Ed. 2018, 57, 15364–15368. [Google Scholar] [CrossRef]
- Zeng, H.J.; Menges, F.S.; Niemann, T.; Strate, A.; Ludwig, R.; Johnson, M.A. Chain length dependence of hydrogen bond linkages between cationic constituents in hydroxy-functionalized ionic liquids: Tracking bulk behavior to the molecular level with cold cluster ion spectroscopy. J. Phys. Chem. Lett. 2020, 11, 683–688. [Google Scholar] [CrossRef]
- Niemann, T.; Zaitsau, D.H.; Strate, A.; Stange, P.; Ludwig, R. Controlling “like−likes−like” charge attraction in hydroxy-functionalized ionic liquids by polarizability of the cations, interaction strength of the anions and varying alkyl chain length. Phys. Chem. Chem. Phys. 2020, 22, 2763–2774. [Google Scholar] [CrossRef]
- Niemann, T.; Neumann, J.; Stange, P.; Gärtner, S.; Youngs, T.G.A.; Paschek, D.; Warr, G.G.; Atkin, R.; Ludwig, R. The double-faced nature of hydrogen bonding in hydroxy-functionalized ionic liquids shown by neutron diffraction and molecular dynamics simulations. Angew. Chem. Int. Ed. 2019, 58, 12887–12892. [Google Scholar] [CrossRef]
- Kundu, K.; Chandra, G.K.; Umapathy, S.; Kiefer, J. Spectroscopic and computational insights into the ion–solvent interactions in hydrated aprotic and protic ionic liquids. Phys. Chem. Chem. Phys. 2019, 21, 20791–20804. [Google Scholar] [CrossRef]
- Samanta, A.K.; Banerjee, P.; Bandyopadhyay, B.; Pandey, P.; Chakraborty, T. Antagonistic interplay between an intermolecular CH···O and an intramolecular OH···O hydrogen bond in a 1:1 complex between 1,2-cyclohexanedione and chloroform: A combined matrix isolation, infrared and quantum chemistry study. J. Phys. Chem. A 2017, 121, 6012–6020. [Google Scholar] [CrossRef] [Green Version]
- Paschoal, V.H.; Faria, L.F.O.; Ribeiro, M.C.C. Vibrational spectroscopy of ionic liquids. Chem. Rev. 2017, 117, 7053–7112. [Google Scholar] [CrossRef]
- Fumino, K.; Fossog, V.; Stange, P.; Paschek, D.; Hempelmann, R.; Ludwig, R. Controlling the subtle energy balance in protic ionic liquids: Dispersion forces compete with hydrogen bonds. Angew. Chem. Int. Ed. 2015, 54, 2792–2795. [Google Scholar] [CrossRef]
- Ludwig, R. The effect of dispersion forces on the interaction energies and far infrared spectra of protic ionic liquids. Phys. Chem. Chem. Phys. 2015, 17, 13790–13793. [Google Scholar] [CrossRef] [Green Version]
- Le Caer, S.; Klein, G.; Ortiz, D.; Lima, M.; Devineau, S.; Pin, S.; Brubach, J.-B.; Roy, P.; Pommeret, S.; Righini, R.; et al. The effect of myoglobin crowding on the dynamics of water: An infrared study. Phys. Chem. Chem. Phys. 2014, 16, 22841–22852. [Google Scholar] [CrossRef]
- Fumino, K.; Reichert, E.; Wittler, K.; Hempelmann, R.; Ludwig, R. Low-frequency vibrational modes of protic molten salts and ionic liquids: Detecting and quantifying hydrogen bonds. Angew. Chem. Int. Ed. 2012, 51, 6236–6240. [Google Scholar] [CrossRef]
- Fumino, K.; Wulf, A.; Ludwig, R. Strong, localized, and directional hydrogen bonds fluidize ionic liquids. Angew. Chem. Int. Ed. 2008, 47, 8731–8734. [Google Scholar] [CrossRef]
- Fumino, K.; Peppel, T.; Geppert-Rybczynska, M.; Zaitsau, D.H.; Lehmann, J.K.; Verevkin, S.P.; Köckerling, M.; Ludwig, R. The influence of hydrogen bonding on the physical properties of ionic liquids. Phys. Chem. Chem. Phys. 2011, 13, 14064–14075. [Google Scholar] [CrossRef]
- Grondin, J.; Lassègues, J.-C.; Cavagnat, D.; Buffeteau, T.; Johansson, P.; Holom, R. Revisited vibrational assignments of imidazolium-based ionic liquids. J. Raman Spectrosc. 2011, 42, 733–743. [Google Scholar] [CrossRef]
- Buffeteau, T.; Grondin, J.; Danten, Y.; Lassègues, J.-C. Imidazolium-based ionic liquids: Quantitative aspects in the far-infrared region. J. Phys. Chem. B 2010, 114, 7587–7592. [Google Scholar] [CrossRef]
- Wulf, A.; Fumino, K.; Ludwig, R. Spectroscopic evidence for an enhanced anion–cation interaction from hydrogen bonding in pure imidazolium ionic liquids. Angew. Chem. Int. Ed. 2010, 49, 449–453. [Google Scholar] [CrossRef]
- Wulf, A.; Fumino, K.; Ludwig, R.; Taday, P.F. Combined THz, FIR and raman spectroscopy studies of imidazolium-based ionic liquids covering the frequency range 2–300 cm−1. Chem. Phys. Chem. 2010, 11, 349–353. [Google Scholar] [CrossRef]
- Fumino, K.; Wulf, A.; Ludwig, R. The cation–anion interaction in ionic liquids probed by far-infrared spectroscopy. Angew. Chem. Int. Ed. 2008, 47, 3830–3834. [Google Scholar] [CrossRef] [PubMed]
- Gu, Y.; Kar, T.; Scheiner, S. Fundamental properties of the CH···O interaction: Is it a true hydrogen bond? J. Am. Chem. Soc. 1999, 121, 9411–9422. [Google Scholar] [CrossRef]
- Lungwitz, R.; Friedrich, M.; Linert, W.; Spange, S. New aspects on the hydrogen bond donor (HBD) strength of 1-butyl-3-methylimidazolium room temperature ionic liquids. New J. Chem. 2008, 32, 1493–1499. [Google Scholar] [CrossRef]
- Lungwitz, R.; Spange, S.A. Hydrogen bond accepting (HBA) scale for anions, including room temperature ionic liquids. New J. Chem. 2008, 32, 392–394. [Google Scholar] [CrossRef]
- Cremer, T.; Kolbeck, C.; Lovelock, K.R.J.; Paape, N.; Wolfel, R.; Schulz, P.S.; Wasserscheid, P.; Weber, H.; Thar, J.; Kirchner, B.; et al. Towards a molecular understanding of cation–anion interactions—Probing the electronic structure of imidazolium ionic liquids by NMR spectroscopy, X-ray photoelectron spectroscopy and theoretical calculations. Chem. Eur. J. 2010, 16, 9018–9033. [Google Scholar] [CrossRef]
- Avent, A.G.; Chaloner, P.A.; Day, M.P.; Seddon, K.R.; Welton, T. Evidence for hydrogen bonding in solutions of 1-ethyl-3-methvlimidazolium halides, and its implications for room-temperature halogenoaluminate(III) ionic liquids. J. Chem. Soc. Dalton Trans. 1994, 23, 3405–3413. [Google Scholar] [CrossRef]
- Wulf, A.; Fumino, K.; Michalik, D.; Ludwig, R. IR and NMR properties of ionic liquids: Do they tell us the same thing? Chem. Phys. Chem. 2007, 8, 2265–2269. [Google Scholar] [CrossRef]
- Shao, Y.; Molnar, L.F.; Jung, Y.; Kussmann, J.; Ochsenfeld, C.; Brown, S.T.; Gilbert, A.T.B.; Slipchenko, L.V.; Levchenko, S.V.; O’Neill, D.P.; et al. Advances in methods and algorithms in a modern quantum chemistry program package. Phys. Chem. Chem. Phys. 2006, 8, 3172–3191. [Google Scholar] [CrossRef]
- Hehre, W.J. A Guide to Molecular Mechanics and Quantum Chemical Calculations; Wavefunction, Inc.: Irvine, CA, USA, 2003. [Google Scholar]
- Chai, J.D.; Head-Gordon, M. Long-range corrected hybrid density functionals with damped atom–atom dispersion corrections. Phys. Chem. Chem. Phys. 2008, 10, 6615–6620. [Google Scholar] [CrossRef] [Green Version]
- Vitucci, F.M.; Trequattrini, F.; Palumbo, O.; Brubach, J.-B.; Roy, P.; Paolone, A. Infrared spectra of bis(trifluoromethanesulfonyl)imide based ionic liquids: Experiments and ab-initio simulations. Vibr. Spectr. 2014, 74, 81–87. [Google Scholar] [CrossRef]
- Jeffrey, G.A. An Introduction to Hydrogen Bonding; Oxford University Press: New York, NY, USA, 1997. [Google Scholar]
- Lozano-Martín, D.; Cardoso Vieira, S.I.; Paredes, X.; Vitoriano Lourenço, M.J.; Nieto de Castro, C.A.; Sengers, J.V.; Massonne, K. Thermal conductivity of metastable ionic liquid [C2mim][CH3SO3]. Molecules 2020, 25, 4290. [Google Scholar] [CrossRef]
- Trequattrini, F.; Celeste, A.; Capitani, F.; Palumbo, O.; Cimini, A.; Paolone, A. The temperature and pressure phase diagram of the 1-ethyl-3-methylimidazolium trifluoromethanesulfonate ionic liquid. Appl. Sci. 2020, 10, 4404. [Google Scholar] [CrossRef]
- Choudhury, A.R.; Winterton, N.; Steiner, A.; Cooper, A.I.; Johnson, K.A. In situ crystallization of ionic liquids with melting points below −25 °C. CrystEngComm 2006, 8, 742–745. [Google Scholar] [CrossRef]
- Zdolšek, N.; Bendová, M.; Quirion, F.; Vrbka, P.; Trtić-Petrović, T. Phase behaviour of 1-butyl-3-methylimidazolium methanesulfonate as new thermal energy material. In Ionic Liquids: From Fundamental Properties to Practical Applications; Royal Society of Chemistry: London, UK, 2017; p. 35. [Google Scholar]
- Palumbo, O.; Trequattrini, F.; Brubach, J.-B.; Roy, P.; Paolone, A. Crystallization of mixtures of hydrophilic ionic liquids and water: Evidence of microscopic inhomogeneities. J. Coll. Int. Sci. 2019, 552, 43–50. [Google Scholar] [CrossRef]
- Palumbo, O.; Trequattrini, F.; Vitucci, F.M.; Navarra, M.A.; Panero, S.; Paolone, A. An infrared spectroscopy study of the conformational evolution of the bis(trifluoromethanesulfonyl) imide ion in the liquid and in the glass state. Adv. Condens. Matter. 2015, 2015, 176067. [Google Scholar] [CrossRef] [Green Version]
- Lehmann, S.B.C.; Roatsch, M.; Schöppke, M.; Kirchner, B. On the physical origin of the cation–anion intermediate bond in ionic liquids Part, I. Placing a (weak) hydrogen bond between two charges. Phys. Chem. Chem. Phys. 2010, 12, 7473–7486. [Google Scholar] [CrossRef]
- Watanabe, H.; Doi, H.; Saito, S.; Matsugami, M.; Fujii, K.; Kanzaki, R.; Kameda, Y.; Umebayashi, Y. Hydrogen bond in imidazolium based protic and aprotic ionic liquids. J. Mol. Liq. 2016, 217, 35–42. [Google Scholar] [CrossRef] [Green Version]
- Dong, K.; Zhang, S.; Wang, D.; Yao, X. Hydrogen bonds in imidazolium ionic liquids. J. Phys. Chem. A 2006, 110, 9775–9782. [Google Scholar] [CrossRef]
- Dong, K.; Zhang, S.; Wang, J. Understanding the hydrogen bonds in ionic liquids and their roles in properties and reactions. Chem. Commun. 2016, 52, 6744–6764. [Google Scholar] [CrossRef]
- Matthews, R.P.; Welton, T.; Hunt, P.A. Competitive pi interactions and hydrogen bonding within imidazolium ionic liquids. Phys. Chem. Chem. Phys. 2014, 16, 3238–3253. [Google Scholar] [CrossRef]
- Frontera, A.; Gamez, P.; Mascal, M.; Mooibroek, T.J.; Reedijk, J. Putting anion–p interactions into perspective. Angew. Chem. Int. Ed. 2011, 50, 9564–9583. [Google Scholar] [CrossRef] [PubMed]
- Salonen, L.M.; Ellermann, M.; Diederich, F. Aromatic rings in chemical and biological recognition: Energetics and structures. Angew. Chem. Int. Ed. 2011, 50, 4808–4842. [Google Scholar] [CrossRef]
- García-Saiz, A.; de Pedro, I.; Migowski, P.; Vallcorba, O.; Junquera, J.; Blanco, J.A.; Fabelo, O.; Sheptyakov, D.; Waerenborgh, J.C.; Fernández-Díaz, M.T.; et al. Anion−π and halide−halide nonbonding interactions in a new ionic liquid based on imidazolium cation with three-dimensional magnetic ordering in the solid state. Inorg. Chem. 2014, 53, 8384–8396. [Google Scholar] [CrossRef]
- Steiner, T. The hydrogen bond in the solid state. Angew. Chem. Int. Ed. 2002, 41, 48–76. [Google Scholar] [CrossRef]


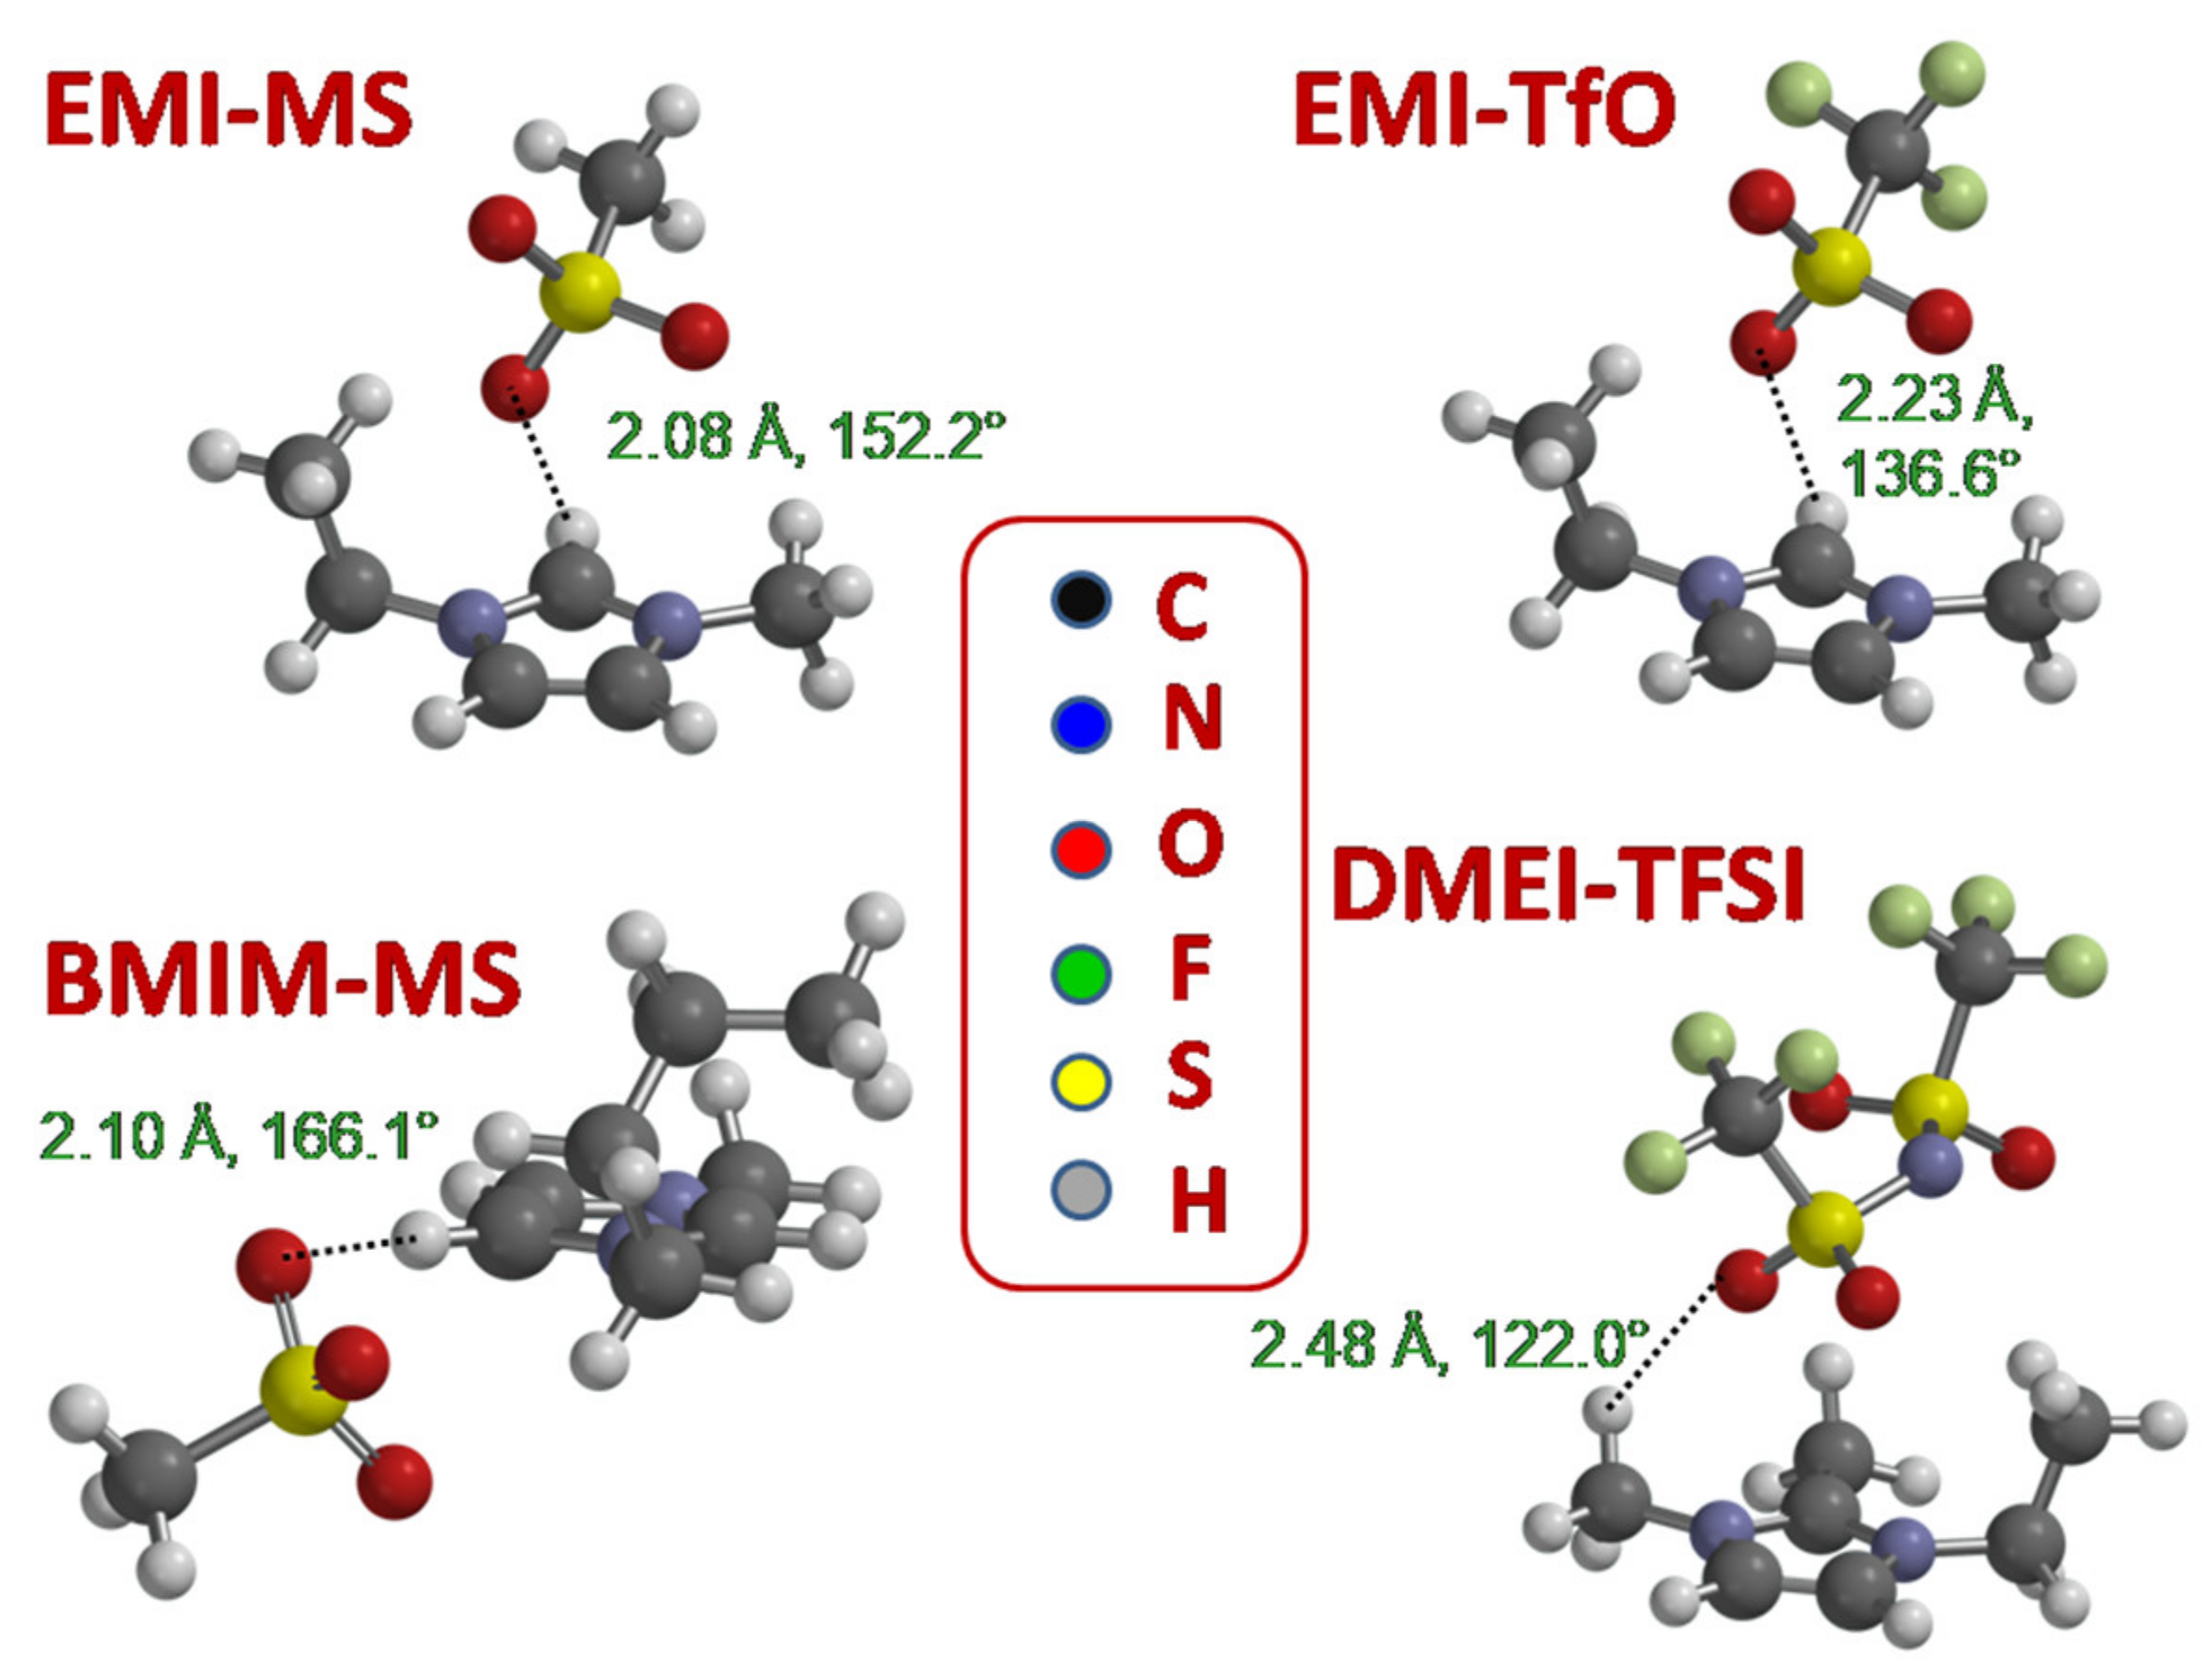
| Ion Pair | (H-O) (Å) | Angle(C-H-O) (°) |
|---|---|---|
| EMI-MS | 2.08 | 152.2 |
| BMIM-MS | 2.10 | 166.1 |
| EMI-TfO | 2.23 | 136.6 |
| DMEI-TFSI | 2.48 | 122.0 |
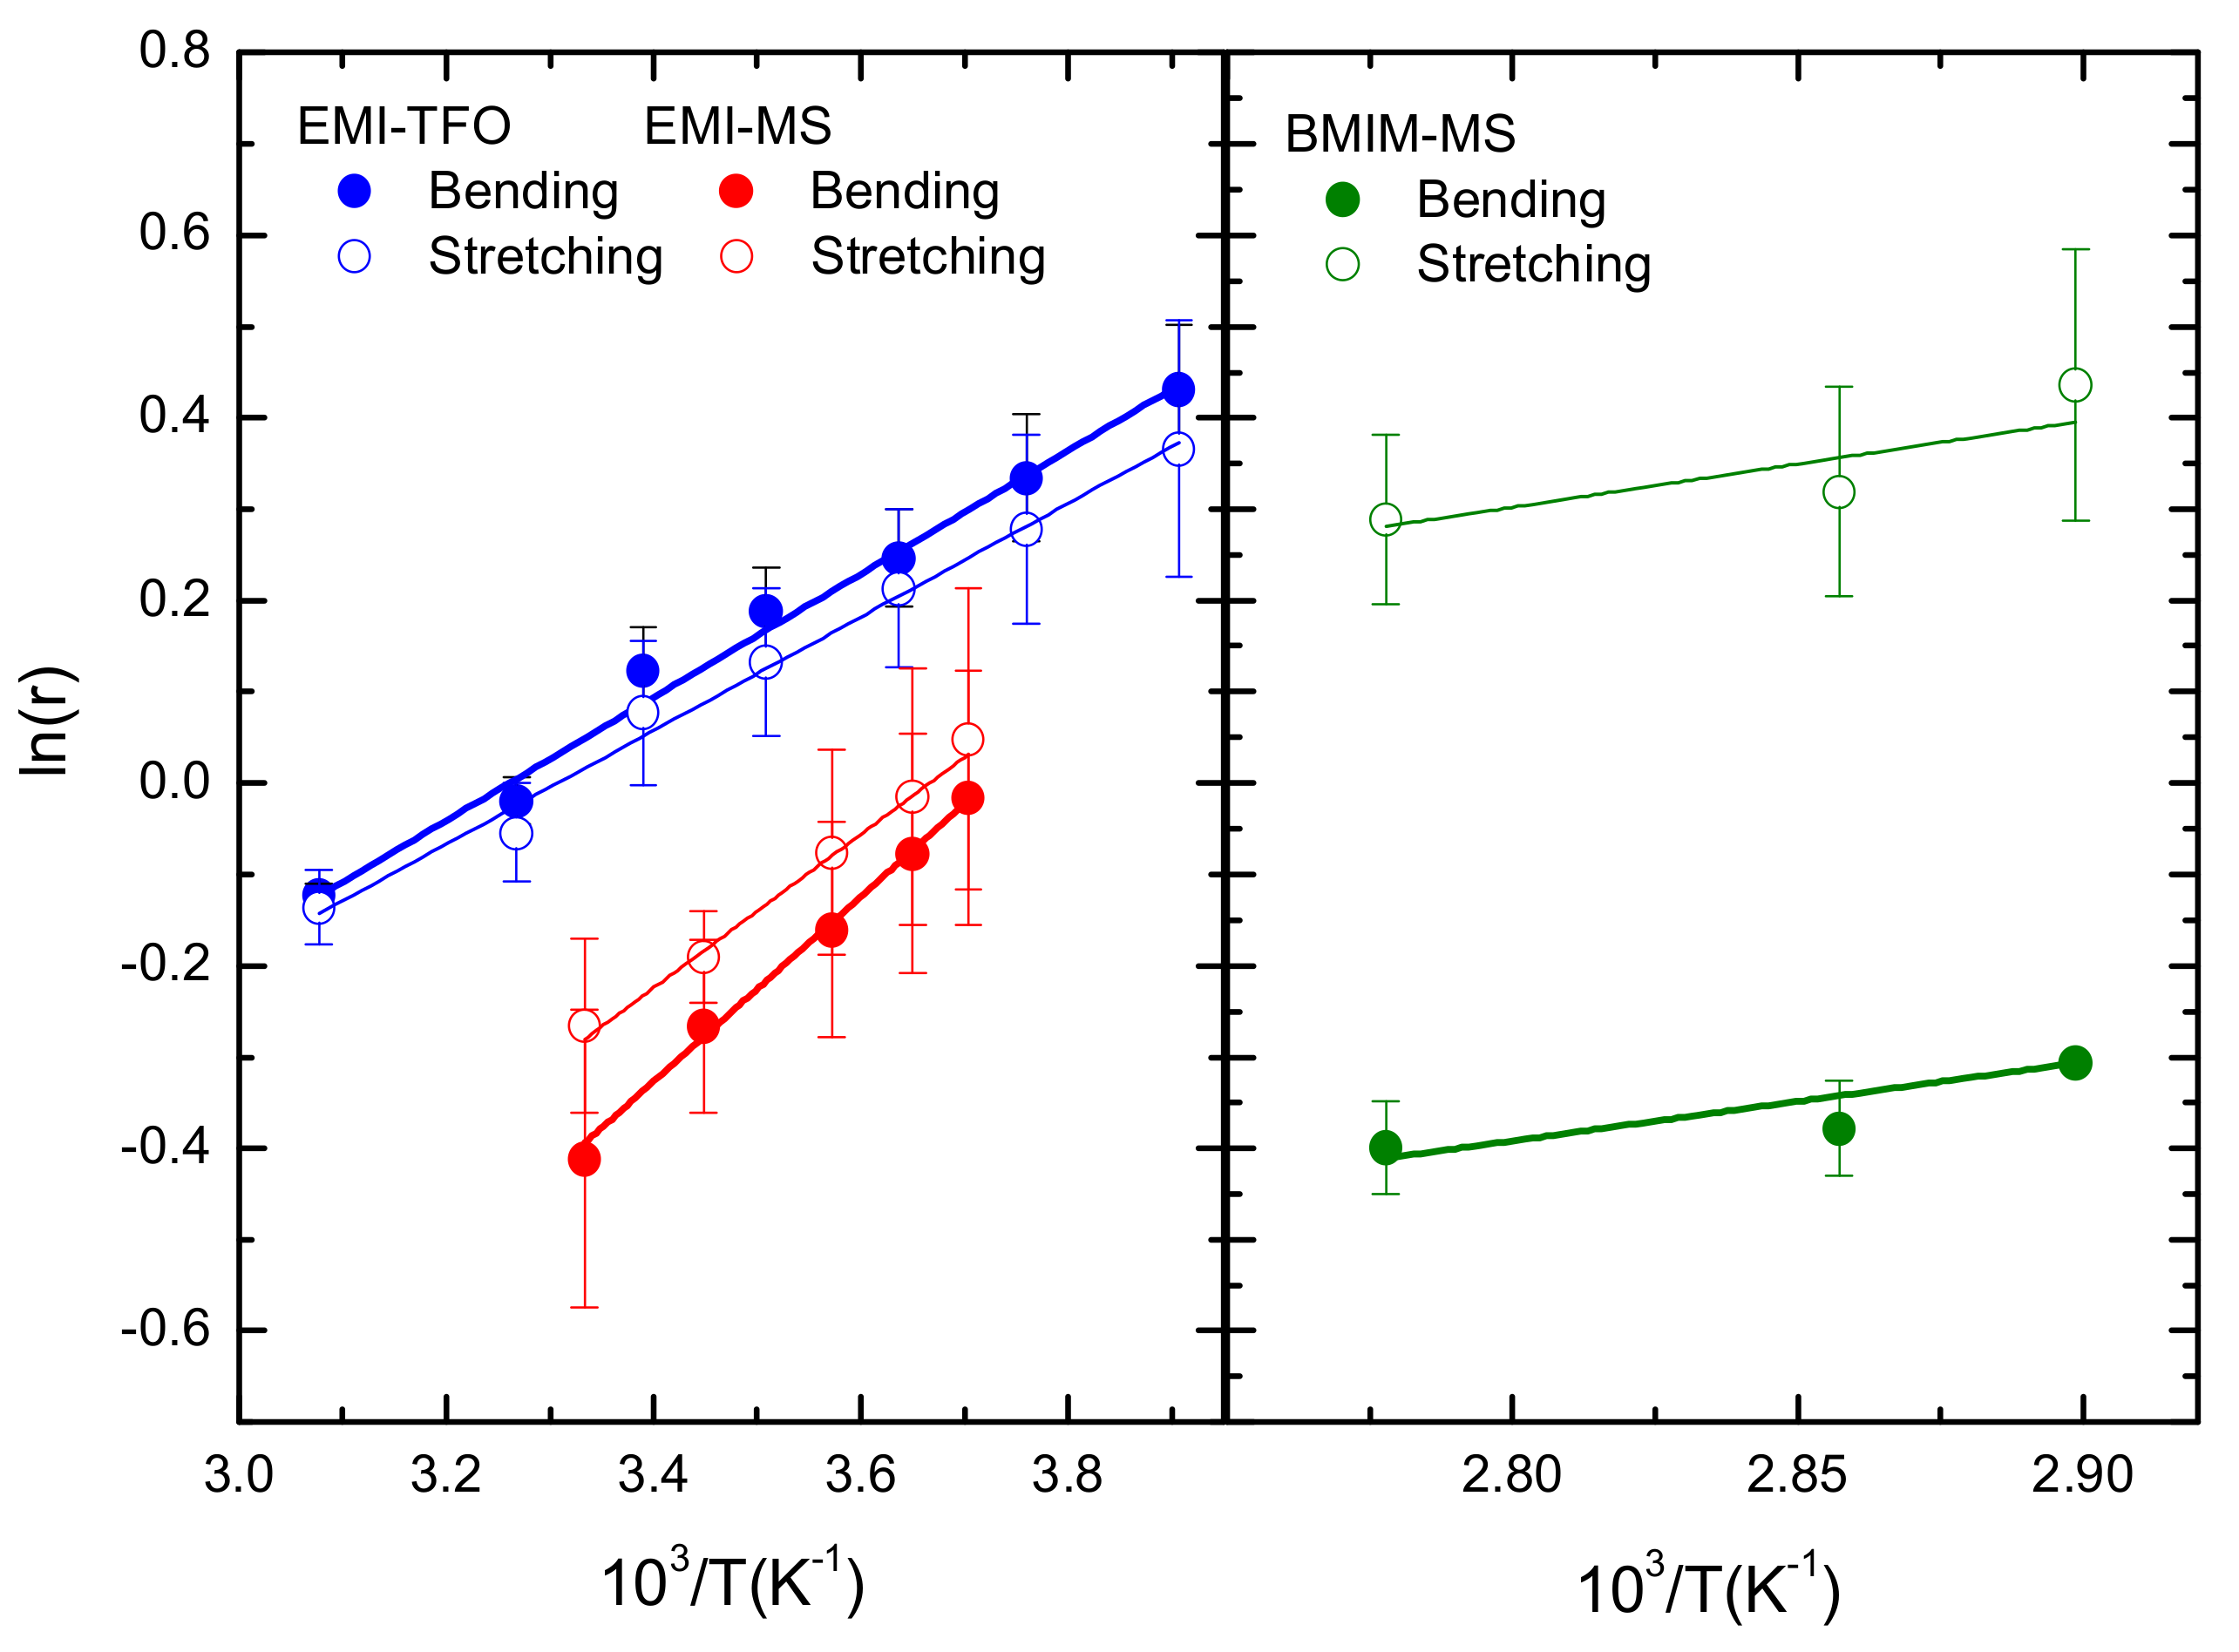
| Sample | ΔH bending (kJ/mol−1) | ΔH stretching (kJ/mol−1) |
|---|---|---|
| EMI-TfO | 5.6 ± 0.2 | 5.2 ± 0.3 |
| EMI-MS | 8.4 ± 0.4 | 7.0 ± 0.4 |
| BMIM-MS | 7.2 ± 2.3 | 7.9 ± 4.0 |
Publisher’s Note: MDPI stays neutral with regard to jurisdictional claims in published maps and institutional affiliations. |
© 2021 by the authors. Licensee MDPI, Basel, Switzerland. This article is an open access article distributed under the terms and conditions of the Creative Commons Attribution (CC BY) license (https://creativecommons.org/licenses/by/4.0/).
Share and Cite
Palumbo, O.; Cimini, A.; Trequattrini, F.; Brubach, J.-B.; Roy, P.; Paolone, A. Evidence of the CH···O HydrogenBonding in Imidazolium-Based Ionic Liquids from Far-Infrared Spectroscopy Measurements and DFT Calculations. Int. J. Mol. Sci. 2021, 22, 6155. https://0-doi-org.brum.beds.ac.uk/10.3390/ijms22116155
Palumbo O, Cimini A, Trequattrini F, Brubach J-B, Roy P, Paolone A. Evidence of the CH···O HydrogenBonding in Imidazolium-Based Ionic Liquids from Far-Infrared Spectroscopy Measurements and DFT Calculations. International Journal of Molecular Sciences. 2021; 22(11):6155. https://0-doi-org.brum.beds.ac.uk/10.3390/ijms22116155
Chicago/Turabian StylePalumbo, Oriele, Adriano Cimini, Francesco Trequattrini, Jean-Blaise Brubach, Pascale Roy, and Annalisa Paolone. 2021. "Evidence of the CH···O HydrogenBonding in Imidazolium-Based Ionic Liquids from Far-Infrared Spectroscopy Measurements and DFT Calculations" International Journal of Molecular Sciences 22, no. 11: 6155. https://0-doi-org.brum.beds.ac.uk/10.3390/ijms22116155