
Plasma Proteomic Analysis in Morquio A Disease

 , , , ,
  and
and 
Abstract
:1. Introduction
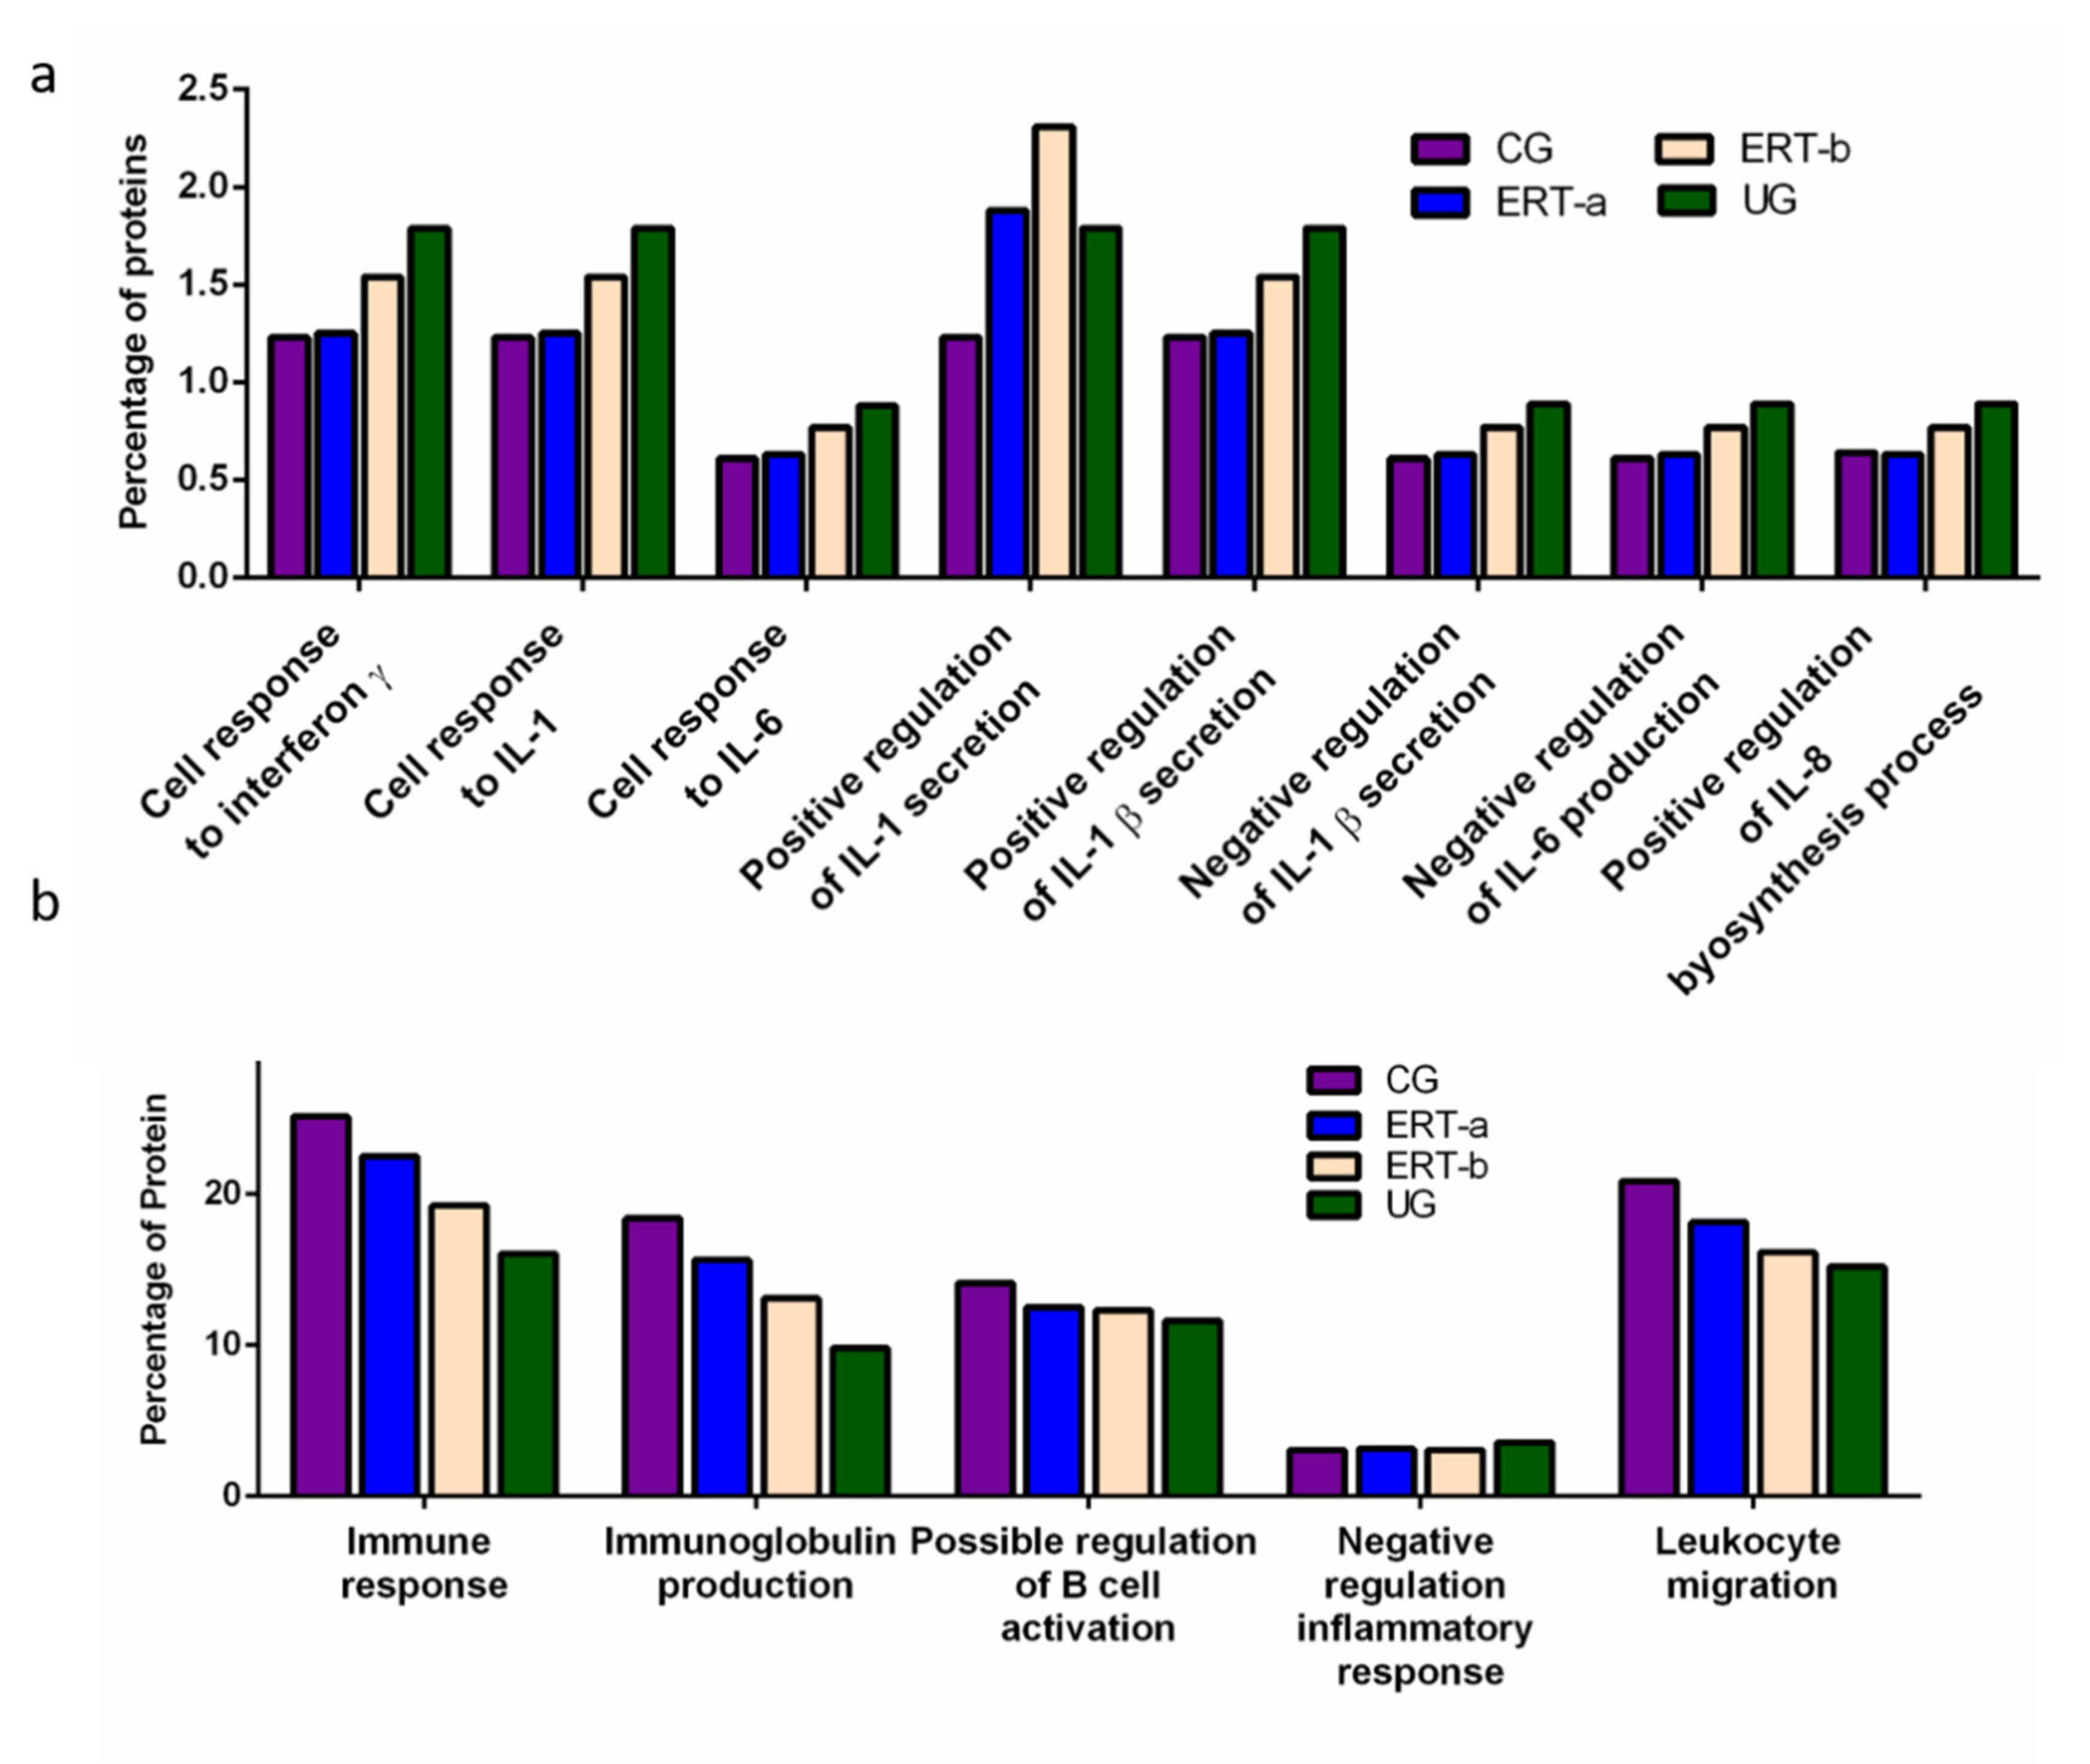
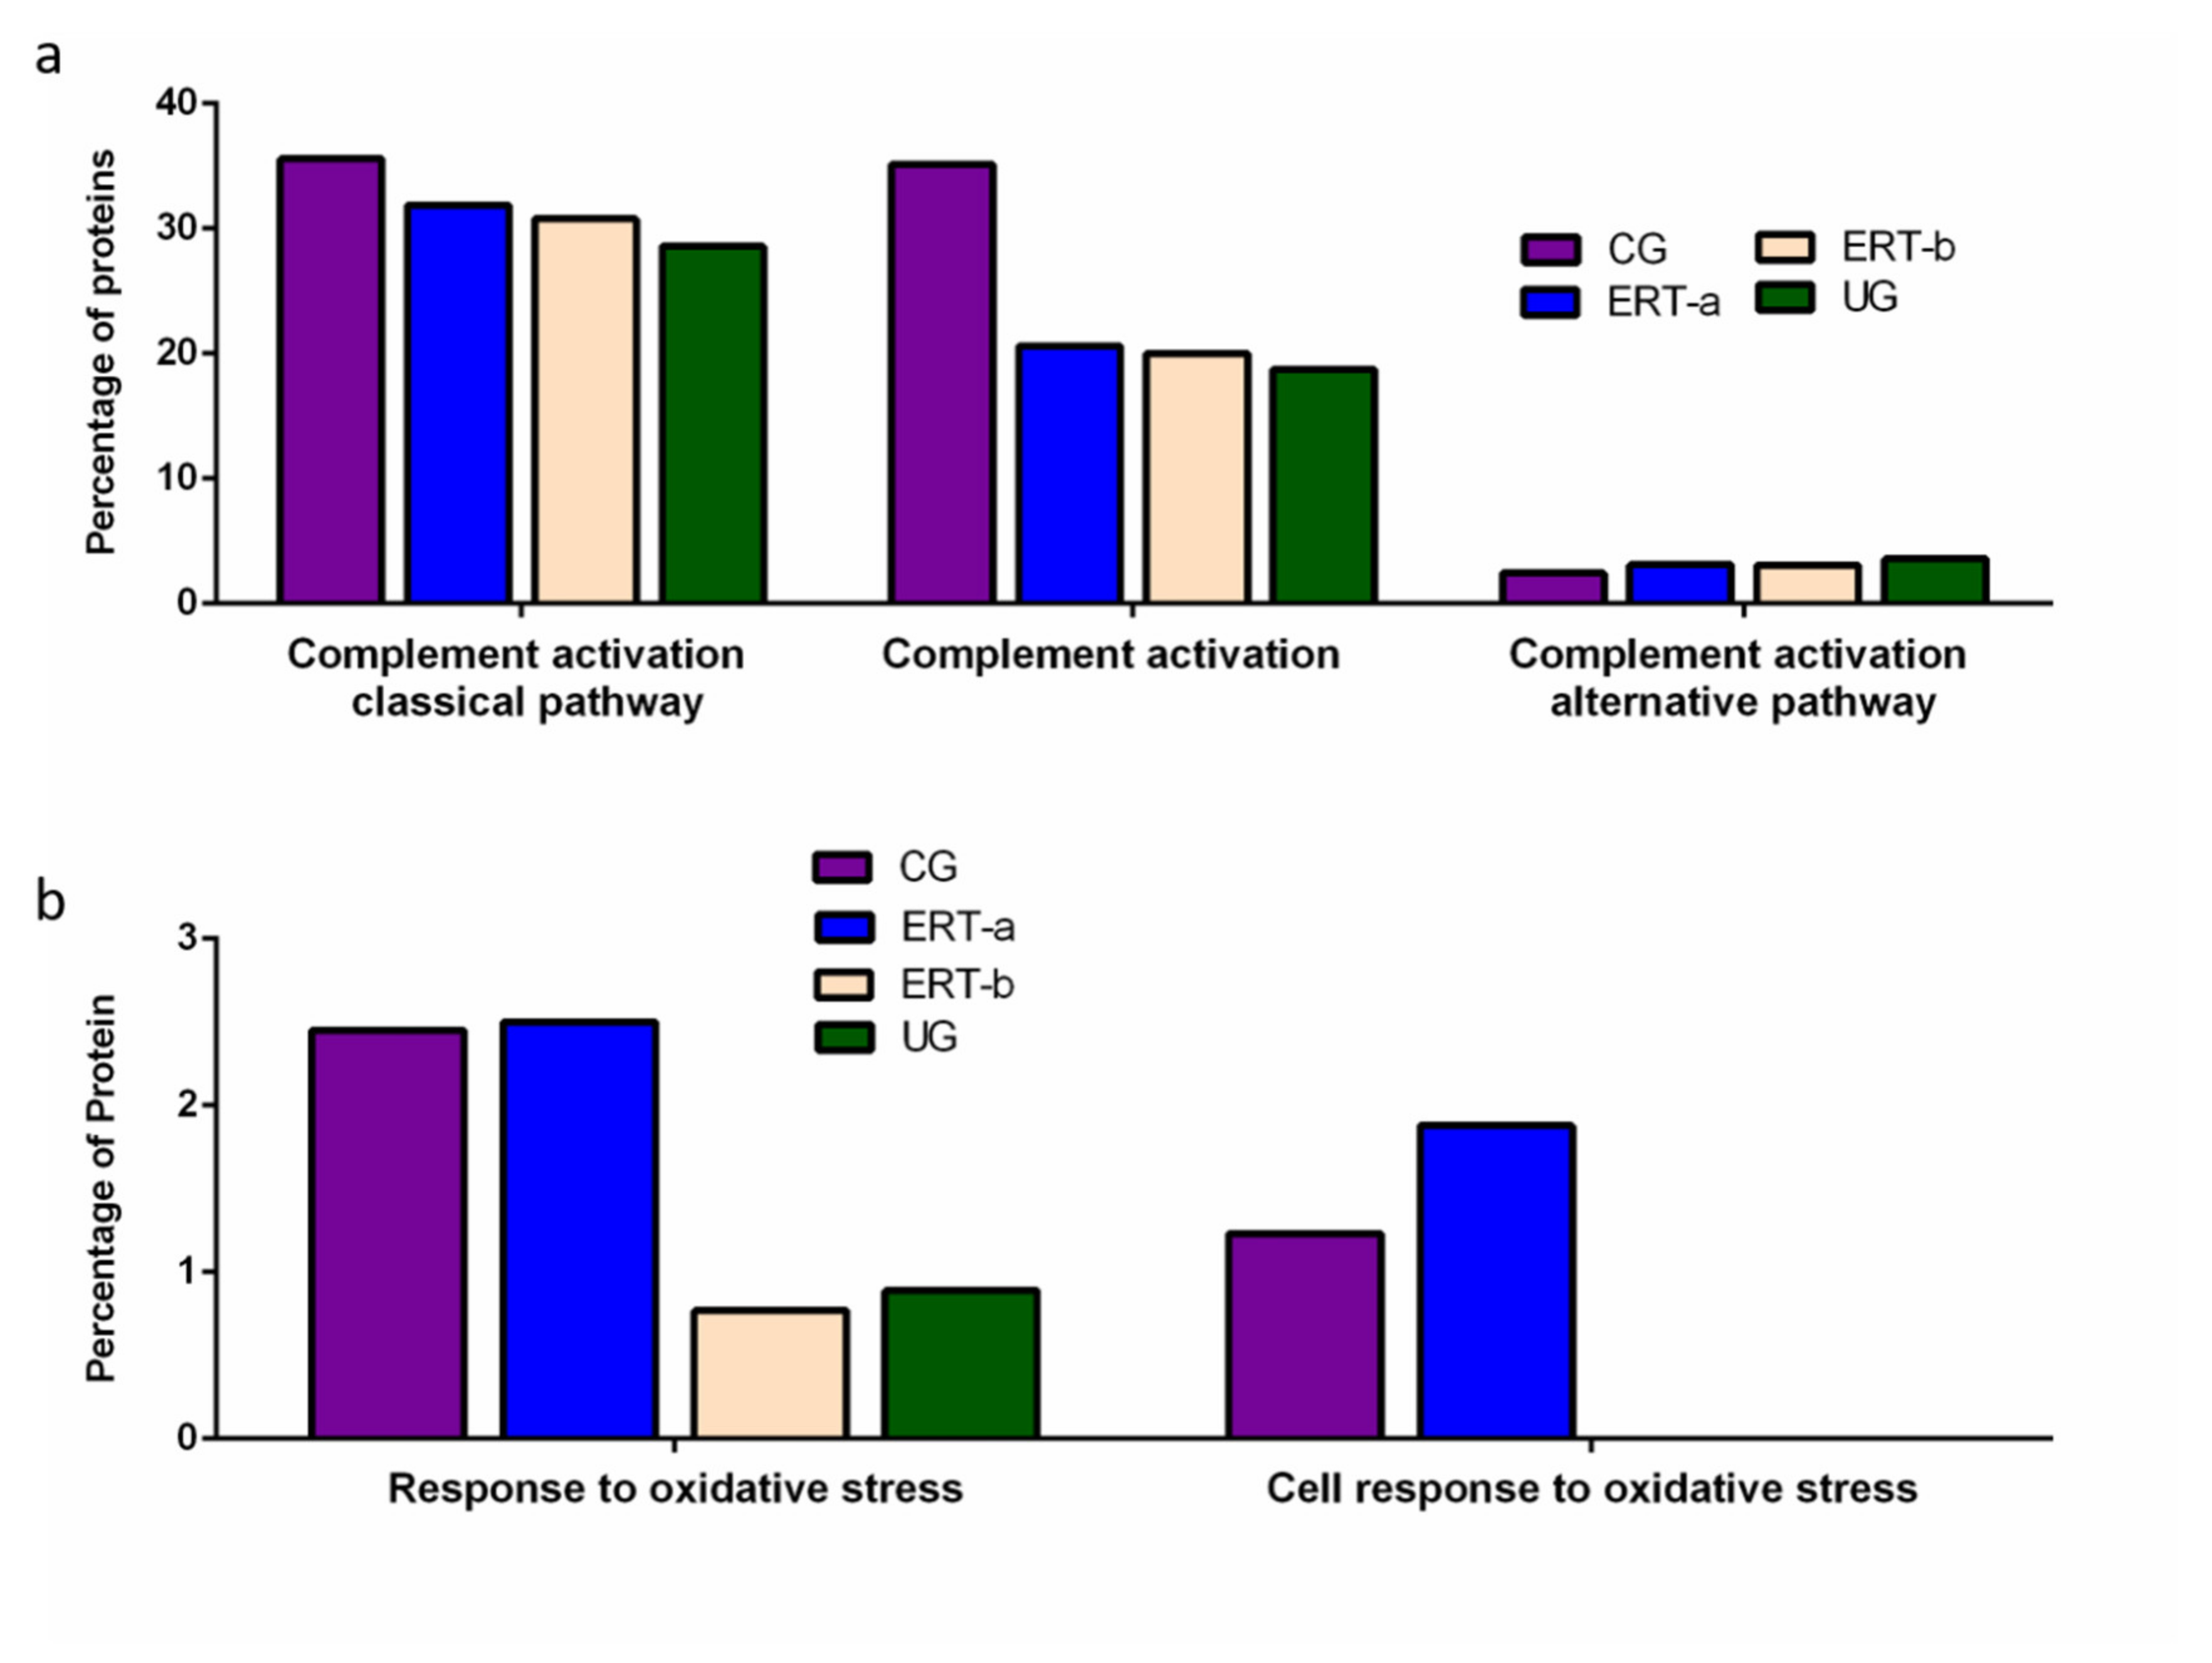
2. Results
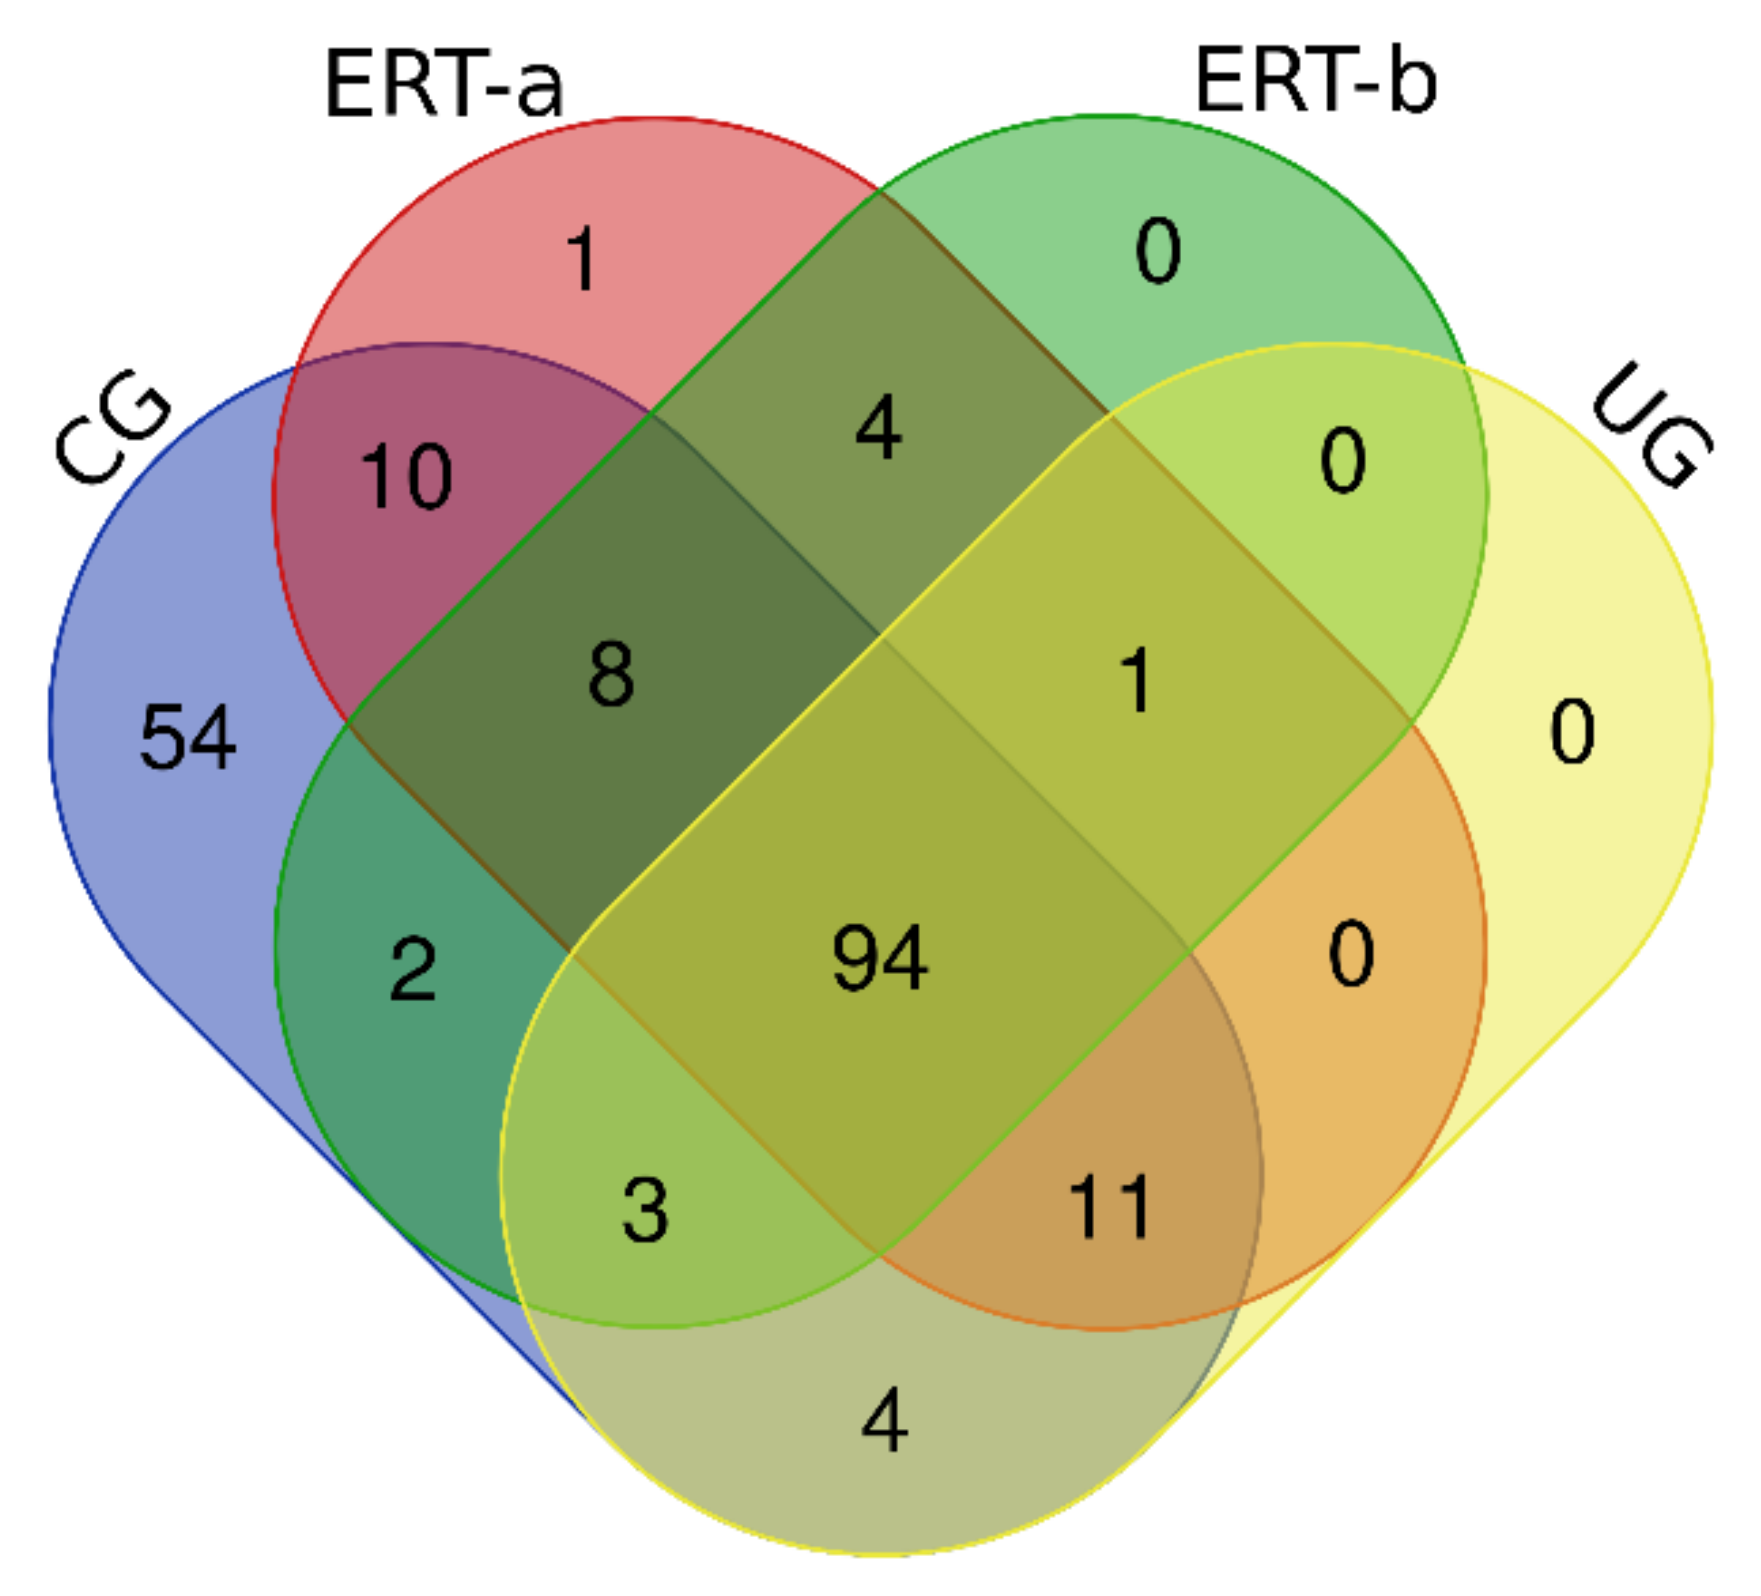
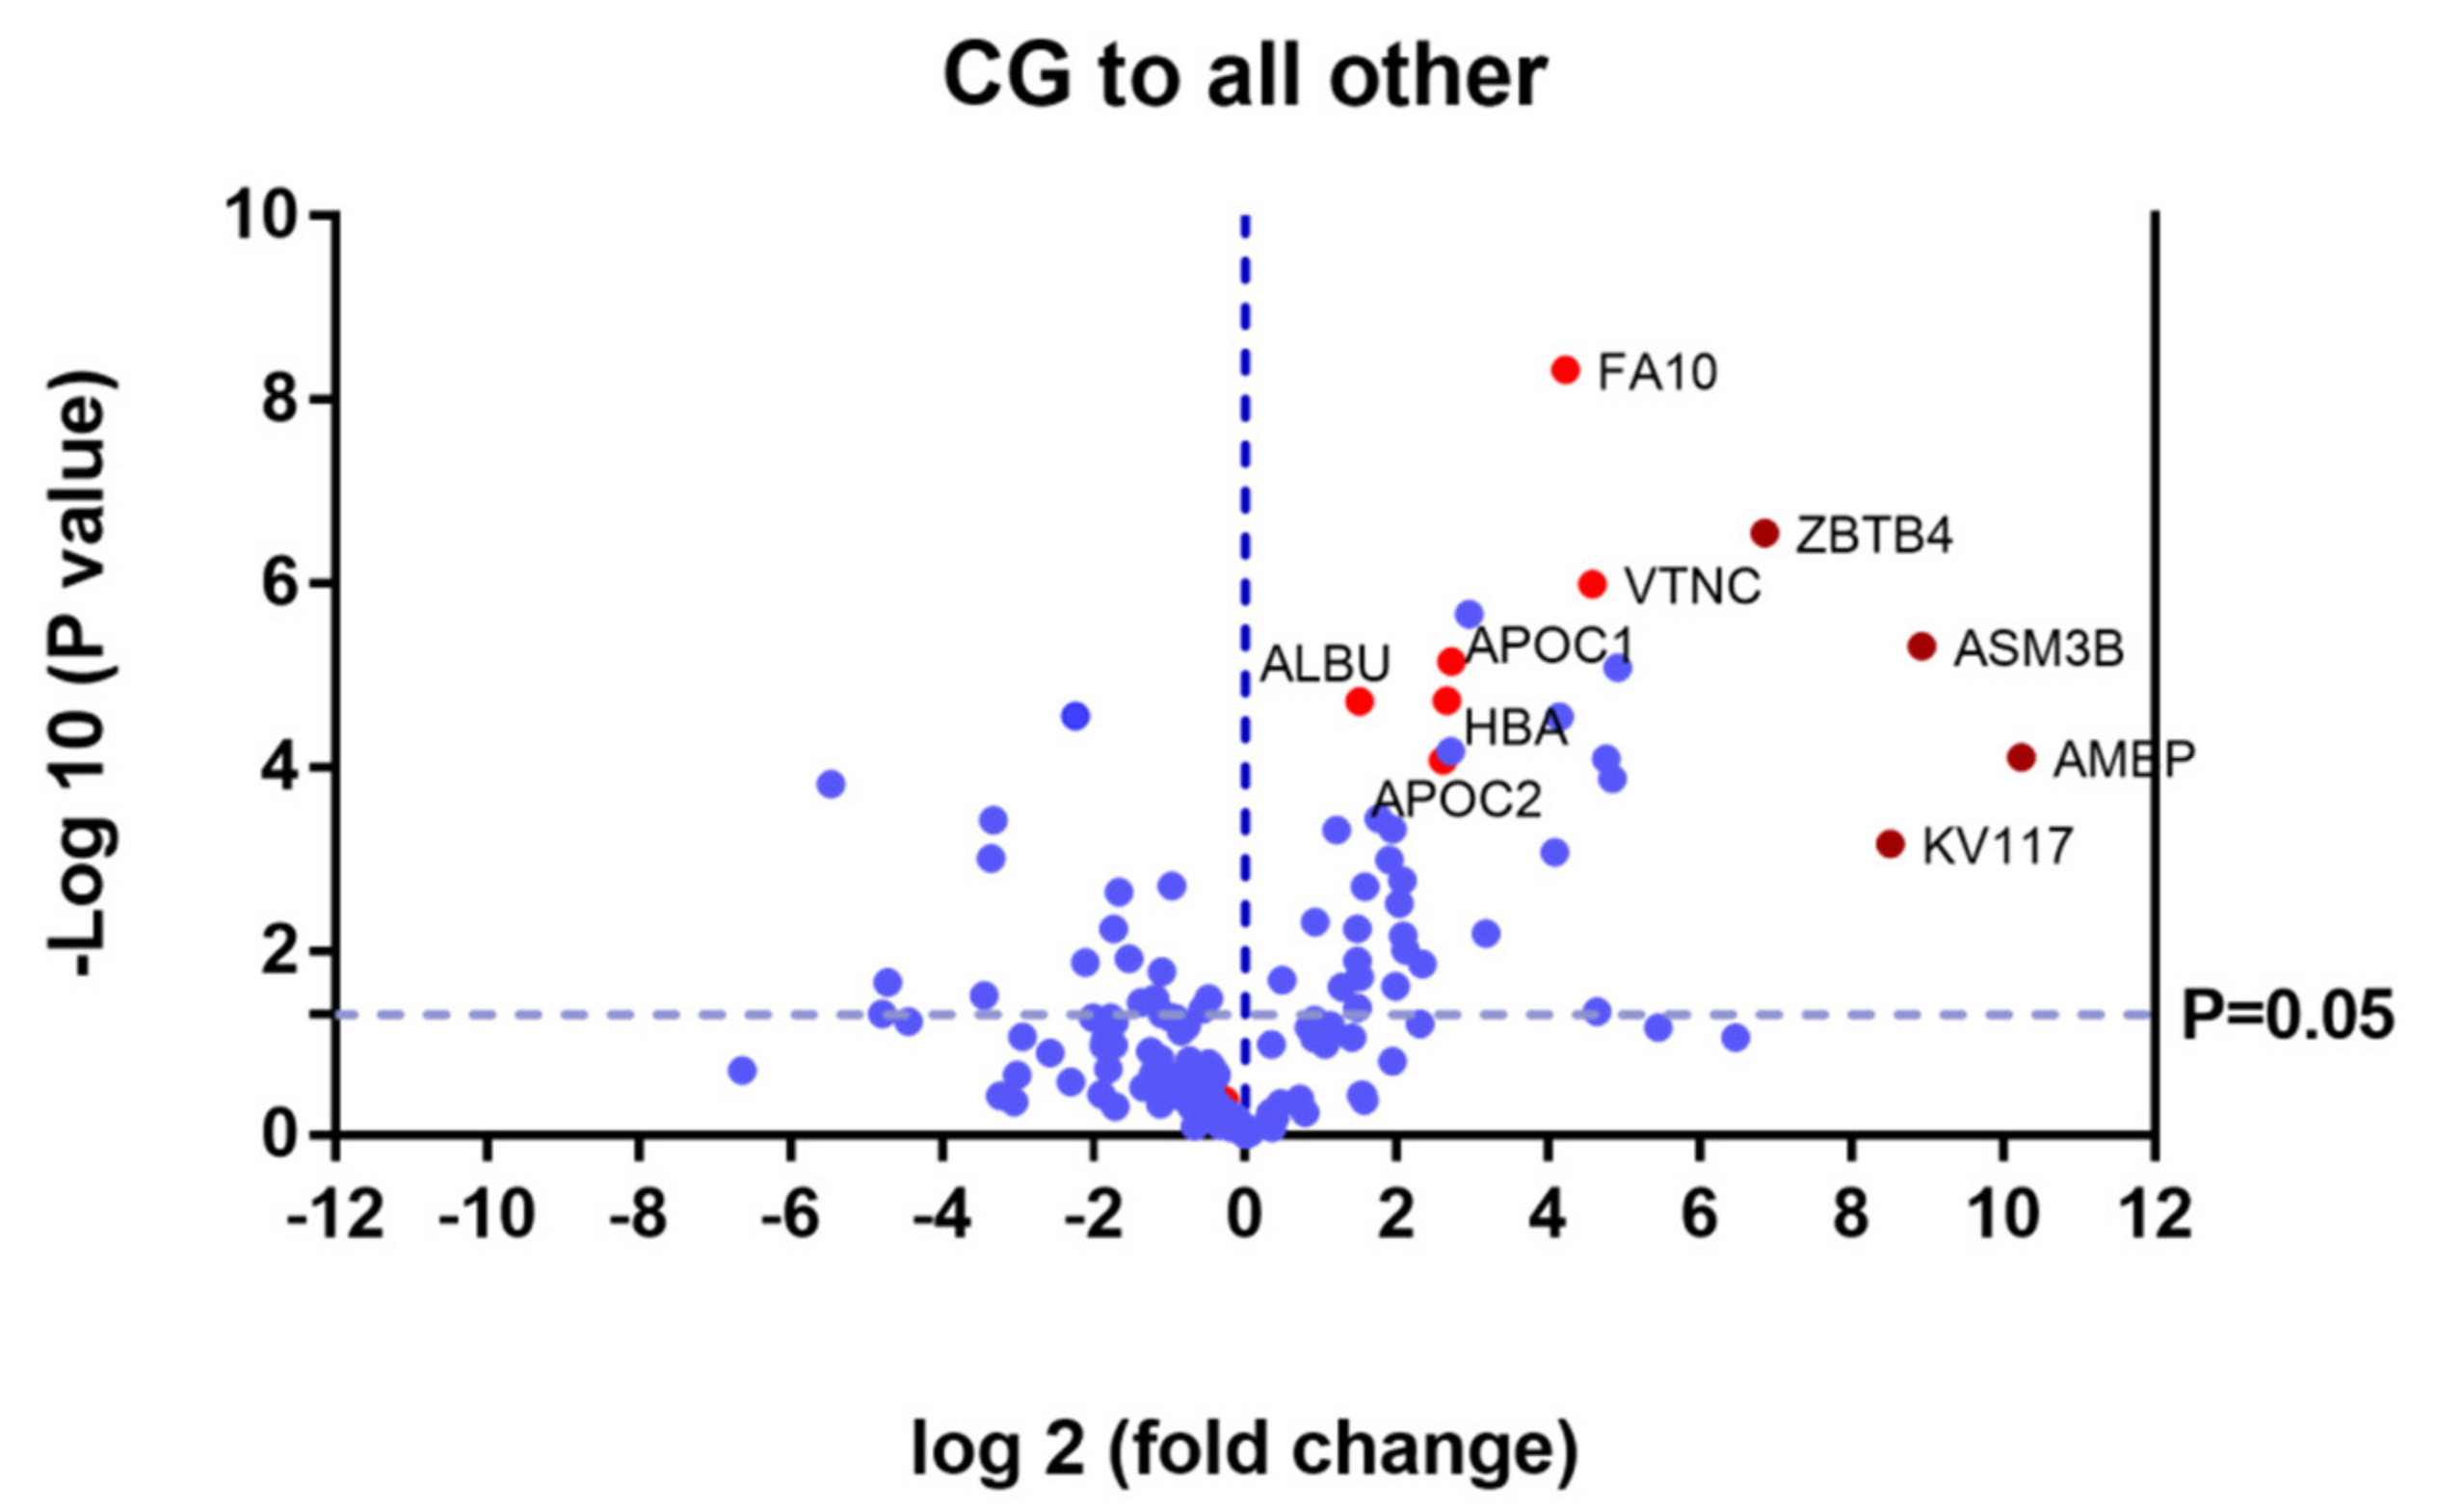
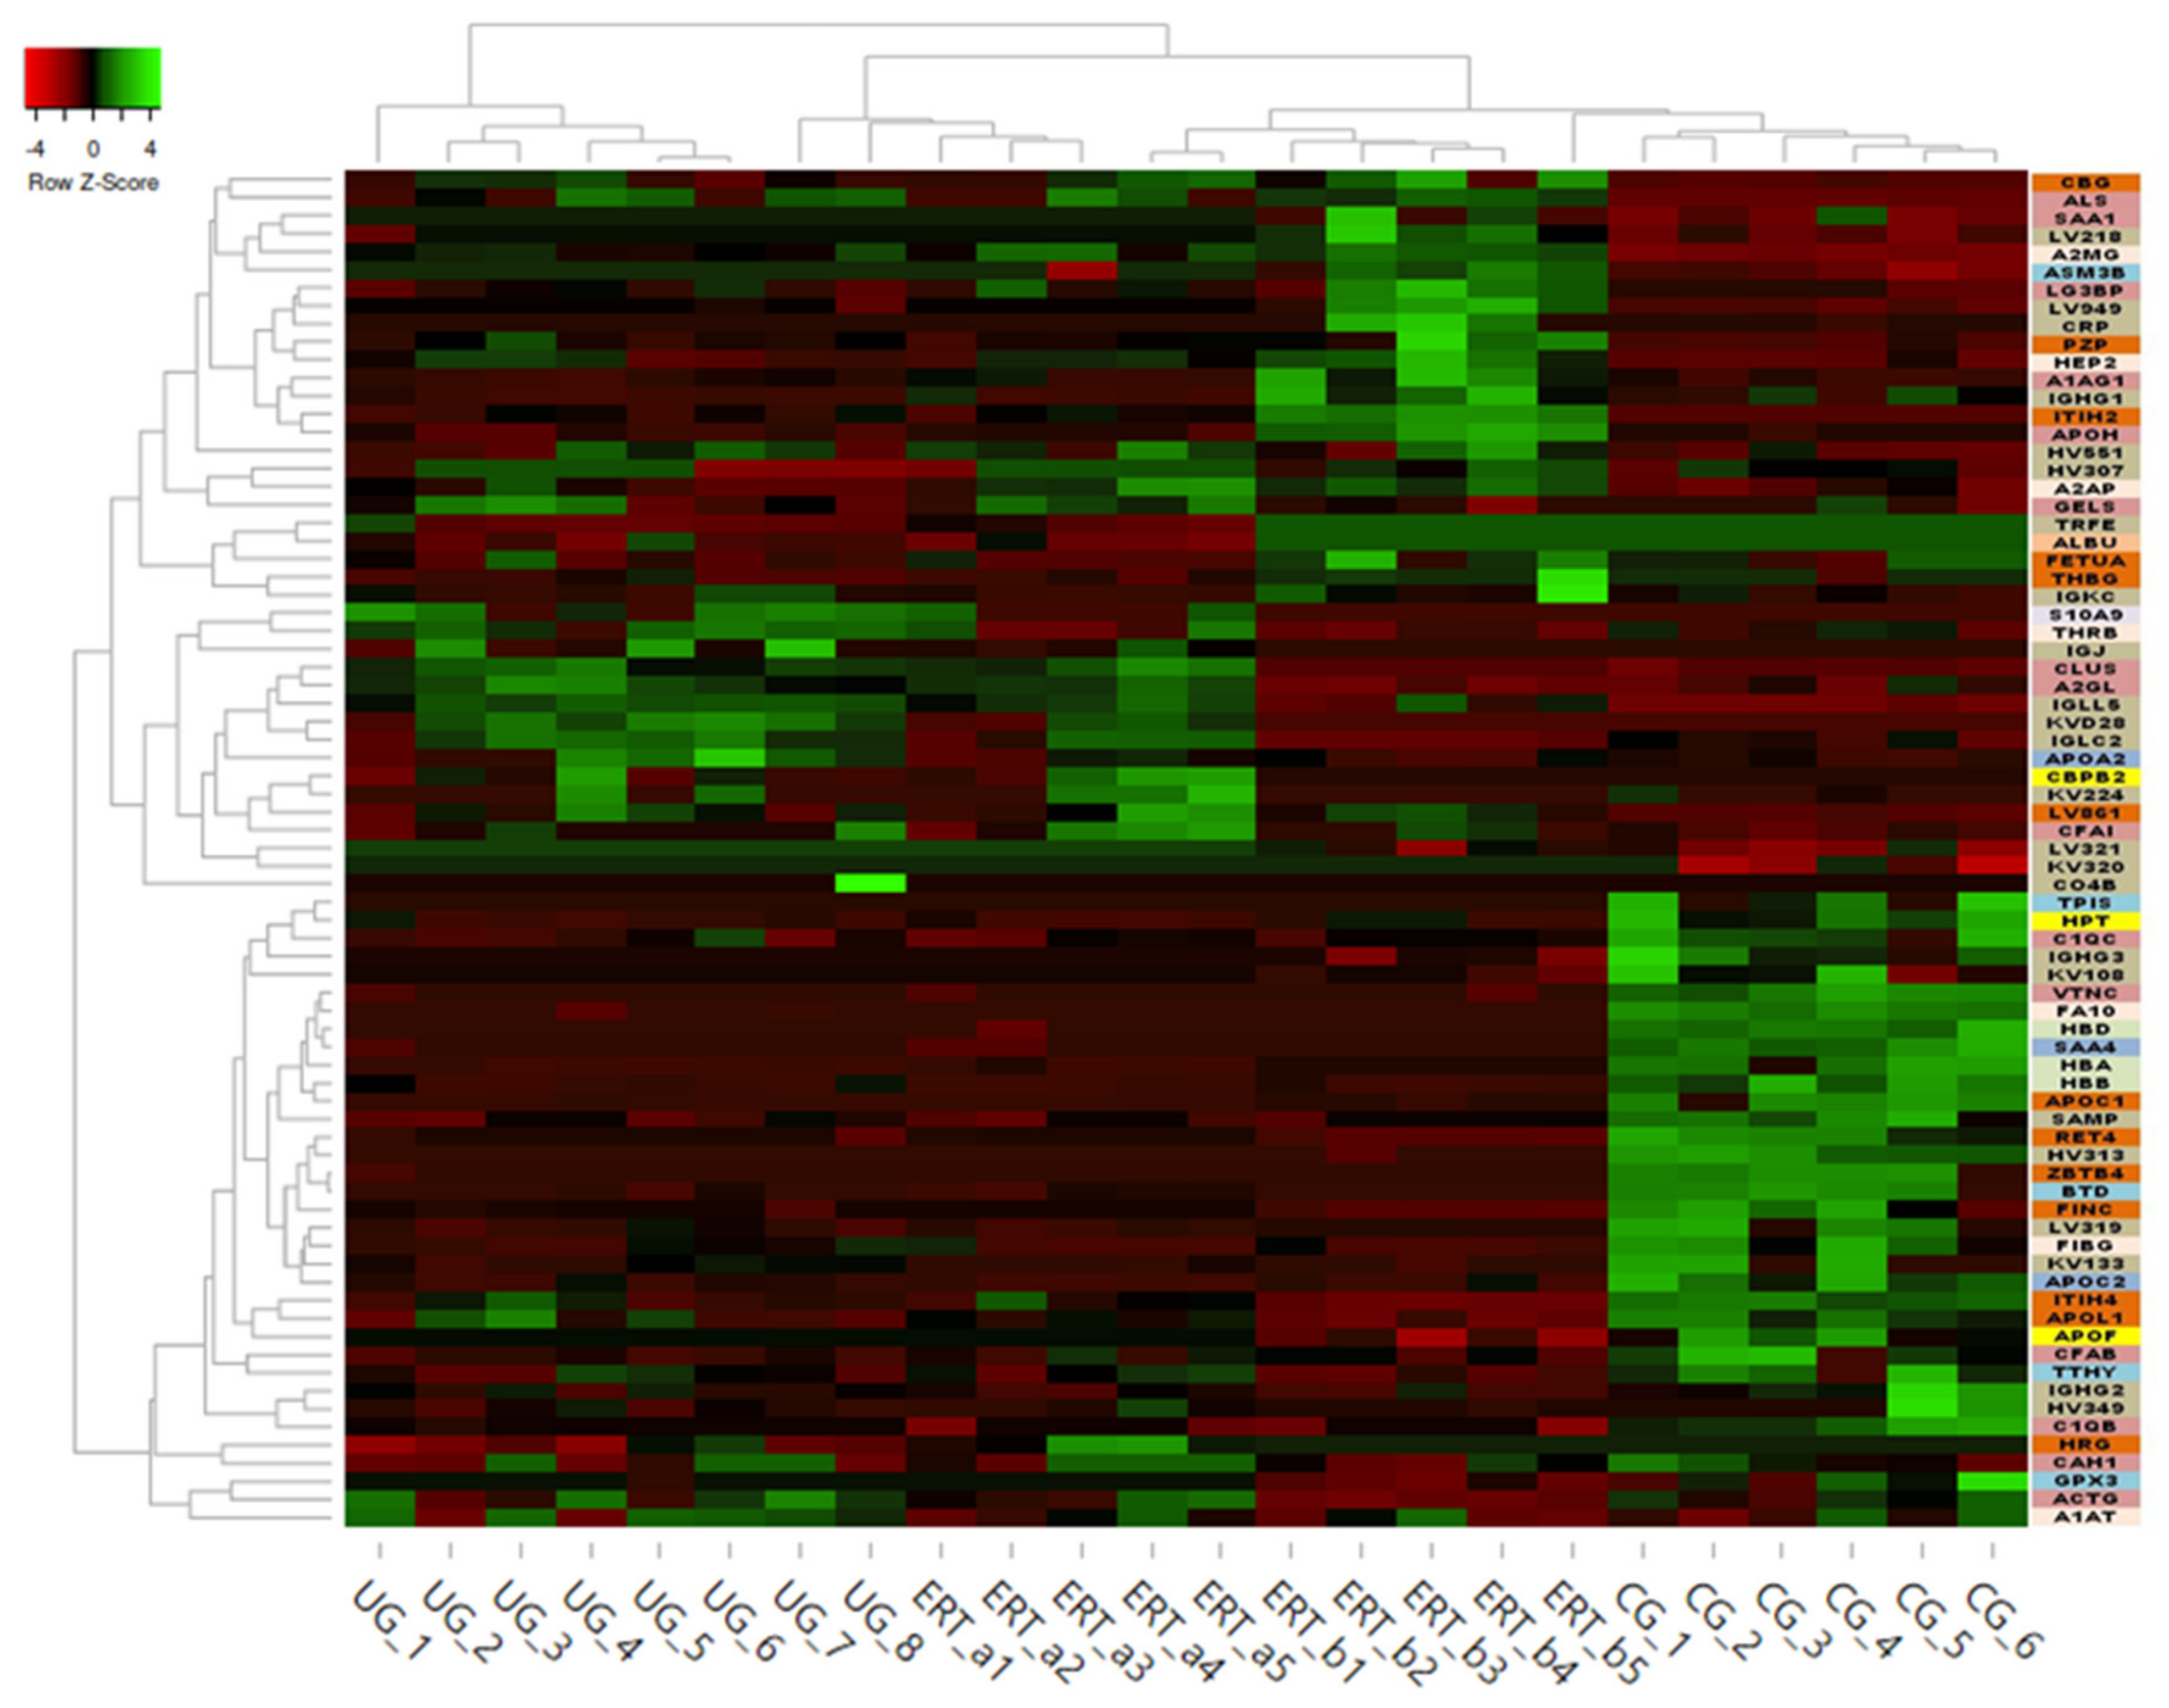
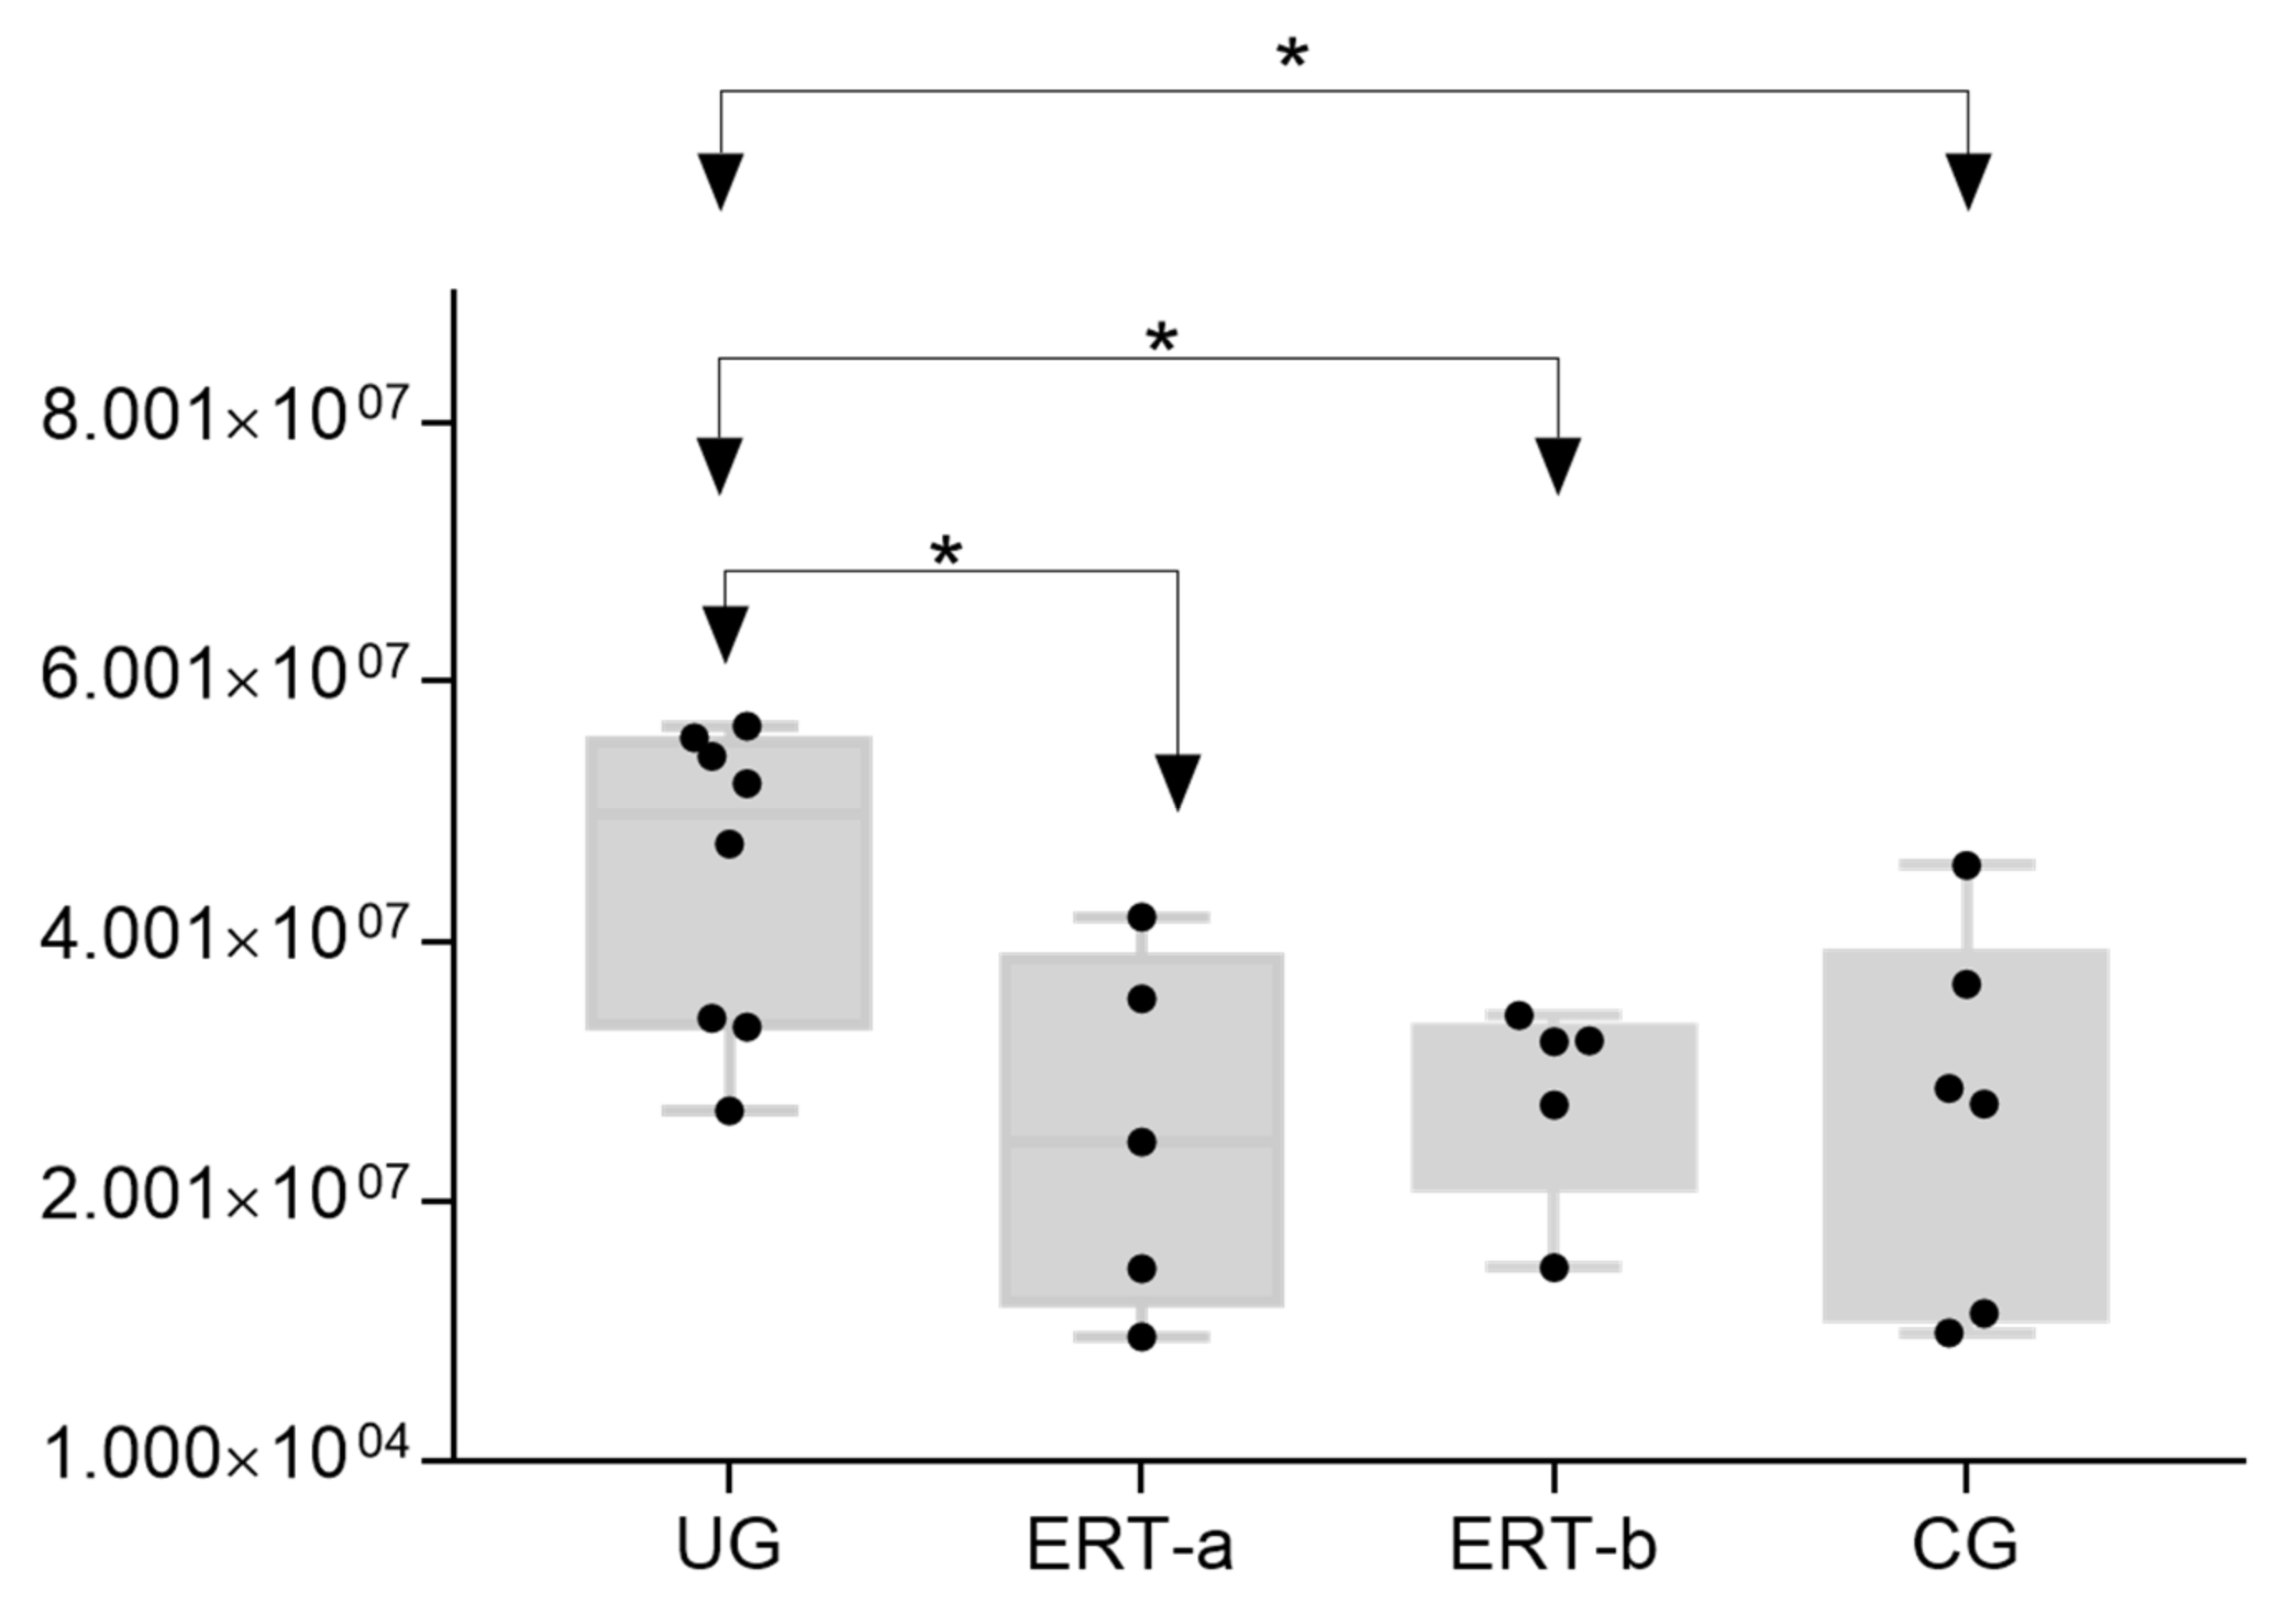
2.1. Qualitative Analysis of Proteins in Plasma Samples
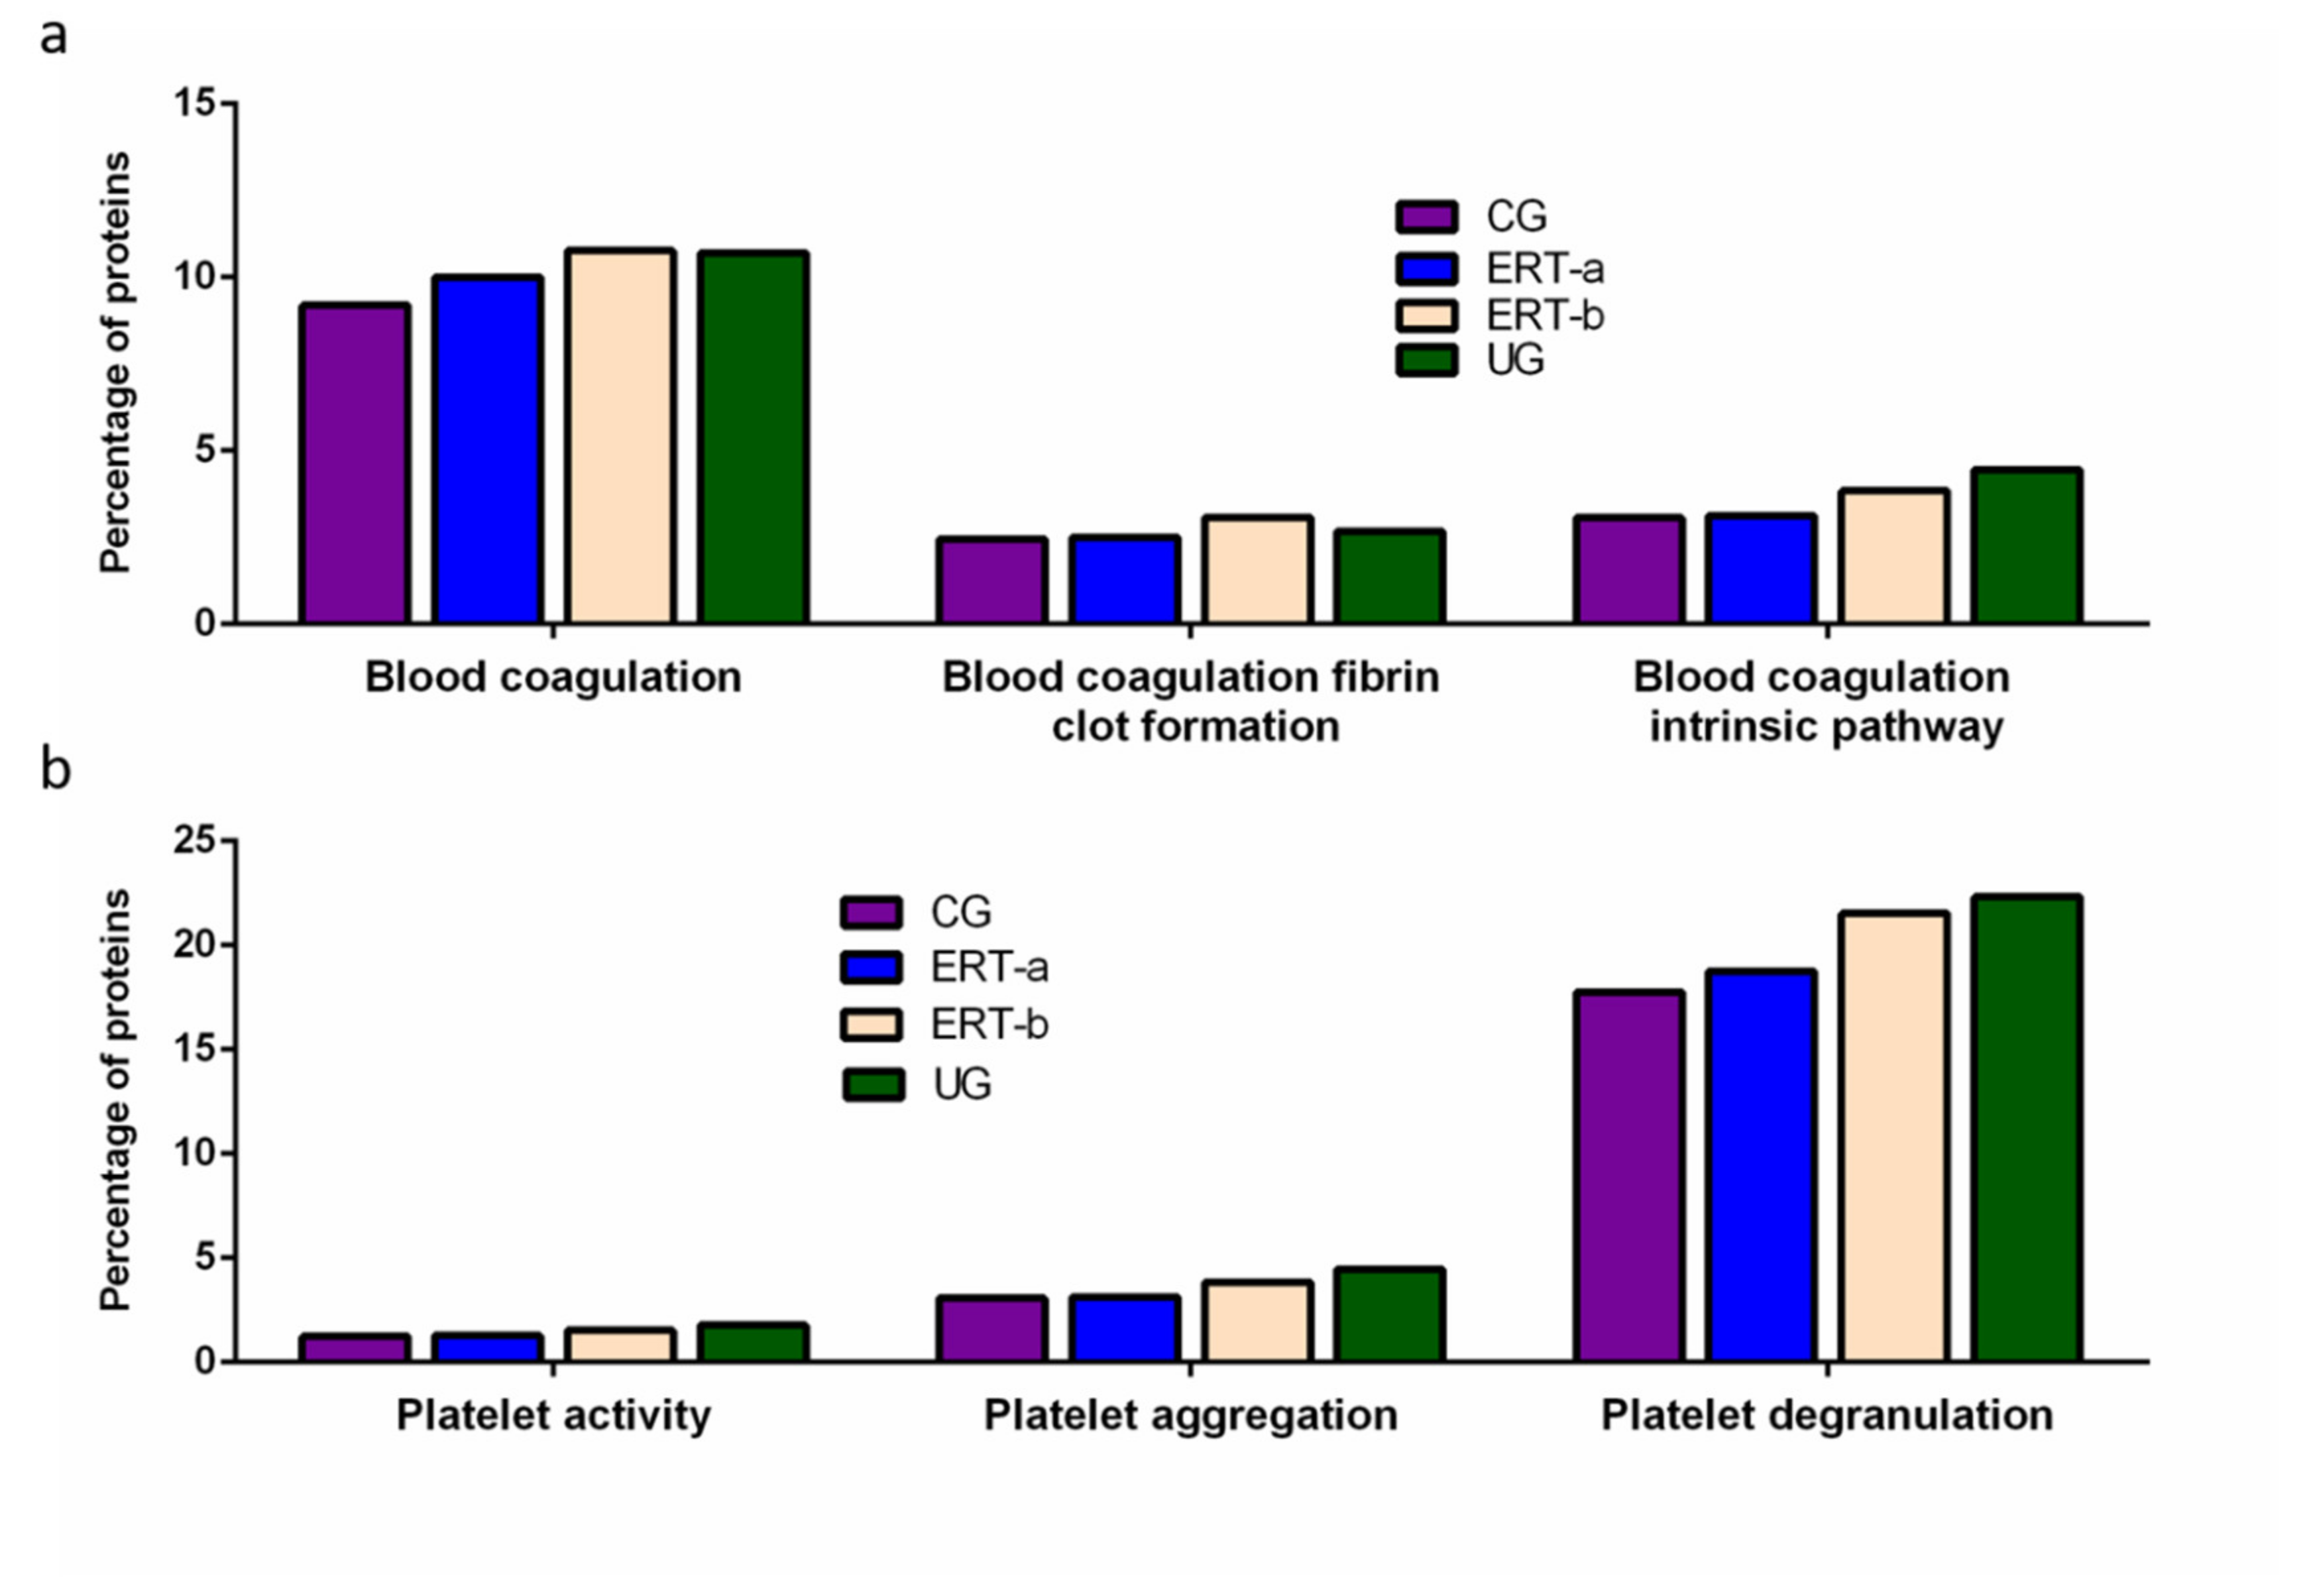
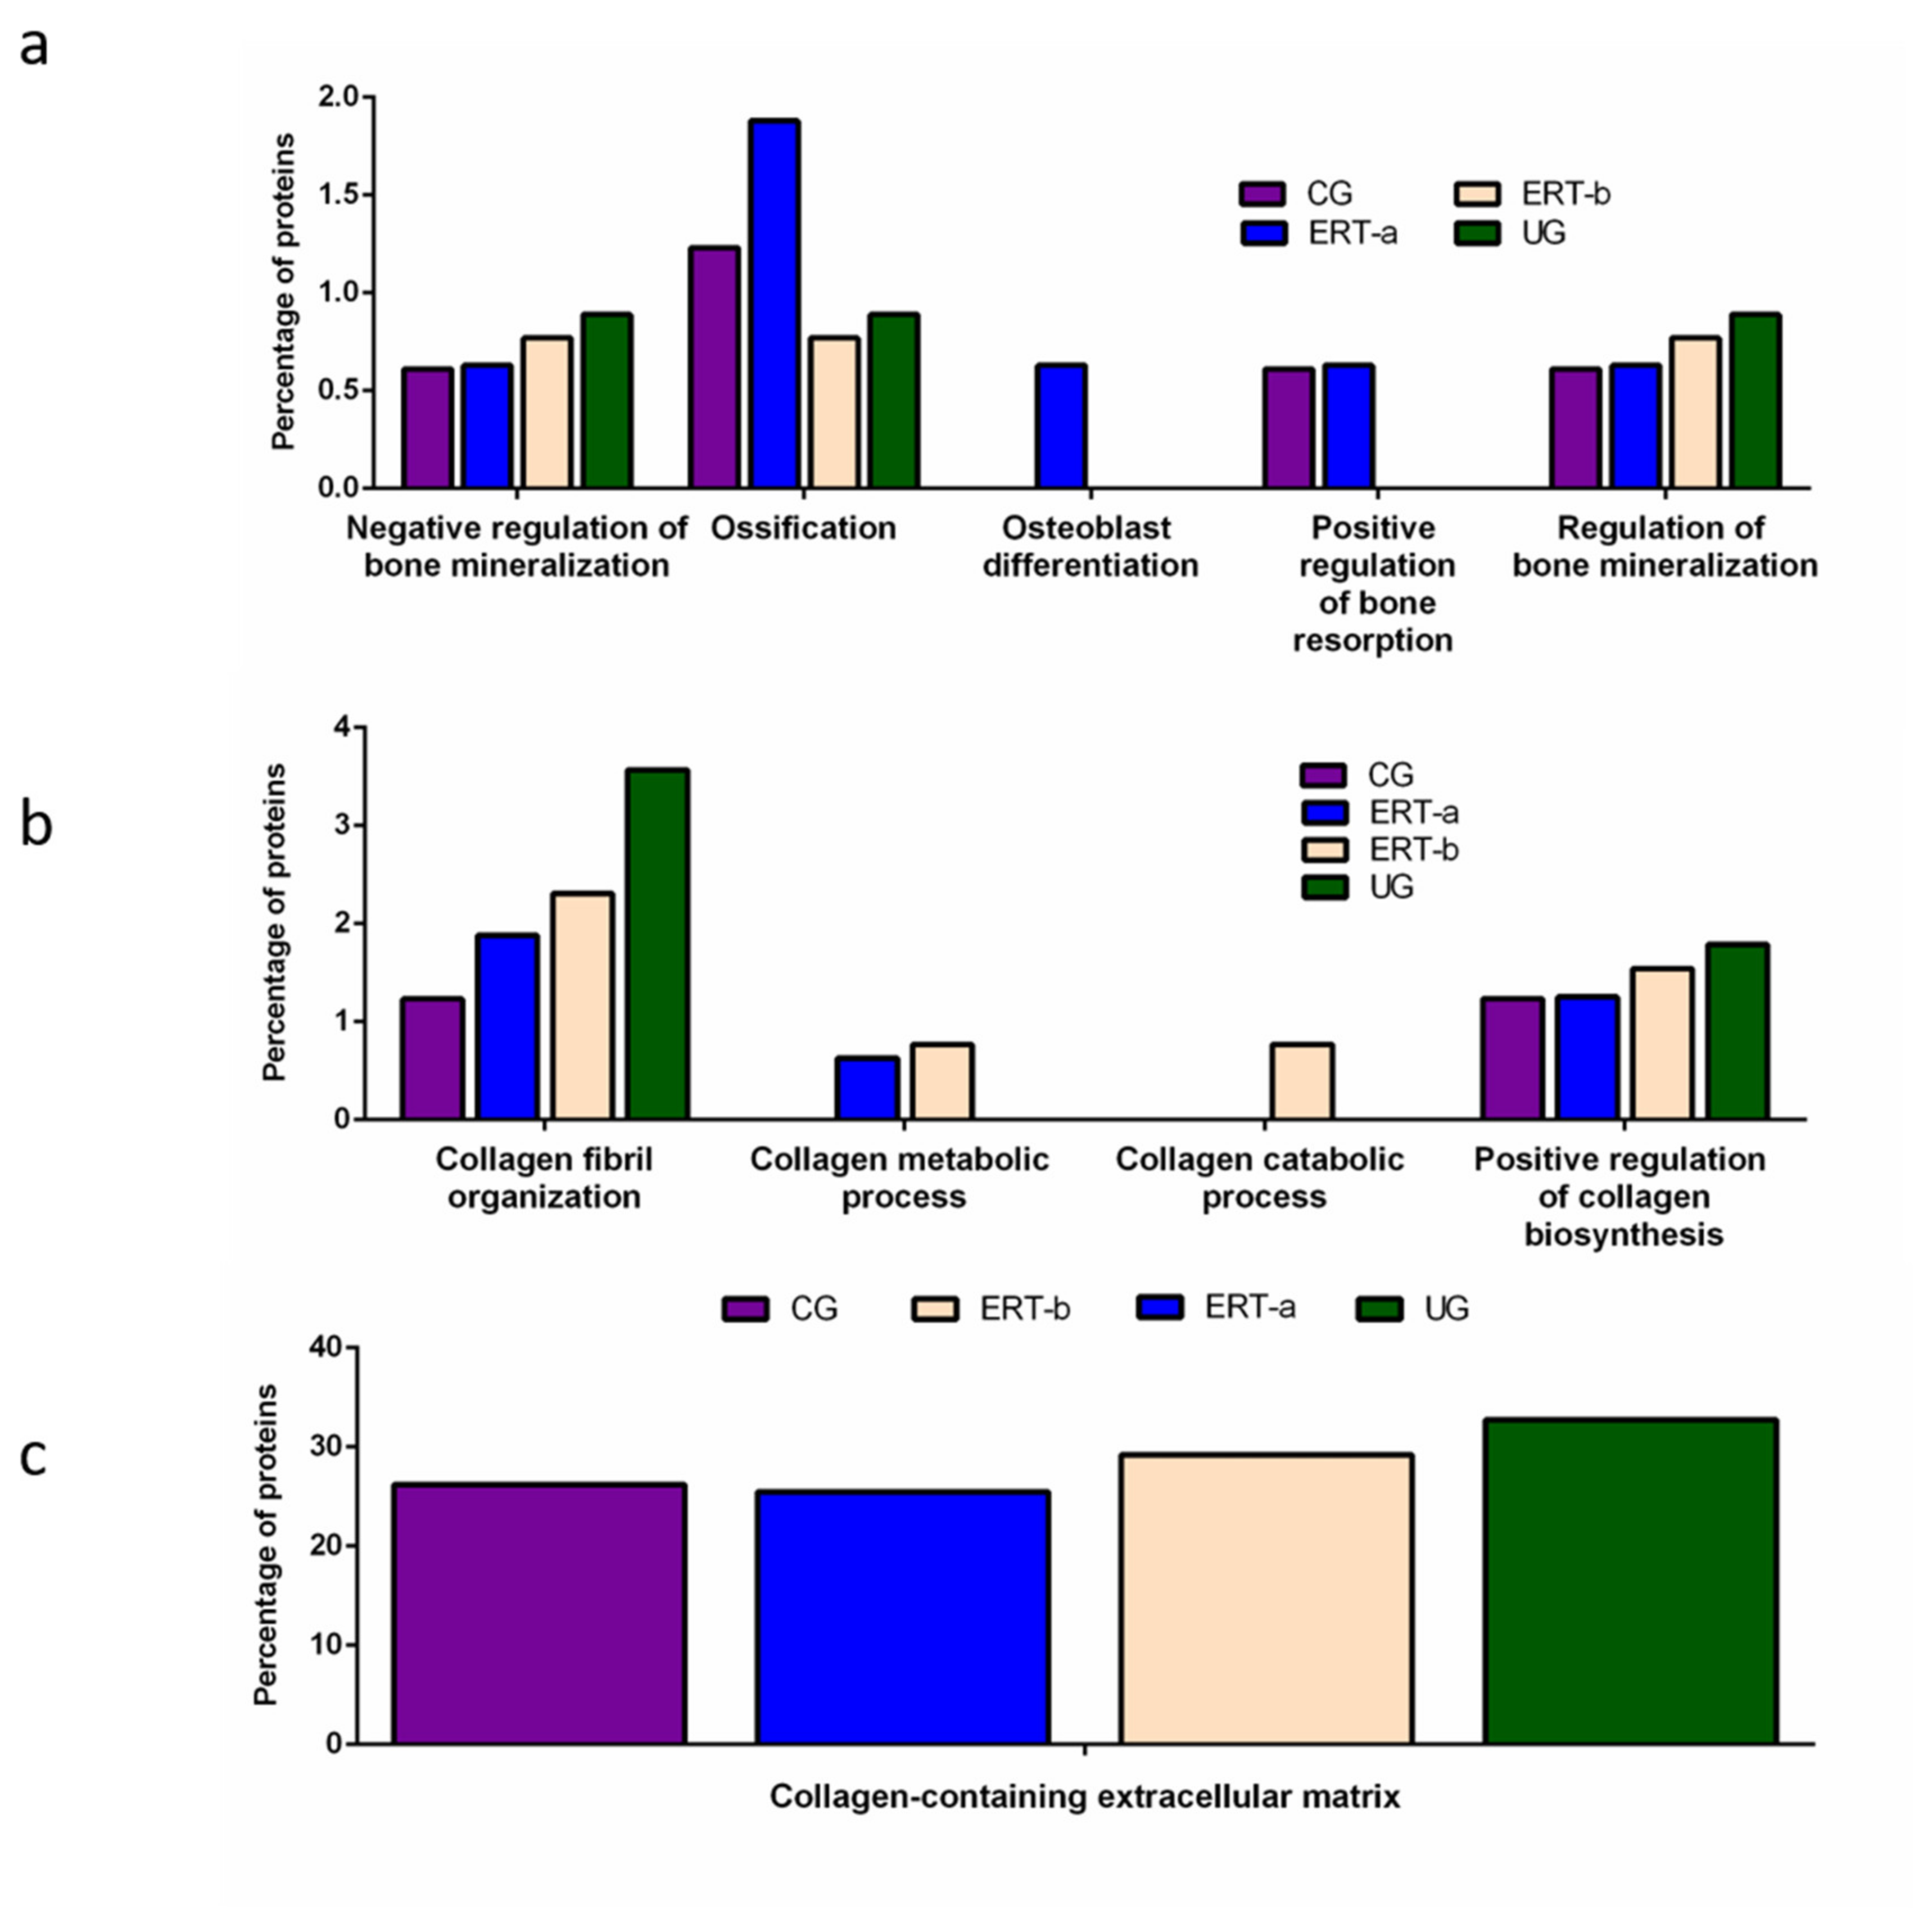
2.2. SWATH Quantitative Analysisof Proteins in Plasma Samples
Quantitative Analysis Using SWATH
3. Discussion
Study Limitations
4. Materials and Methods
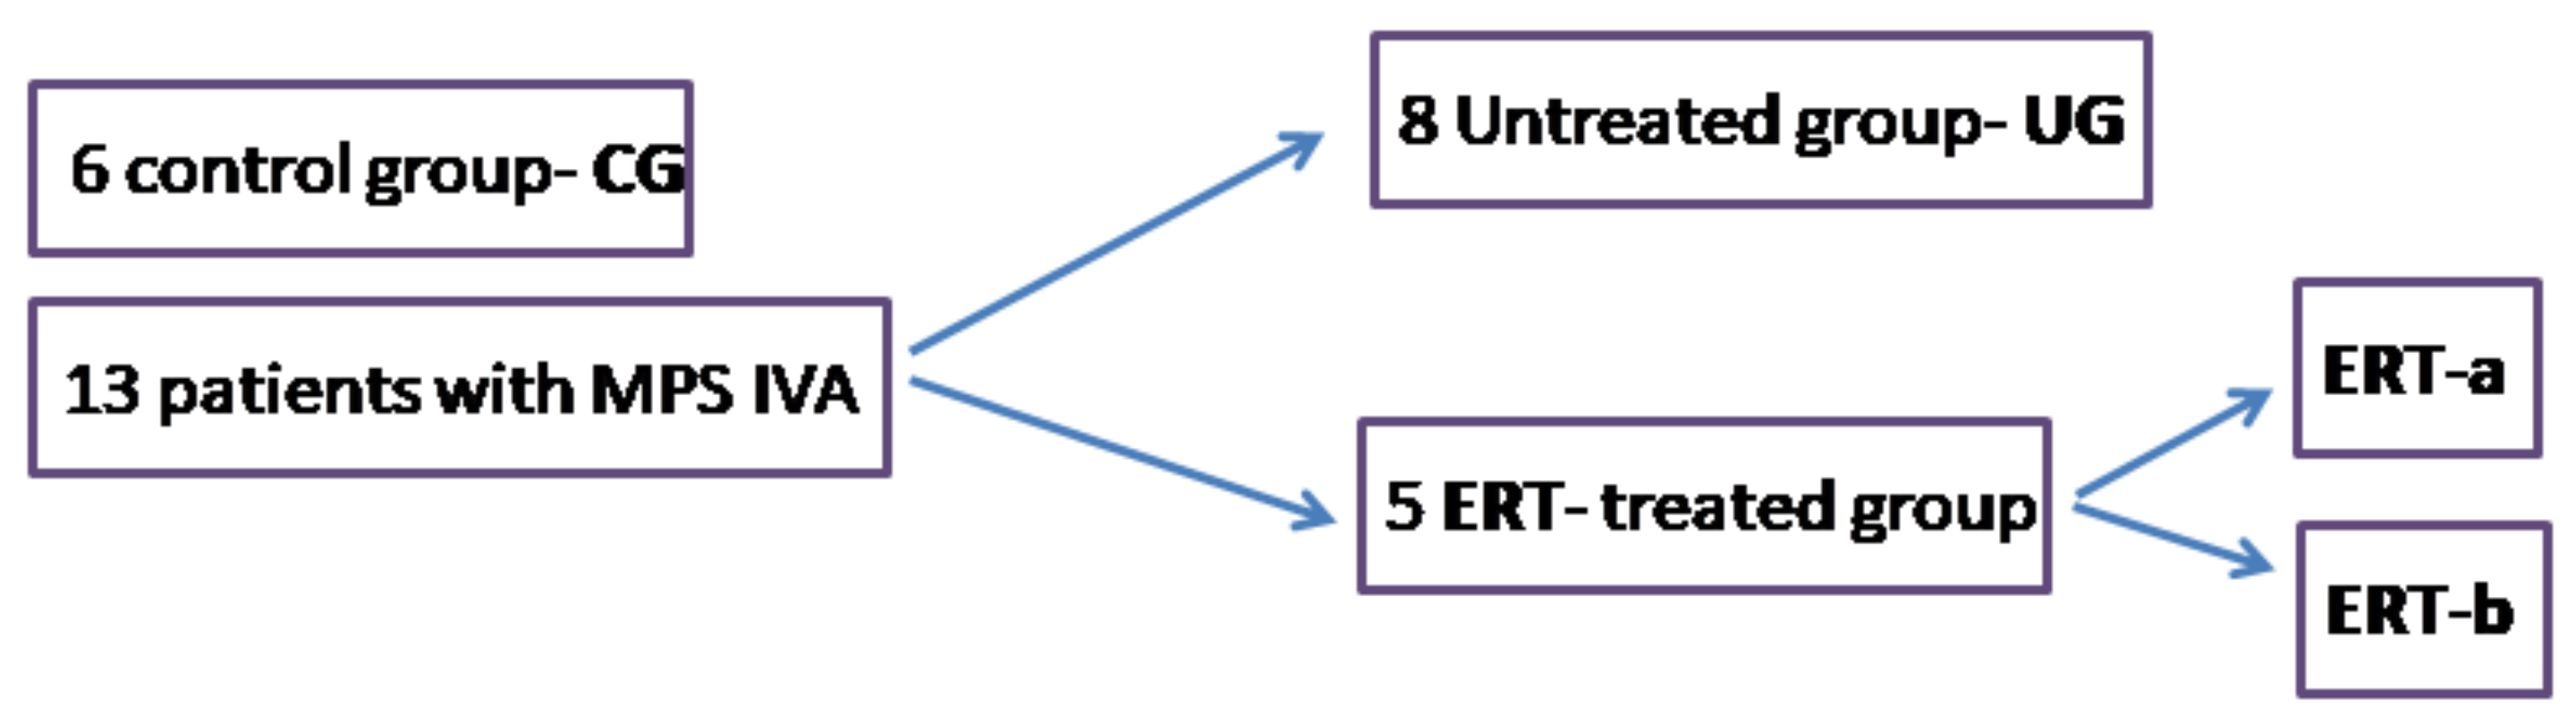
4.1. Study Workflow
4.2. Samples
4.3. Protein Extraction
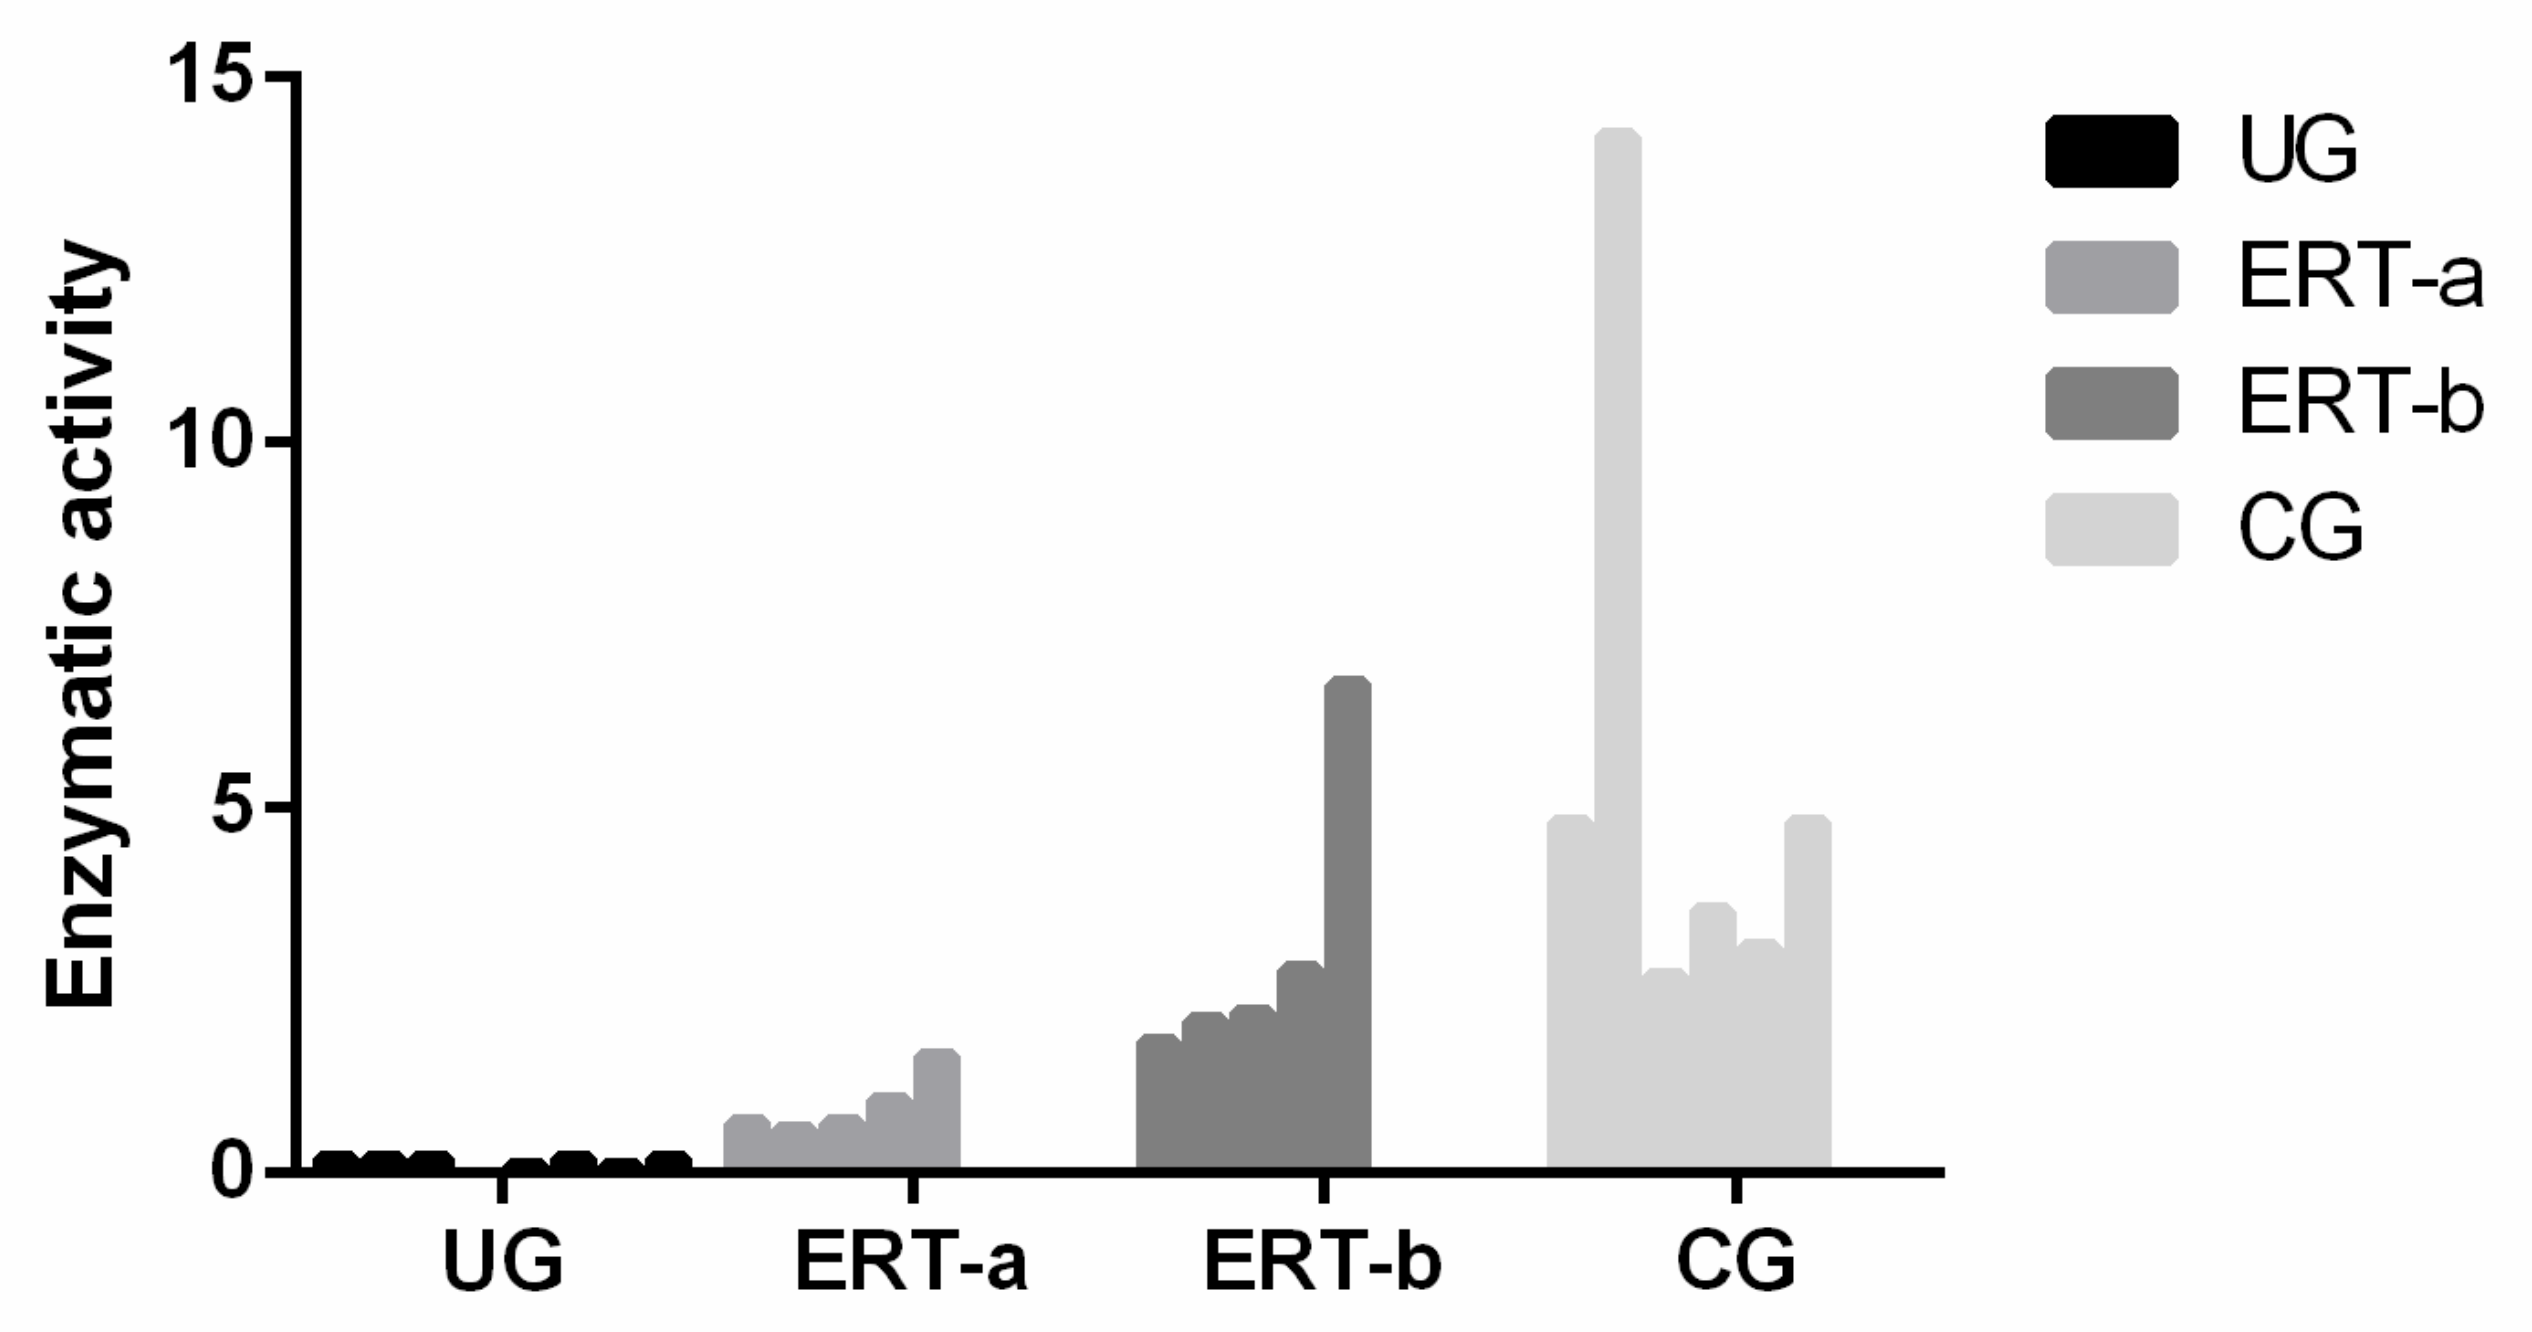
4.4. Enzyme Activity Test
4.5. Proteomic Analysis
5. Conclusions
Supplementary Materials
Author Contributions
Funding
Institutional Review Board Statement
Informed Consent Statement
Data Availability Statement
Acknowledgments
Conflicts of Interest
References
- Matalon, R.; Arbogast, B.; Justice, P.; Brandt, I.K.; Dorfman, A. Morquio’s syndrome: Deficiency of a chondroitin sulfate N-acetylhexosamine sulfate sulfatase. Biochem. Biophys Res. Commun. 1974, 61, 759–765. [Google Scholar] [CrossRef]
- Singh, J.; Di Ferrante, N.; Niebes, P.; Tavella, D. N-acetylgalactosamine-6-sulfate sulfatase in man. Absence of the enzyme in Morquio disease. J. Clin. Investig. 1976, 57, 1036–1040. [Google Scholar] [CrossRef] [PubMed]
- Di Ferrante, N.; Ginsberg, L.C.; Donnelly, P.V.; Di Ferrante, D.T.; Caskey, C.T. Deficiencies of glucosamine-6-sulfate or galactosamine-6-sulfate sulfatases are responsible for different mucopolysaccharidoses. Science 1978, 199, 79–81. [Google Scholar] [CrossRef] [PubMed]
- Tomatsu, S.; Yasuda, E.; Patel, P.; Ruhnke, K.; Shimada, T.; Mackenzie, W.G.; Mason, R.; Thacker, M.M.; Theroux, M.; Montaño, A.M.; et al. Morquio A syndrome: Diagnosis and current and future therapies. Pediatr. Endocrinol. Rev. PER 2014, 12 (Suppl. 1), 141–151. [Google Scholar] [PubMed]
- Hendriksz, C.J.; Berger, K.I.; Giugliani, R.; Harmatz, P.; Kampmann, C.; Mackenzie, W.G.; Raiman, J.; Villarreal, M.S.; Savarirayan, R. International Guidelines for the Management and Treatment of Morquio A Syndrome. Am. J. Med. Genet. Part A 2015, 167, 11–25. [Google Scholar] [CrossRef] [PubMed]
- Khan, S.; Alméciga-Díaz, C.J.; Sawamoto, K.; Mackenzie, W.G.; Theroux, M.C.; Pizarro, C.; Mason, R.W.; Orii, T.; Tomatsu, S. Mucopolysaccharidosis IVA and glycosaminoglycans. Mol. Genet. Metab. 2017, 120, 78–95. [Google Scholar] [CrossRef] [Green Version]
- Peracha, H.; Sawamoto, K.; Averill, L.; Kecskemethy, H.; Theroux, M.; Thacker, M.; Nagao, K.; Pizarro, C.; Mackenzie, W.; Kobayashi, H.; et al. Diagnosis and prognosis of Mucopolysaccharidosis IVA. Mol. Genet. Metab. 2018, 125, 18–37. [Google Scholar] [CrossRef] [PubMed]
- Melbouci, M.; Mason, R.W.; Suzuki, Y.; Fukao, T.; Orii, T.; Tomatsu, S. Growth impairment in mucopolysaccharidoses. Mol. Genet. Metab. 2018, 124, 1–10. [Google Scholar] [CrossRef]
- Tomatsu, S.; Montaño, A.M.; Oikawa, H.; Smith, M.; Barrera, L.; Chinen, Y.; Thacker, M.M.; Mackenzie, W.G.; Suzuki, Y.; Orii, T. Mucopolysaccharidosis type IVA (Morquio A disease): Clinical review and current treatment. Curr. Pharm. Biotechnol. 2011, 12, 931–945. [Google Scholar] [CrossRef] [PubMed]
- Lavery, C.; Hendriksz, C. Mortality in patients with Morquio syndrome A. JIMD Rep. 2015, 15, 59. [Google Scholar]
- Hendriksz, C.; Santra, S.; Jones, S.A.; Geberhiwot, T.; Jesaitis, L.; Long, B.; Qi, Y.; Hawley, S.M.; Decker, C. Safety, immunogenicity, and clinical outcomes in patients with Morquio A syndrome participating in 2 sequential open-label studies of elosulfasealfa enzyme replacement therapy (MOR-002/MOR-100), representing 5 years of treatment. Mol. Genet. Metab. 2018, 123, 479–487. [Google Scholar] [CrossRef] [PubMed]
- Hendriksz, C.J. Elosulfasealfa (BMN 110) for the treatment of mucopolysaccharidosis IVA (Morquio A Syndrome). Expert Rev. Clin. Pharmacol. 2016, 9, 1521–1532. [Google Scholar] [CrossRef] [Green Version]
- Akyol, M.U.; Alden, T.D.; Amartino, H.; Ashworth, J.; Belani, K.; Berger, K.I.; Borgo, A.; Braunlin, E.; Eto, Y.; Gold, J.I.; et al. Recommendations for the management of MPS IVA: Systematic evidence- and consensus-based guidance. Orphanet J. Rare Dis. 2019, 14, 137. [Google Scholar] [CrossRef] [Green Version]
- Tomatsu, S.; Sawamoto, K.; Shimada, T.; Bober, M.B.; Kubaski, F.; Yasuda, E.; Mason, R.W.; Khan, S.; Alméciga-Díaz, C.J.; Barrera, L.A.; et al. Enzyme replacement therapy for treating mucopolysaccharidosis type IVA (Morquio A syndrome): Effect and limitations. Expert Opin. Orphan Drugs 2015, 3, 1279–1290. [Google Scholar] [CrossRef] [PubMed] [Green Version]
- Tomatsu, S.; Montaño, A.M.; Dung, V.C.; Ohashi, A.; Oikawa, H.; Oguma, T.; Orii, T.; Barrera, L.; Sly, W.S. Enhancement of drug delivery: Enzyme-replacement therapy for murine Morquio A syndrome. Mol. Ther. 2010, 18, 1094–1102. [Google Scholar] [CrossRef] [PubMed]
- Sawamoto, K.; Stapleton, M.; Alméciga-Díaz, C.J.; Espejo-Mojica, A.J.; Losada, J.C.; Suarez, D.A.; Tomatsu, S. Therapeutic Options for Mucopolysaccharidoses: Current and Emerging Treatments. Drugs 2019, 79, 1103–1134. [Google Scholar] [CrossRef]
- Long, B.; Tompkins, T.; Decker, C.; Jesaitis, L.; Khan, S.; Slasor, P.; Harmatz, P.; O’Neill, C.A.; Schweighardt, B. Long-term Immunogenicity of Elosulfase Alfa in the Treatment of Morquio A Syndrome: Results From MOR-005, a Phase III Extension Study. Clin. Ther. 2017, 39, 118–129. [Google Scholar] [CrossRef] [PubMed] [Green Version]
- Doherty, C.; Stapleton, M.; Piechnik, M.; Mason, R.W.; Mackenzie, W.G.; Yamaguchi, S.; Kobayashi, H.; Suzuki, Y.; Tomatsu, S. Effect of enzyme replacement therapy on the growth of patients with Morquio A. J. Hum. Genet. 2019, 64, 625–635. [Google Scholar] [CrossRef] [PubMed]
- Tomatsu, S.; Averill, L.W.; Sawamoto, K.; Mackenzie, W.G.; Bober, M.B.; Pizarro, C.; Goff, C.J.; Xie, L.; Orii, T.; Theroux, M. Obstructive airway in Morquio A syndrome, the past, the present and the future. Mol. Genet. Metab. 2016, 117, 150–156. [Google Scholar] [CrossRef] [Green Version]
- Tomatsu, S.; Sawamoto, K.; Alméciga-Díaz, C.J.; Shimada, T.; Bober, M.B.; Chinen, Y.; Yabe, H.; Montaño, A.M.; Giugliani, R.; Kubaski, F.; et al. Impact of enzyme replacement therapy and hematopoietic stem cell transplantation in patients with Morquio A syndrome. Drug Des. Dev. Ther. 2015, 9, 1937–1953. [Google Scholar] [CrossRef] [Green Version]
- Qi, Y.; Musson, D.G.; Schweighardt, B.; Tompkins, T.; Jesaitis, L.; Shaywitz, A.J.; Yang, K.; O’Neill, C.A. Pharmacokinetic and Pharmacodynamic Evaluation of Elosulfase Alfa, an Enzyme Replacement Therapy in Patients with Morquio A Syndrome. Clin. Pharmacokinet. 2014, 53, 1137–1147. [Google Scholar] [CrossRef] [Green Version]
- De Franceschi, L.; Roseti, L.; Desando, G.; Facchini, A.; Grigolo, B. A molecular and histological characterization of cartilage from patients with Morquio syndrome. Osteoarthr. Cartil. 2007, 15, 1311–1317. [Google Scholar] [CrossRef] [PubMed] [Green Version]
- Fujitsuka, H.; Sawamoto, K.; Peracha, H.; Mason, R.W.; Mackenzie, W.; Kobayashi, H.; Yamaguchi, S.; Suzuki, Y.; Orii, K.; Orii, T.; et al. Biomarkers in patients with mucopolysaccharidosis type II and IV. Mol. Genet. Metab. Rep. 2019, 19, 100455. [Google Scholar] [CrossRef] [PubMed]
- Tan, H.T.; Chung, M.C.M. Label-Free Quantitative Phosphoproteomics Reveals Regulation of Vasodilator-Stimulated Phosphoprotein upon Stathmin-1 Silencing in a Pair of Isogenic Colorectal Cancer Cell Lines. Proteomics 2018, 18, e1700242. [Google Scholar] [PubMed]
- Braccia, C.; Espinal, M.P.; Pini, M.; De Pietri Tonelli, D.; Armirotti, A. A new SWATH ion library for mouse adult hippocampal neural stem cells. Data Brief 2018, 18, 1–8. [Google Scholar] [CrossRef] [PubMed]
- Jayabalan, N.; Lai, A.; Nair, S.; Guanzon, D.; Scholz-Romero, K.; Palma, C.; McIntyre, H.D.; Lappas, M.; Salomon, C. Quantitative proteomics by SWATH-MS suggest an association between circulating exosomes and maternal metabolic changes in gestational diabetes mellitus. Proteomics 2019, 19, e1800164. [Google Scholar] [CrossRef] [Green Version]
- Jamwal, R.; Barlock, B.J.; Adusumalli, S.; Ogasawara, K.; Simons, B.L.; Akhlaghi, F. Multiplex and Label-Free Relative Quantification Approach for Studying Protein Abundance of Drug Metabolizing Enzymes in Human Liver Microsomes using SWATH-MS. J. Proteome Res. 2017, 16, 4134–4143. [Google Scholar] [CrossRef] [PubMed]
- Zhu, Y.; Zhu, J.; Lu, C.; Zhang, Q.; Xie, W.; Sun, P.; Dong, X.; Yue, L.; Sun, Y.; Yi, X.; et al. Identification of Protein Abundance Changes in Hepatocellular Carcinoma Tissues Using PCT–SWATH. Proteom. Clin. Appl. 2018, 1–13. [Google Scholar] [CrossRef] [PubMed] [Green Version]
- Li, H.; Mao, Y.; Xiong, Y.; Zhao, H.H.; Shen, F.; Gao, X.; Yang, P.; Liu, X.; Fu, D. A Comprehensive Proteome Analysis of Peripheral Blood Mononuclear Cells (PBMCs) to Identify Candidate Biomarkers of Pancreatic Cancer. Cancer Genom. Proteom. 2019, 16, 81–89. [Google Scholar] [CrossRef] [Green Version]
- Chang, R.Y.; Etheridge, N.; Nouwens, A.S.; Dodd, P.R. SWATH analysis of the synaptic proteome in Alzheimer’s disease. Neurochem. Int. 2015, 87, 1–12. [Google Scholar] [CrossRef] [PubMed]
- Gregorich, Z.R.; Ge, Y. Top-down proteomics in health and disease: Challenges and opportunities. Proteomics 2014, 14, 1195–1210. [Google Scholar] [CrossRef] [PubMed]
- Álvarez, J.V.; Bravo, S.B.; Chantada-Vazquez, M.P.; Colón, C.; De Castro, M.J.; Morales, M.; Vitoria, I.; Tomatsu, S.; Otero-Espinar, F.J.; Couce, M.L. Characterization of New Proteomic Biomarker Candidates in Mucopolysaccharidosis Type IVA. Int. J. Mol. Sci. 2020, 22, 226. [Google Scholar] [CrossRef]
- Martell, L.; Lau, K.; Mei, M.; Burnett, V.; Decker, C.; Foehr, E.D. Biomarker analysis of Morquio syndrome: Identification of disease state and drug responsive markers. Orphanet J. Rare Dis. 2011, 6, 84. [Google Scholar] [CrossRef] [PubMed] [Green Version]
- Zhang, A.; Sieglaff, D.H.; York, J.P.; Suh, J.H.; Ayers, S.D.; Winnier, G.E.; Kharitonenkov, A.; Pin, C.; Zhang, P.; Webb, P.; et al. Thyroid hormone receptor regulates most genes independently of fibroblast growth factor 21 in liver. J. Endocrinol. 2015, 224, 289–301. [Google Scholar] [CrossRef] [Green Version]
- Shimada, T.; Tomatsu, S.; Mason, R.W.; Yasuda, E.; Mackenzie, W.G.; Hossain, J.; Shibata, Y.; Montaño, A.M.; Kubaski, F.; Giugliani, R.; et al. Di-sulfated Keratan Sulfate as a Novel Biomarker for Mucopolysaccharidosis II, IVA, and IVB. JIMD Rep. 2015, 21, 1–13. [Google Scholar]
- Chin, S.J.; Saville, J.T.; McDermott, B.K.; Zankl, A.; Fletcher, J.M.; Fuller, M. Chondroitin sulfate disaccharide is a specific and sensitive biomarker for mucopolysaccharidosis type IVA. JIMD Rep. 2020, 55, 68–74. [Google Scholar] [CrossRef]
- Álvarez, J.V.; Bravo, S.B.; García-Vence, M.; De Castro, M.J.; Luzardo, A.; Colón, C.; Tomatsu, S.; Otero-Espinar, F.J.; Couce, M.L. Proteomic Analysis in Morquio A Cells Treated with Immobilized Enzymatic Replacement Therapy on Nanostructured Lipid Systems. Int. J. Mol. Sci. 2019, 20, 4610. [Google Scholar] [CrossRef] [PubMed] [Green Version]
- Algahim, M.F.; Almassi, G.H. Current and emerging management options for patients with Morquio A syndrome. Ther. Clin. Risk Manag. 2013, 9, 45–53. [Google Scholar]
- Eliyahu, E.; Wolfson, T.; Ge, Y.; Jepsen, K.J.; Schuchman, E.H.; Simonaro, C.M. Anti-TNF-Alpha Therapy Enhances the Effects of Enzyme Replacement Therapy in Rats with Mucopolysaccharidosis Type VI. PLoS ONE 2011, 6, e22447. [Google Scholar] [CrossRef] [PubMed] [Green Version]
- Barallobre-Barreiro, J.; Oklu, R.; Lynch, M.; Fava, M.; Baig, F.; Yin, X.; Barwari, T.; Potier, D.N.; Albadawi, H.; Jahangiri, M.; et al. Extracellular matrix remodelling in response to venous hypertension: Proteomics of human varicose veins. Cardiovasc. Res. 2016, 110, 419–430. [Google Scholar] [CrossRef]
- De Boer, H.C.; Preissner, K.T.; Bouma, B.N.; de Groot, P.G. Binding of vitronectin-thrombin-antithrombin III complex to human endothelial cells is mediated by the heparin binding site of vitronectin. J. Biol. Chem. 1992, 267, 2264–2268. [Google Scholar] [CrossRef]
- Gangneux, C.; Daveau, M.; Hiron, M.; Derambure, C.; Papaconstantinou, J.; Salier, J.P. The inflammation-induced down-regulation of plasma Fetuin-A (alpha2HS-Glycoprotein) in liver results from the loss of interaction between long C/EBP isoforms at two neighbouring binding sites. Nucleic Acids Res. 2003, 31, 5957–5970. [Google Scholar] [CrossRef] [Green Version]
- Brylka, L.; Jahnen-Dechent, W. The role of fetuin-A in physiological and pathological mineralization. Calcif. Tissue Int. 2013, 93, 355–364. [Google Scholar] [CrossRef] [PubMed]
- Jahnen-Dechent, W.; Heiss, A.; Schäfer, C.; Ketteler, M. Fetuin-A regulation of calcified matrix metabolism. Circ. Res. 2011, 108, 1494–1509. [Google Scholar] [CrossRef] [PubMed]
- Wang, H.; Sama, A.E. Anti-inflammatory role of Fetuin-A in Injury and Infection. Curr. Mol. Med. 2012, 12, 625. [Google Scholar] [CrossRef] [Green Version]
- Procopio, N.; Chamberlain, A.T.; Buckley, M. Intra- and Interskeletal Proteome Variations in Fresh and Buried Bones. J. Proteome Res. 2017, 16, 2016–2029. [Google Scholar] [CrossRef]
- Liao, F.; Lusis, A.J.; Berliner, J.A.; Fogelman, A.M.; Kindy, M.; de Beer, M.C.; de Beer, F.C. Serum amyloid A protein family. Differential induction by oxidized lipids in mouse strains. Arterioscler. Thromb. J. Vasc. Biol. 1994, 14, 1475–1479. [Google Scholar] [CrossRef] [PubMed] [Green Version]
- Badolato, R.; Johnston, J.A.; Wang, J.M.; McVicar, D.; Xu, L.L.; Oppenheim, J.J.; Kelvin, D.J. Serum amyloid A induces calcium mobilization and chemotaxis of human monocytes by activating a pertussis toxin-sensitive signaling pathway. J. Immunol. 1995, 155, 4004–4010. [Google Scholar] [PubMed]
- Artl, A.; Marsche, G.; Lestavel, S.; Sattler, W.; Malle, E. Role of serum amyloid A during metabolism of acute-phase HDL by macrophages. Arterioscler. Thromb. Vasc. Biol. 2000, 20, 763–772. [Google Scholar] [CrossRef] [PubMed] [Green Version]
- Baranova, I.N.; Vishnyakova, T.G.; Bocharov, A.V.; Kurlander, R.; Chen, Z.; Kimelman, M.L.; Remaley, A.T.; Csako, G.; Thomas, F.; Eggerman, T.L. Serum amyloid A binding to CLA-1 (CD36 and LIMPII analogous-1) mediates serum amyloid A protein-induced activation of ERK1/2 and p38 mitogen-activated protein kinases. J. Biol. Chem. 2005, 280, 8031–8040. [Google Scholar] [CrossRef] [PubMed] [Green Version]
- Sack, G.H. Serum amyloid—A review. Mol. Med. 2018, 24, 46. [Google Scholar] [CrossRef]
- Hatfield, J.T.; Anderson, P.J.; Powell, B.C. Retinol-binding protein 4 is expressed in chondrocytes of developing mouse long bones: Implications for a local role in formation of the secondary ossification center. Histochem. Cell Biol. 2013, 139, 727–734. [Google Scholar] [CrossRef] [PubMed]
- Abdallah, B.M.; Alzahrani, A.M.; Kassem, M. Secreted Clusterin protein inhibits osteoblast differentiation of bone marrow mesenchymal stem cells by suppressing ERK1/2 signaling pathway. Bone 2018, 110, 221–229. [Google Scholar] [CrossRef] [PubMed]
- Poon, S.; Easterbrook-Smith, S.B.; Rybchyn, M.S.; Carver, J.A.; Wilson, M.R. Clusterin is an ATP-independent chaperone with very broad substrate specificity that stabilizes stressed proteins in a folding-competent state. Biochemistry 2000, 39, 15953–15960. [Google Scholar] [CrossRef] [PubMed]
- Poon, S.; Rybchyn, M.S.; Easterbrook-Smith, S.B.; Carver, J.A.; Pankhurst, G.J.; Wilson, M.R. Mildly Acidic pH Activates the Extracellular Molecular Chaperone Clusterin. J. Biol. Chem. 2002, 277, 39532–39540. [Google Scholar] [CrossRef] [PubMed] [Green Version]
- Stewart, E.M.; Aquilina, J.A.; Easterbrook-Smith, S.B.; Murphy-Durland, D.; Jacobsen, C.; Moestrup, S.; Wilson, M.R. Effects of Glycosylation on the Structure and Function of the Extracellular Chaperone Clusterin. Biochemistry 2007, 46, 1412–1422. [Google Scholar] [CrossRef]
- Wyatt, A.R.; Wilson, M.R. Identification of Human Plasma Proteins as Major Clients for the Extracellular Chaperone Clusterin. J. Biol. Chem. 2010, 285, 3532–3539. [Google Scholar] [CrossRef] [PubMed] [Green Version]
- Camelier, M.V.; Burin, M.G.; De Mari, J.; Vieira, T.A.; Marasca, G.; Giugliani, R. Practical and reliable enzyme test for the detection of mucopolysaccharidosis IVA (Morquio Syndrome type A) in dried blood samples. Clin. Chim. Acta 2011, 412, 1805–1808. [Google Scholar] [CrossRef] [Green Version]
- Del PilarChantada-Vázquez, M.; López, A.C.; Vence, M.G.; Vázquez-Estévez, S.; Acea-Nebril, B.; Calatayud, D.G.; Jardiel, T.; Bravo, S.B.; Núñez, C. Proteomic investigation on bio-corona of Au, Ag and Fe nanoparticles for the discovery of triple negative breast cancer serum protein biomarkers. J. Proteom. 2020, 212, 103581. [Google Scholar] [CrossRef] [PubMed]


| Group Comparison | Proteins with Altered Expression* | Upregulated Proteins | Downregulated Proteins |
|---|---|---|---|
| UG vs CG | 14 | 12 | 2 |
| ERT-a vs CG | 8 | 5(2 only in ERT-a) | 1 |
| ERT-b vs CG | 14 | 10(2 only in ERT-b) | 1 |
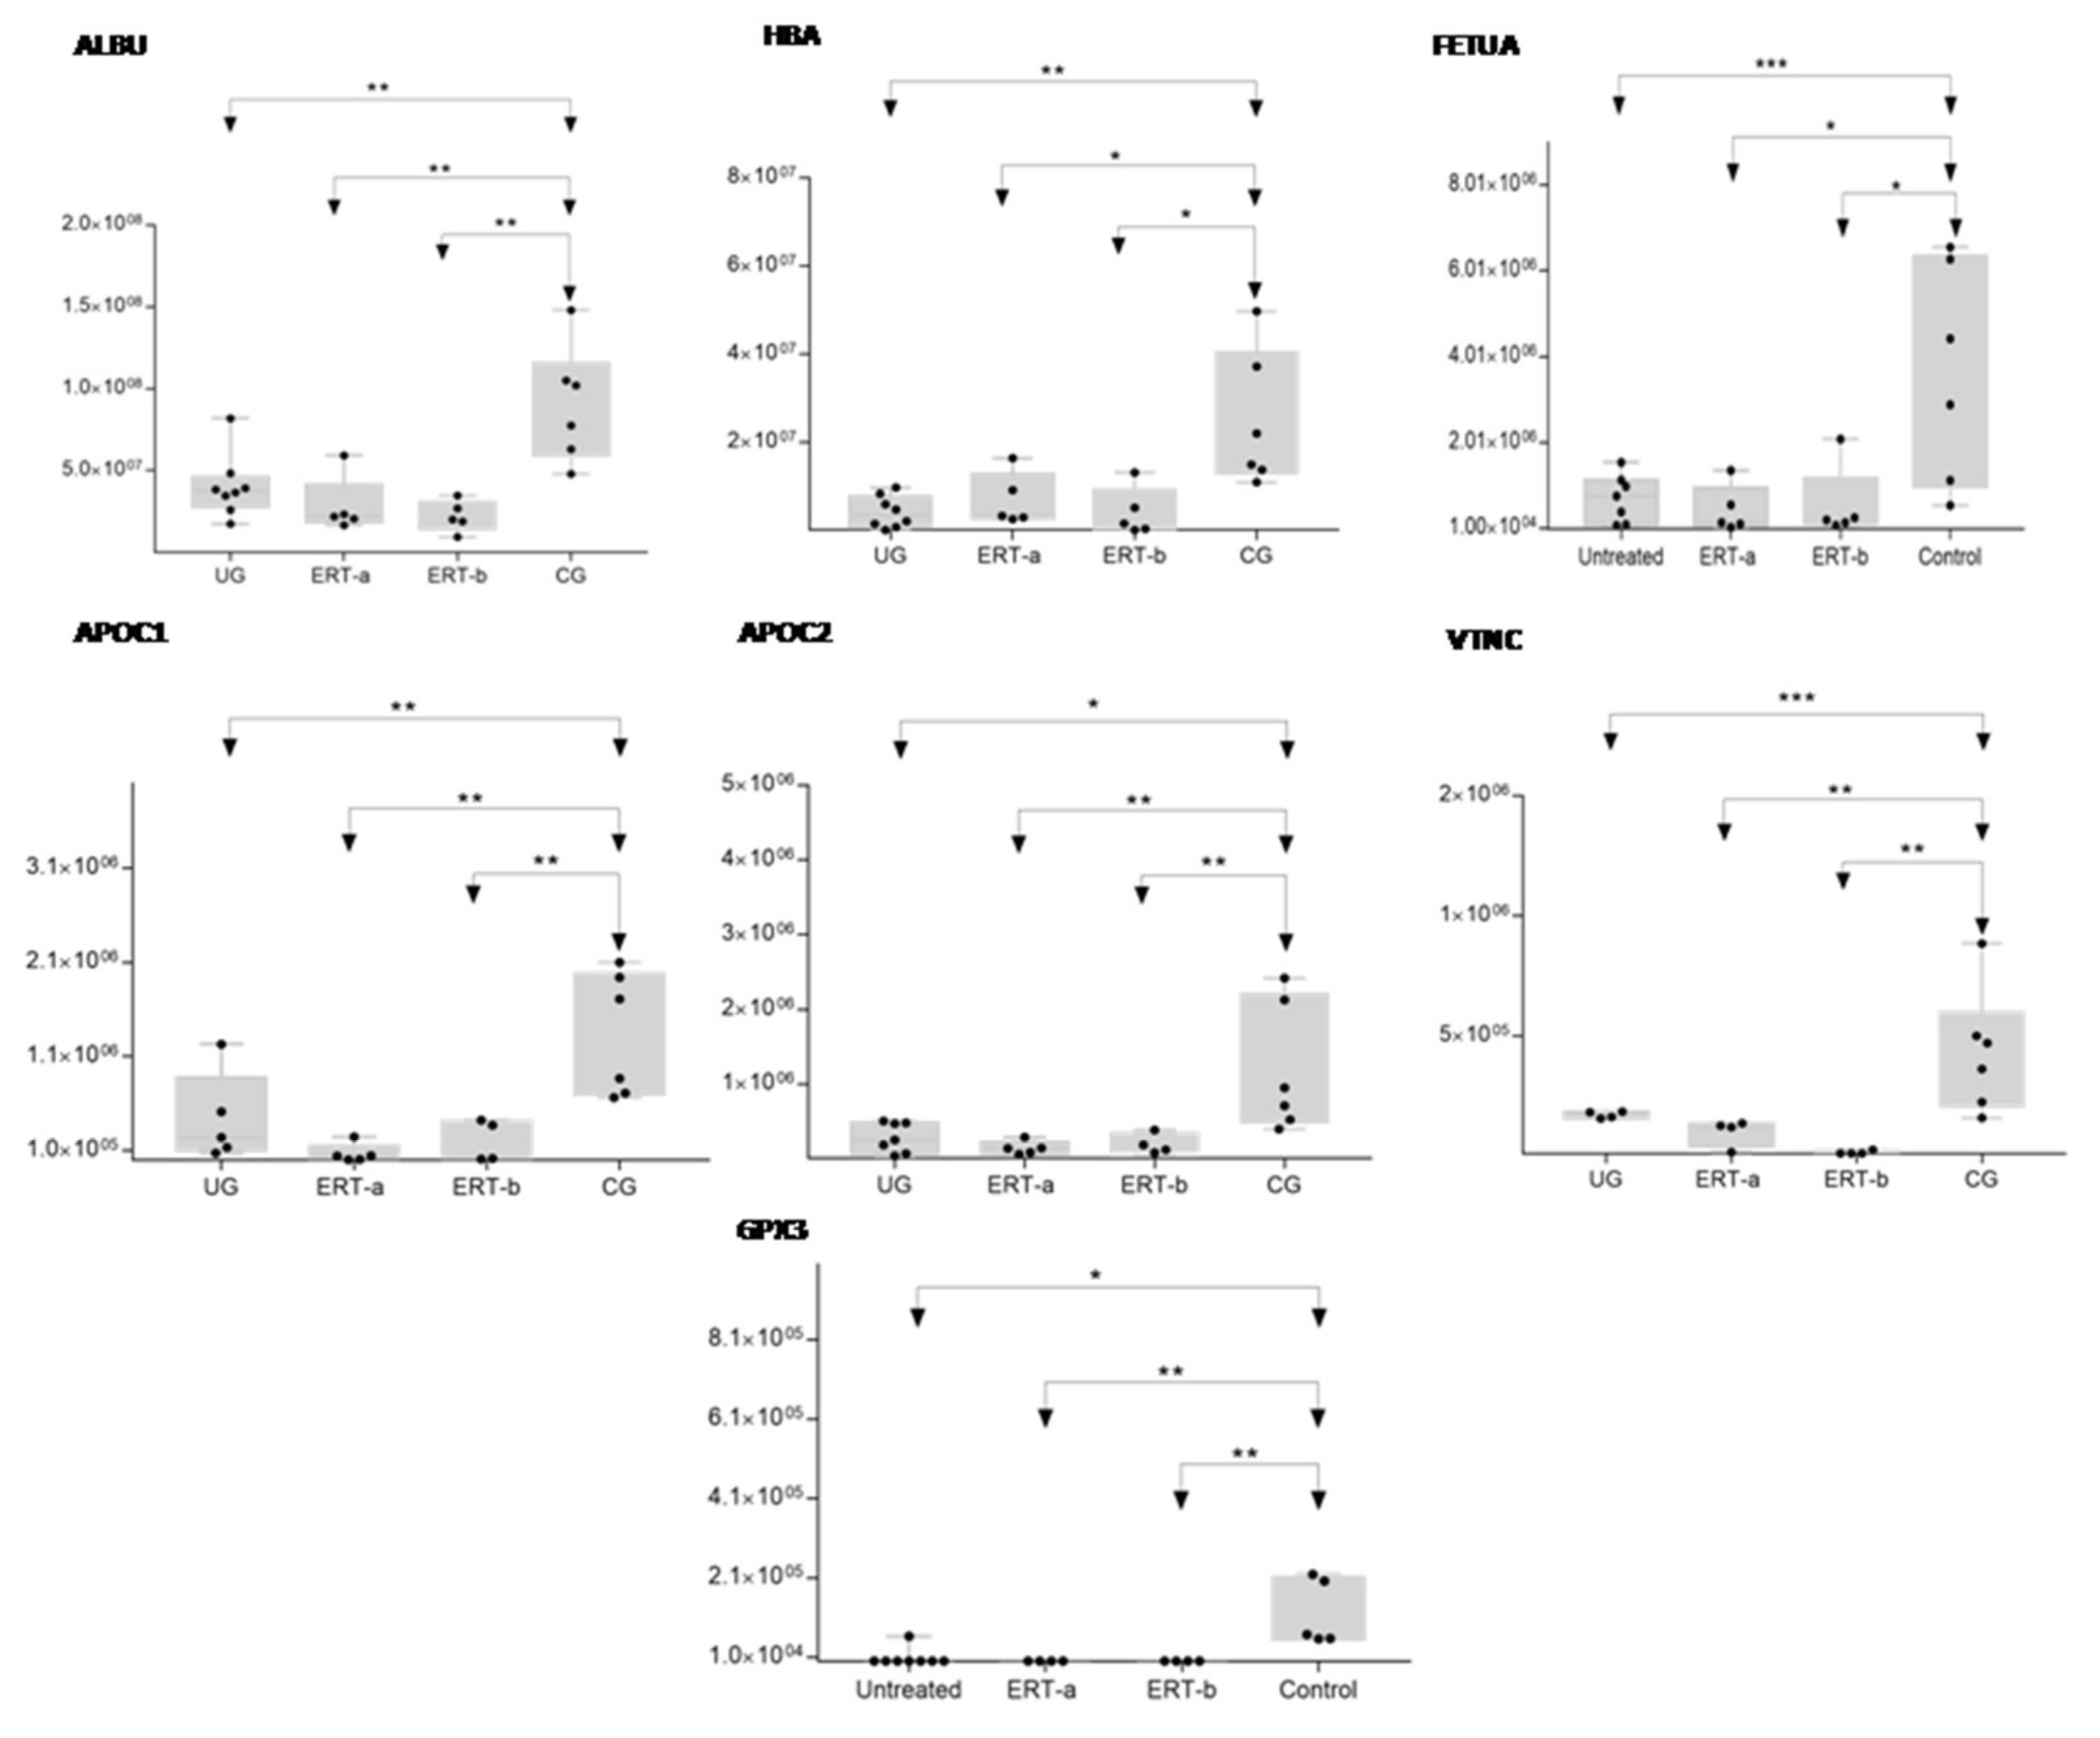
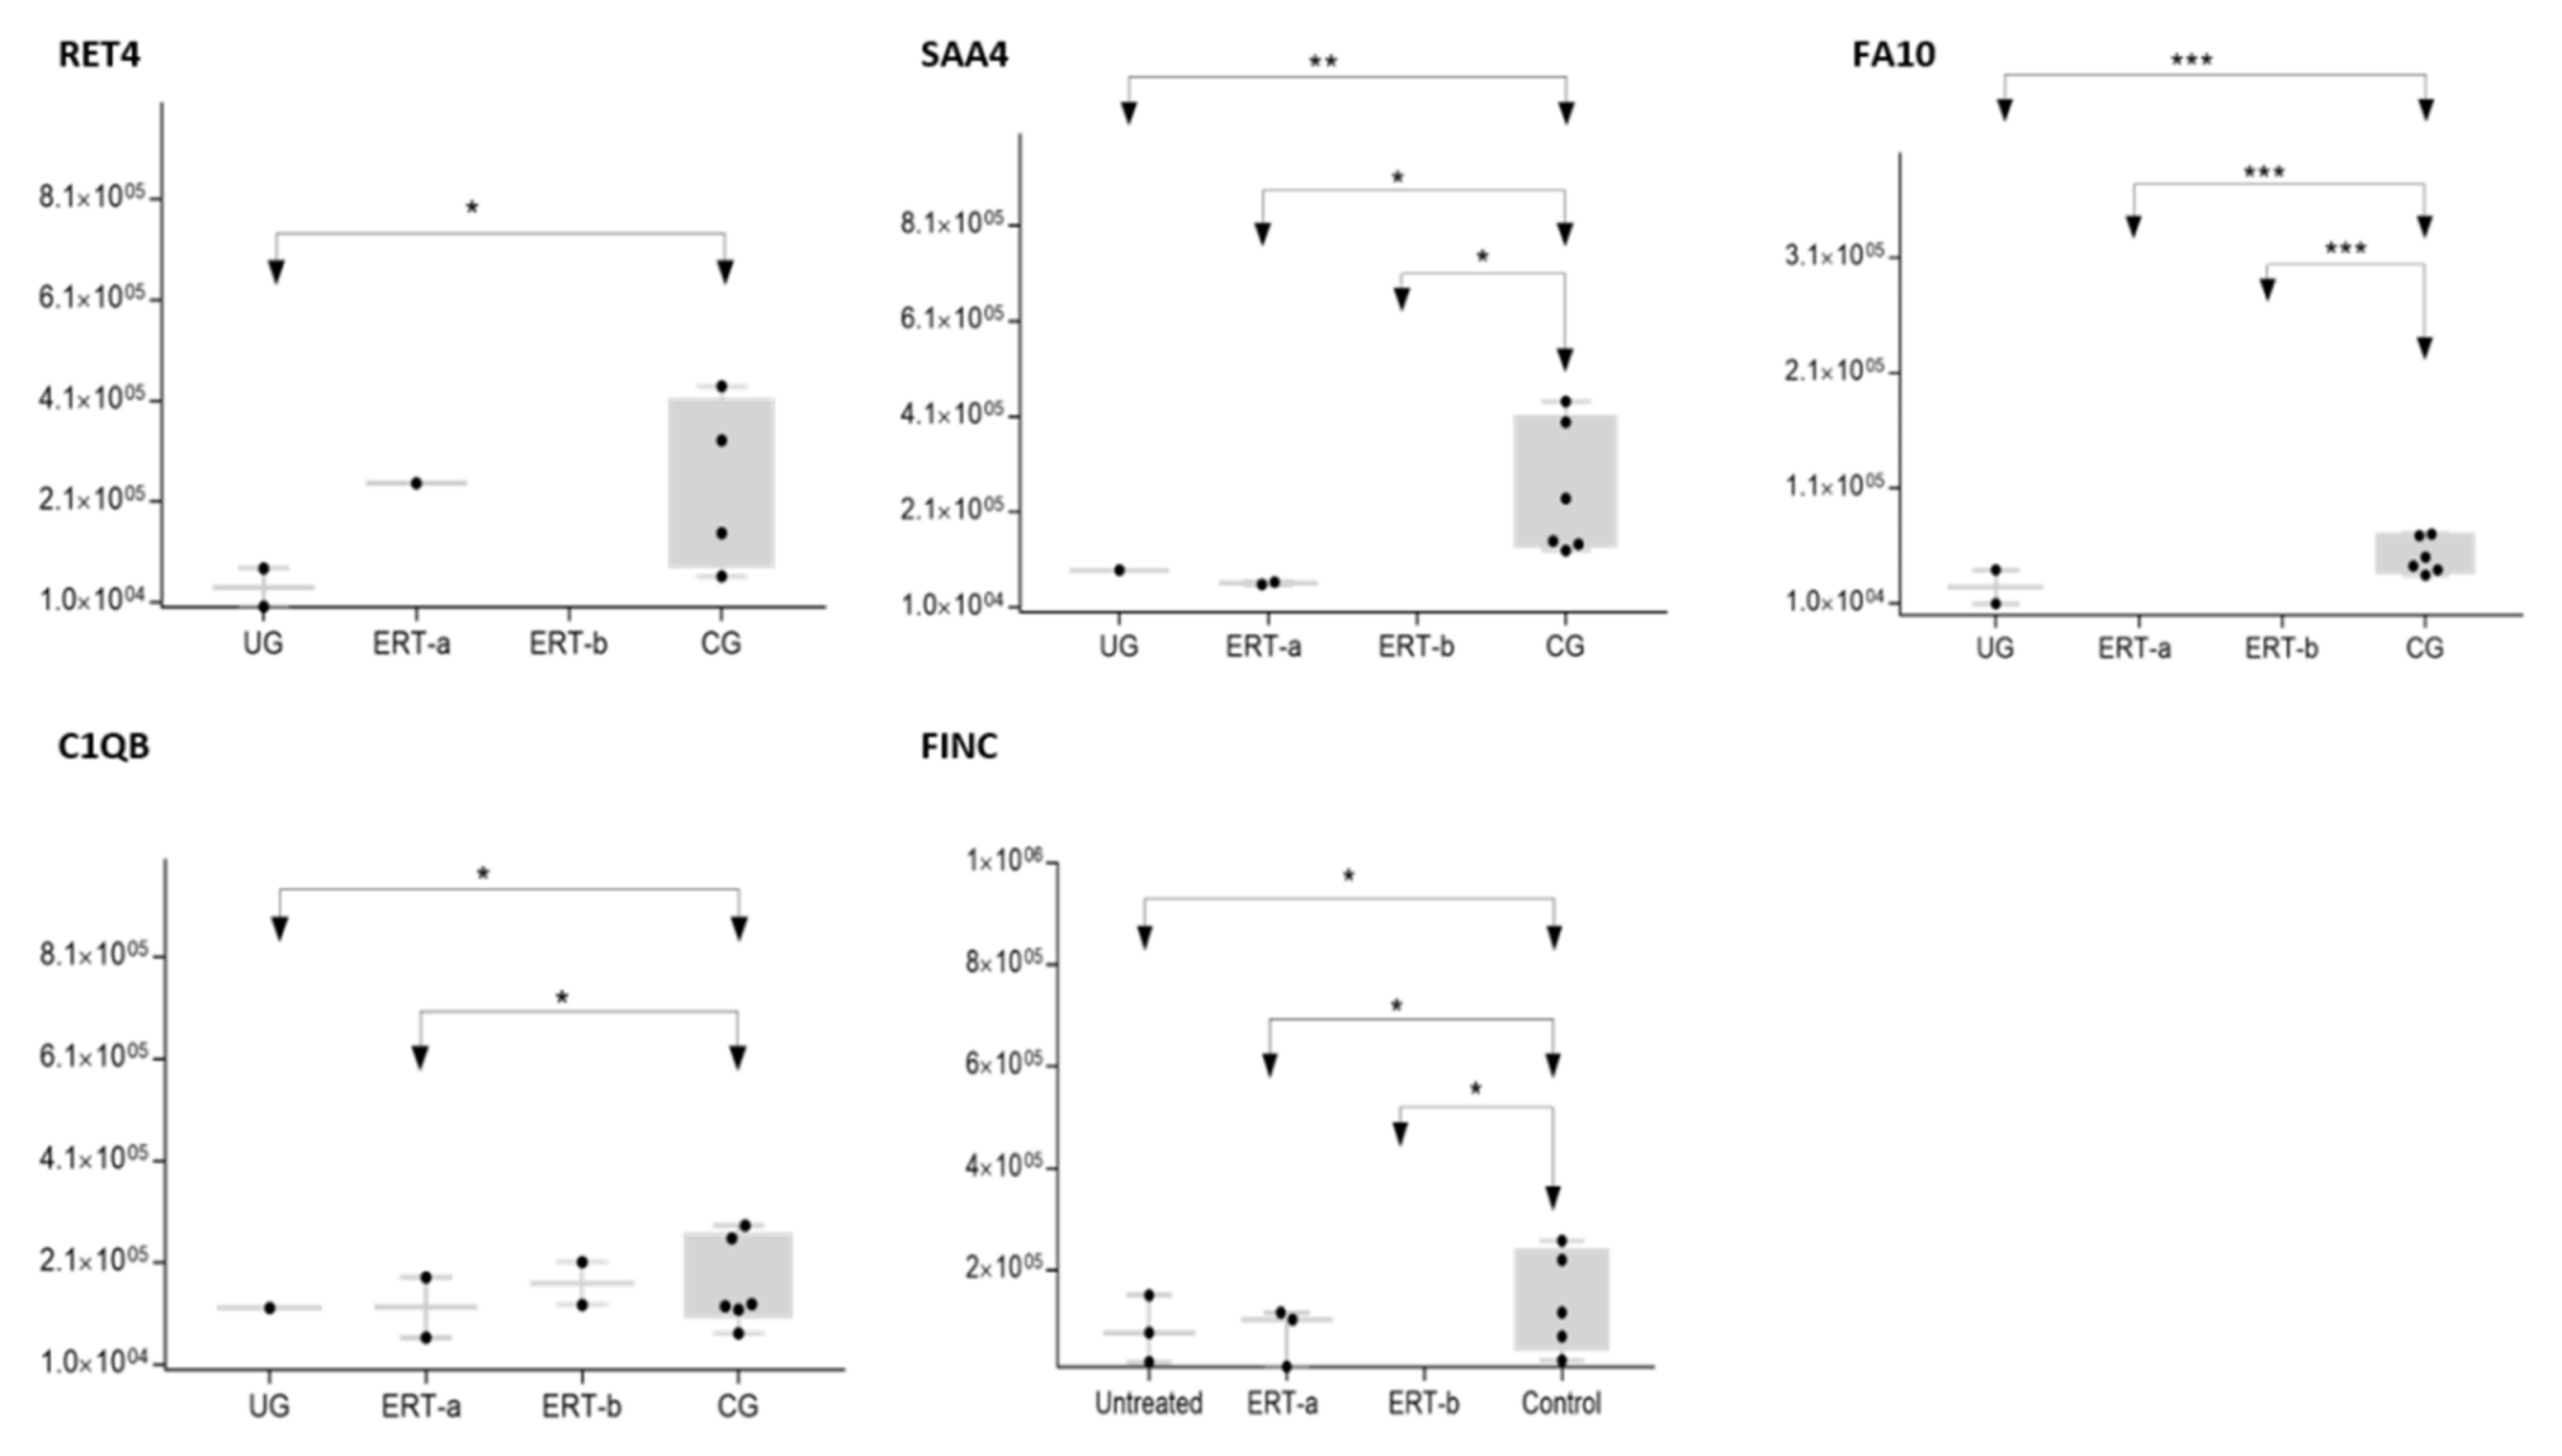
| Uniprot Code | Protein Code | Protein Name | p-Value | Fold Change |
|---|---|---|---|---|
| Downregulated in UG, ERT-a, and ERT-b | ||||
| P01860 | IGHG3 | Immunoglobulin heavy constant gamma 3 | 3.30 × 10⁻⁵ | Only CG |
| P02741 | CRP | C-reactive protein | 8.93 × 10⁻³ | Only CG |
| P02760 | AMBP | Protein AMBP | 7.75 × 10⁻⁵ | 0.0008 |
| Q92485 | ASM3B | Acid sphingomyelinase-like phosphodiesterase 3b | 4.80 × 10⁻⁶ | 0.0021 |
| P01599 | KV117 | Immunoglobulin kappa variable 1–17 | 6.69 × 10⁻⁴ | 0.0027 |
| Q9P1Z0 | ZBTB4 | Zinc finger and BTB domain-containing protein 4 | 2.81 × 10⁻⁷ | 0.0086 |
| P01780 | HV307 | Immunoglobulin heavy variable 3–7 | 8.23 × 10⁻⁶ | 0.0333 |
| P22352 | GPX3 | Glutathione peroxidase 3 | 1.31 × 10⁻⁴ | 0.0349 |
| P35542 | SAA4 | Serum amyloid A-4 protein | 8.01 × 10⁻⁵ | 0.0368 |
| P01766 | HV313 | Immunoglobulin heavy variable 3–13 | 4.50 × 10⁻² | 0.0402 |
| P04004 | VTNC | Vitronectin | 1.00 × 10⁻⁶ | 0.0417 |
| P00742 | FA10 | Coagulation factor X | 4.71 × 10⁻⁹ | 0.0535 |
| P02042 | HBD | Hemoglobin subunit delta | 2.79 × 10⁻⁵ | 0.0565 |
| A0A075B6J9 | LV218 | Immunoglobulin lambda variable 2–18 | 8.30 × 10⁻⁴ | 0.0588 |
| P02753 | RET4 | Retinol-binding protein 4 | 6.31 × 10⁻³ | 0.1103 |
| P06312 | KV401 | Immunoglobulin kappa variable 4–1 | 2.12 × 10⁻⁶ | 0.1292 |
| P02654 | APOC1 | Apolipoprotein C-I | 7.01 × 10⁻⁶ | 0.1515 |
| P02765 | FETUA | Alpha-2-HS-glycoprotein | 6.60 × 10⁻⁵ | 0.1527 |
| P69905 | HBA | Hemoglobin subunit alpha | 1.86 × 10⁻⁵ | 0.1585 |
| P02655 | APOC2 | Apolipoprotein C-II | 8.27 × 10⁻⁵ | 0.1642 |
| P00915 | CAH1 | Carbonicanhydrase 1 | 1.37 × 10⁻² | 0.1984 |
| P02751 | FINC | Fibronectin | 9.79 × 10⁻³ | 0.2304 |
| A0A0B4J1Y8 | LV949 | Immunoglobulin lambda variable 9–49 | 6.70 × 10⁻³ | 0.2353 |
| P02746 | C1QB | Complement C1q subcomponent subunit B | 1.68 × 10⁻³ | 0.2381 |
| P00738 | HPT | Haptoglobin | 3.00 × 10⁻³ | 0.2445 |
| P01857 | IGHG1 | Immunoglobulin heavy constant gamma 1 | 2.37 × 10⁻² | 0.2519 |
| P01834 | IGKC | Immunoglobulin kappa constant | 4.67 × 10⁻⁴ | 0.2591 |
| P68871 | HBB | Hemoglobin subunit beta | 1.01 × 10⁻³ | 0.2681 |
| P01859 | IGHG2 | Immunoglobulin heavy constant gamma 2 | 3.60 × 10⁻⁴ | 0.2959 |
| P29622 | KAIN | Kallistatin | 1.99 × 10⁻³ | 0.3344 |
| P02743 | SAMP | Serum amyloid P-component | 1.91 × 10⁻² | 0.3509 |
| P02768 | ALBU | Serum albumin | 1.92 × 10⁻⁵ | 0.3509 |
| P02787 | TRFE | Serotransferrin | 4.11 × 10⁻² | 0.3571 |
| P02749 | APOH | Beta-2-glycoprotein 1 | 1.26 × 10⁻² | 0.3584 |
| P02679 | FIBG | Fibrinogen gamma chain | 5.71 × 10⁻³ | 0.3597 |
| P02763 | A1AG1 | Alpha-1-acid glycoprotein 1 | 2.43 × 10⁻² | 0.4115 |
| P05543 | THBG | Thyroxine-binding globulin | 4.82 × 10⁻⁴ | 0.4348 |
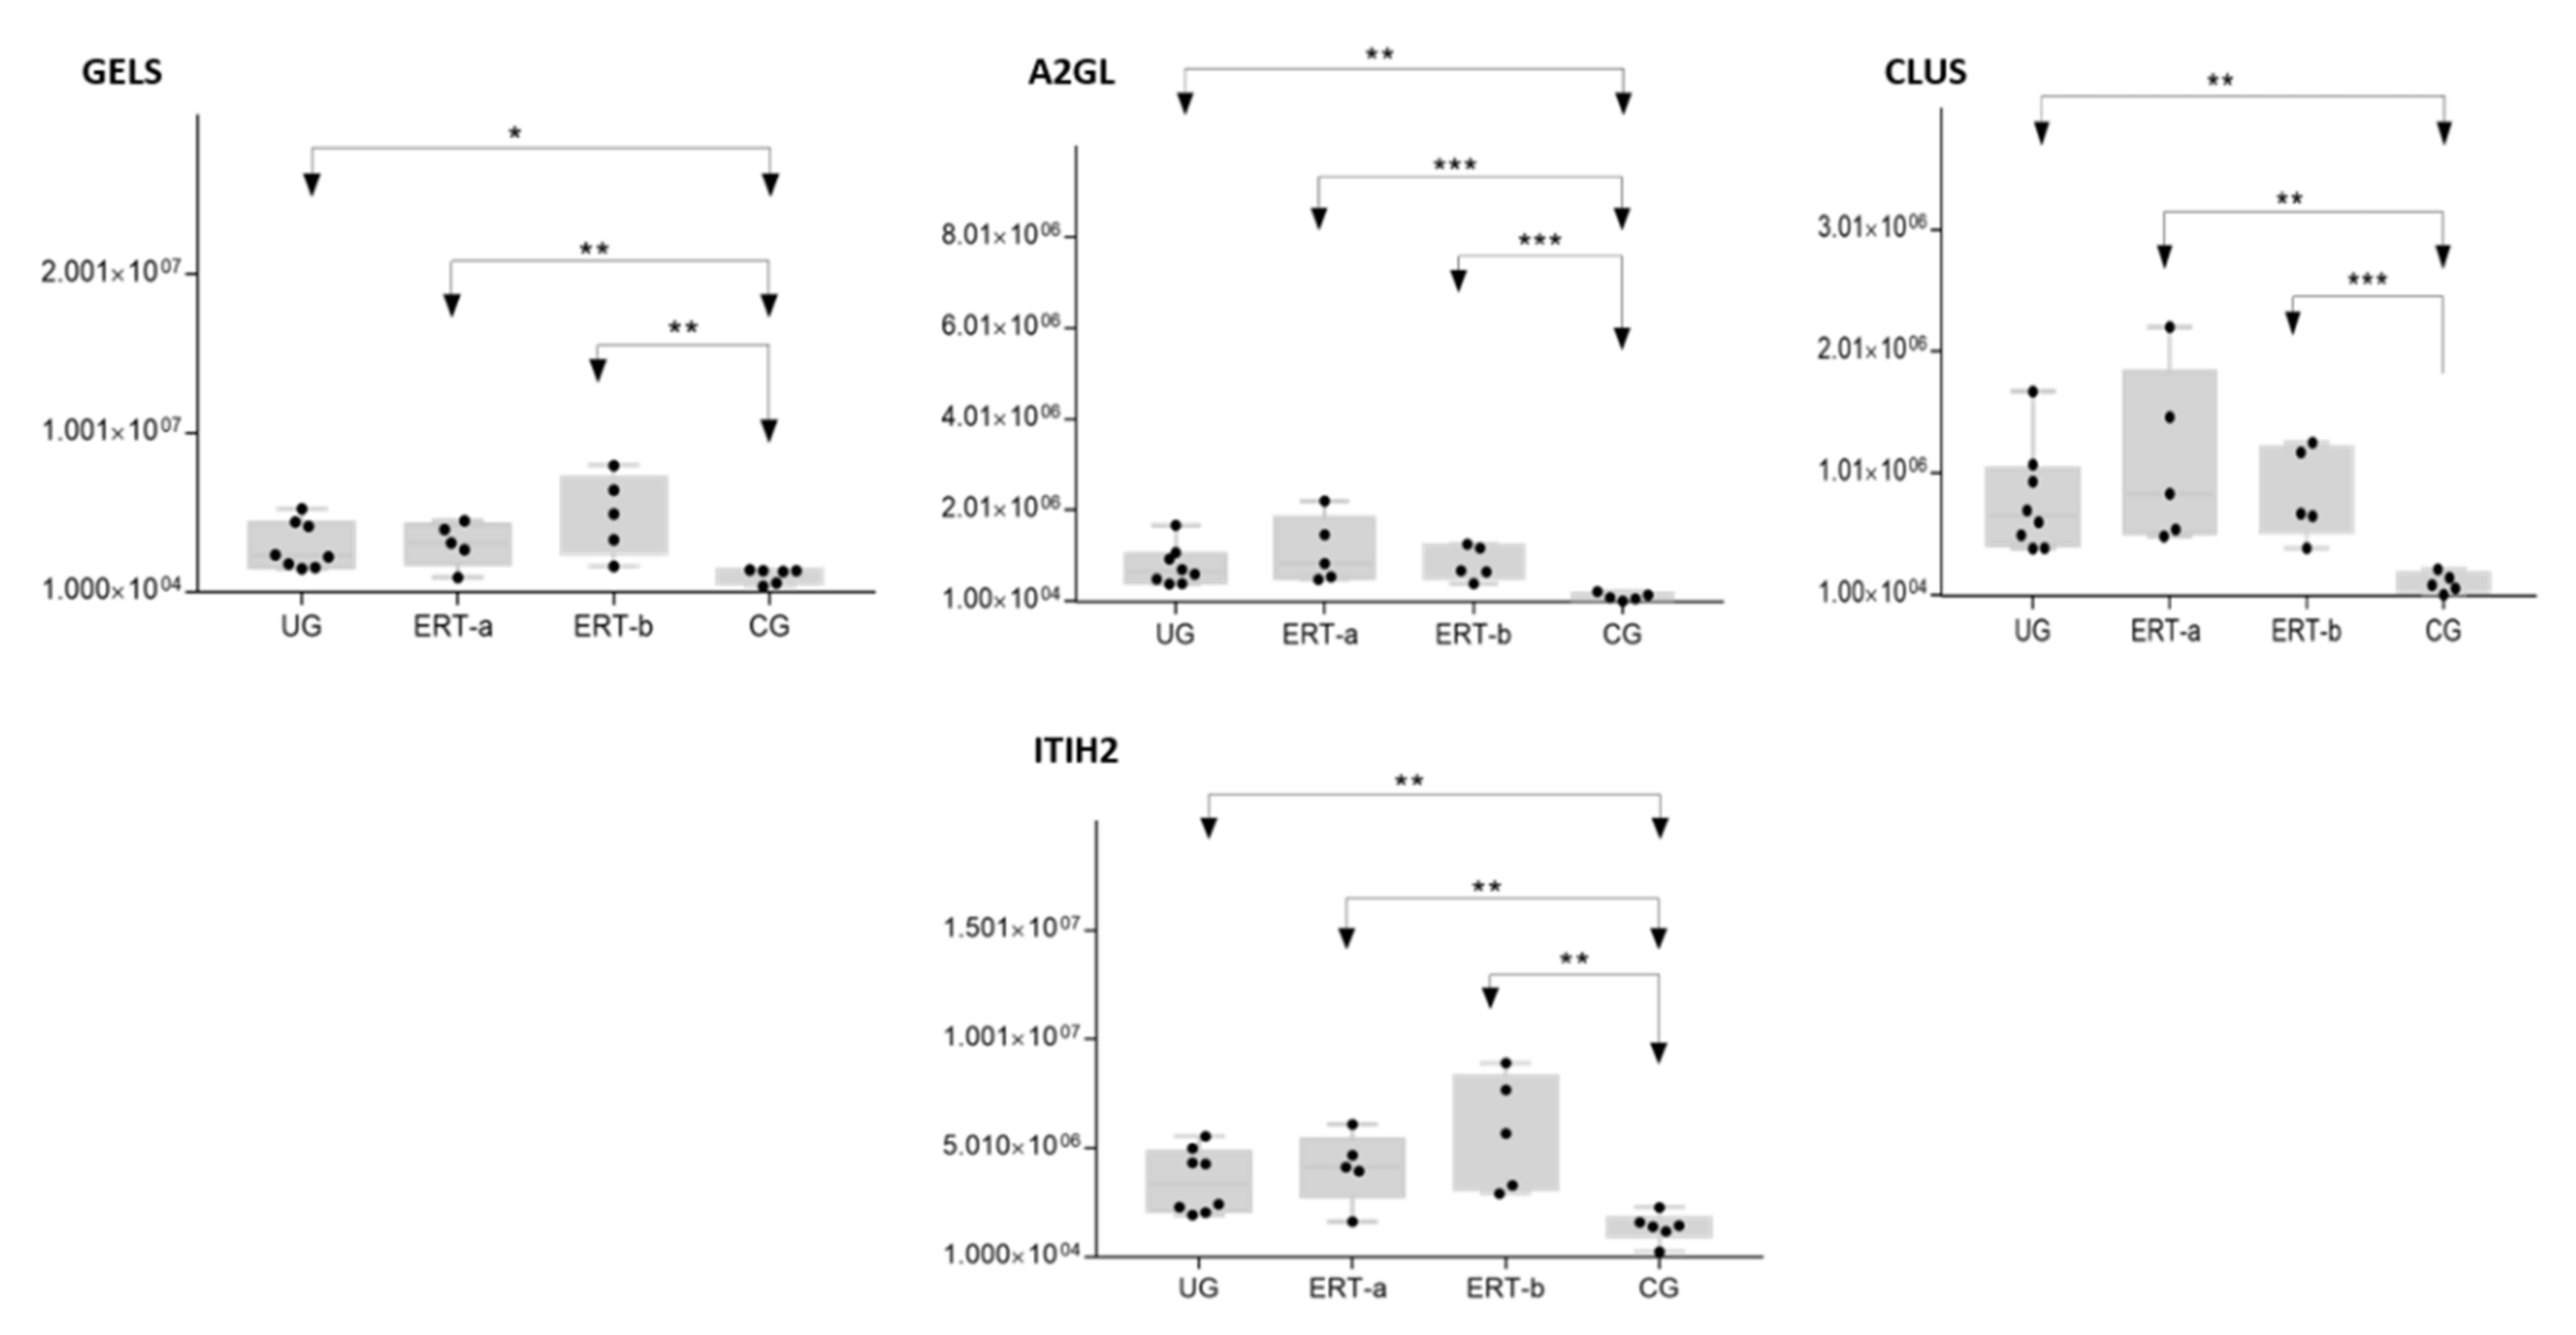
| Upregulated in UG, ERT-a, and ERT-b | ||||
| P01619 | KV320 | Immunoglobulin kappa variable 3–20 | 0.0005 | Not found CG |
| P80748 | LV321 | Immunoglobulin lambda variable 3-21 | 0.0179 | Not found CG |
| B9A064 | IGLL5 | Immunoglobulin lambda-like polypeptide 5 | 0.0002 | 44.0529 |
| P01615 | KVD28 | Immunoglobulin kappa variable 2D–28 | 0.0474 | 27.4725 |
| P0DOY2 | IGLC2 | Immunoglobulin lambda constant 2 | 0.0217 | 26.1780 |
| P35858 | ALS | Insulin-like growth factor-binding protein complex acid labile subunit | 0.0299 | 10.8460 |
| P10909 | CLUS | Clusterin | 0.0010 | 10.1523 |
| P02750 | A2GL | Leucine-rich alpha-2-glycoprotein | 0.0004 | 9.9800 |
| P01023 | A2MG | Alpha-2-macroglobulin | 0.0000 | 4.7170 |
| P00734 | THRB | Prothrombin | 0.0132 | 4.3178 |
| P06396 | GELS | Gelsolin | 0.0057 | 3.3223 |
| P19823 | ITIH2 | Inter-alpha-trypsin inhibitor heavy chain H2 | 0.0023 | 3.1536 |
| Q96IY4 | CBPB2 | Carboxypeptidase B2 | 0.0121 | 2.8977 |
| Q08380 | LG3BP | Galectin-3-binding protein | 0.0361 | 2.5880 |
| P08185 | CBG | Corticosteroid-binding globulin | 0.0325 | 2.2763 |
| A0A0A0MS15 | HV349 | Immunoglobulin heavy variable 3–49 | 0.0482 | 2.1418 |
| A0A0C4DH38 | HV551 | Immunoglobulin heavy variable 5–51 | 0.0165 | 2.1345 |
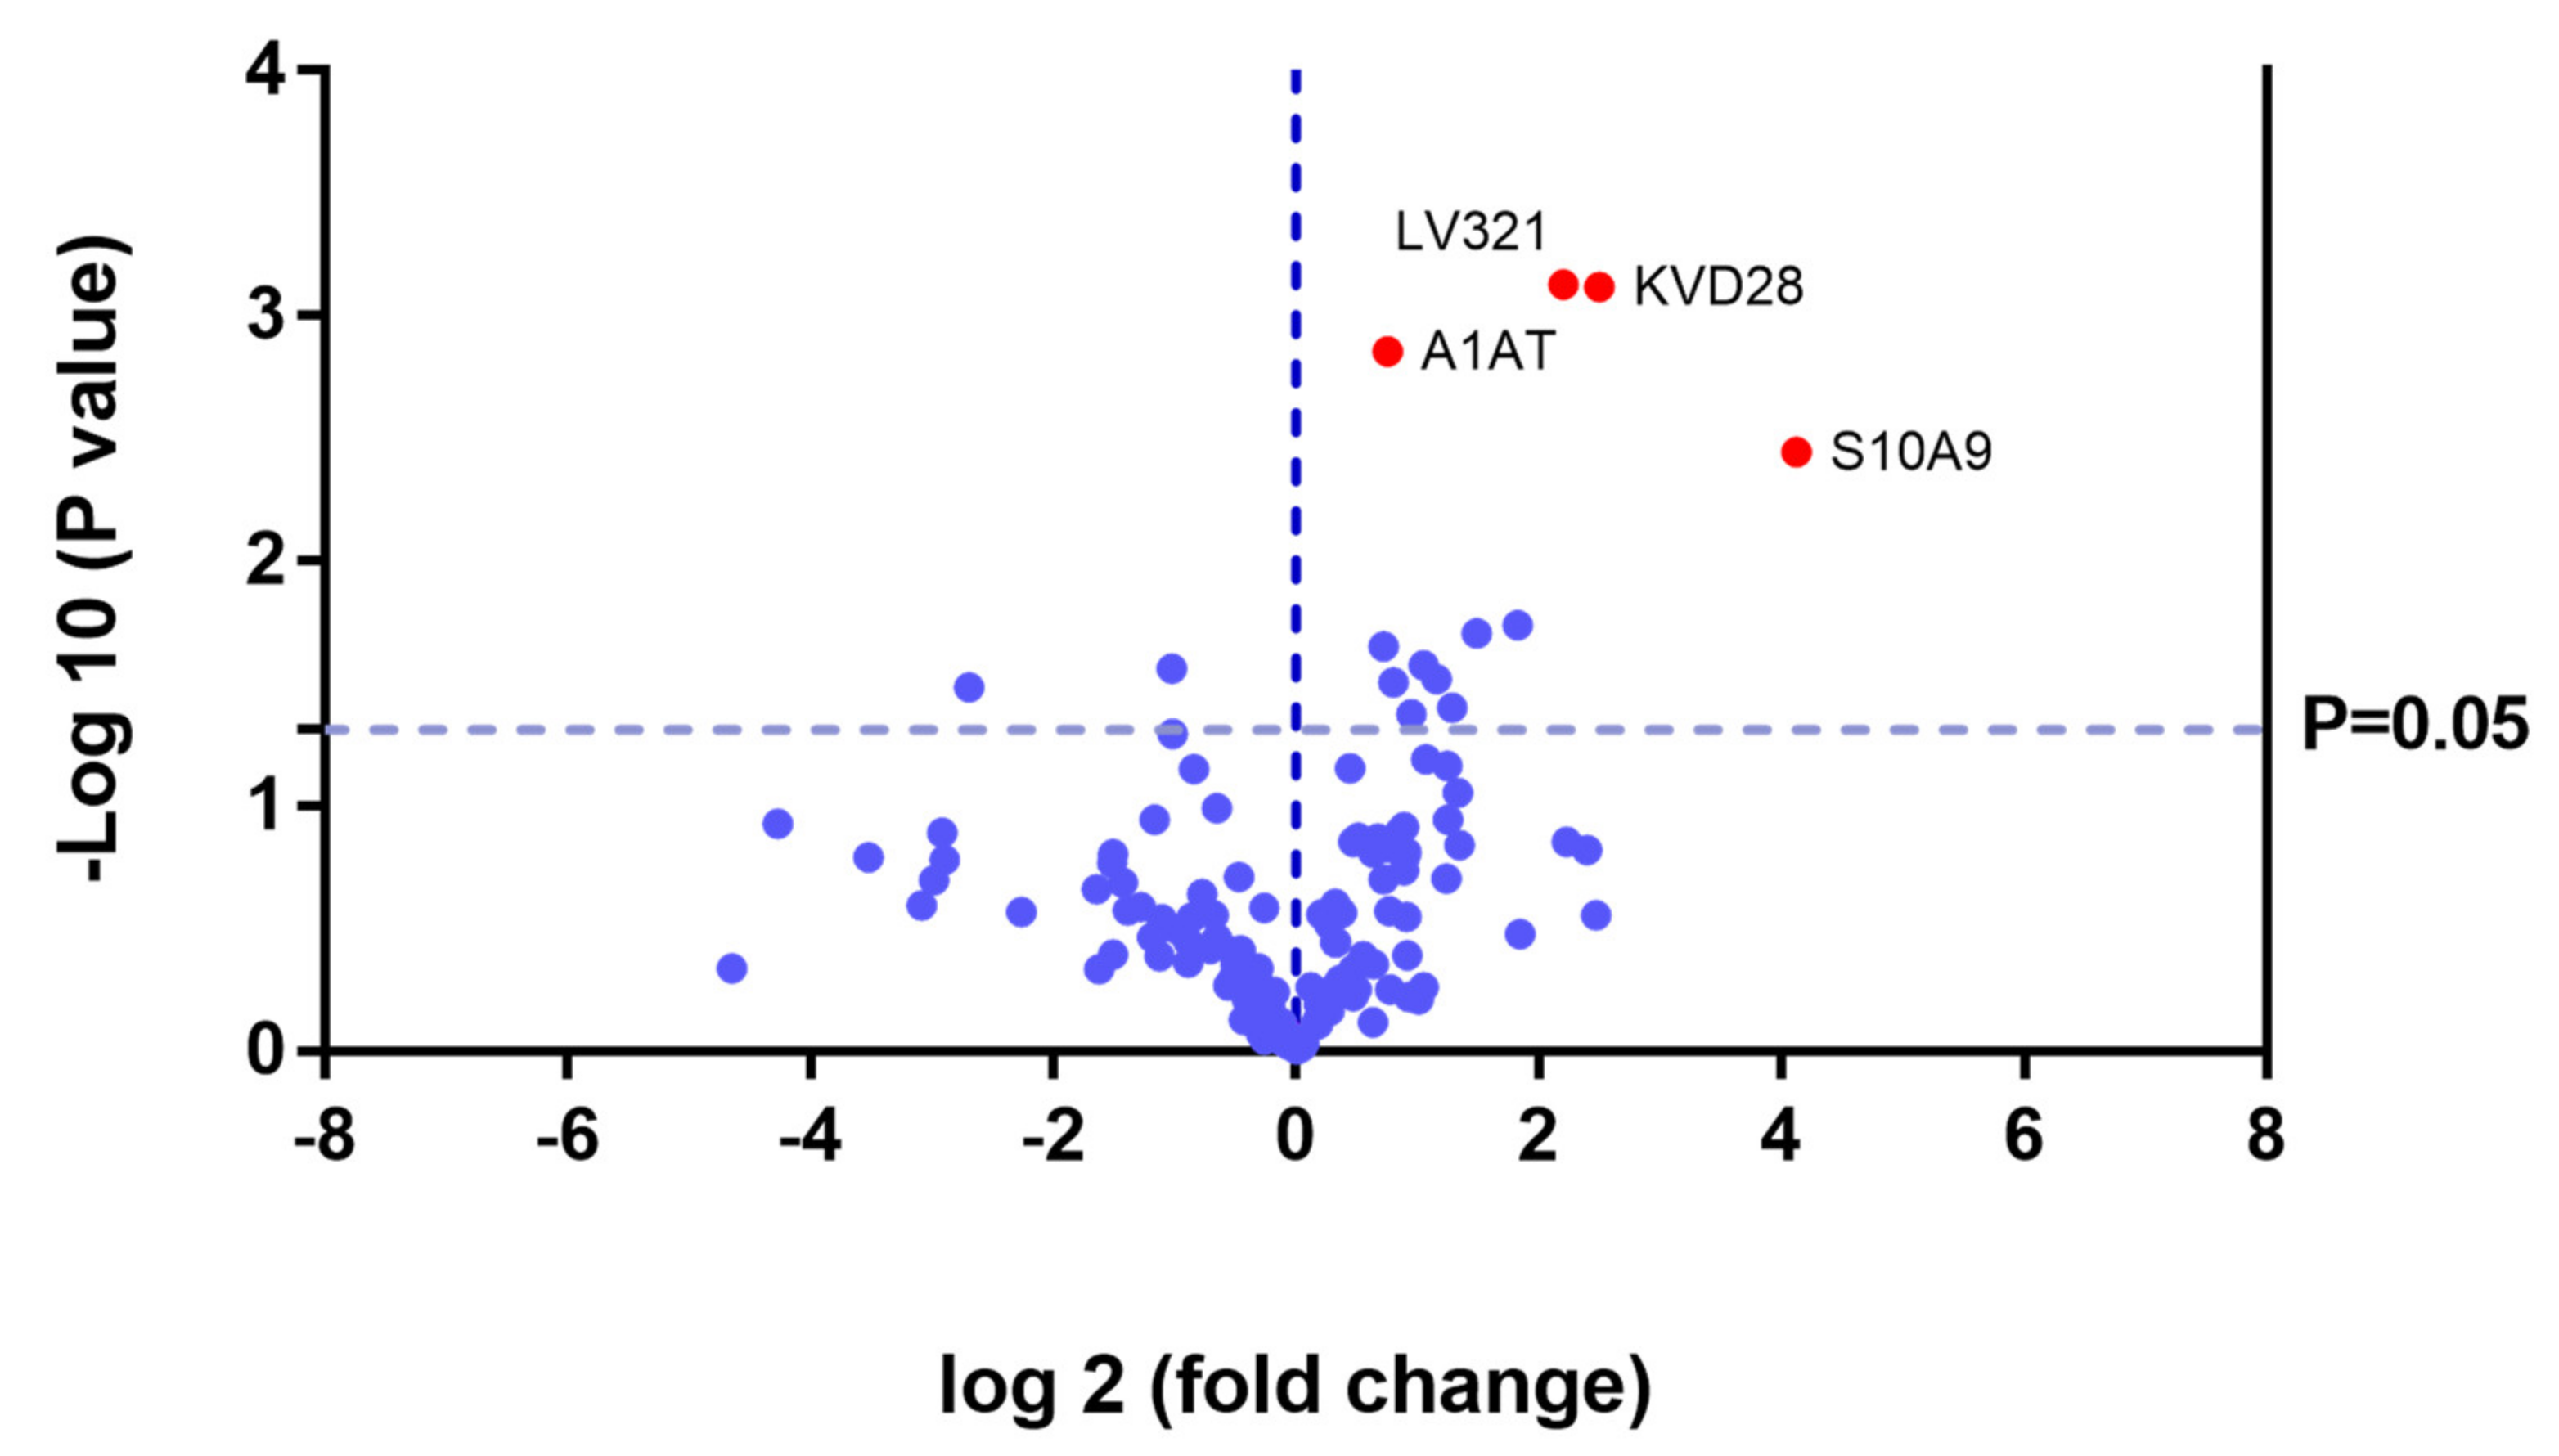
| Uniprot Code | Protein Code | Protein Name | p-Value | Fold Change |
|---|---|---|---|---|
| Upregulated in Untreated Group | ||||
| P06702 | S10A9 | Protein S100-A9 | 0.0036 | 17.4468 |
| P01615 | KVD28 | Immunoglobulin kappa variable 2D-28 | 0.0008 | 5.6619 |
| P80748 | LV321 | Immunoglobulin lambda variable 3-21 | 0.0007 | 4.6098 |
| P01594 | KV133 | Immunoglobulin kappa variable 1-33 | 0.0182 | 3.5490 |
| P02652 | APOA2 | Apolipoprotein A-II | 0.0197 | 2.8151 |
| P01591 | IGJ | Immunoglobulin J chain | 0.0395 | 2.4479 |
| P63261 | ACTG | Actin, cytoplasmic 2 | 0.0304 | 2.2374 |
| P00734 | THRB | Prothrombin | 0.0265 | 2.0770 |
| B9A064 | IGLL5 | Immunoglobulin lambda-like polypeptide 5 | 0.0420 | 1.9341 |
| P01714 | LV319 | Immunoglobulin lambda variable 3-19 | 0.0313 | 1.7496 |
| P01009 | A1AT | Alpha-1-antitrypsin | 0.0014 | 1.6875 |
| P02747 | C1QC | Complement C1q subcomponent subunit C | 0.0223 | 1.6522 |
| Downregulated in Untreated Group | ||||
| P02746 | C1QB | Complement C1q subcomponent subunit B | 0.0329 | 0.1549 |
| P08697 | A2AP | Alpha-2-antiplasmin | 0.0275 | 0.4938 |
| Uniprot Code | Protein Code | Protein Name | p-Value | Fold Change |
| Upregulated in ERT-a | ||||
| P0DJI8 | SAA1 | Serum amyloid A-1 protein | 0.0487 | Only ERT-a |
| Q13790 | APOF | Apolipoprotein F | 0.0487 | Only ERT-a |
| A0A0C4DH68 | KV224 | Immunoglobulin kappa variable 2-24 | 0.0109 | 6.1248 |
| P05156 | CFAI | Complement factor I | 0.0065 | 5.2409 |
| A0A075B6I0 | LV861 | Immunoglobulin lambda variable 8-61 | 0.0386 | 3.1547 |
| P43251 | BTD | Biotinidase | 0.0301 | 2.8996 |
| P04196 | HRG | Histidine-rich glycoprotein | 0.0224 | 1.5688 |
| Downregulated in ERT-a | ||||
| P02747 | C1QC | Complement C1q subcomponent subunit C | 0.0465 | 0.5069 |
| Uniprot Code | Protein Code | Protein Name | p-Value | Fold Change |
| Upregulated in ERT-b | ||||
| P60174 | TPIS | Triosephosphateisomerase | 0.0487 | Only ERT-b |
| O00391 | QSOX1 | Sulfhydryl oxidase 1 | 0.0487 | Only ERT-b |
| A0A0C4DH67 | KV108 | Immunoglobulin kappa variable 1-8 | 0.0028 | Only ERT-b |
| P0C0L5 | CO4B | Complement C4-B | 0.0029 | 17.9592 |
| O14791 | APOL1 | Apolipoprotein L1 | 0.0480 | 2.2700 |
| P20742 | PZP | Pregnancyzone protein | 0.0418 | 2.1171 |
| P06396 | GELS | Gelsolin | 0.0080 | 2.0649 |
| P00751 | CFAB | Complement factor B | 0.0184 | 2.0058 |
| P19823 | ITIH2 | Inter-alpha-trypsin inhibitor heavy chain H2 | 0.0093 | 1.9167 |
| P01023 | A2MG | Alpha-2-macroglobulin | 0.0093 | 1.8574 |
| P08697 | A2AP | Alpha-2-antiplasmin | 0.0298 | 1.8165 |
| Q14624 | ITIH4 | Inter-alpha-trypsin inhibitor heavy chain H4 | 0.0389 | 1.7428 |
| P05546 | HEP2 | Heparin cofactor 2 | 0.0421 | 1.6111 |
| Downregulated in ERT-b | ||||
| P02766 | TTHY | Transthyretin | 0.0224 | 0.2358 |
Publisher’s Note: MDPI stays neutral with regard to jurisdictional claims in published maps and institutional affiliations. |
© 2021 by the authors. Licensee MDPI, Basel, Switzerland. This article is an open access article distributed under the terms and conditions of the Creative Commons Attribution (CC BY) license (https://creativecommons.org/licenses/by/4.0/).
Share and Cite
Álvarez, J.V.; Bravo, S.B.; Chantada-Vázquez, M.P.; Barbosa-Gouveia, S.; Colón, C.; López-Suarez, O.; Tomatsu, S.; Otero-Espinar, F.J.; Couce, M.L. Plasma Proteomic Analysis in Morquio A Disease. Int. J. Mol. Sci. 2021, 22, 6165. https://0-doi-org.brum.beds.ac.uk/10.3390/ijms22116165
Álvarez JV, Bravo SB, Chantada-Vázquez MP, Barbosa-Gouveia S, Colón C, López-Suarez O, Tomatsu S, Otero-Espinar FJ, Couce ML. Plasma Proteomic Analysis in Morquio A Disease. International Journal of Molecular Sciences. 2021; 22(11):6165. https://0-doi-org.brum.beds.ac.uk/10.3390/ijms22116165
Chicago/Turabian StyleÁlvarez, José V., Susana B. Bravo, María Pilar Chantada-Vázquez, Sofía Barbosa-Gouveia, Cristóbal Colón, Olalla López-Suarez, Shunji Tomatsu, Francisco J. Otero-Espinar, and María L. Couce. 2021. "Plasma Proteomic Analysis in Morquio A Disease" International Journal of Molecular Sciences 22, no. 11: 6165. https://0-doi-org.brum.beds.ac.uk/10.3390/ijms22116165