
Comparative Study of Metagenomics and Metatranscriptomics to Reveal Microbiomes in Overwintering Pepper Fruits


 , and
, and 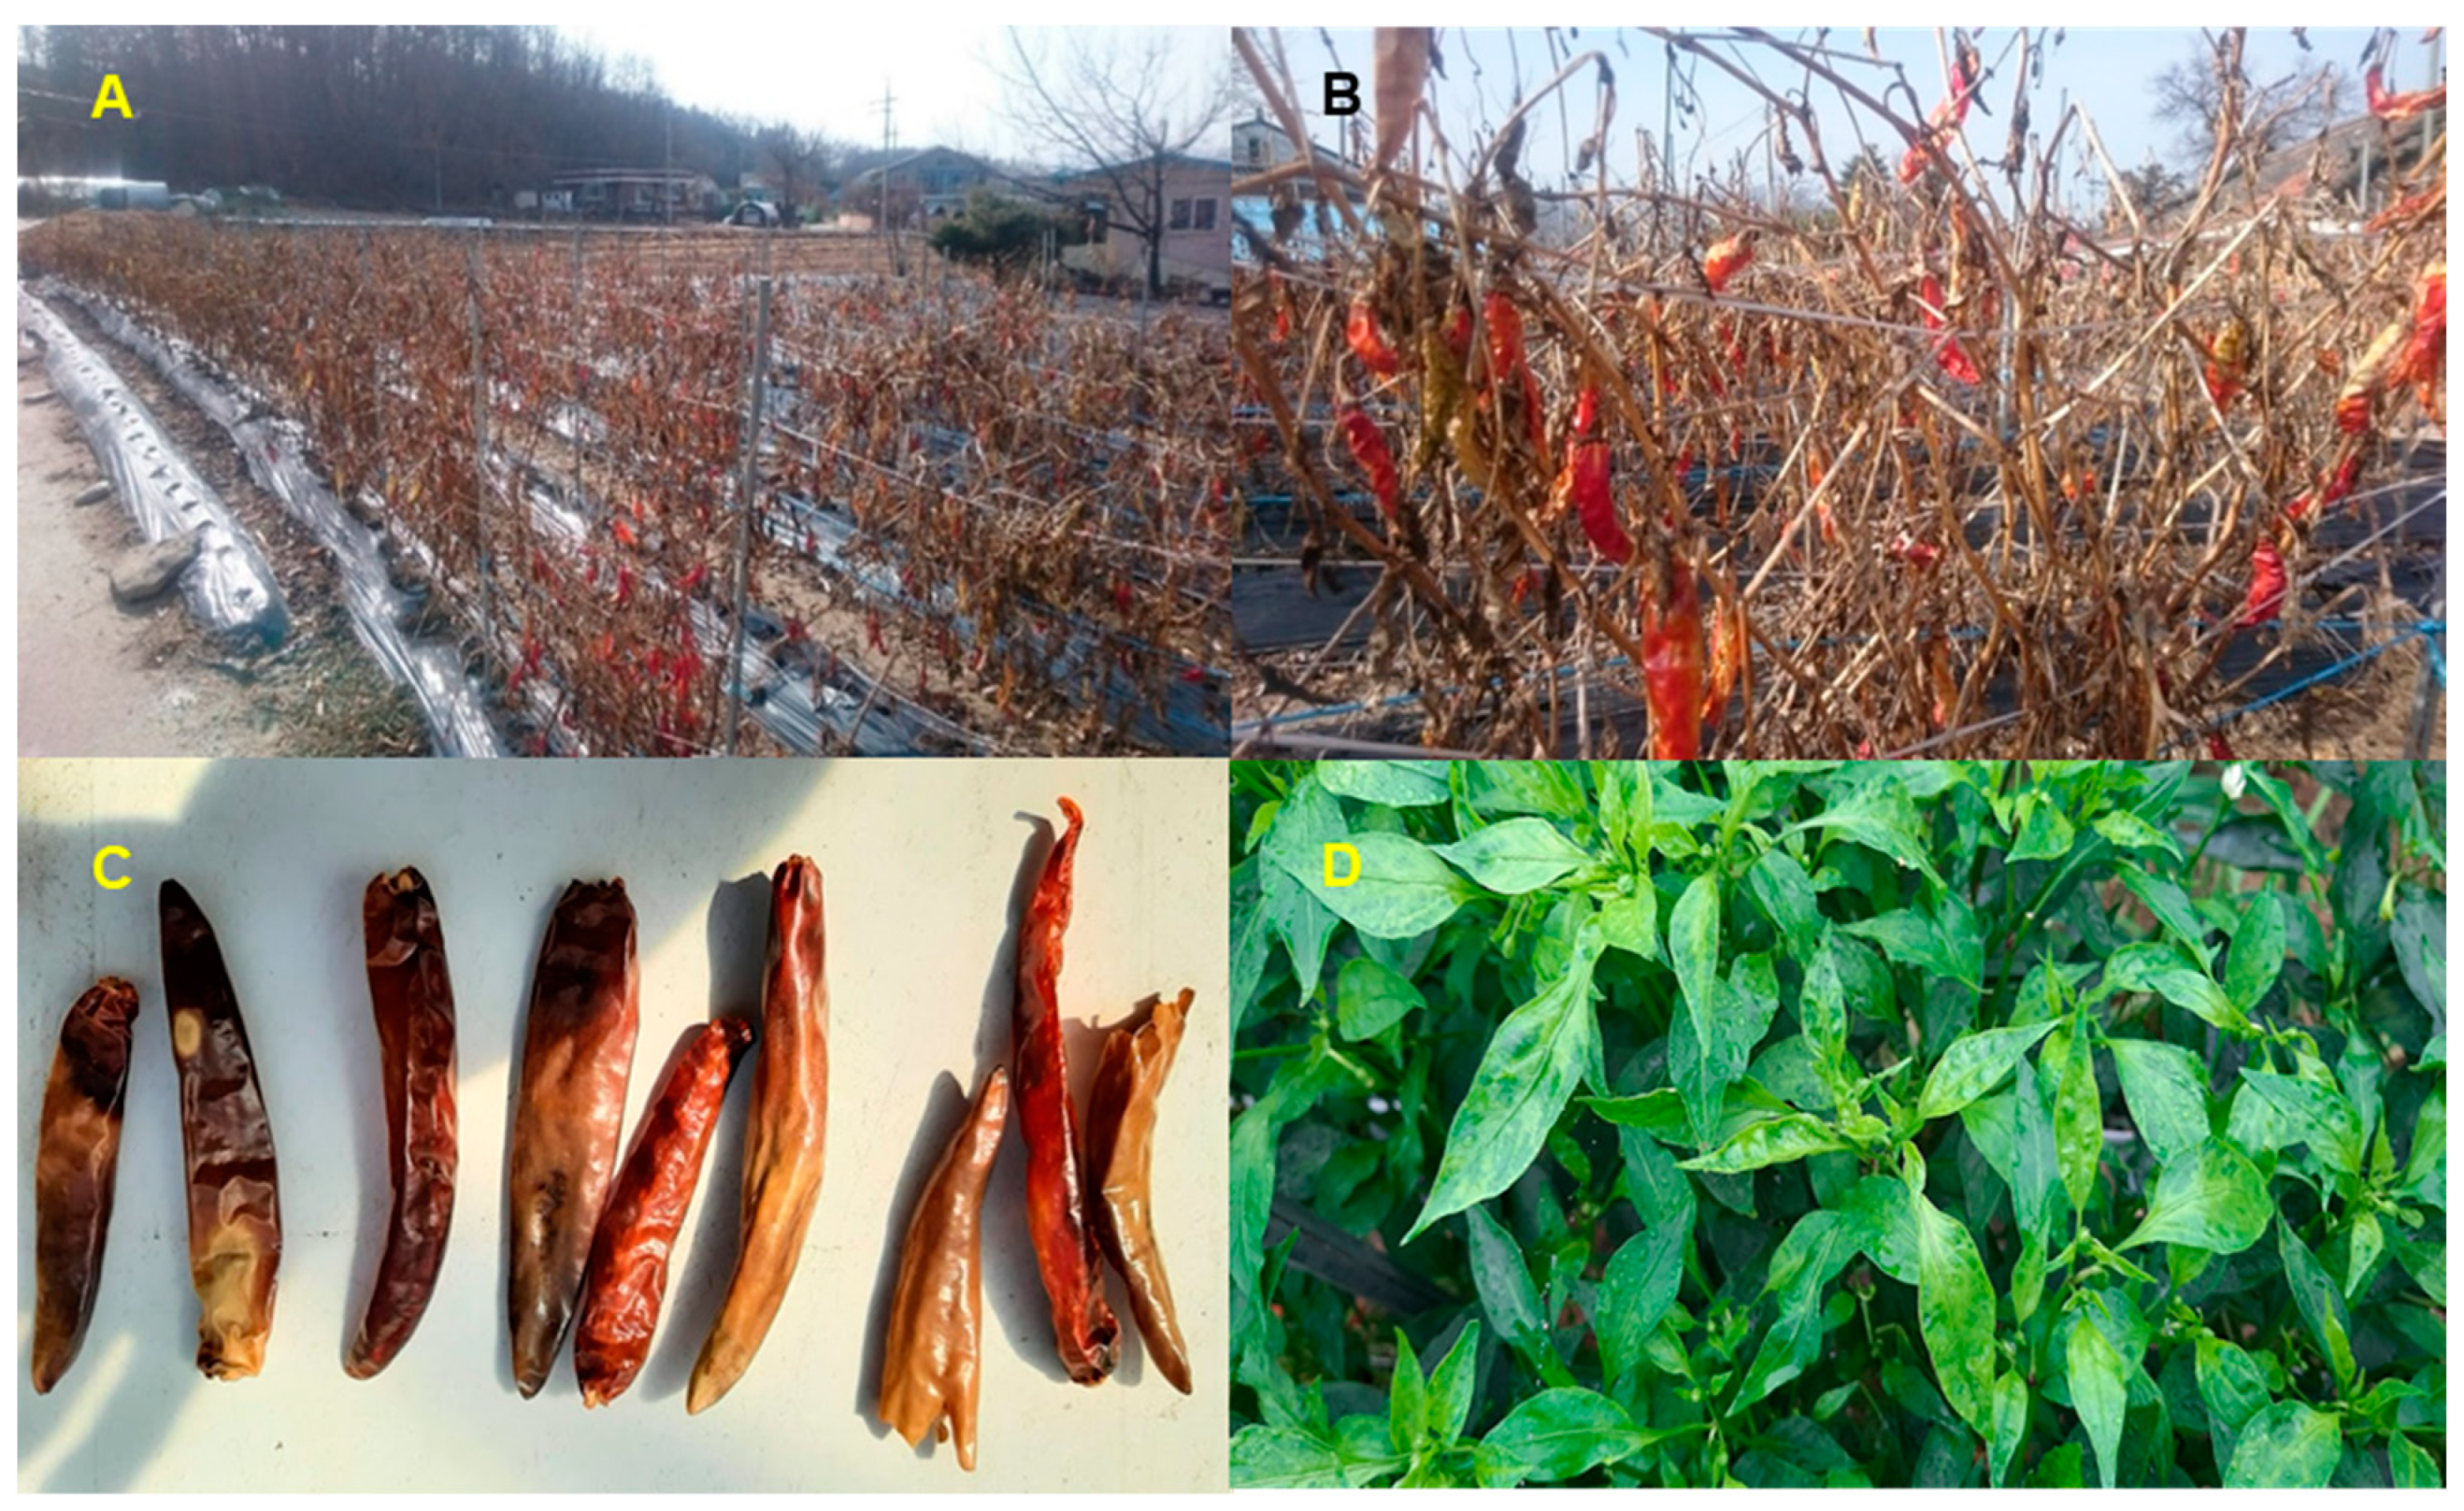
Abstract
:1. Introduction
2. Results
2.1. Metagenomics and Metatranscriptomics for Overwintering Pepper Fruits
2.2. Identification of Microorganisms by Three Different Methods
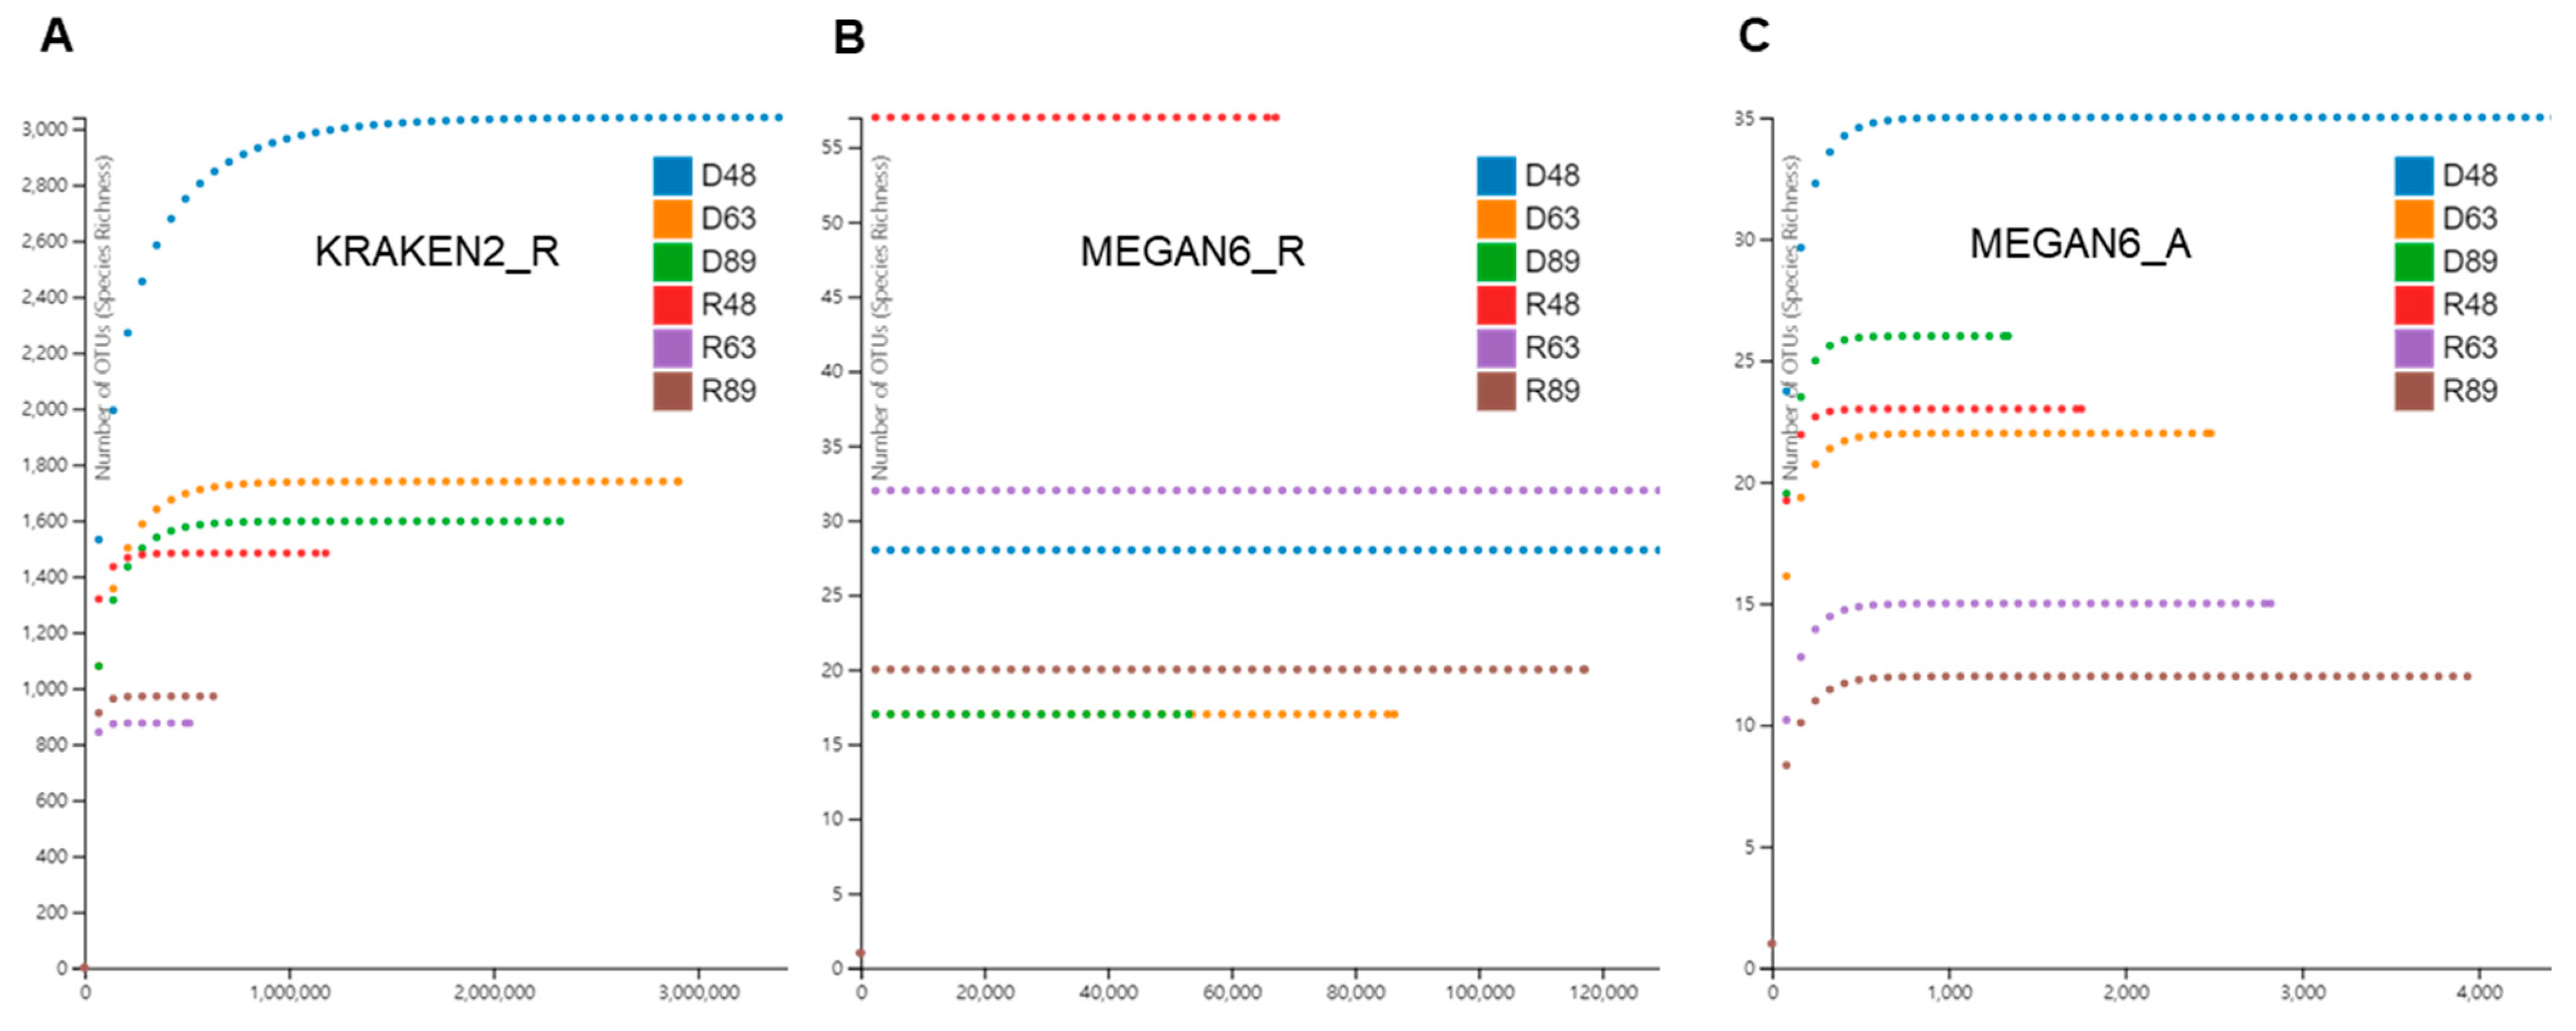
2.3. Rarefaction Analysis
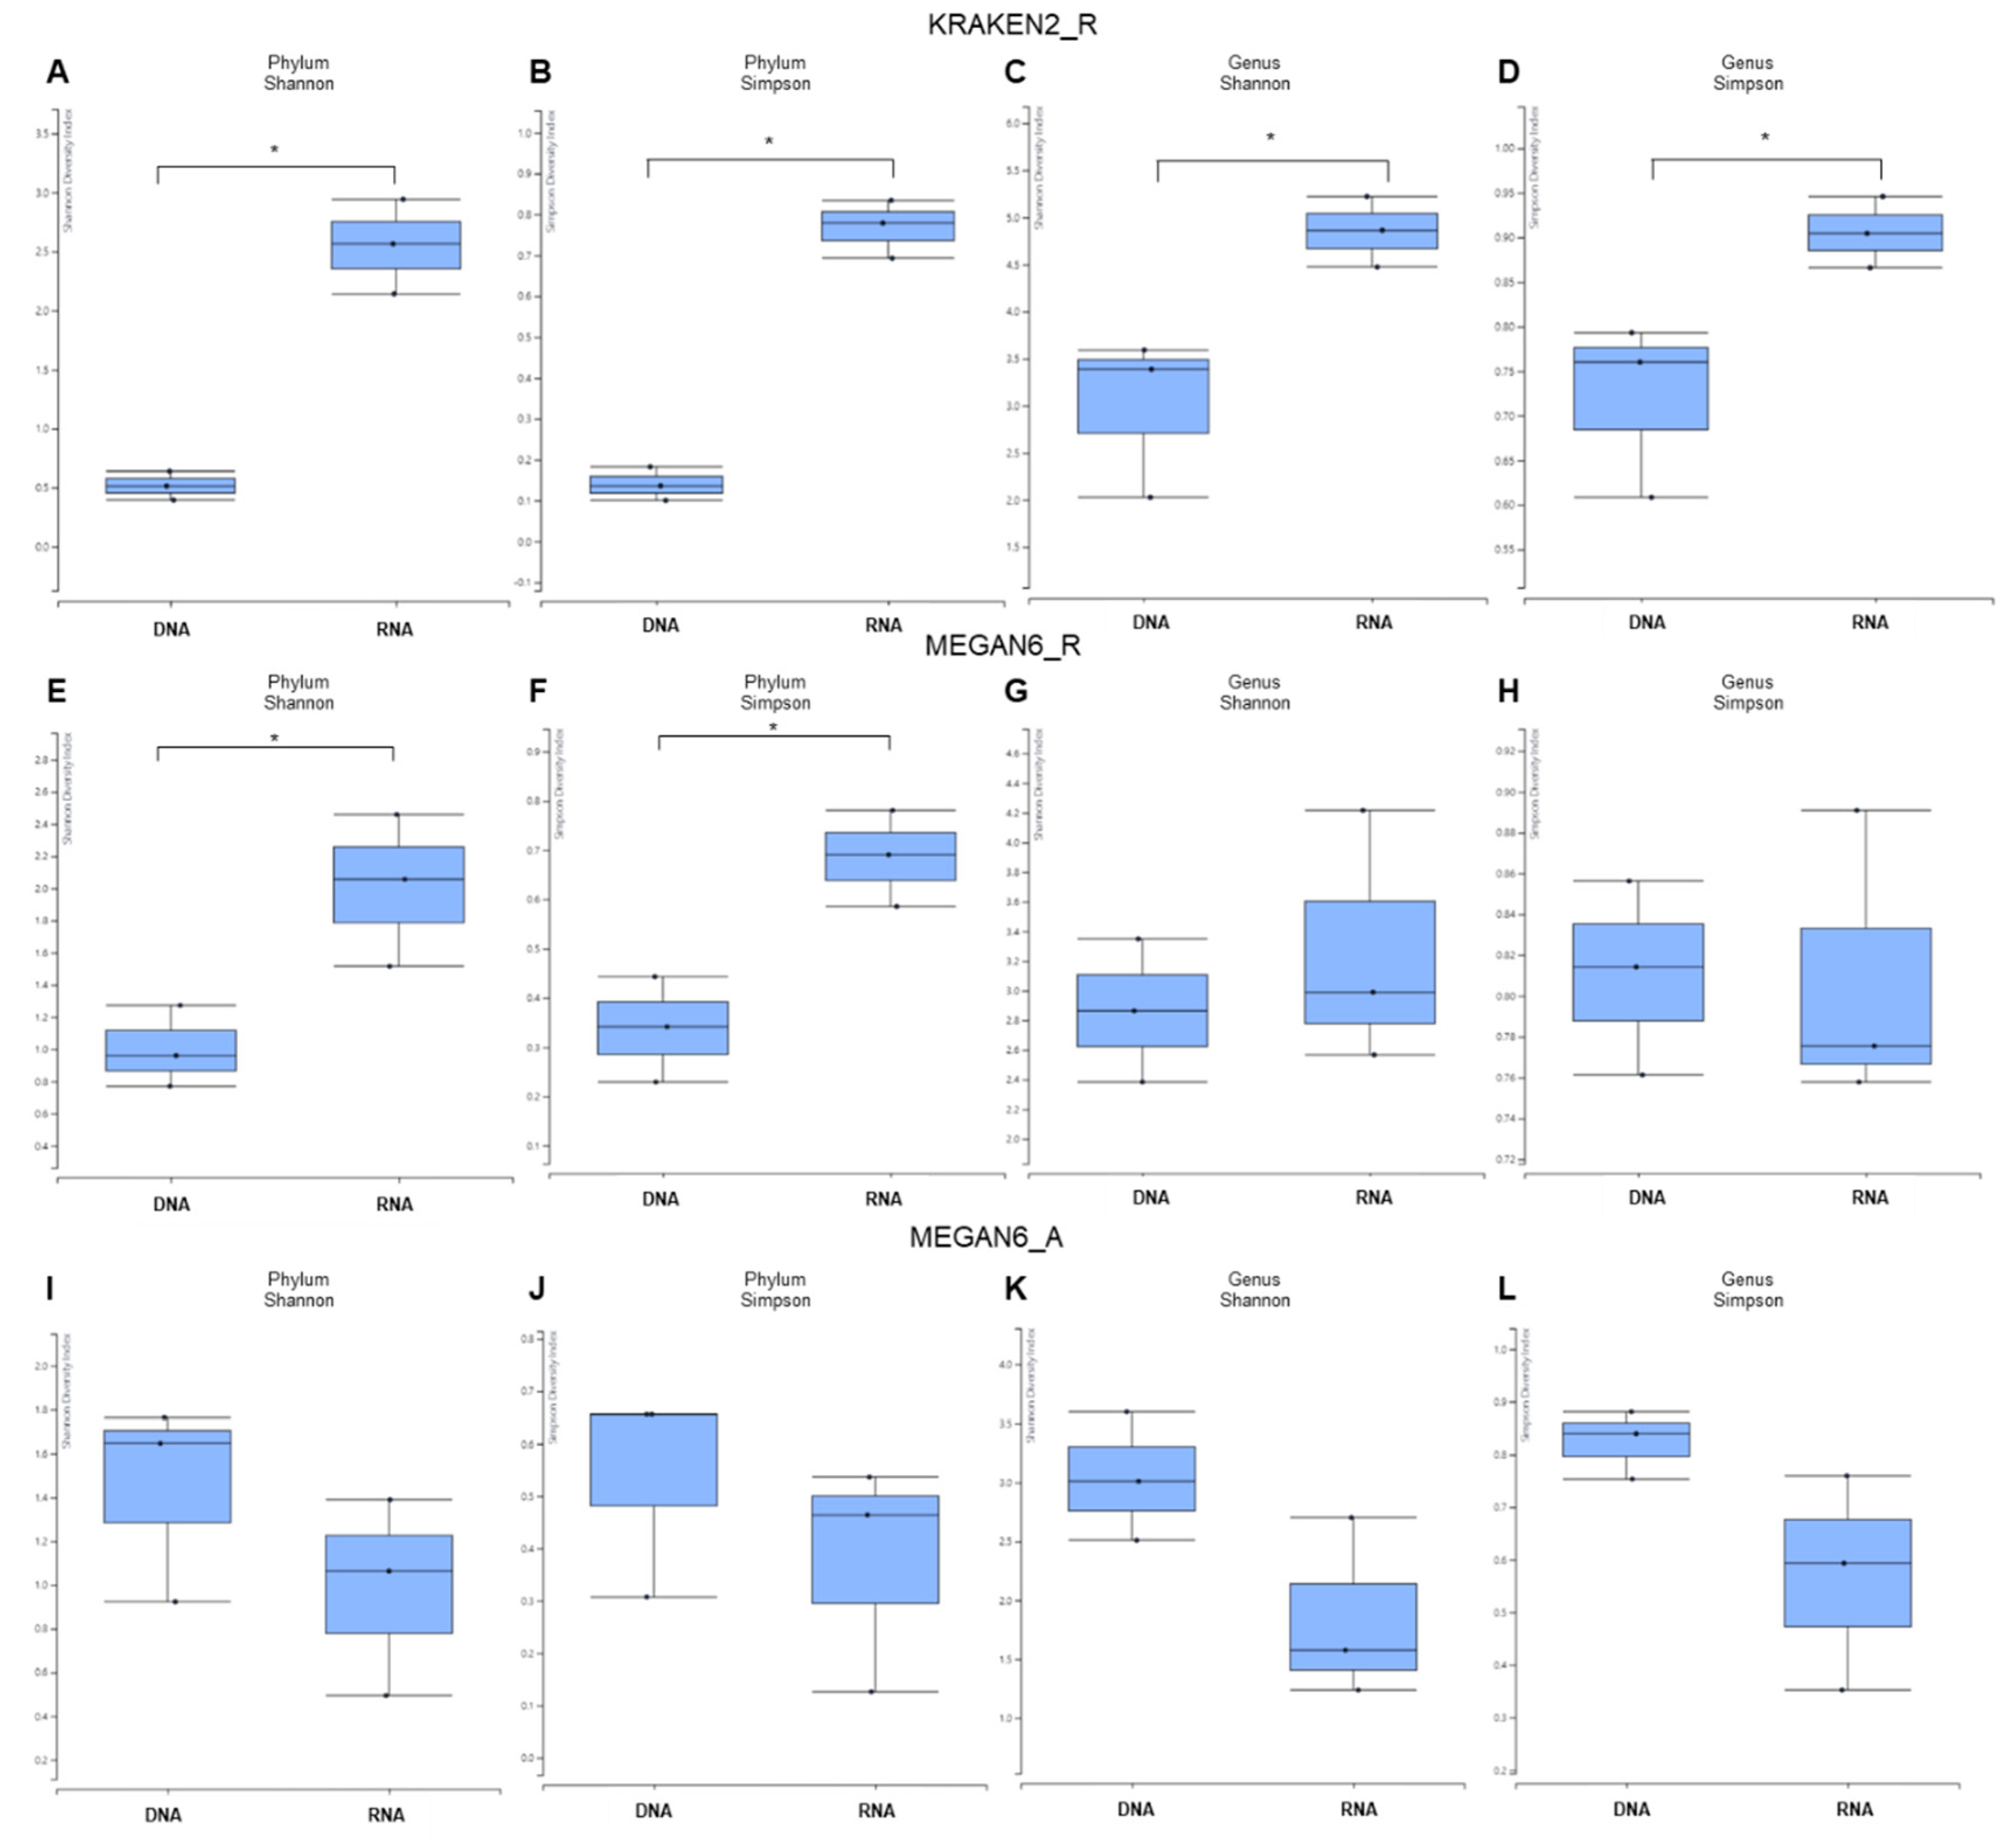
2.4. Alpha Diversity of Identified Microorganisms
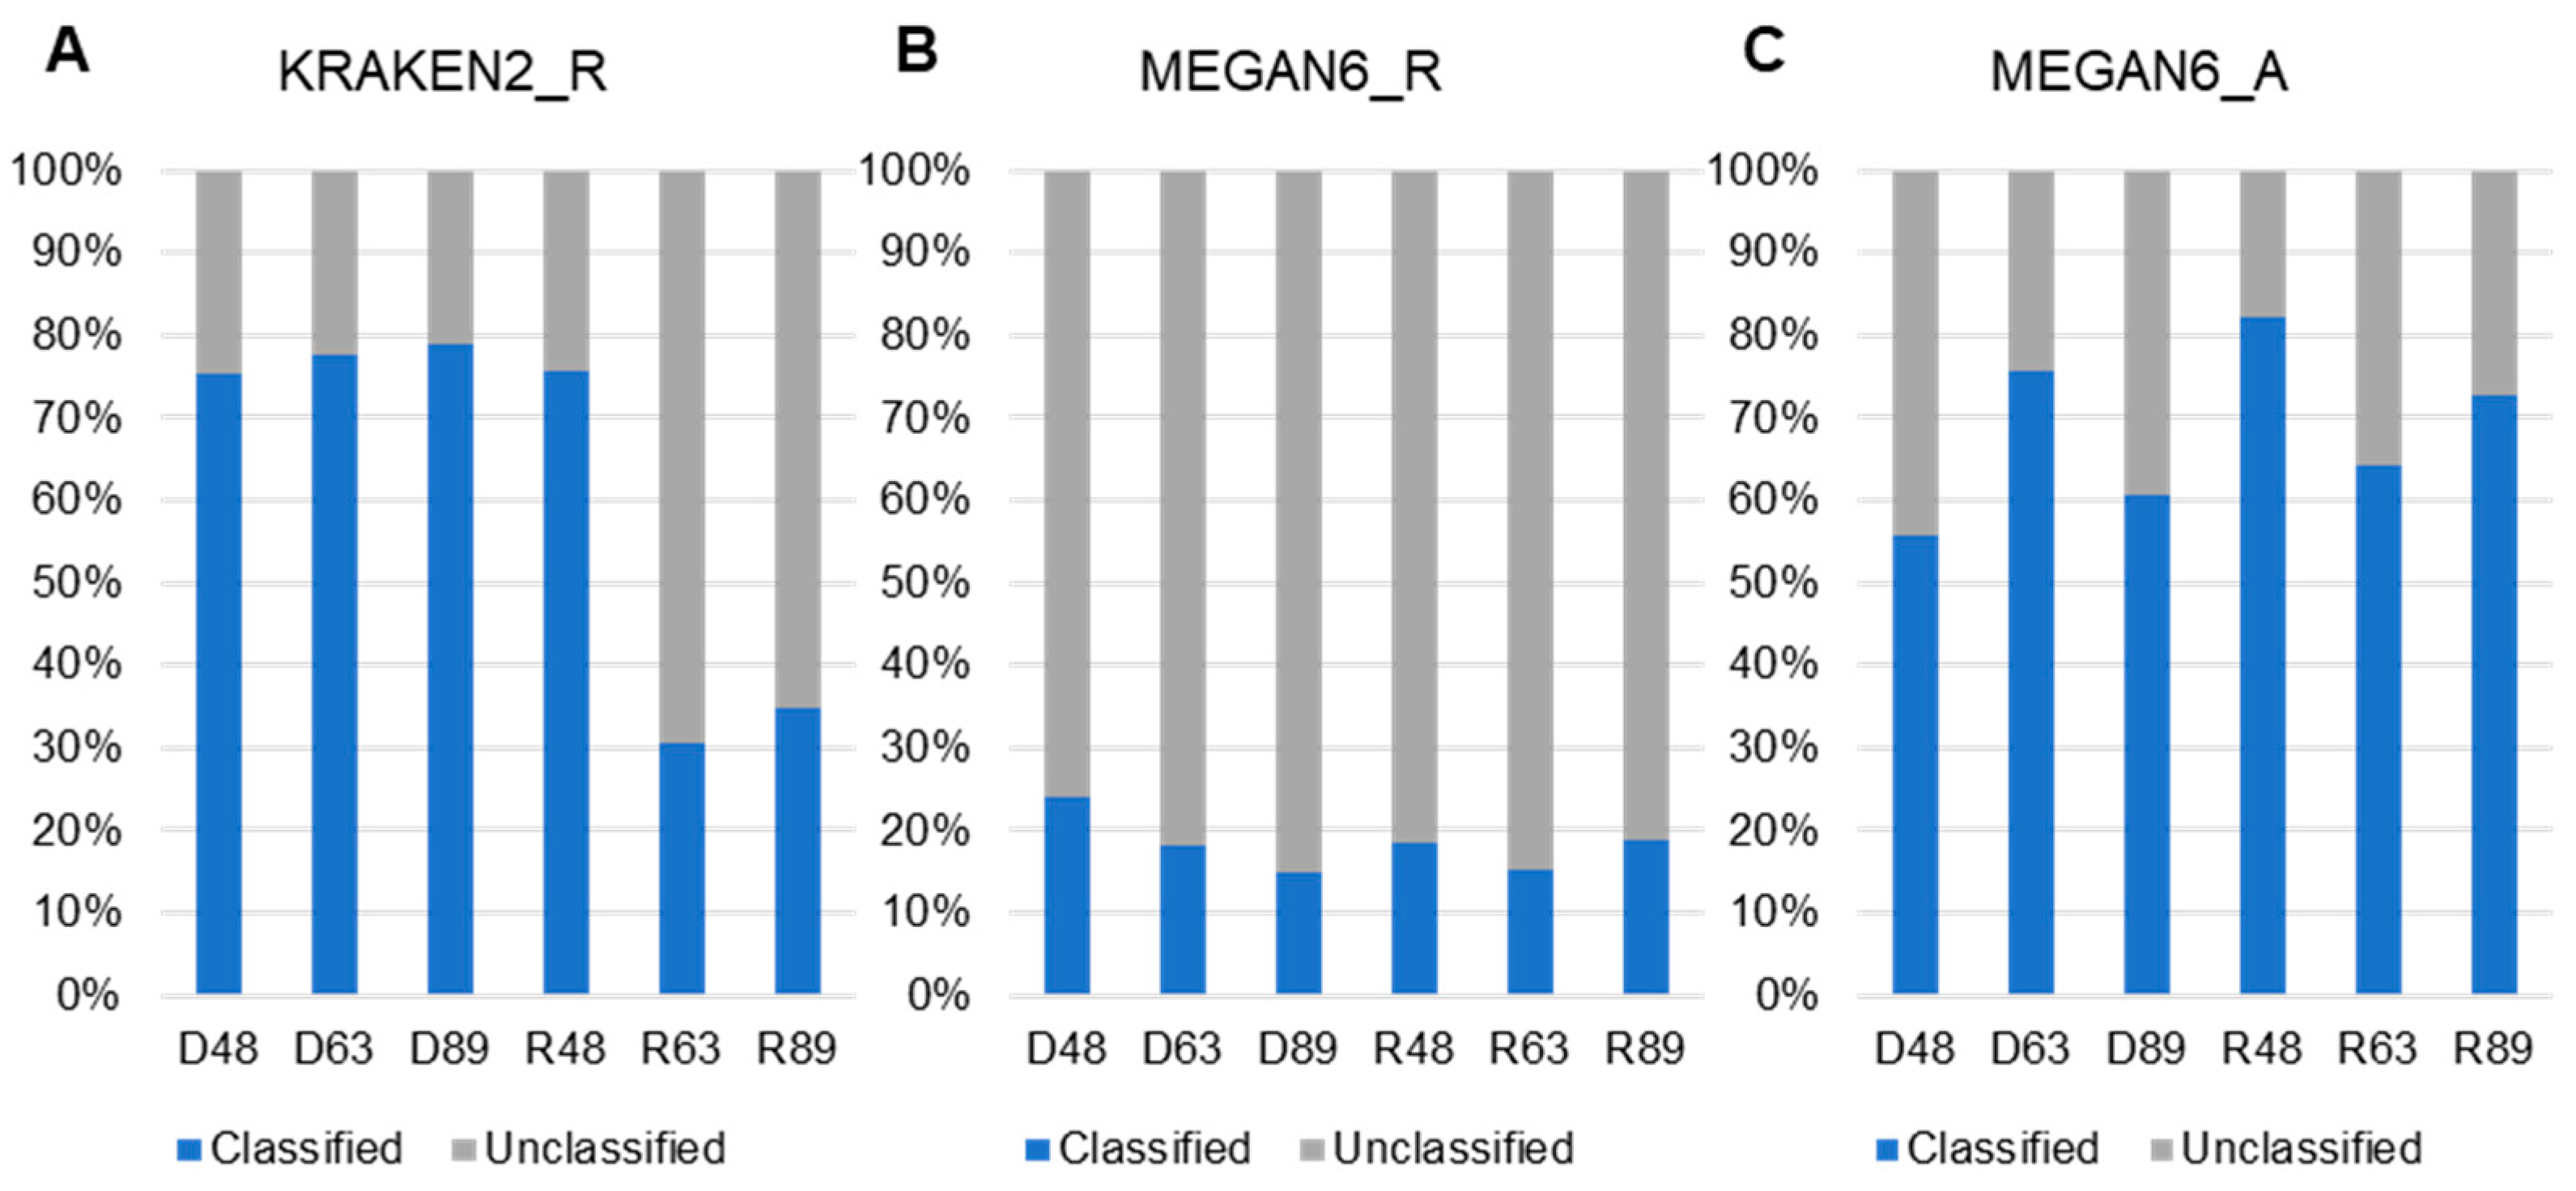
2.5. Comparison of Classified and Unclassified Reads in Six Libraries and Methods
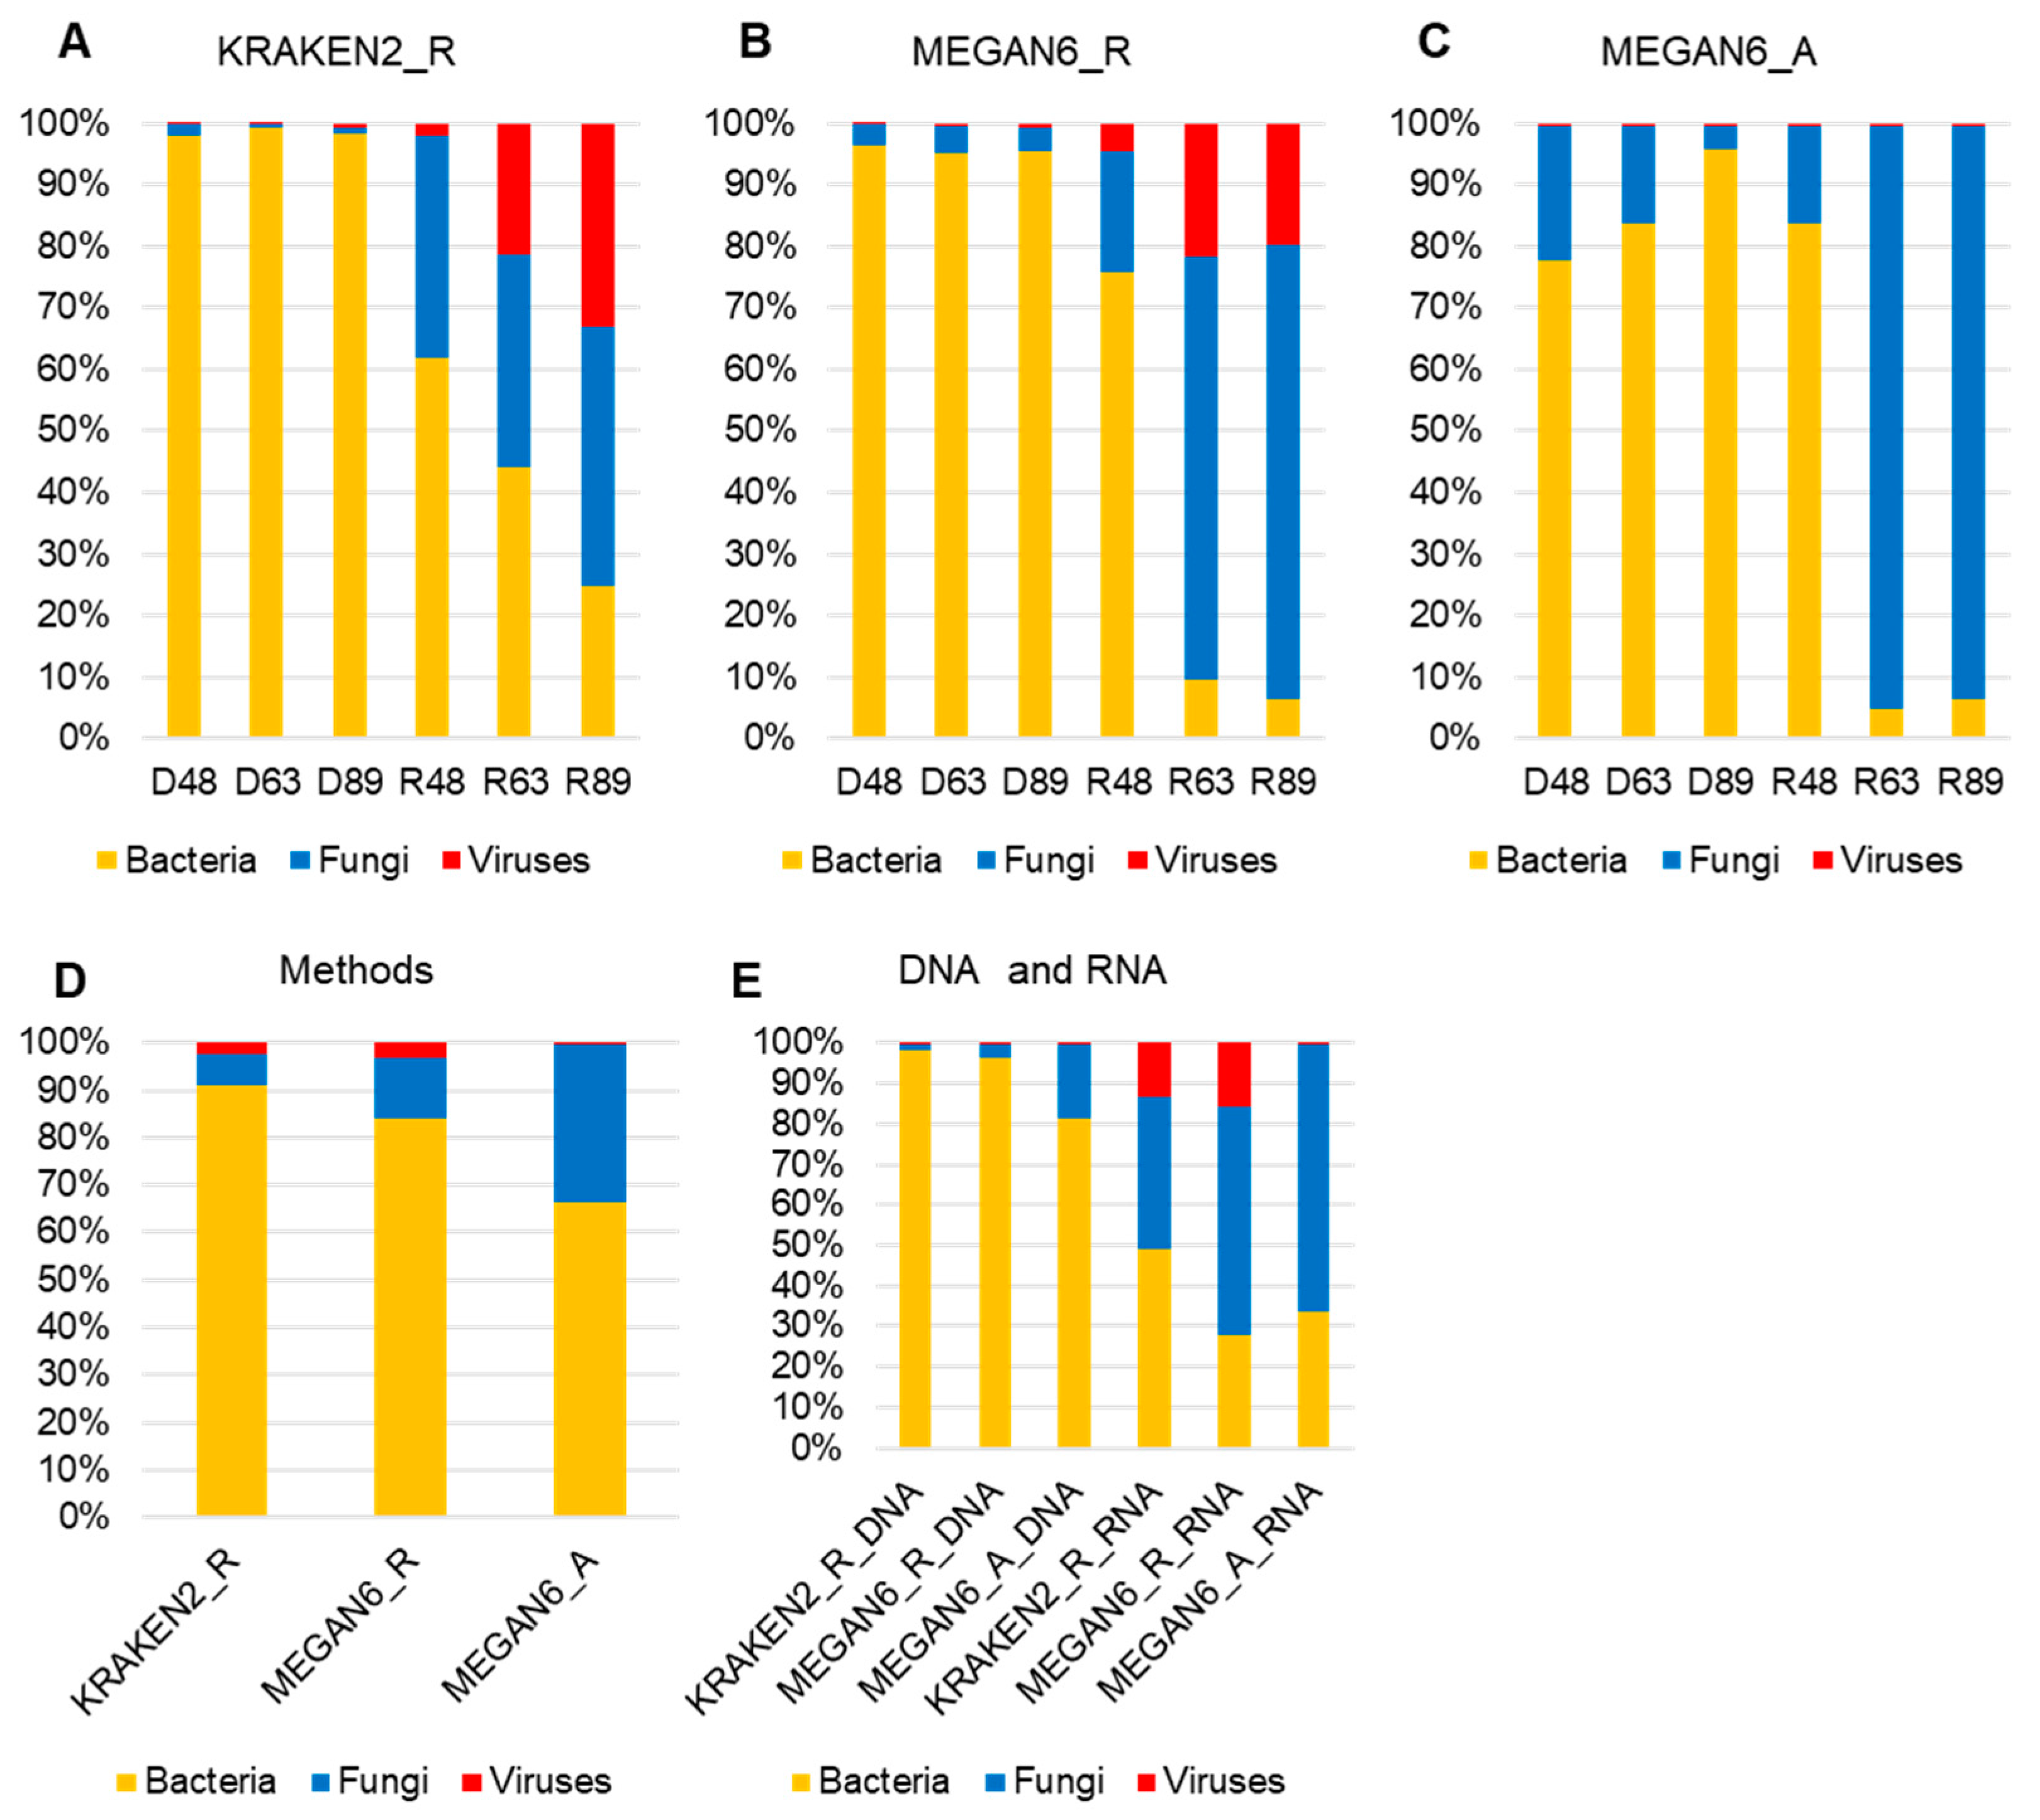
2.6. Comparison of Proportion for Three Different Microorganisms
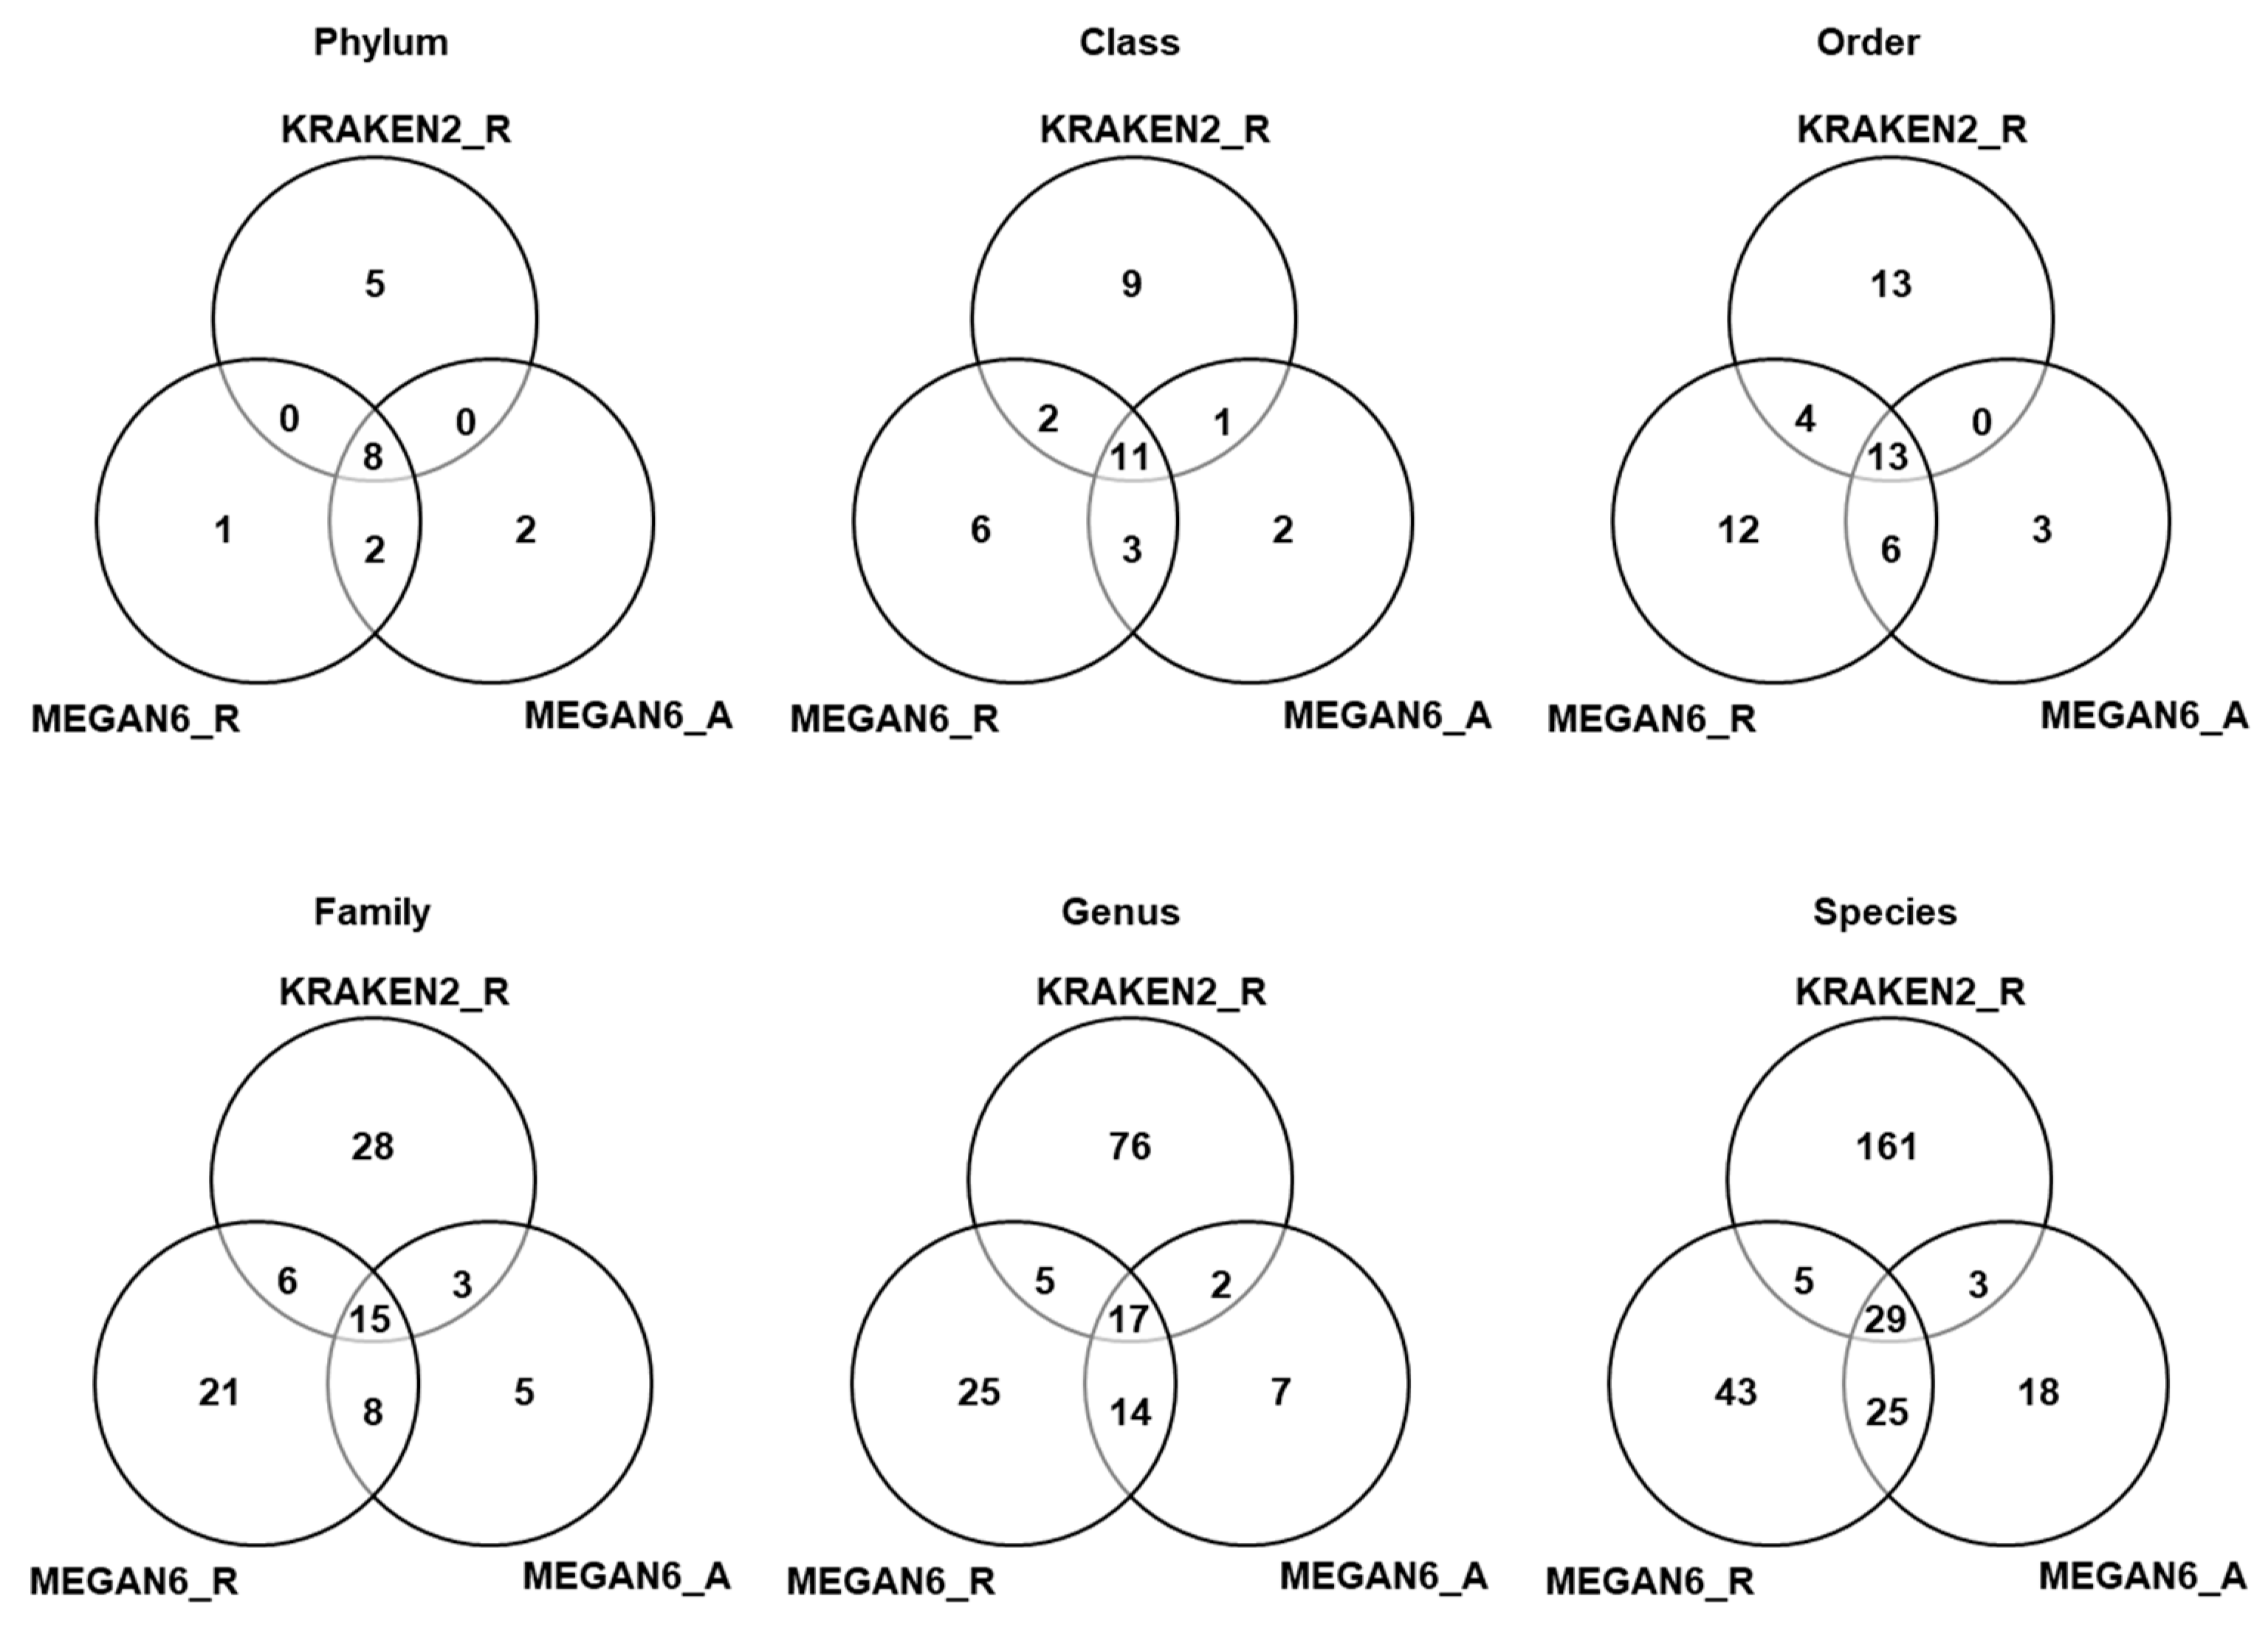
2.7. Comparison of Number of Identified Microorganisms by Three Different Methods
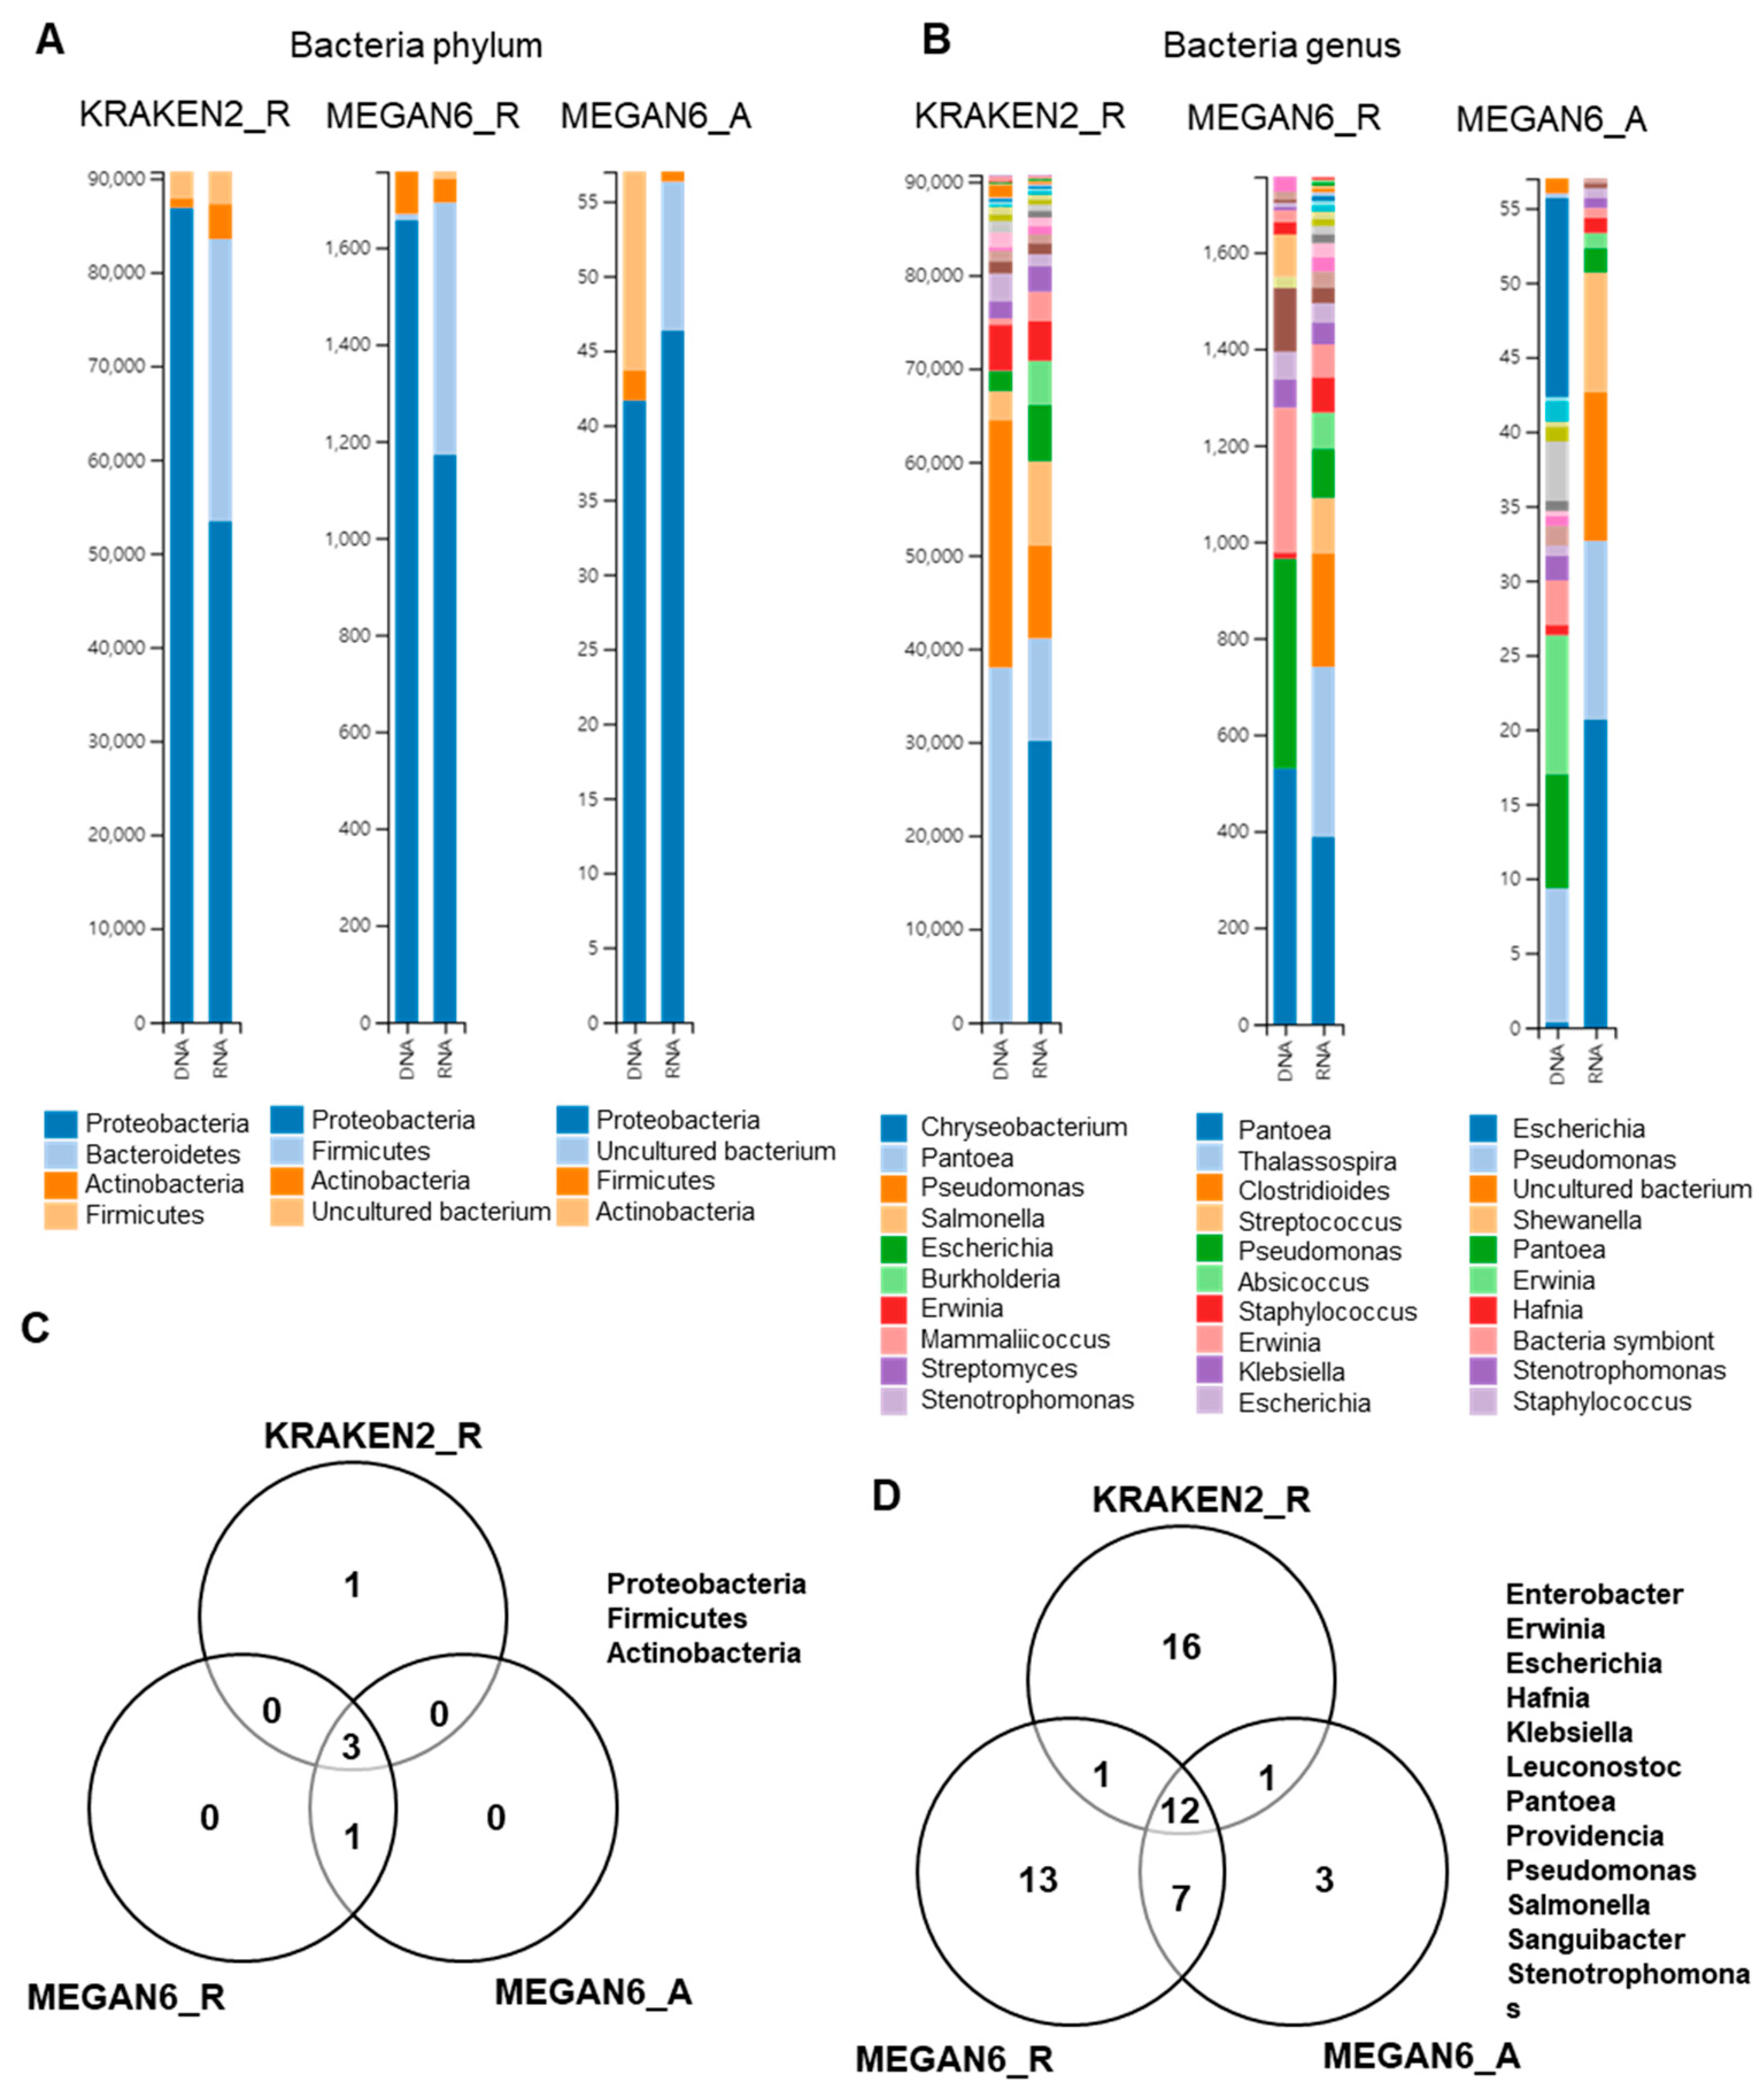
2.8. Comparison of Identified Bacterial Phyla and Genera
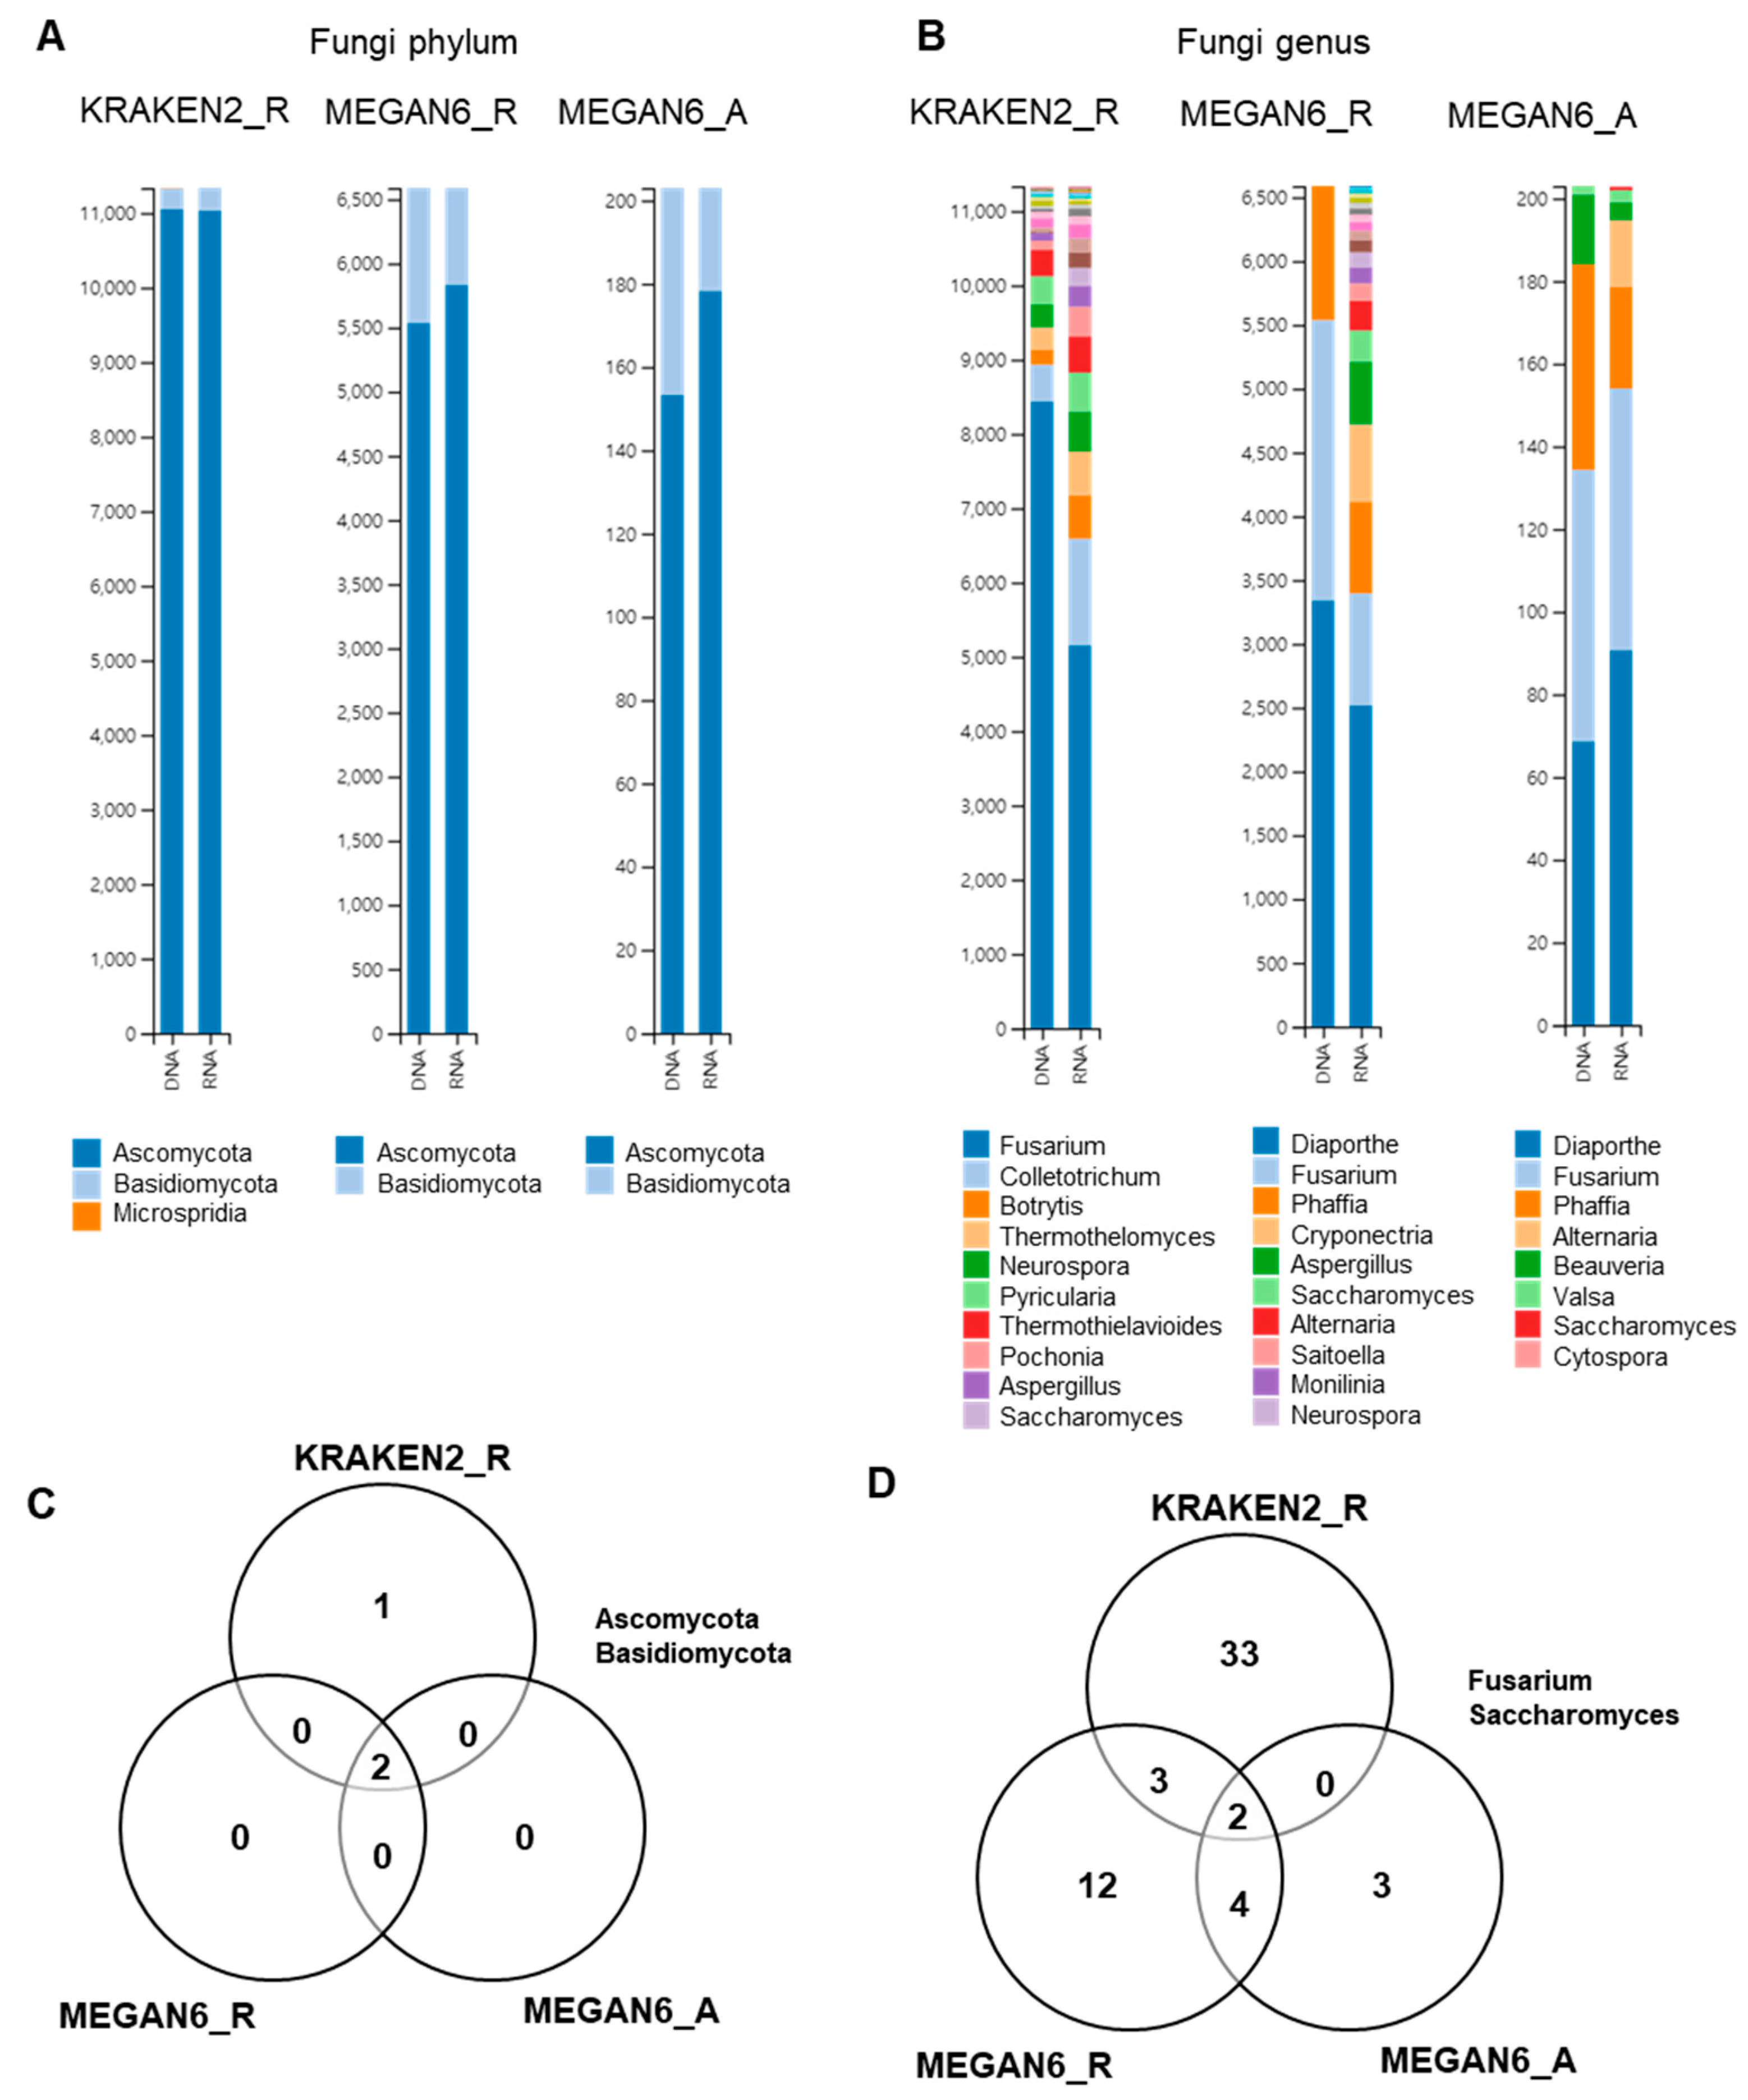
2.9. Comparison of Identified Fungal Phyla and Genera
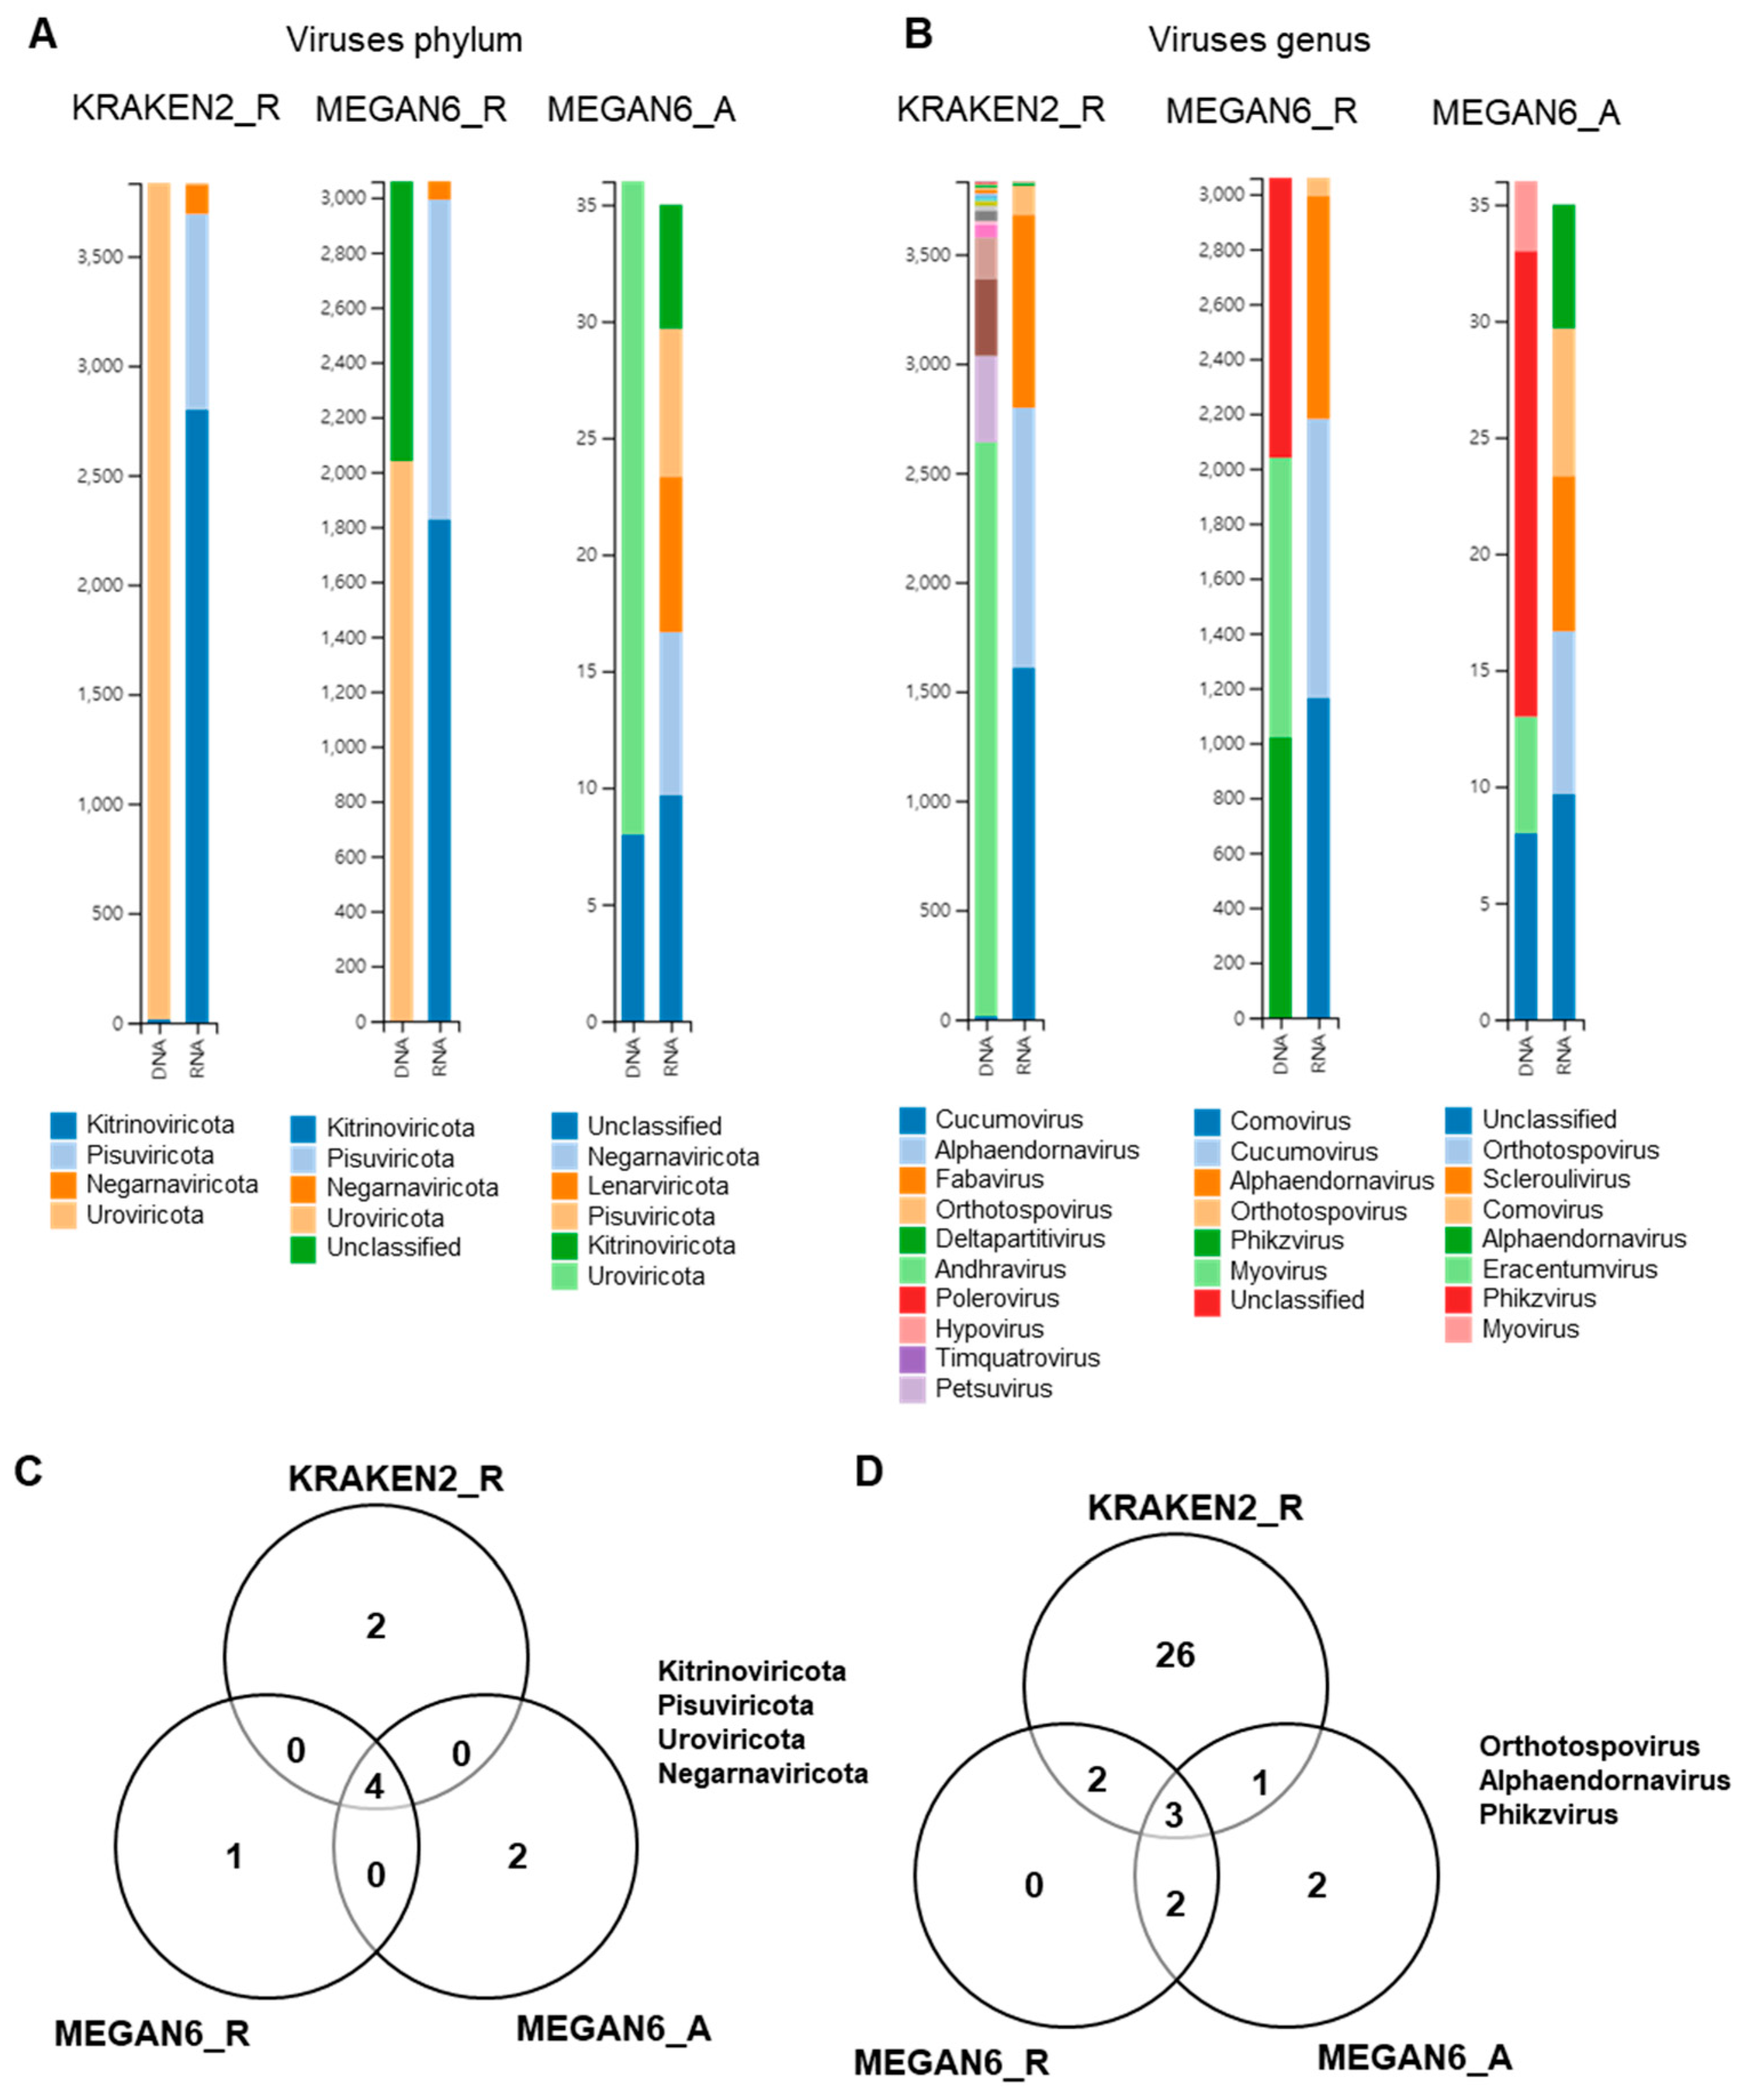
2.10. Comparison of Identified Viral Phyla and Genera
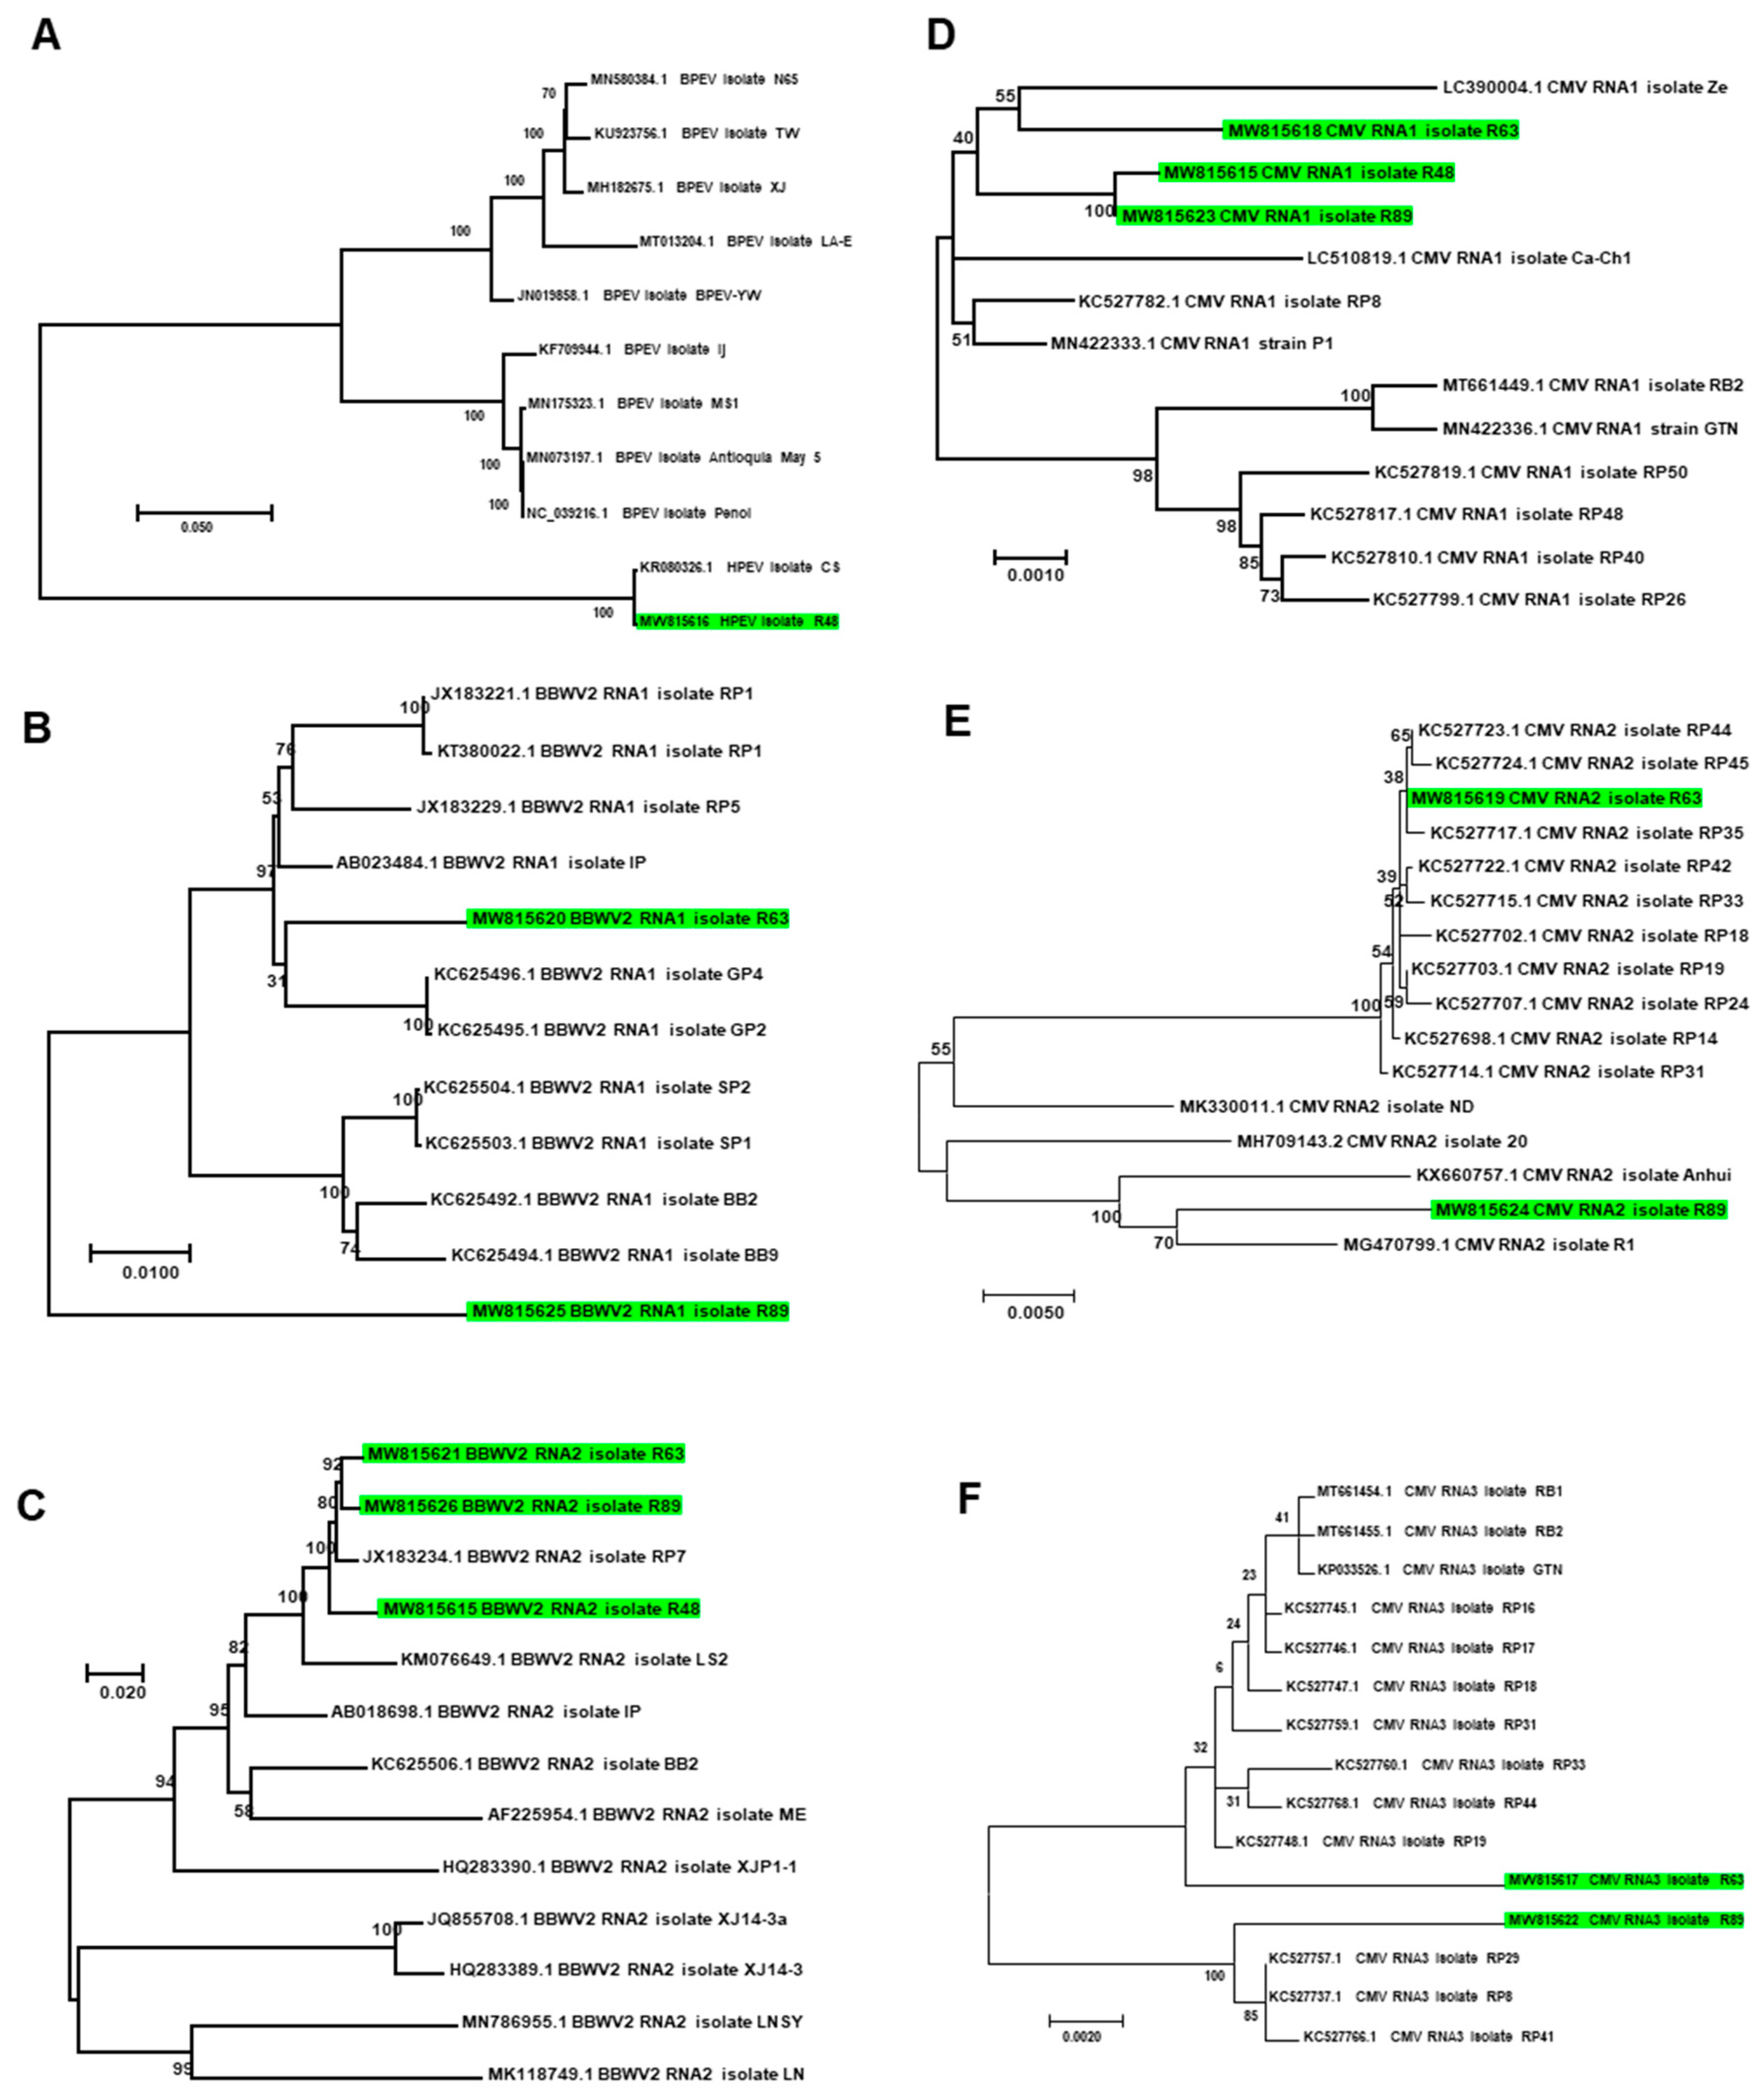
2.11. Classification of Identified Microbial Species by KRAKEN2_R
3. Discussion
4. Conclusions
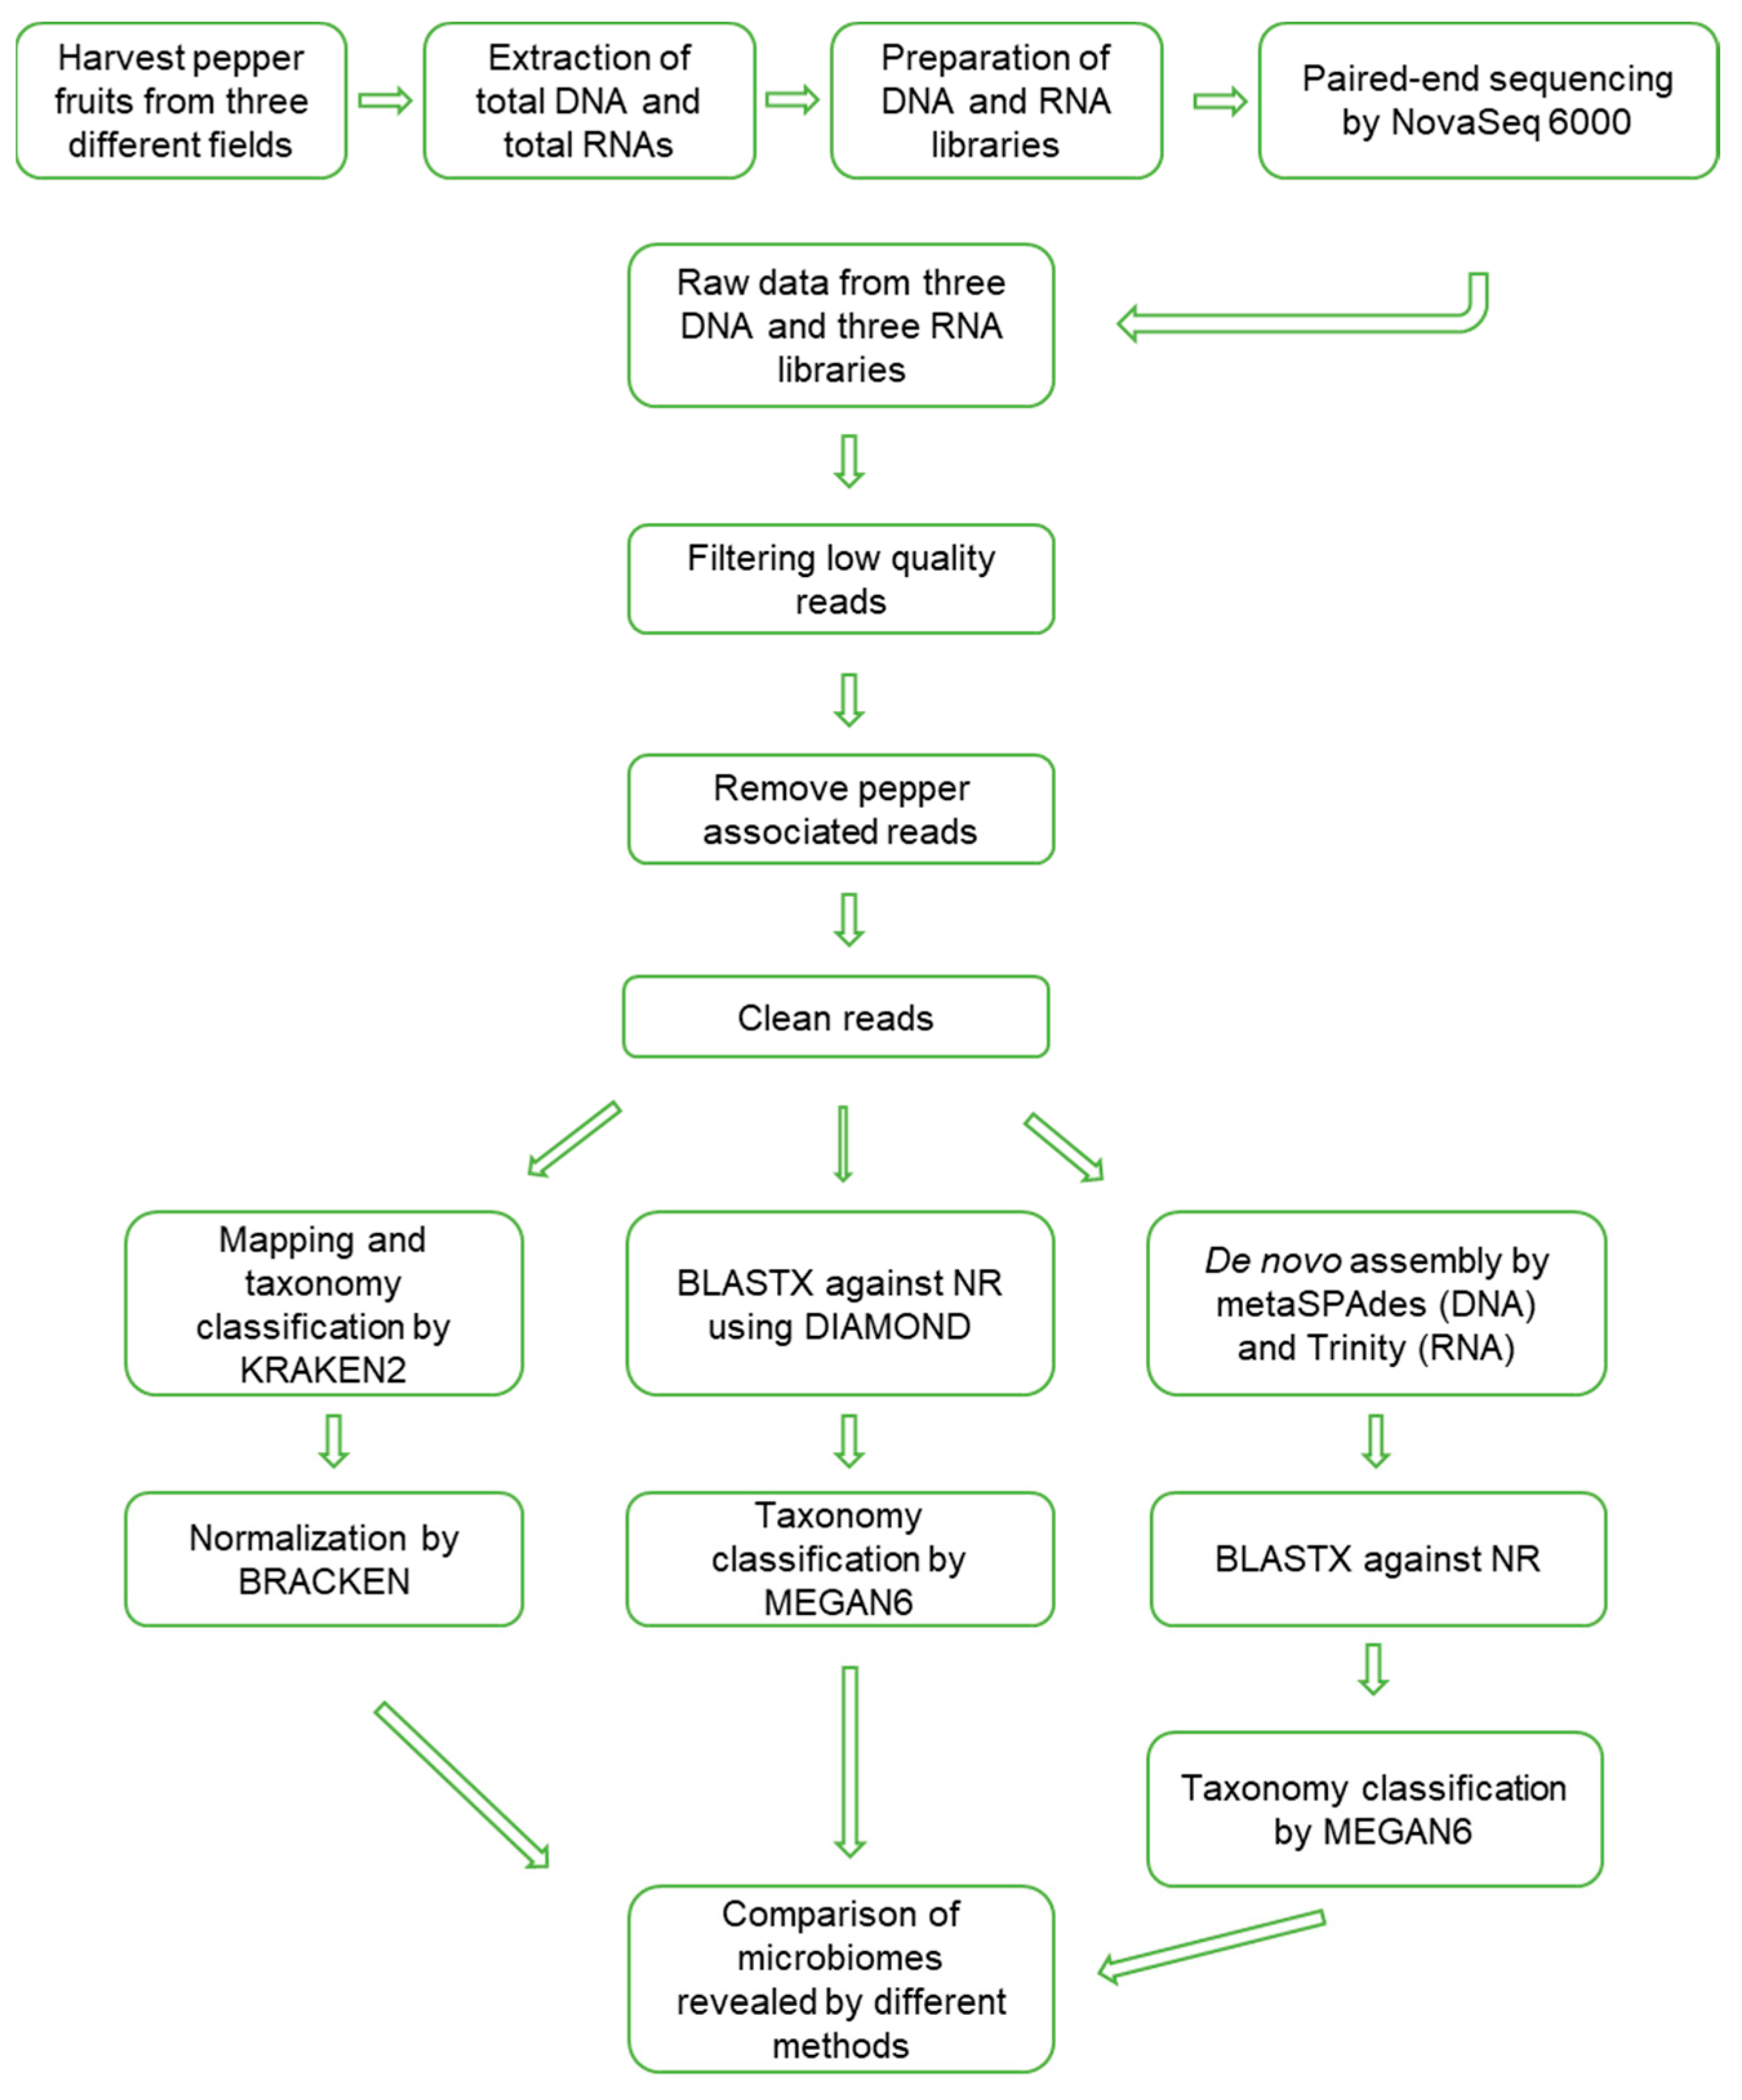
5. Materials and Methods
5.1. Plant Materials and Nucleic acid Extraction
5.2. Library Preparation and NGS
5.3. Quality Trimming and Removal of Pepper-Associated Reads
5.4. Microbiome Analysis by KRAKEN2 and BRACKEN Using Raw Data
5.5. Microbiome Analysis by BLASTX and MEGAN6 Using Raw Data
5.6. Microbiome Analysis by BLASTX and MEGAN6 Using Assembled Contigs
5.7. Microbial Taxonomy Assignment
Supplementary Materials
Author Contributions
Funding
Institutional Review Board Statement
Informed Consent Statement
Data Availability Statement
Acknowledgments
Conflicts of Interest
References
- Kim, S.; Park, M.; Yeom, S.-I.; Kim, Y.-M.; Lee, J.M.; Lee, H.-A.; Seo, E.; Choi, J.; Cheong, K.; Kim, K.-T. Genome sequence of the hot pepper provides insights into the evolution of pungency in Capsicum species. Nat. Genet. 2014, 46, 270–278. [Google Scholar] [CrossRef]
- Parisi, M.; Alioto, D.; Tripodi, P. Overview of biotic stresses in pepper (Capsicum spp.): Sources of genetic resistance, molecular breeding and genomics. Int. J. Mol. Sci. 2020, 21, 2587. [Google Scholar] [CrossRef] [PubMed] [Green Version]
- Kyeon, M.-S.; Son, S.-H.; Noh, Y.-H.; Kim, Y.-E.; Lee, H.-I.; Cha, J.-S. Xanthomonas euvesicatoria causes bacterial spot disease on pepper plant in Korea. Plant Pathol. J. 2016, 32, 431. [Google Scholar] [CrossRef] [PubMed] [Green Version]
- Jones, J.B.; Bouzar, H.; Stall, R.E.; Almira, E.C.; Roberts, P.D.; Bowen, B.W.; Sudberry, J.; Strickler, P.M.; Chun, J. Systematic analysis of xanthomonads (Xanthomonas spp.) associated with pepper and tomato lesions. Int. J. Syst. Evol. Microbiol. 2000, 50 Pt 3, 1211–1219. [Google Scholar] [CrossRef] [Green Version]
- Kim, J.-T.; Park, S.-Y.; Choi, W.-B.; Lee, Y.-H.; Kim, H.-T. Characterization of Colletotrichum isolates causing anthracnose of pepper in Korea. Plant Pathol. J. 2008, 24, 17–23. [Google Scholar] [CrossRef]
- Lee, O.-H.; Hwang, H.-S.; Kim, J.-Y.; Han, J.-H.; Yoo, Y.-S.; Kim, B.-S. A search for sources of resistance to powdery mildew (Leveillula taurica (Lev.) Arn) in pepper (Capsicum spp.). Hortic. Sci. Technol. 2001, 19, 7–11. [Google Scholar]
- Lee, S.M.; Min, J.; Kim, H.T. Fungicide selections for control of chili pepper stem rot caused by Sclerotium rolfsii using an agar dilution method. Korean J. Agric. Sci. 2017, 44, 339–347. [Google Scholar]
- Jang, H.-S.; Lee, S.-M.; Kim, S.-B.; Kim, J.-H.; Knight, S.; Park, K.-D.; McKenzie, D.; Kim, H.-T. Baseline sensitivity to mandipropamid among isolates of Phytophthora capsici causing Phytophthora blight on pepper. Plant Pathol. J. 2009, 25, 317–321. [Google Scholar] [CrossRef] [Green Version]
- Back, C.-G.; Lee, S.-Y.; Jung, H.-Y. Molecular phylogenetic analysis of Botrytis cinerea occurring in Korea. Korean J. Mycol. 2014, 42, 138–143. [Google Scholar] [CrossRef] [Green Version]
- Than, P.P.; Prihastuti, H.; Phoulivong, S.; Taylor, P.W.; Hyde, K.D. Chilli anthracnose disease caused by Colletotrichum species. J. Zhejiang Univ. Sci. B 2008, 9, 764–778. [Google Scholar] [CrossRef] [Green Version]
- Elad, Y.; Messika, Y.; Brand, M.; David, D.R.; Sztejnberg, A. Effect of colored shade nets on pepper powdery mildew (Leveillula taurica). Phytoparasitica 2007, 35, 285–299. [Google Scholar] [CrossRef]
- Boukaew, S.; Chuenchit, S.; Petcharat, V. Evaluation of Streptomyces spp. for biological control of Sclerotium root and stem rot and Ralstonia wilt of chili pepper. BioControl 2011, 56, 365–374. [Google Scholar] [CrossRef]
- Rai, G.S.; Liew, E.C.; Guest, D.I. Survey, identification and genetic diversity of Phytophthora capsici causing wilt of chilli (Capsicum annuum L.) in Bhutan. Eur. J. Plant Pathol. 2020, 158, 655–665. [Google Scholar] [CrossRef]
- Choi, G.-S.; Kim, J.-H.; Lee, D.-H.; Kim, J.-S.; Ryu, K.-H. Occurrence and distribution of viruses infecting pepper in Korea. Plant Pathol. J. 2005, 21, 258–261. [Google Scholar] [CrossRef] [Green Version]
- Cho, J.-D.; Kim, J.-S.; Lee, S.-H.; Choi, G.-S.; Chung, B.-N. Viruses and symptoms on peppers, and their infection types in Korea. Plant Dis. 2007, 13, 75–81. [Google Scholar] [CrossRef]
- Kwon, S.-J.; Cho, I.-S.; Yoon, J.-Y.; Chung, B.-N. Incidence and occurrence pattern of viruses on peppers growing in fields in Korea. Res. Plant Dis. 2018, 24, 66–74. [Google Scholar] [CrossRef]
- Mun, H.Y.; Park, M.-R.; Lee, H.B.; Kim, K.-H. Outbreak of cucumber mosaic virus and tomato spotted wilt virus on bell pepper grown in Jeonnam province in Korea. Plant Pathol. J. 2008, 24, 93–96. [Google Scholar] [CrossRef] [Green Version]
- Murphy, J.F.; Bowen, K.L. Synergistic disease in pepper caused by the mixed infection of Cucumber mosaic virus and Pepper mottle virus. Phytopathology 2006, 96, 240–247. [Google Scholar] [CrossRef] [Green Version]
- Wetter, C.; Conti, M.; Altschuh, D.; Tabillion, R.; Van Regenmortel, M. Pepper mild mottle virus, a tobamovirus infecting pepper cultivars in Sicily. Phytopathology 1984, 74, 405–410. [Google Scholar] [CrossRef]
- Ali, A.; Kobayashi, M. Seed transmission of Cucumber mosaic virus in pepper. J. Virol. Methods 2010, 163, 234–237. [Google Scholar] [CrossRef]
- Roggero, P.; Masenga, V.; Tavella, L. Field isolates of Tomato spotted wilt virus overcoming resistance in pepper and their spread to other hosts in Italy. Plant Dis. 2002, 86, 950–954. [Google Scholar] [CrossRef] [Green Version]
- Jackson, C.R.; Randolph, K.C.; Osborn, S.L.; Tyler, H.L. Culture dependent and independent analysis of bacterial communities associated with commercial salad leaf vegetables. BMC Microbiol. 2013, 13, 274. [Google Scholar] [CrossRef] [PubMed] [Green Version]
- Klindworth, A.; Pruesse, E.; Schweer, T.; Peplies, J.; Quast, C.; Horn, M.; Glöckner, F.O. Evaluation of general 16S ribosomal RNA gene PCR primers for classical and next-generation sequencing-based diversity studies. Nucleic Acids Res. 2013, 41, e1. [Google Scholar] [CrossRef] [PubMed]
- Schoch, C.L.; Seifert, K.A.; Huhndorf, S.; Robert, V.; Spouge, J.L.; Levesque, C.A.; Chen, W.; Consortium, F.B. Nuclear ribosomal internal transcribed spacer (ITS) region as a universal DNA barcode marker for Fungi. Proc. Natl. Acad. Sci. USA 2012, 109, 6241–6246. [Google Scholar] [CrossRef] [PubMed] [Green Version]
- Venter, J.C.; Remington, K.; Heidelberg, J.F.; Halpern, A.L.; Rusch, D.; Eisen, J.A.; Wu, D.; Paulsen, I.; Nelson, K.E.; Nelson, W. Environmental genome shotgun sequencing of the Sargasso Sea. Science 2004, 304, 66–74. [Google Scholar] [CrossRef] [PubMed] [Green Version]
- Eisen, J.A. Environmental shotgun sequencing: Its potential and challenges for studying the hidden world of microbes. PLoS Biol. 2007, 5, e82. [Google Scholar] [CrossRef] [PubMed]
- Jo, Y.; Choi, H.; Lian, S.; Cho, J.K.; Chu, H.; Cho, W.K. Identification of viruses infecting six plum cultivars in Korea by RNA-sequencing. PeerJ 2020, 8, e9588. [Google Scholar] [CrossRef] [PubMed]
- Xu, C.; Sun, X.; Taylor, A.; Jiao, C.; Xu, Y.; Cai, X.; Wang, X.; Ge, C.; Pan, G.; Wang, Q. Diversity, distribution, and evolution of tomato viruses in China uncovered by small RNA sequencing. J. Virol. 2017, 91, e00173-17. [Google Scholar] [CrossRef] [Green Version]
- Emerson, J.B.; Adams, R.I.; Román, C.M.B.; Brooks, B.; Coil, D.A.; Dahlhausen, K.; Ganz, H.H.; Hartmann, E.M.; Hsu, T.; Justice, N.B. Schrödinger’s microbes: Tools for distinguishing the living from the dead in microbial ecosystems. Microbiome 2017, 5, 86. [Google Scholar] [CrossRef]
- Wood, D.E.; Lu, J.; Langmead, B. Improved metagenomic analysis with Kraken 2. Genome Biol. 2019, 20, 257. [Google Scholar] [CrossRef] [Green Version]
- Huson, D.H.; Auch, A.F.; Qi, J.; Schuster, S.C. MEGAN analysis of metagenomic data. Genome Res. 2007, 17, 377–386. [Google Scholar] [CrossRef] [PubMed] [Green Version]
- Liu, H.; Brettell, L.E.; Singh, B. Linking the phyllosphere microbiome to plant health. Trends Plant Sci. 2020, 25, 841–844. [Google Scholar] [CrossRef] [PubMed]
- Rastogi, G.; Sbodio, A.; Tech, J.J.; Suslow, T.V.; Coaker, G.L.; Leveau, J.H. Leaf microbiota in an agroecosystem: Spatiotemporal variation in bacterial community composition on field-grown lettuce. ISME J. 2012, 6, 1812–1822. [Google Scholar] [CrossRef]
- Mamphogoro, T.P.; Maboko, M.M.; Babalola, O.O.; Aiyegoro, O.A. Bacterial communities associated with the surface of fresh sweet pepper (Capsicum annuum) and their potential as biocontrol. Sci. Rep. 2020, 10, 8560. [Google Scholar] [CrossRef] [PubMed]
- Montes-Osuna, N.; Gómez-Lama Cabanás, C.G.-L.; Valverde-Corredor, A.; Berendsen, R.L.; Prieto, P.; Mercado-Blanco, J. Assessing the involvement of selected phenotypes of Pseudomonas simiae PICF7 in olive root colonization and biological control of Verticillium dahliae. Plants 2021, 10, 412. [Google Scholar] [CrossRef] [PubMed]
- Kumari, S.; Vaishnav, A.; Jain, S.; Varma, A.; Choudhary, D.K. Induced drought tolerance through wild and mutant bacterial strain Pseudomonas simiae in mung bean (Vigna radiata L.). World J. Microbiol. Biotechnol. 2016, 32, 4. [Google Scholar] [CrossRef] [PubMed]
- Vaishnav, A.; Choudhary, D.K. Regulation of drought-responsive gene expression in Glycine max l. Merrill is mediated through Pseudomonas simiae strain AU. J. Plant Growth Regul. 2019, 38, 333–342. [Google Scholar] [CrossRef]
- Barash, I.; Manulis-Sasson, S. Recent evolution of bacterial pathogens: The gall-forming Pantoea agglomerans case. Annu. Rev. Phytopathol. 2009, 47, 133–152. [Google Scholar] [CrossRef]
- Cruz, A.T.; Cazacu, A.C.; Allen, C.H. Pantoea agglomerans, a plant pathogen causing human disease. J. Clin. Microbiol. 2007, 45, 1989–1992. [Google Scholar] [CrossRef] [Green Version]
- Utkhede, R.; Mathur, S. Fusarium fruit rot of greenhouse sweet peppers in Canada. Plant Dis. 2003, 87, 100. [Google Scholar] [CrossRef]
- Zhang, C.; Wang, W.; Diao, Y.; Liu, X. First report of Diaporthe nobilis causing fruit decay of pepper in China. Plant Dis. 2016, 100, 1948. [Google Scholar] [CrossRef]
- Jo, Y.; Choi, H.; Kim, S.-M.; Kim, S.-L.; Lee, B.C.; Cho, W.K. The pepper virome: Natural co-infection of diverse viruses and their quasispecies. BMC Genom. 2017, 18, 453. [Google Scholar] [CrossRef] [PubMed] [Green Version]
- Choi, H.; Jo, Y.; Cho, W.K.; Yu, J.; Tran, P.-T.; Salaipeth, L.; Kwak, H.-R.; Choi, H.-S.; Kim, K.-H. Identification of viruses and viroids infecting tomato and pepper plants in Vietnam by metatranscriptomics. Int. J. Mol. Sci. 2020, 21, 7565. [Google Scholar] [CrossRef] [PubMed]
- Fukuhara, T. Endornaviruses: Persistent dsRNA viruses with symbiotic properties in diverse eukaryotes. Virus Genes 2019, 55, 165–173. [Google Scholar] [CrossRef] [PubMed]
- Kwon, O.-H.; Lee, J.-H.; Jang, K.-S.; Kim, D.-J.; Kim, C.-Y.; Jeon, S.-G.; Kwon, J.-B.; Jung, H.-Y. Incidence of viral diseases on red pepper in Yeongyang-Gun, Gyeongbuk provice. Res. Plant Dis. 2017, 23, 234–240. [Google Scholar] [CrossRef]
- Roy, D.; Panchal, S.; Rosa, B.A.; Melotto, M. Escherichia coli O157: H7 induces stronger plant immunity than Salmonella enterica Typhimurium SL1344. Phytopathology 2013, 103, 326–332. [Google Scholar] [CrossRef] [Green Version]
- Lu, J.; Breitwieser, F.P.; Thielen, P.; Salzberg, S.L. Bracken: Estimating species abundance in metagenomics data. PeerJ Comput. Sci. 2017, 3, e104. [Google Scholar] [CrossRef]
- Buchfink, B.; Xie, C.; Huson, D.H. Fast and sensitive protein alignment using DIAMOND. Nat. Methods 2015, 12, 59–60. [Google Scholar] [CrossRef]
- Nurk, S.; Meleshko, D.; Korobeynikov, A.; Pevzner, P.A. metaSPAdes: A new versatile metagenomic assembler. Genome Res. 2017, 27, 824–834. [Google Scholar] [CrossRef] [Green Version]
- Grabherr, M.G.; Haas, B.J.; Yassour, M.; Levin, J.Z.; Thompson, D.A.; Amit, I.; Adiconis, X.; Fan, L.; Raychowdhury, R.; Zeng, Q. Trinity: Reconstructing a full-length transcriptome without a genome from RNA-Seq data. Nat. Botech. 2011, 29, 644–652. [Google Scholar] [CrossRef] [Green Version]
- Dixon, P. VEGAN, a package of R functions for community ecology. J. Veg. Sci. 2003, 14, 927–930. [Google Scholar] [CrossRef]


Publisher’s Note: MDPI stays neutral with regard to jurisdictional claims in published maps and institutional affiliations. |
© 2021 by the authors. Licensee MDPI, Basel, Switzerland. This article is an open access article distributed under the terms and conditions of the Creative Commons Attribution (CC BY) license (https://creativecommons.org/licenses/by/4.0/).
Share and Cite
Jo, Y.; Back, C.-G.; Kim, K.-H.; Chu, H.; Lee, J.H.; Moh, S.H.; Cho, W.K. Comparative Study of Metagenomics and Metatranscriptomics to Reveal Microbiomes in Overwintering Pepper Fruits. Int. J. Mol. Sci. 2021, 22, 6202. https://0-doi-org.brum.beds.ac.uk/10.3390/ijms22126202
Jo Y, Back C-G, Kim K-H, Chu H, Lee JH, Moh SH, Cho WK. Comparative Study of Metagenomics and Metatranscriptomics to Reveal Microbiomes in Overwintering Pepper Fruits. International Journal of Molecular Sciences. 2021; 22(12):6202. https://0-doi-org.brum.beds.ac.uk/10.3390/ijms22126202
Chicago/Turabian StyleJo, Yeonhwa, Chang-Gi Back, Kook-Hyung Kim, Hyosub Chu, Jeong Hun Lee, Sang Hyun Moh, and Won Kyong Cho. 2021. "Comparative Study of Metagenomics and Metatranscriptomics to Reveal Microbiomes in Overwintering Pepper Fruits" International Journal of Molecular Sciences 22, no. 12: 6202. https://0-doi-org.brum.beds.ac.uk/10.3390/ijms22126202