
Responsiveness to Hedgehog Pathway Inhibitors in T-Cell Acute Lymphoblastic Leukemia Cells Is Highly Dependent on 5′AMP-Activated Kinase Inactivation

 , , , and
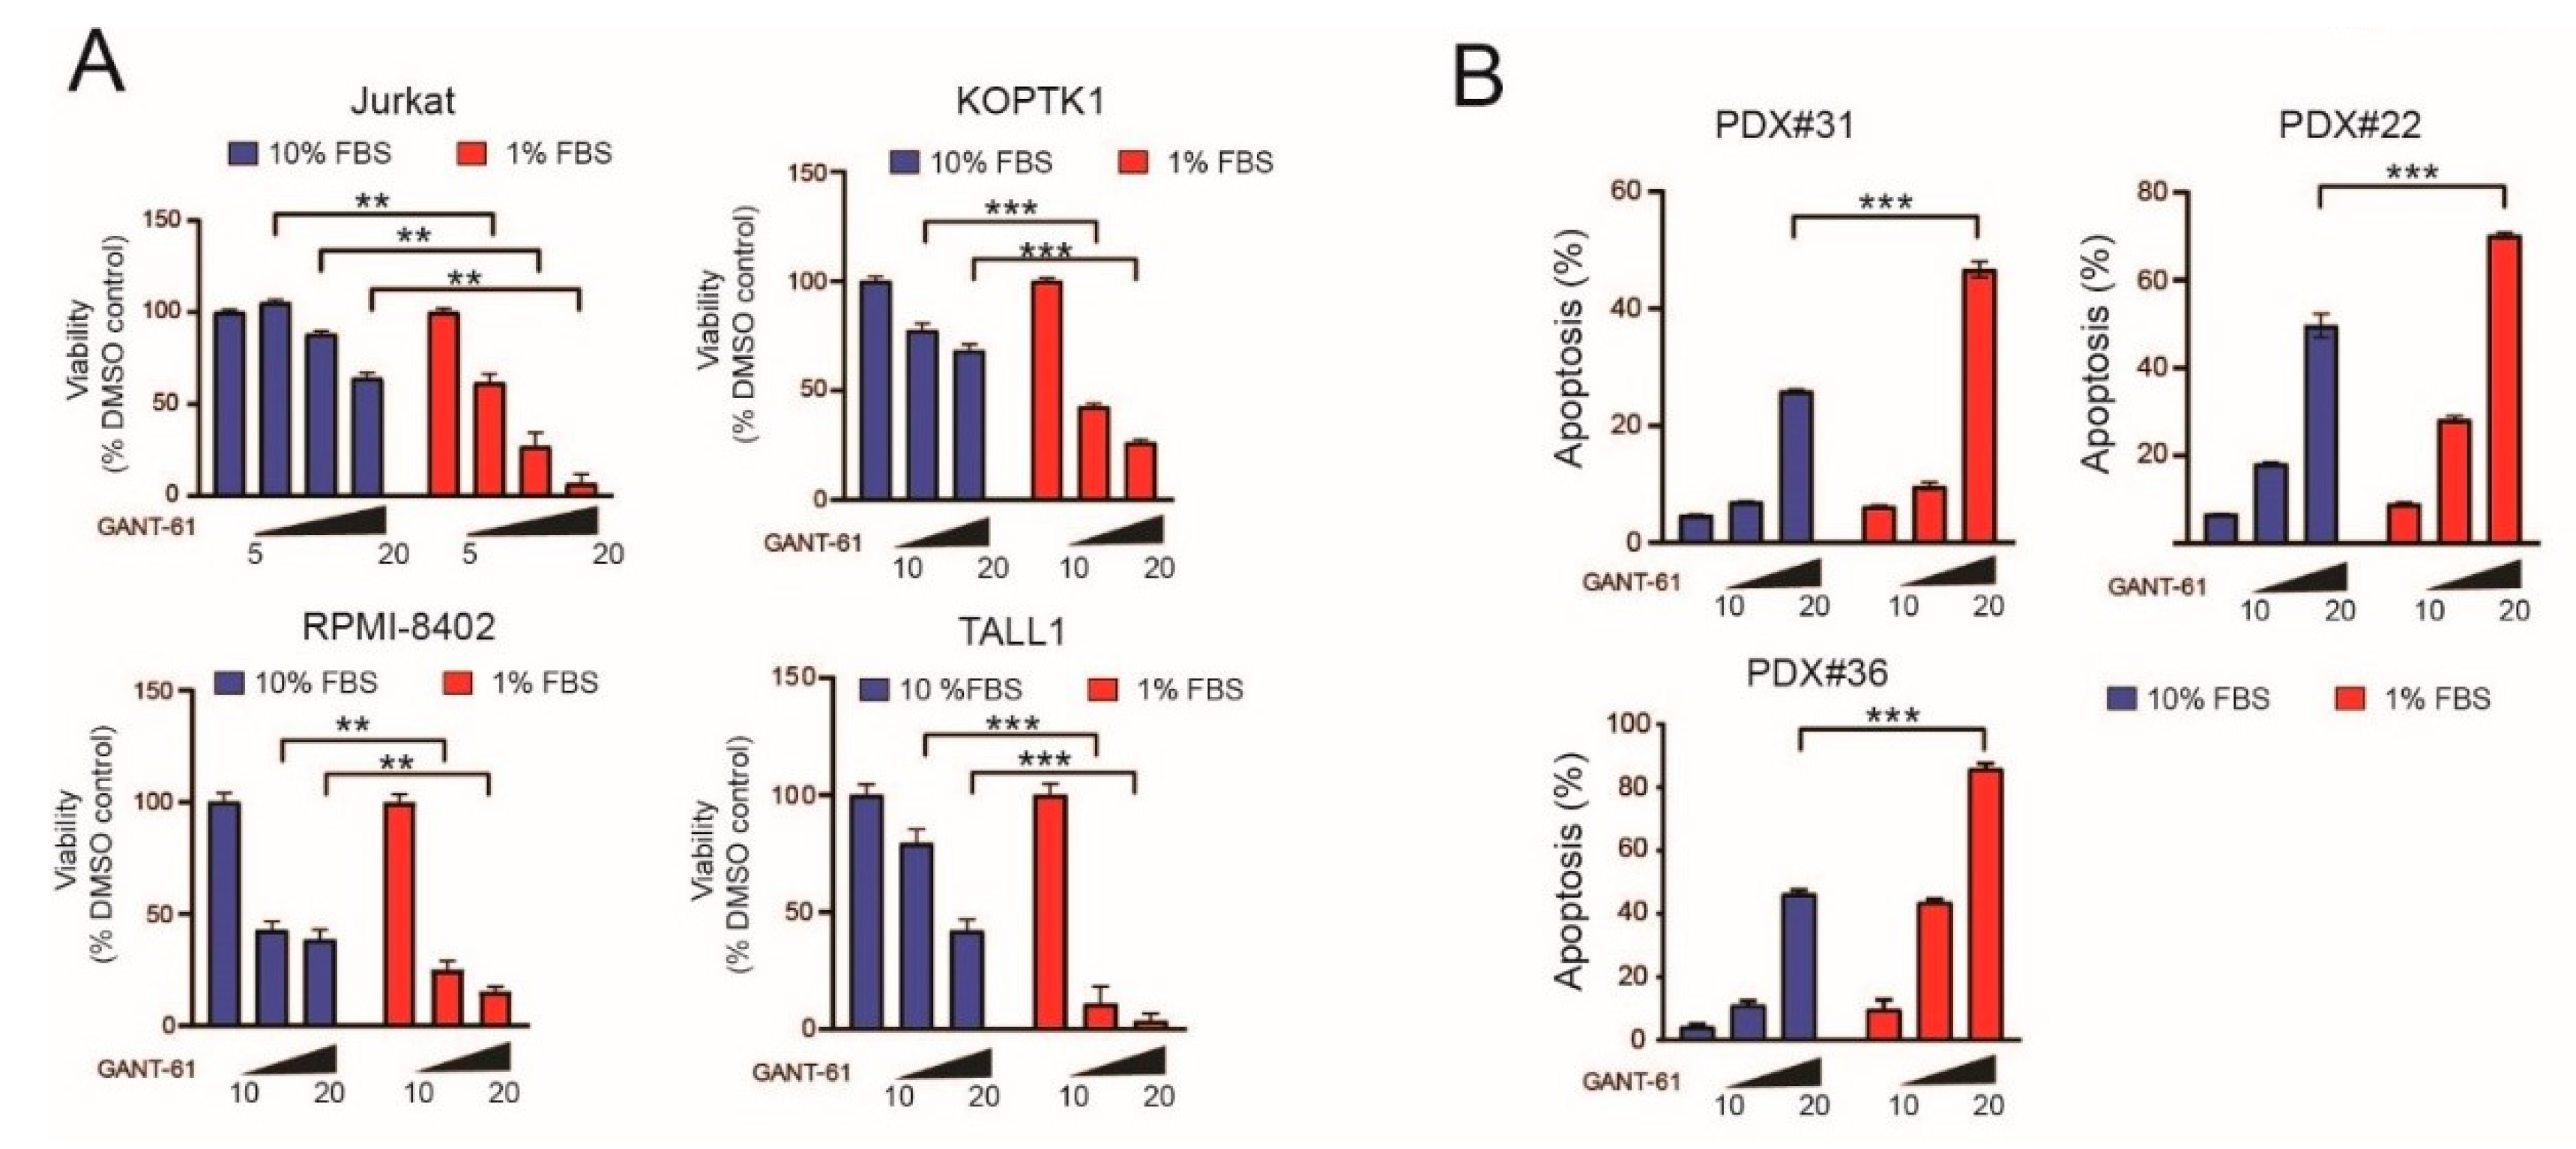
Abstract
:1. Introduction
2. Results
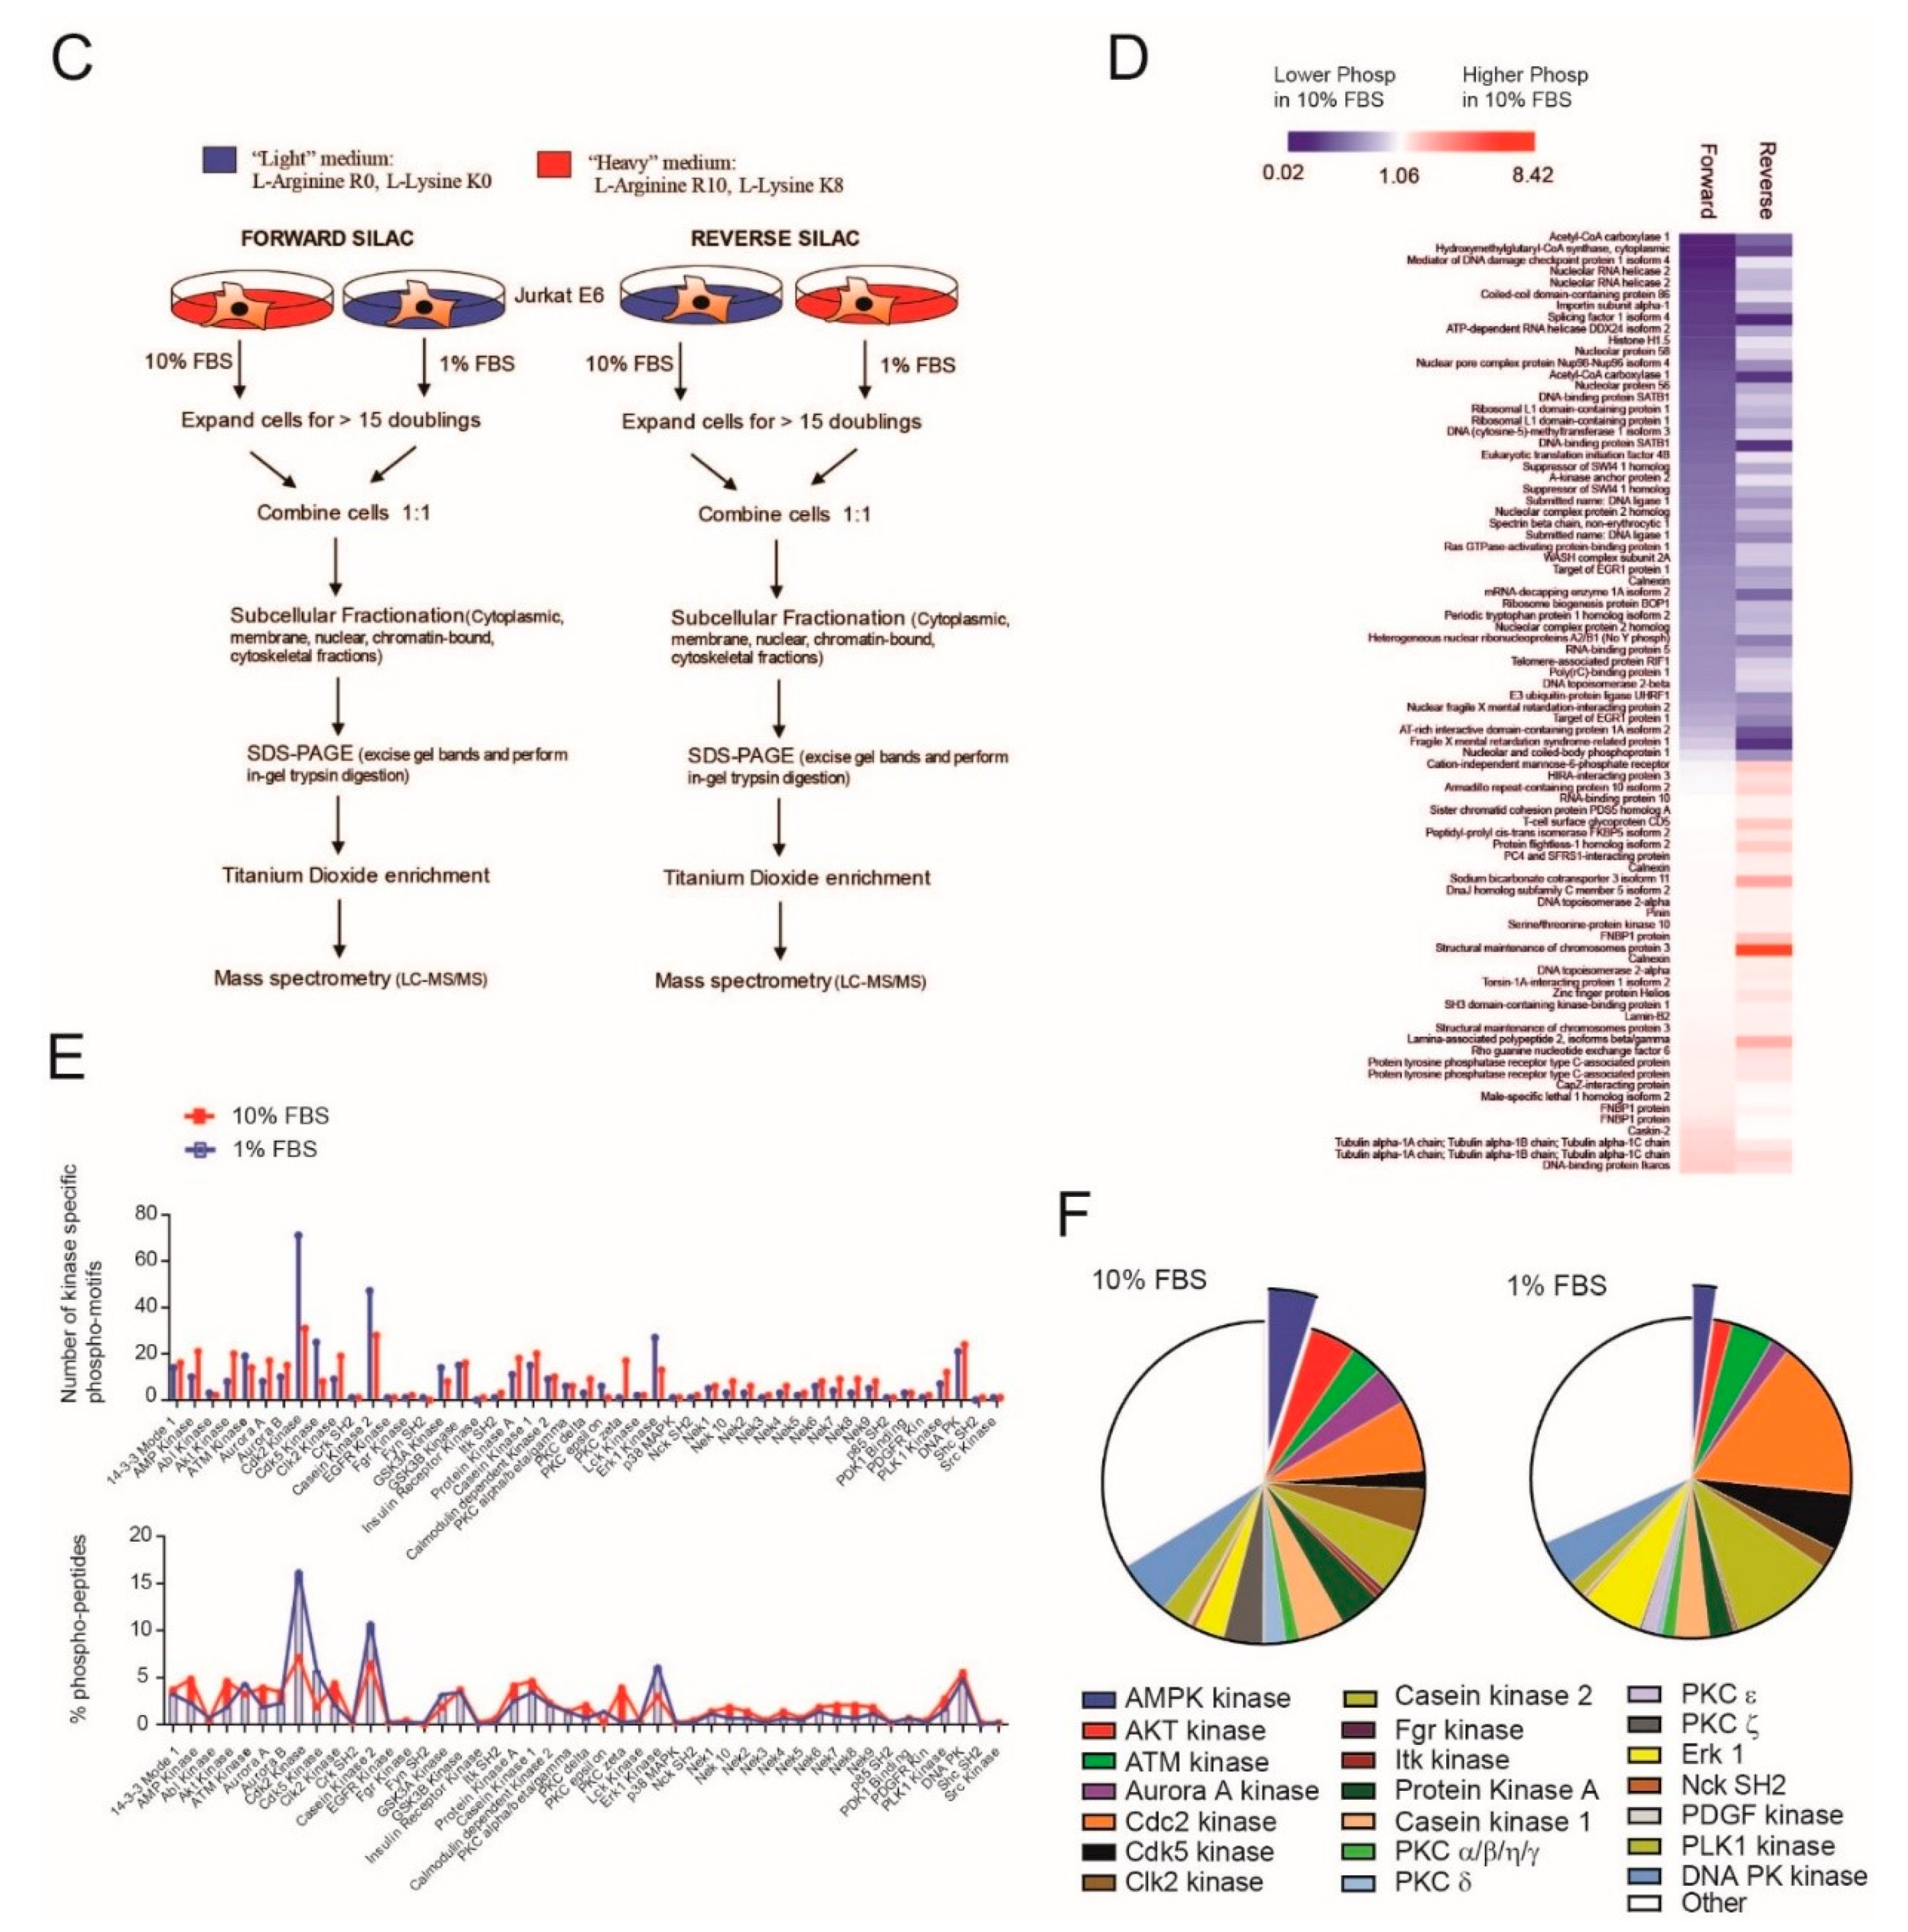
2.1. Serum Deprivation Increases Responsiveness to GANT-61 and Determines Decreased AMPK Signaling and Increased mTORC1 Signaling
2.2. Genetic Inactivation or Pharmacological Inhibition of AMPK Stabilizes GLI1 Proteins in T-ALL Cells
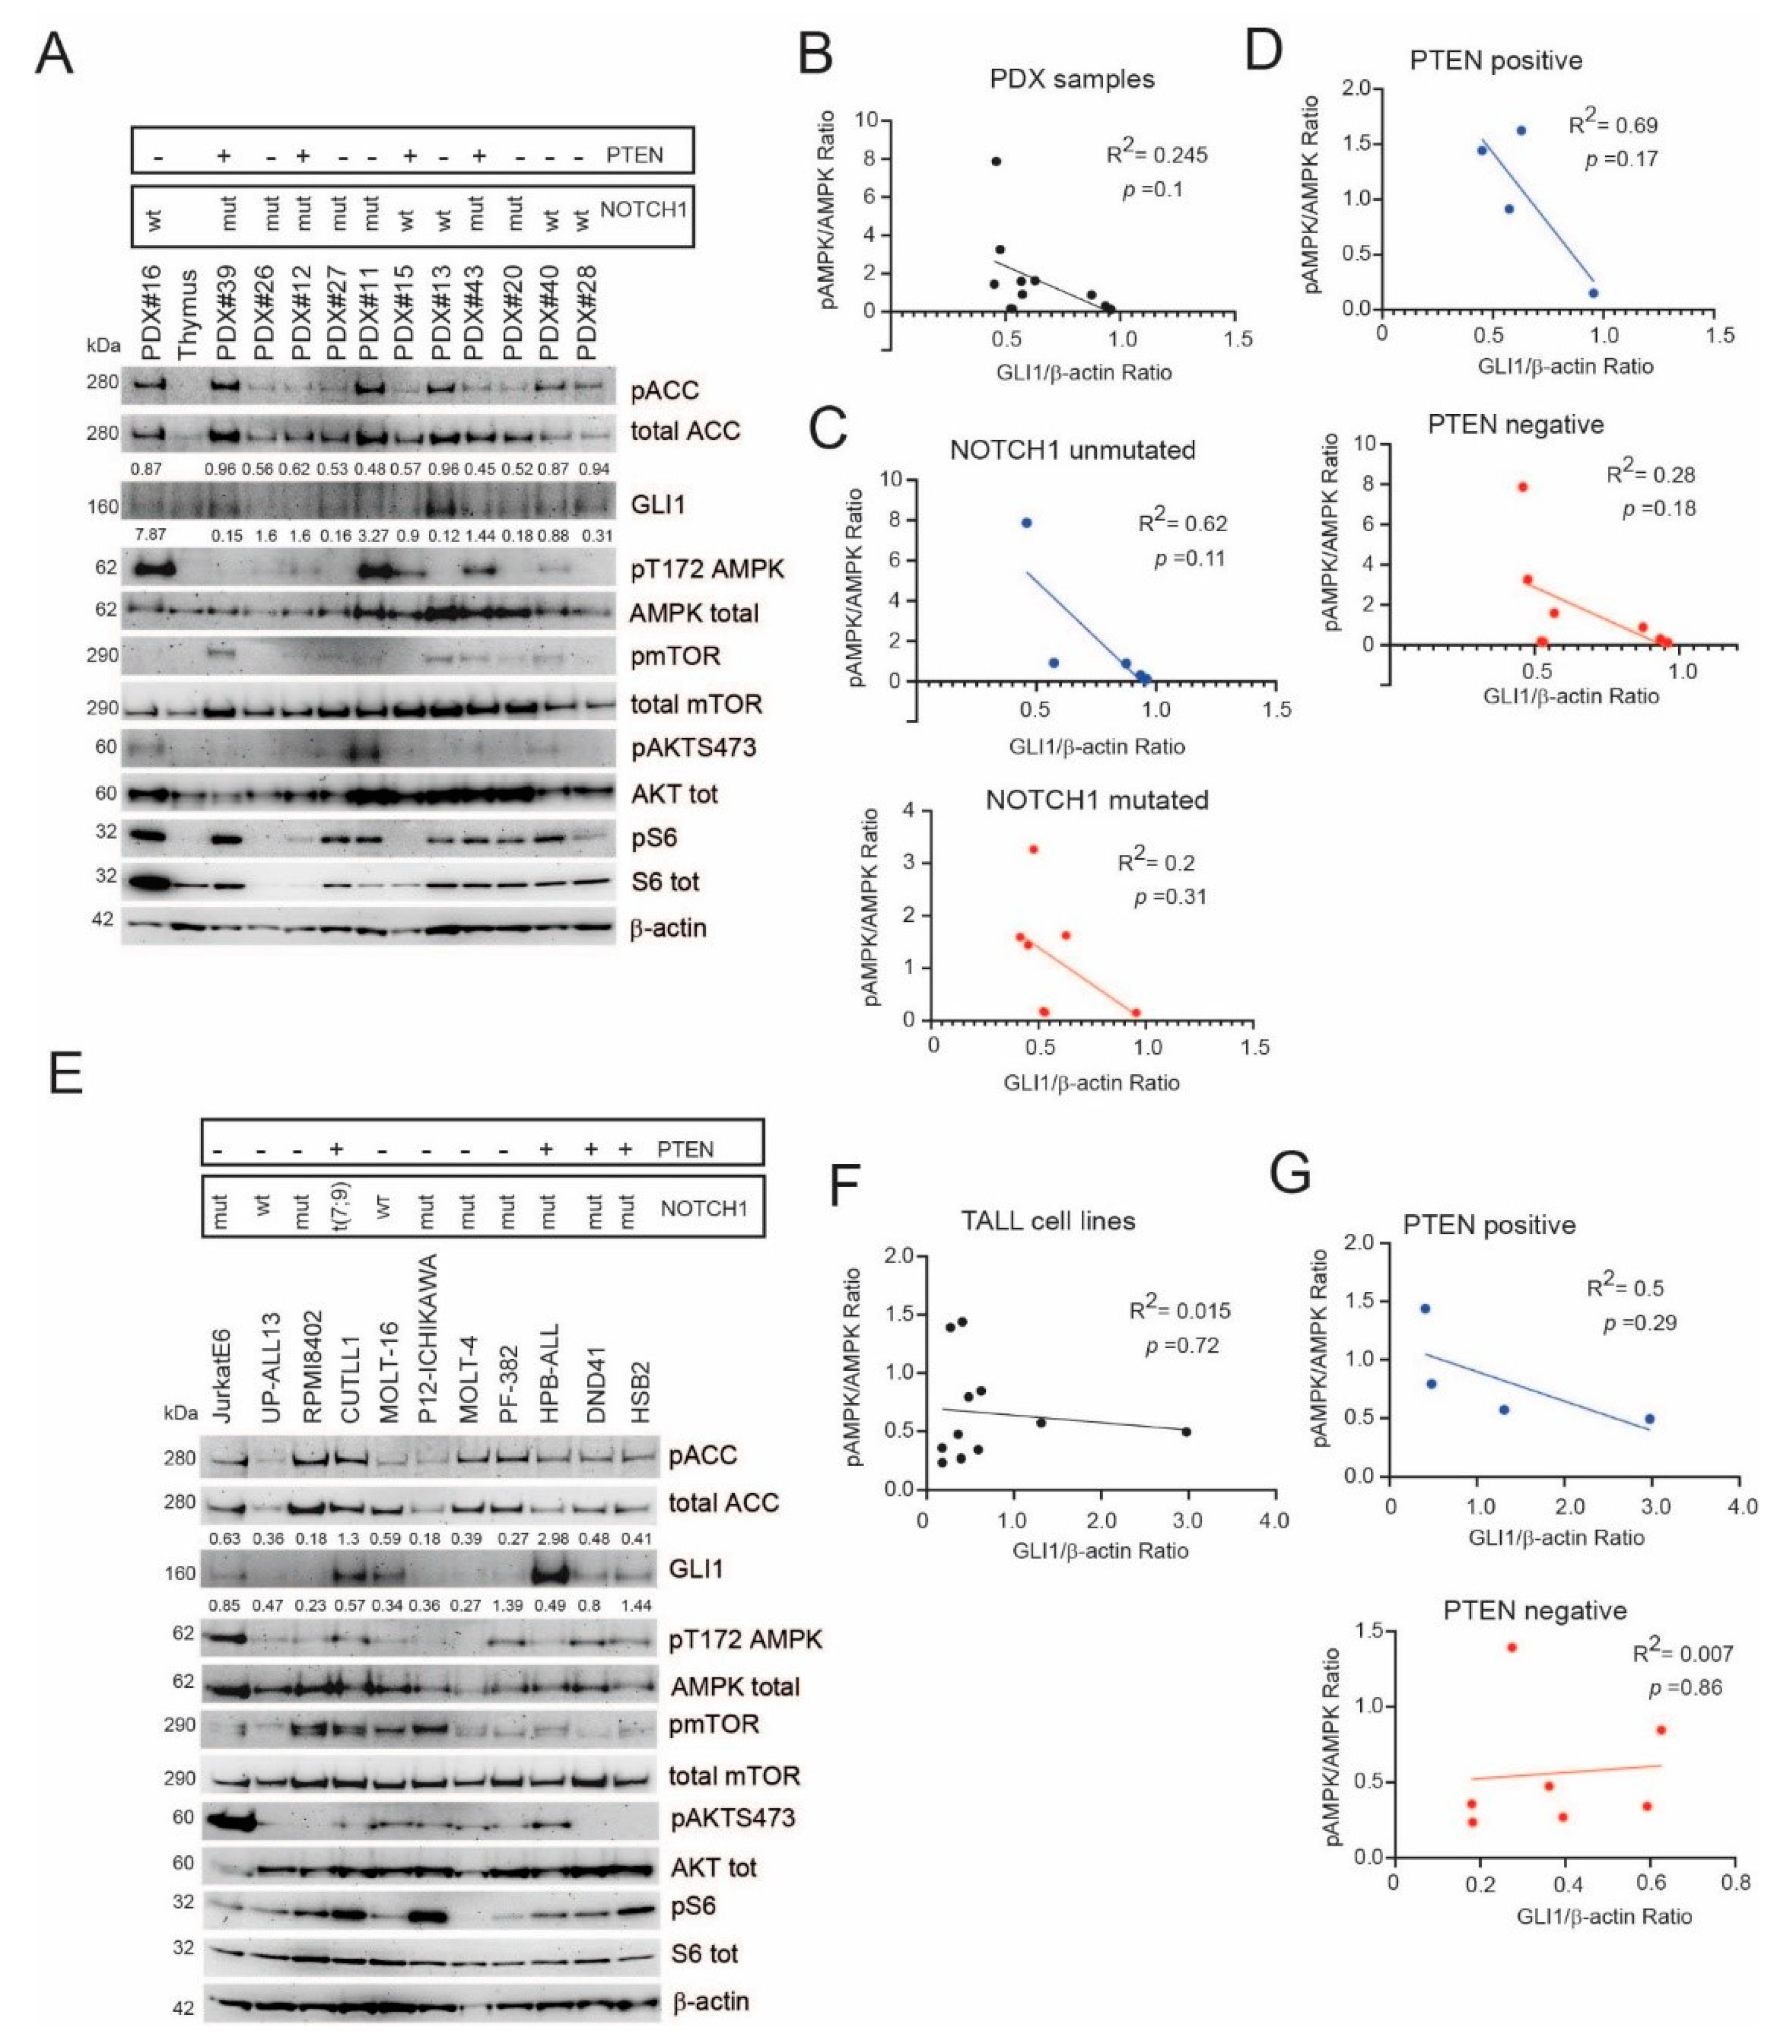
2.3. A Subgroup of T-ALL Samples Demonstrates an Inverse Relationship between GLI1 Expression Levels and AMPK Signaling Activation
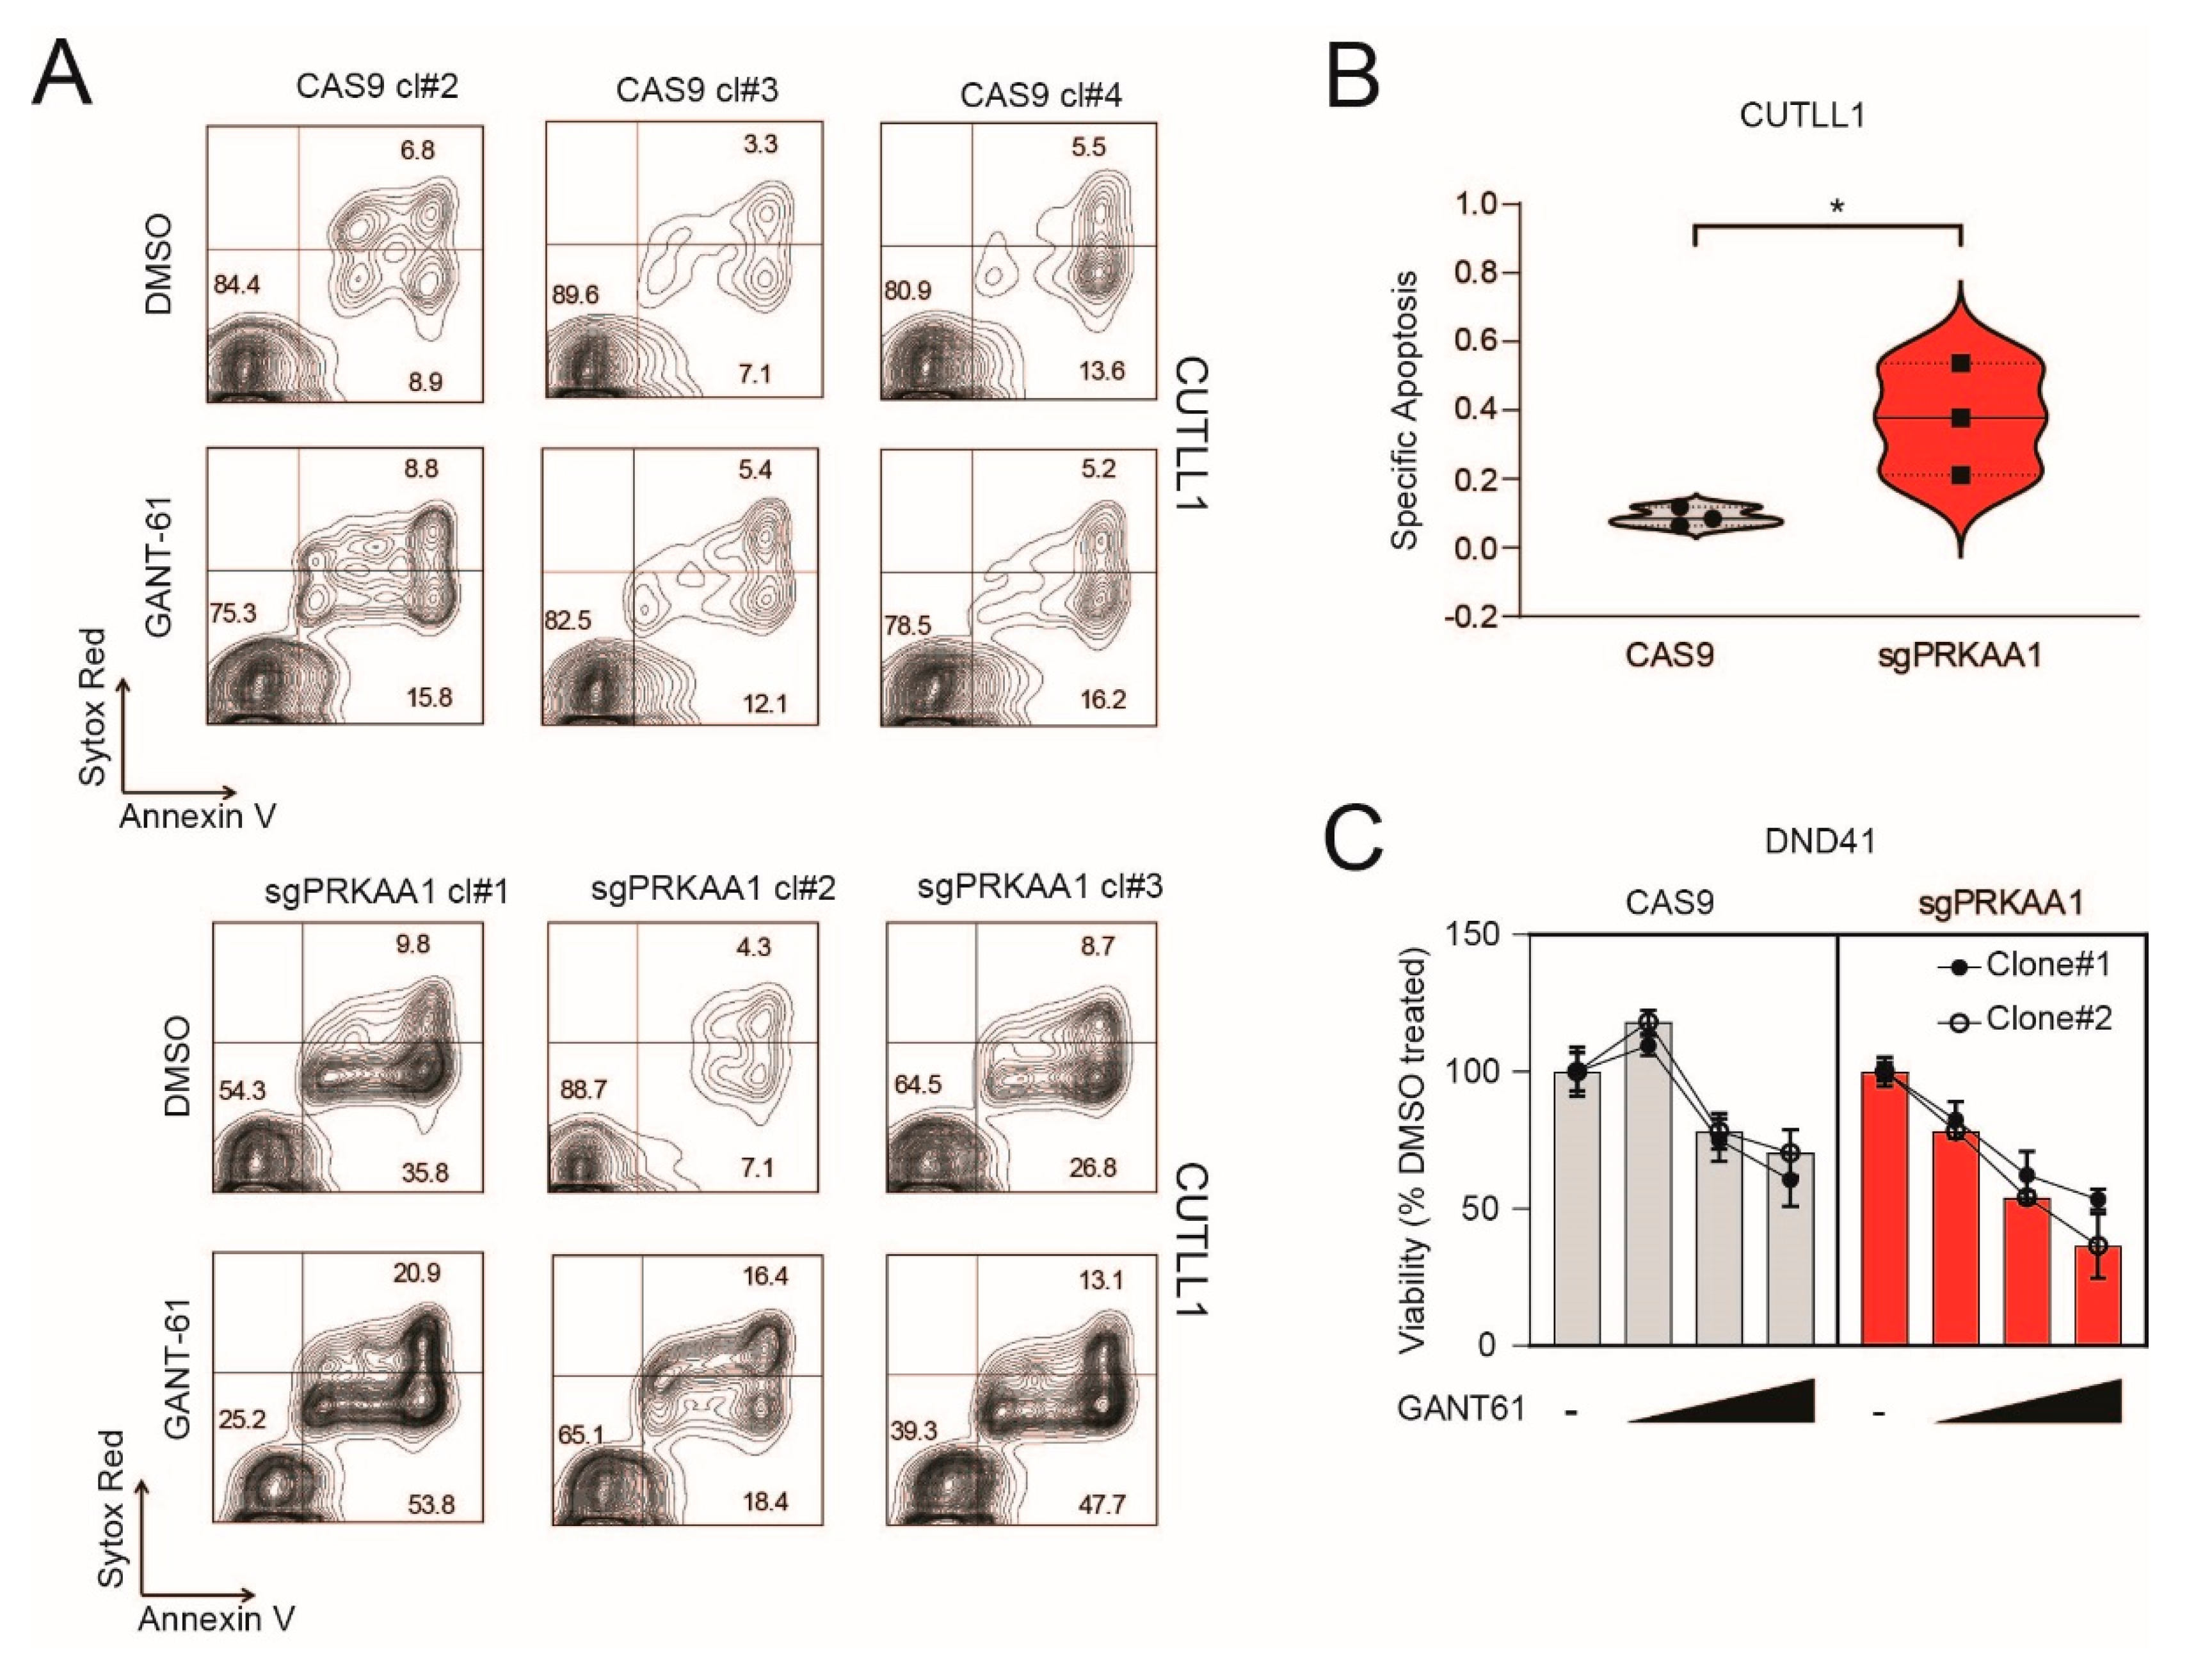
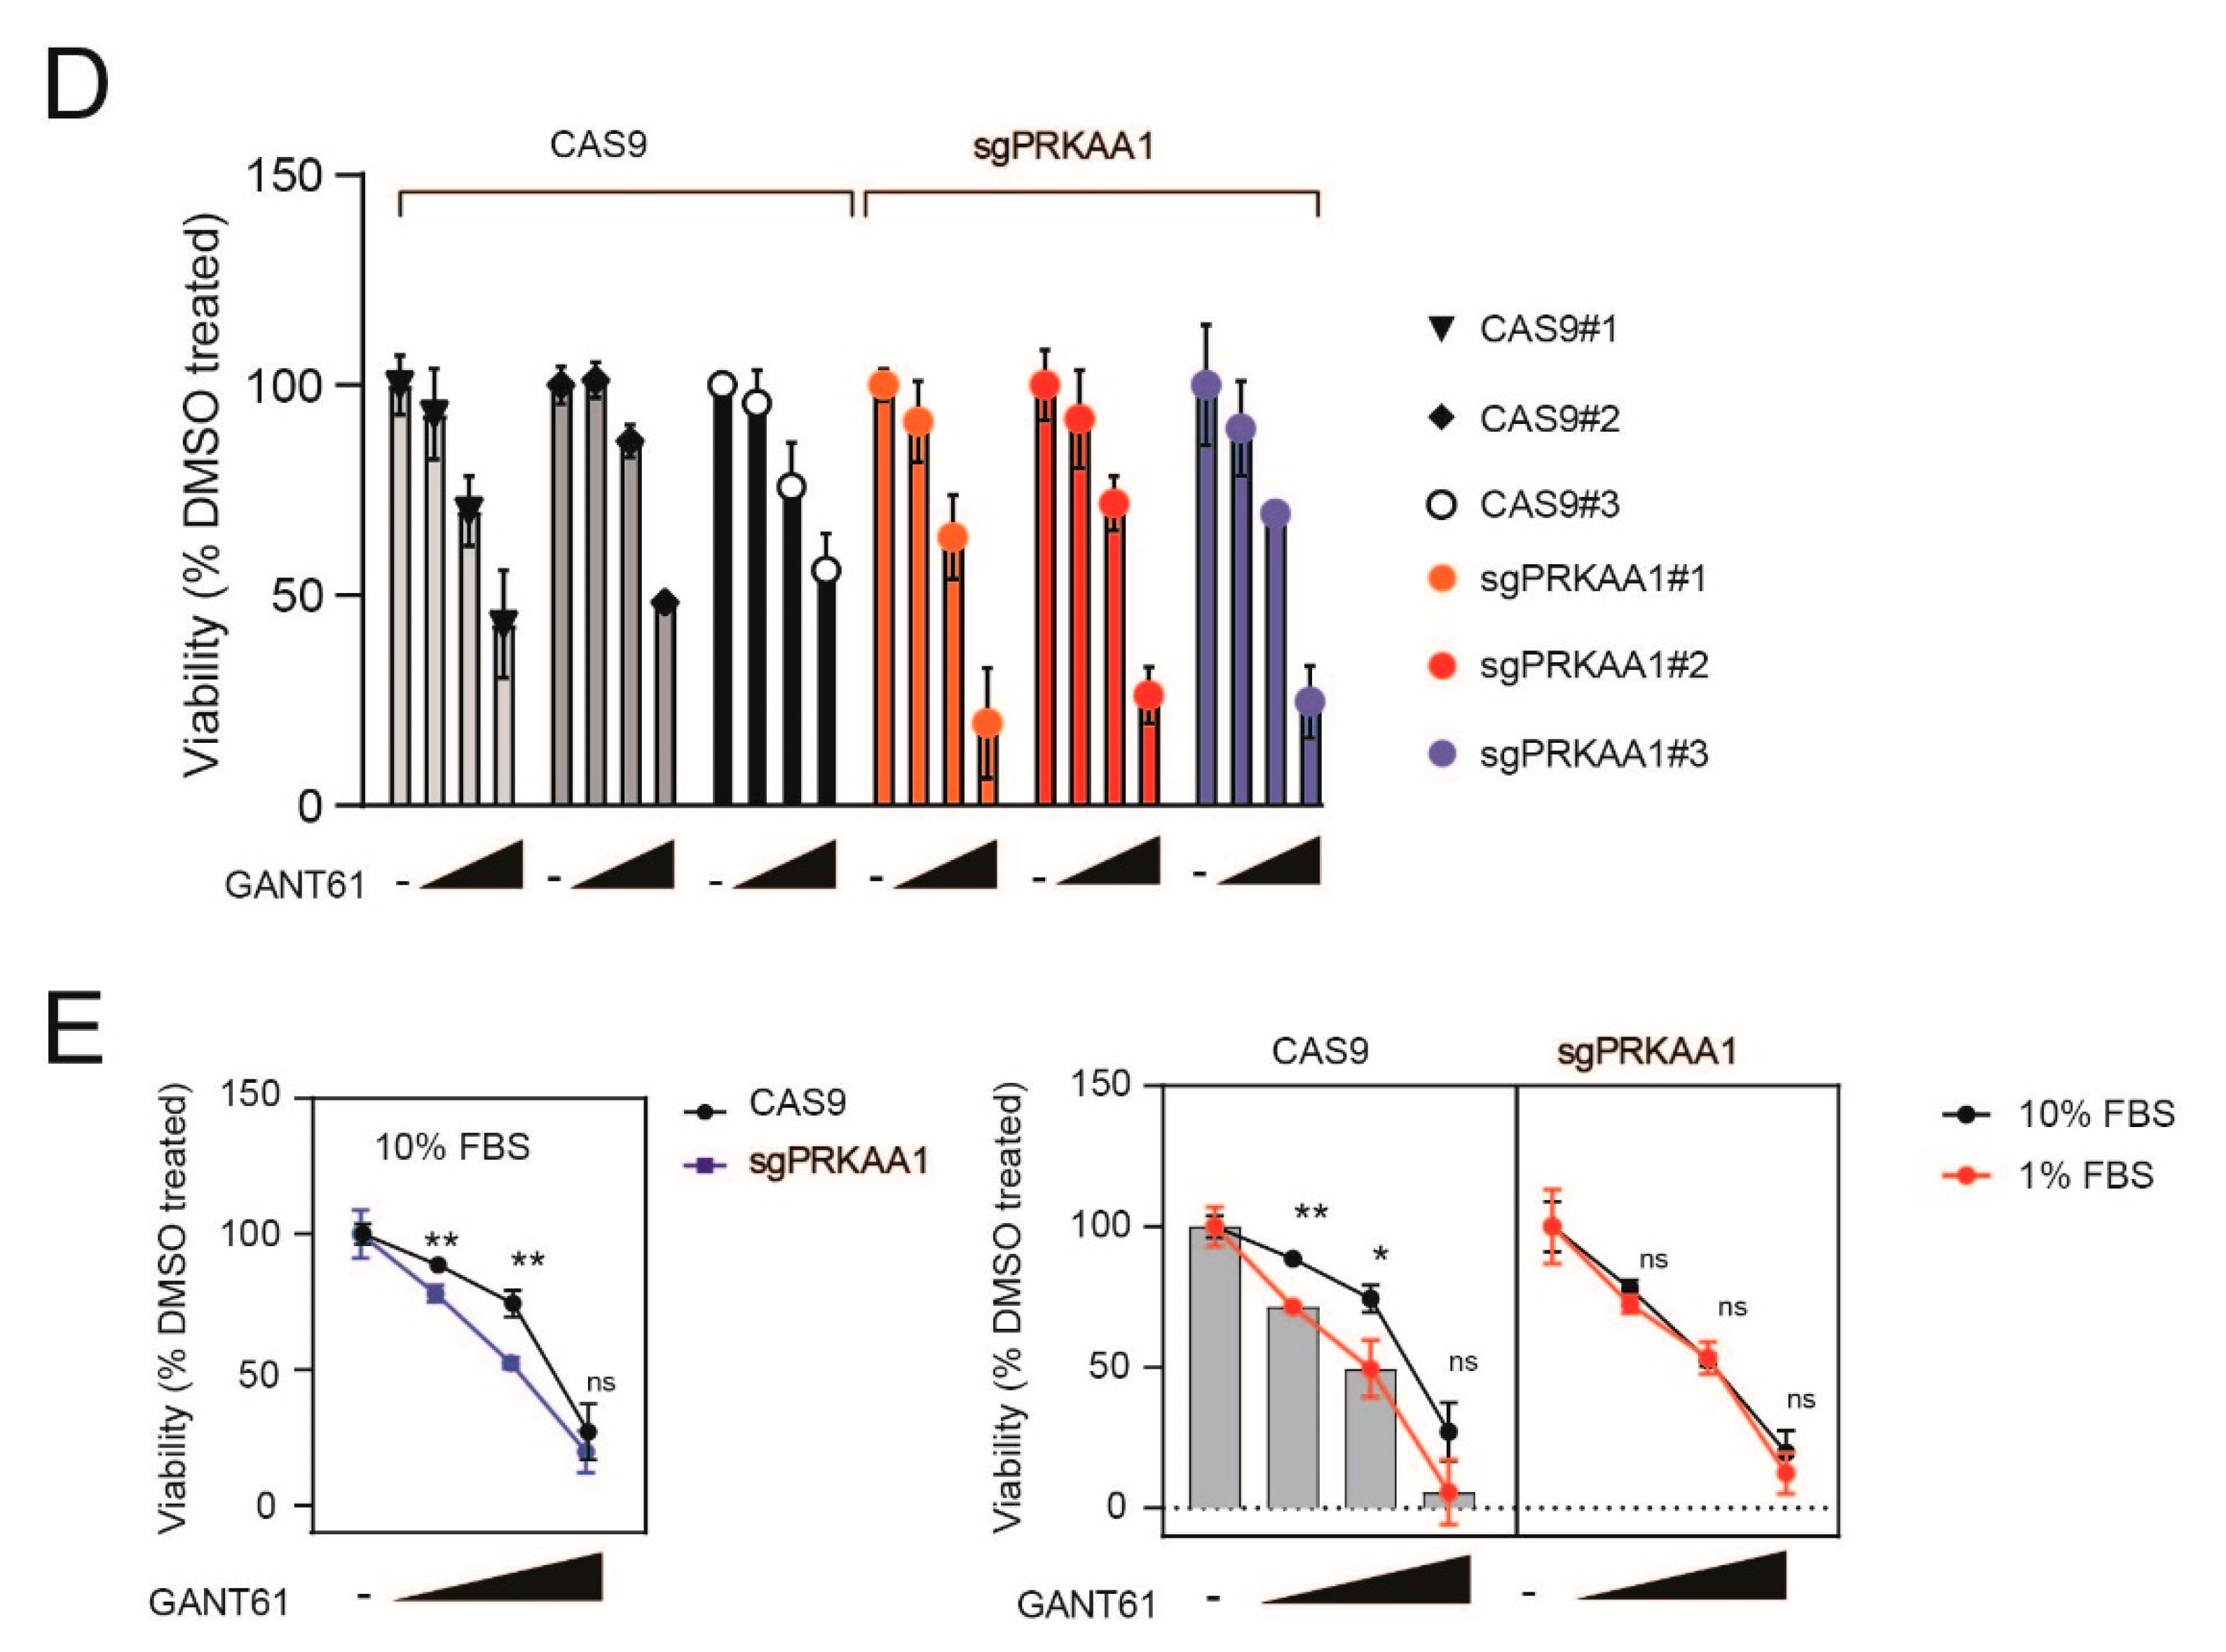
2.4. Genetic Inactivation of AMPK Increases Sensitivity to GANT-61 in T-ALL Cells
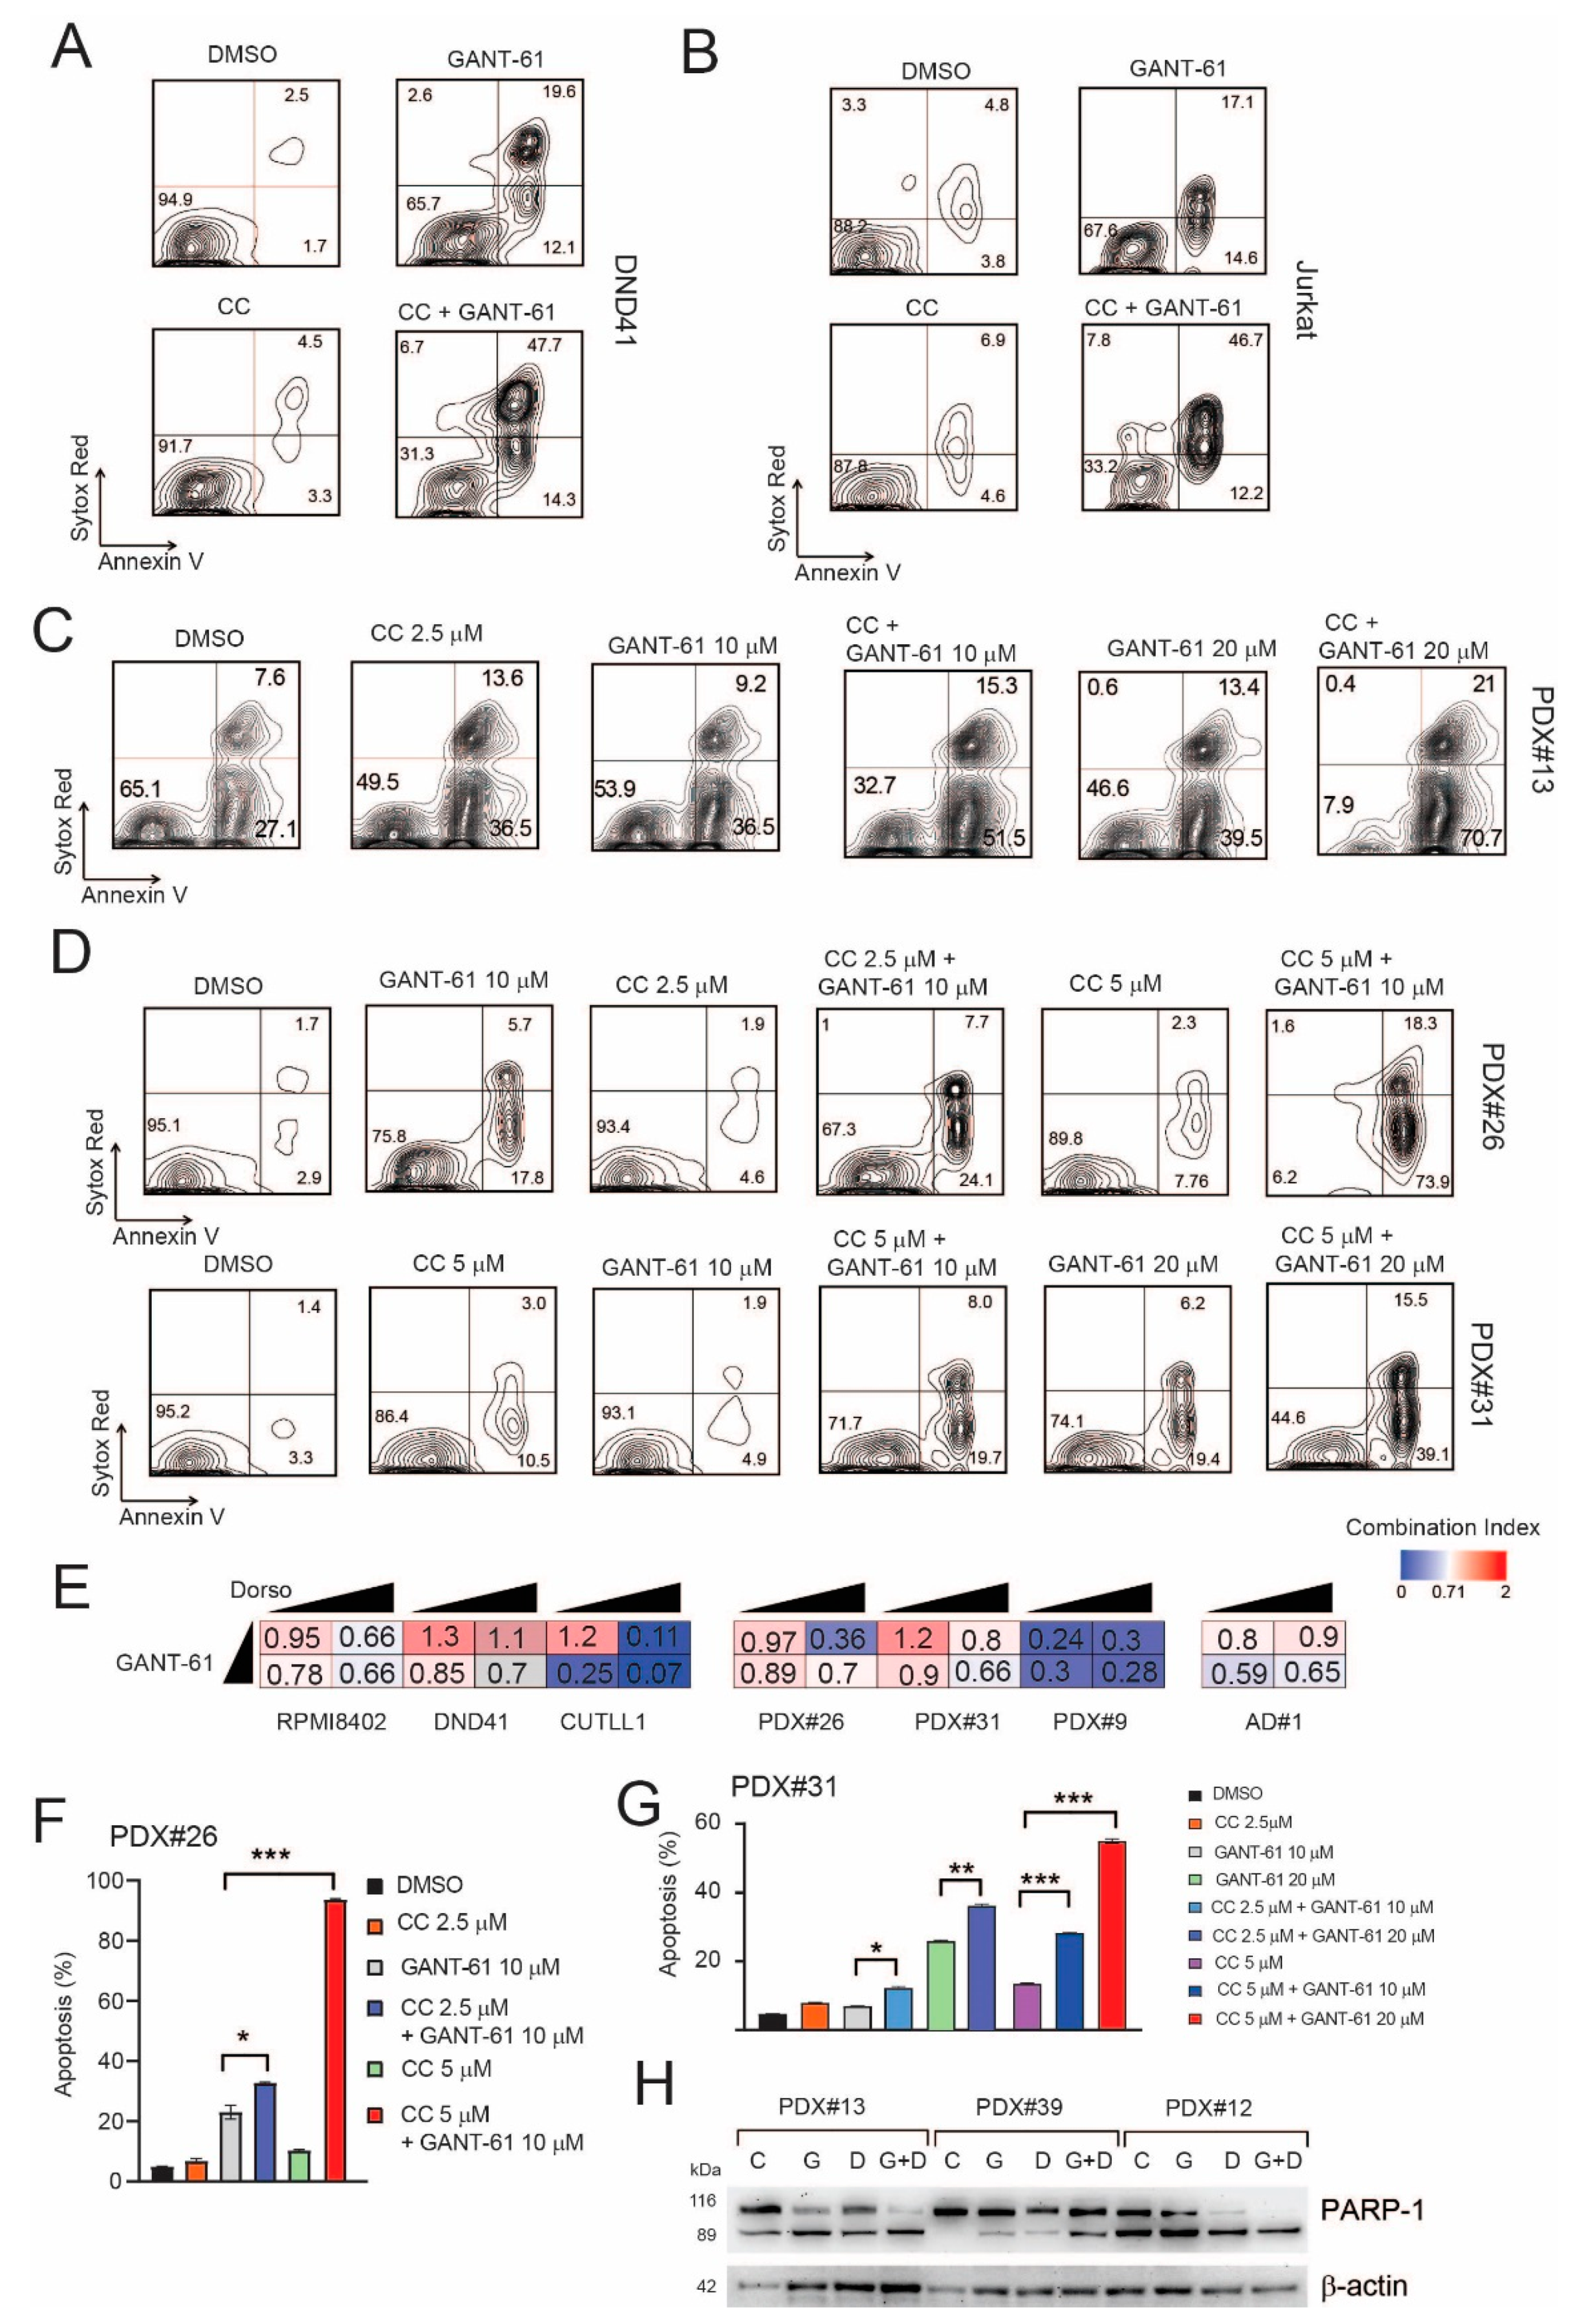
2.5. Pharmacological Inhibition of AMPK Sensitizes T-ALL Cells to the Cytotoxic Effects of GANT-61
3. Discussion
4. Materials and Methods
4.1. Cell Culture and Stable Isotope Labeling
4.2. Phosphopeptide Enrichment
4.3. LC-MS/MS and Data Analysis
4.4. Cell Lines and In Vitro Treatments
4.5. T-ALL Xenografts
4.6. Cell Viability and Flow Cytometry Analysis
4.7. Plasmids and Lentiviral Production
4.8. Immunoblotting
4.9. Dual Luciferase Reporter Assays
4.10. Statistical Analysis
Supplementary Materials
Author Contributions
Funding
Institutional Review Board Statement
Informed Consent Statement
Data Availability Statement
Acknowledgments
Conflicts of Interest
References
- Belver, L.; Ferrando, A. The genetics and mechanisms of T cell acute lymphoblastic leukaemia. Nat. Rev. Cancer 2016, 16, 494–507. [Google Scholar] [CrossRef]
- Jiang, Y.; Nakada, D. Cell intrinsic and extrinsic regulation of leukemia cell metabolism. Int. J. Hematol. 2016, 103, 607–616. [Google Scholar] [CrossRef] [Green Version]
- Saito, Y.; Chapple, R.H.; Lin, A.; Kitano, A.; Nakada, D. AMPK Protects Leukemia-Initiating Cells in Myeloid Leukemias from Metabolic Stress in the Bone Marrow. Cell Stem Cell 2015, 17, 585–596. [Google Scholar] [CrossRef] [Green Version]
- Pisco, A.O.; Huang, S. Non-genetic cancer cell plasticity and therapy-induced stemness in tumour relapse: ‘What does not kill me strengthens me’. Br. J. Cancer 2015, 112, 1725–1732. [Google Scholar] [CrossRef] [Green Version]
- Yoshida, G.J.; Saya, H. Therapeutic strategies targeting cancer stem cells. Cancer Sci. 2016, 107, 5–11. [Google Scholar] [CrossRef]
- Mar, B.G.; Amakye, D.; Aifantis, I.; Buonamici, S. The controversial role of the Hedgehog pathway in normal and malignant hematopoiesis. Leukemia 2011, 25, 1665–1673. [Google Scholar] [CrossRef] [Green Version]
- Amakye, D.; Jagani, Z.; Dorsch, M. Unraveling the therapeutic potential of the Hedgehog pathway in cancer. Nat. Med. 2013, 19, 1410–1422. [Google Scholar] [CrossRef]
- Borah, A.; Raveendran, S.; Rochani, A.; Maekawa, T.; Kumar, S. Targeting self-renewal pathways in cancer stem cells: Clinical implications for cancer therapy. Oncogenesis 2015, 4, e177. [Google Scholar] [CrossRef] [Green Version]
- Bongiovanni, D.; Saccomani, V.; Piovan, E. Aberrant Signaling Pathways in T-Cell Acute Lymphoblastic Leukemia. Int. J. Mol. Sci. 2017, 18, 1904. [Google Scholar] [CrossRef] [Green Version]
- Faubert, B.; Vincent, E.; Poffenberger, M.C.; Jones, R.G. The AMP-activated protein kinase (AMPK) and cancer: Many faces of a metabolic regulator. Cancer Lett. 2015, 356, 165–170. [Google Scholar] [CrossRef]
- Hardie, D.G.; Ross, F.A.; Hawley, S.A. AMPK: A nutrient and energy sensor that maintains energy homeostasis. Nat. Rev. Mol. Cell Biol. 2012, 13, 251–262. [Google Scholar] [CrossRef] [Green Version]
- Mihaylova, M.M.; Shaw, R.J. The AMPK signalling pathway coordinates cell growth, autophagy and metabolism. Nat. Cell Biol. 2011, 13, 1016–1023. [Google Scholar] [CrossRef]
- Mavrakis, K.J.; Wolfe, A.L.; Oricchio, E.; Palomero, T.; De Keersmaecker, K.; McJunkin, K.; Zuber, J.; James, T.; Khan, A.A.; Leslie, C.S.; et al. Genome-wide RNA-mediated interference screen identifies miR-19 targets in Notch-induced T-cell acute lymphoblastic leukaemia. Nat. Cell Biol. 2010, 12, 372–379. [Google Scholar] [CrossRef] [Green Version]
- Grimaldi, C.; Chiarini, F.; Tabellini, G.; Ricci, F.; Tazzari, P.L.; Battistelli, M.; Falcieri, E.; Bortul, R.; Melchionda, F.; Iacobucci, I.; et al. AMP-dependent kinase/mammalian target of rapamycin complex 1 signaling in T-cell acute lymphoblastic leukemia: Therapeutic implications. Leukemia 2012, 26, 91–100. [Google Scholar] [CrossRef] [Green Version]
- Sengupta, T.K.; Leclerc, G.M.; Hsieh-Kinser, T.T.; Leclerc, G.J.; Singh, I.; Barredo, J.C. Cytotoxic effect of 5-aminoimidazole-4-carboxamide-1-beta-4-ribofuranoside (AICAR) on childhood acute lymphoblastic leukemia (ALL) cells: Implication for targeted therapy. Mol. Cancer 2007, 6, 46. [Google Scholar] [CrossRef] [PubMed] [Green Version]
- Leclerc, G.M.; Leclerc, G.J.; Kuznetsov, J.N.; DeSalvo, J.; Barredo, J.C. Metformin Induces Apoptosis through AMPK-Dependent Inhibition of UPR Signaling in ALL Lymphoblasts. PLoS ONE 2013, 8, e74420. [Google Scholar] [CrossRef]
- Kishton, R.J.; Barnes, C.E.; Nichols, A.G.; Cohen, S.; Gerriets, V.A.; Siska, P.J.; Macintyre, A.; Goraksha-Hicks, P.; de Cubas, A.A.; Liu, T.; et al. AMPK Is Essential to Balance Glycolysis and Mitochondrial Metabolism to Control T-ALL Cell Stress and Survival. Cell Metab. 2016, 23, 649–662. [Google Scholar] [CrossRef] [Green Version]
- Accordi, B.; Galla, L.; Milani, G.; Curtarello, M.; Serafin, V.; Lissandron, V.; Viola, G.; te Kronnie, G.; De Maria, R.; Petricoin, E.F., III; et al. AMPK inhibition enhances apoptosis in MLL-rearranged pediatric B-acute lymphoblastic leukemia cells. Leukemia 2013, 27, 1019–1027. [Google Scholar] [CrossRef]
- Li, Y.-H.; Luo, J.; Mosley, Y.-Y.C.; Hedrick, V.E.; Paul, L.N.; Chang, J.; Zhang, G.; Wang, Y.-K.; Banko, M.R.; Brunet, A.; et al. AMP-Activated Protein Kinase Directly Phosphorylates and Destabilizes Hedgehog Pathway Transcription Factor GLI1 in Medulloblastoma. Cell Rep. 2015, 12, 599–609. [Google Scholar] [CrossRef] [Green Version]
- Di Magno, L.; Basile, A.; Coni, S.; Manni, S.; Sdruscia, G.; D’Amico, D.; Antonucci, L.; Infante, P.; De Smaele, E.; Cucchi, D.; et al. The energy sensor AMPK regulates Hedgehog signaling in human cells through a unique Gli1 metabolic checkpoint. Oncotarget 2016, 7, 9538–9549. [Google Scholar] [CrossRef] [Green Version]
- Dagklis, A.; Demeyer, S.; De Bie, J.; Radaelli, E.; Pauwels, D.; Degryse, S.; Gielen, O.; Vicente, C.; Vandepoel, R.; Geerdens, E.; et al. Hedgehog pathway activation in T-cell acute lymphoblastic leukemia predicts response to SMO and GLI1 inhibitors. Blood 2016, 128, 2642–2654. [Google Scholar] [CrossRef] [Green Version]
- Tosello, V.; Bongiovanni, D.; Liu, J.; Pan, Q.; Yan, K.-K.; Saccomani, V.; Van Trimpont, M.; Pizzi, M.; Mazzoni, M.; Tos, A.P.D.; et al. Cross-talk between GLI transcription factors and FOXC1 promotes T-cell acute lymphoblastic leukemia dissemination. Leukemia 2020, 35, 984–1000. [Google Scholar] [CrossRef]
- Bongiovanni, D.; Tosello, V.; Saccomani, V.; Santa, S.D.; Amadori, A.; Zanovello, P.; Piovan, E. Crosstalk between Hedgehog pathway and the glucocorticoid receptor pathway as a basis for combination therapy in T-cell acute lymphoblastic leukemia. Oncogene 2020, 39, 1–12. [Google Scholar] [CrossRef] [PubMed]
- Lin, E.-H.; Kao, Y.-R.; Lin, C.-A.; Kuo, T.-Y.; Yang, S.-P.; Hsu, C.-F.; Chou, T.-Y.; Ho, C.-C.; Wu, C.-W. Hedgehog pathway maintains cell survival under stress conditions, and drives drug resistance in lung adenocarcinoma. Oncotarget 2016, 7, 24179–24193. [Google Scholar] [CrossRef] [PubMed] [Green Version]
- Liu, H.; Kiseleva, A.A.; Golemis, E.A. Ciliary signalling in cancer. Nat. Rev. Cancer 2018, 18, 511–524. [Google Scholar] [CrossRef] [PubMed]
- Wang, Y.; Ding, Q.; Yen, C.-J.; Xia, W.; Izzo, J.G.; Lang, J.-Y.; Li, C.-W.; Hsu, J.L.; Miller, S.A.; Wang, X.; et al. The Crosstalk of mTOR/S6K1 and Hedgehog Pathways. Cancer Cell 2012, 21, 374–387. [Google Scholar] [CrossRef] [Green Version]
- Inoki, K.; Zhu, T.; Guan, K.-L. TSC2 Mediates Cellular Energy Response to Control Cell Growth and Survival. Cell 2003, 115, 577–590. [Google Scholar] [CrossRef] [Green Version]
- Gwinn, D.M.; Shackelford, D.B.; Egan, D.F.; Mihaylova, M.M.; Mery, A.; Vasquez, D.S.; Turk, B.E.; Shaw, R.J. AMPK Phosphorylation of Raptor Mediates a Metabolic Checkpoint. Mol. Cell 2008, 30, 214–226. [Google Scholar] [CrossRef] [Green Version]
- Corton, J.M.; Gillespie, J.G.; Hawley, S.A.; Hardie, D.G. 5-aminoimidazole-4-carboxamide ribonucleoside. A specific method for activating AMP-activated protein kinase in intact cells? Eur. J. Biochem. 1995, 229, 558–565. [Google Scholar] [CrossRef]
- Zhou, G.; Myers, R.; Li, Y.; Chen, Y.; Shen, X.; Fenyk-Melody, J.; Wu, M.; Ventre, J.; Doebber, T.; Fujii, N.; et al. Role of AMP-activated protein kinase in mechanism of metformin action. J. Clin. Investig. 2001, 108, 1167–1174. [Google Scholar] [CrossRef]
- MacIver, N.; Blagih, J.; Saucillo, D.C.; Tonelli, L.; Griss, T.; Rathmell, J.C.; Jones, R.G. The Liver Kinase B1 Is a Central Regulator of T Cell Development, Activation, and Metabolism. J. Immunol. 2011, 187, 4187–4198. [Google Scholar] [CrossRef]
- Egan, D.F.; Chun, M.G.; Vamos, M.; Zou, H.; Rong, J.; Miller, C.J.; Lou, H.J.; Raveendra-Panickar, D.; Yang, C.-C.; Sheffler, D.J.; et al. Small Molecule Inhibition of the Autophagy Kinase ULK1 and Identification of ULK1 Substrates. Mol. Cell 2015, 59, 285–297. [Google Scholar] [CrossRef] [Green Version]
- Dite, T.A.; Langendorf, C.; Hoque, A.; Galic, S.; Rebello, R.J.; Ovens, A.J.; Lindqvist, L.M.; Ngoei, K.R.; Ling, N.; Furic, L.; et al. AMP-activated protein kinase selectively inhibited by the type II inhibitor SBI-0206965. J. Biol. Chem. 2018, 293, 8874–8885. [Google Scholar] [CrossRef] [Green Version]
- Kar, S.; Deb, M.; Sengupta, D.; Shilpi, A.; Bhutia, S.K.; Patra, S.K. Intricacies of hedgehog signaling pathways: A perspective in tumorigenesis. Exp. Cell Res. 2012, 318, 1959–1972. [Google Scholar] [CrossRef]
- Burns, M.A.; Liao, Z.W.; Yamagata, N.; Pouliot, G.P.; Stevenson, K.E.; Neuberg, D.S.; Thorner, A.R.; Ducar, M.; Silverman, E.A.; Hunger, S.P.; et al. Hedgehog pathway mutations drive oncogenic transformation in high-risk T-cell acute lymphoblastic leukemia. Leukemia 2018, 32, 2126–2137. [Google Scholar] [CrossRef]
- Pandolfi, S.; Stecca, B. Cooperative integration between HEDGEHOG-GLI signalling and other oncogenic pathways: Implications for cancer therapy. Expert Rev. Mol. Med. 2015, 17, e5. [Google Scholar] [CrossRef]
- Ananieva, E.A.; Wilkinson, A.C. Branched-chain amino acid metabolism in cancer. Curr. Opin. Clin. Nutr. Metab. Care 2018, 21, 64–70. [Google Scholar] [CrossRef] [Green Version]
- Evangelisti, C.; Chiarini, F.; McCubrey, J.A.; Martelli, A.M. Therapeutic Targeting of mTOR in T-Cell Acute Lymphoblastic Leukemia: An Update. Int. J. Mol. Sci. 2018, 19, 1878. [Google Scholar] [CrossRef] [Green Version]
- Bain, J.; Plater, L.; Elliott, M.; Shpiro, N.; Hastie, J.; Mclauchlan, H.; Klevernic, I.; Arthur, J.S.C.; Alessi, D.; Cohen, P. The selectivity of protein kinase inhibitors: A further update. Biochem. J. 2007, 408, 297–315. [Google Scholar] [CrossRef] [Green Version]
- Silva, A.; Yunes, J.A.; Cardoso, B.; Martins, L.R.; Jotta, P.Y.; Abecasis, M.; Nowill, A.E.; Leslie, N.R.; Cardoso, A.A.; Barata, J.T. PTEN posttranslational inactivation and hyperactivation of the PI3K/Akt pathway sustain primary T cell leukemia viability. J. Clin. Investig. 2008, 118, 3762–3774. [Google Scholar] [CrossRef] [Green Version]
- Jotta, P.Y.; Ganazza, M.A.; Silva, A.; Viana, M.; Da Silva, M.J.; Zambaldi, L.J.G.; Barata, J.T.; Brandalise, S.R.; Yunes, J.A. Negative prognostic impact of PTEN mutation in pediatric T-cell acute lymphoblastic leukemia. Leukemia 2010, 24, 239–242. [Google Scholar] [CrossRef] [Green Version]
- Arrigoni, G.; Pagano, M.A.; Sarno, S.; Cesaro, L.; James, P.; Pinna, L.A. Mass spectrometry analysis of a protein kinase CK2beta subunit interactome isolated from mouse brain by affinity chromatography. J. Proteome Res. 2008, 7, 990–1000. [Google Scholar] [CrossRef]
- Salvi, M.; Trashi, E.; Cozza, G.; Franchin, C.; Arrigoni, G.; Pinna, L. Investigation on PLK2 and PLK3 substrate recognition. Biochim. Biophys. Acta 2012, 1824, 1366–1373. [Google Scholar] [CrossRef]
- Tosello, V.; Milani, G.; Martines, A.; Macri, N.; Van Loocke, W.; Matthijssens, F.; Buldini, B.; Minuzzo, S.; Bongiovanni, D.; Schumacher, R.F.; et al. A Novel t(8;14)(q24;q11) Rearranged Human Cell Line as a Model for Mechanistic and Drug Discovery Studies of NOTCH1-Independent Human T-Cell Leukemia. Cells 2018, 7, 160. [Google Scholar] [CrossRef] [Green Version]
- Agnusdei, V.; Minuzzo, S.A.; Frasson, C.; Grassi, A.; Axelrod, F.; Satyal, S.; Gurney, A.; Hoey, T.; Seganfreddo, E.; Basso, G.; et al. Therapeutic antibody targeting of Notch1 in T-acute lymphoblastic leukemia xenografts. Leukemia 2013, 28, 278–288. [Google Scholar] [CrossRef]
- Epling-Burnette, P.; Liu, J.H.; Catlett-Falcone, R.; Turkson, J.; Oshiro, M.; Kothapalli, R.; Li, Y.; Wang, J.-M.; Yang-Yen, H.-F.; Karras, J.; et al. Inhibition of STAT3 signaling leads to apoptosis of leukemic large granular lymphocytes and decreased Mcl-1 expression. J. Clin. Investig. 2001, 107, 351–362. [Google Scholar] [CrossRef]
- Sanjana, N.; Shalem, O.; Zhang, F. Improved vectors and genome-wide libraries for CRISPR screening. Nat. Methods 2014, 11, 783–784. [Google Scholar] [CrossRef] [Green Version]
- Shalem, O.; Sanjana, N.E.; Hartenian, E.; Shi, X.; Scott, D.A.; Mikkelsen, T.S.; Heckl, D.; Ebert, B.L.; Root, D.E.; Doench, J.G.; et al. Genome-Scale CRISPR-Cas9 Knockout Screening in Human Cells. Science 2014, 343, 84–87. [Google Scholar] [CrossRef] [Green Version]
- Tosello, V.; Bordin, F.; Yu, J.; Agnusdei, V.; Indraccolo, S.; Basso, G.; Amadori, A.; Piovan, E. Calcineurin and GSK-3 inhibition sensitizes T-cell acute lymphoblastic leukemia cells to apoptosis through X-linked inhibitor of apoptosis protein degradation. Leukemia 2015, 30, 812–822. [Google Scholar] [CrossRef]
- Sasaki, H.; Nishizaki, Y.; Hui, C.; Nakafuku, M.; Kondoh, H. Regulation of Gli2 and Gli3 Activities by an Amino-Terminal Repression Domain: Implication of Gli2 and Gli3 as Primary Mediators of Shh Signaling. Development 1999, 126, 3915–3924. [Google Scholar] [CrossRef]
- Young, N.P.; Kamireddy, A.; Van Nostrand, J.L.; Eichner, L.J.; Shokhirev, M.N.; Dayn, Y.; Shaw, R.J. AMPK governs lineage specification through Tfeb-dependent regulation of lysosomes. Genes Dev. 2016, 30, 535–552. [Google Scholar] [CrossRef] [PubMed] [Green Version]
- Chou, T.-C. Theoretical Basis, Experimental Design, and Computerized Simulation of Synergism and Antagonism in Drug Combination Studies. Pharmacol. Rev. 2006, 58, 621–681. [Google Scholar] [CrossRef] [PubMed]


Publisher’s Note: MDPI stays neutral with regard to jurisdictional claims in published maps and institutional affiliations. |
© 2021 by the authors. Licensee MDPI, Basel, Switzerland. This article is an open access article distributed under the terms and conditions of the Creative Commons Attribution (CC BY) license (https://creativecommons.org/licenses/by/4.0/).
Share and Cite
Tosello, V.; Bongiovanni, D.; Di Martino, L.; Franchin, C.; Zanovello, P.; Arrigoni, G.; Piovan, E. Responsiveness to Hedgehog Pathway Inhibitors in T-Cell Acute Lymphoblastic Leukemia Cells Is Highly Dependent on 5′AMP-Activated Kinase Inactivation. Int. J. Mol. Sci. 2021, 22, 6384. https://0-doi-org.brum.beds.ac.uk/10.3390/ijms22126384
Tosello V, Bongiovanni D, Di Martino L, Franchin C, Zanovello P, Arrigoni G, Piovan E. Responsiveness to Hedgehog Pathway Inhibitors in T-Cell Acute Lymphoblastic Leukemia Cells Is Highly Dependent on 5′AMP-Activated Kinase Inactivation. International Journal of Molecular Sciences. 2021; 22(12):6384. https://0-doi-org.brum.beds.ac.uk/10.3390/ijms22126384
Chicago/Turabian StyleTosello, Valeria, Deborah Bongiovanni, Ludovica Di Martino, Cinzia Franchin, Paola Zanovello, Giorgio Arrigoni, and Erich Piovan. 2021. "Responsiveness to Hedgehog Pathway Inhibitors in T-Cell Acute Lymphoblastic Leukemia Cells Is Highly Dependent on 5′AMP-Activated Kinase Inactivation" International Journal of Molecular Sciences 22, no. 12: 6384. https://0-doi-org.brum.beds.ac.uk/10.3390/ijms22126384