
In Vitro Effects of Selective COX and LOX Inhibitors and Their Combinations with Antineoplastic Drugs in the Mouse Melanoma Cell Line B16F10


Abstract
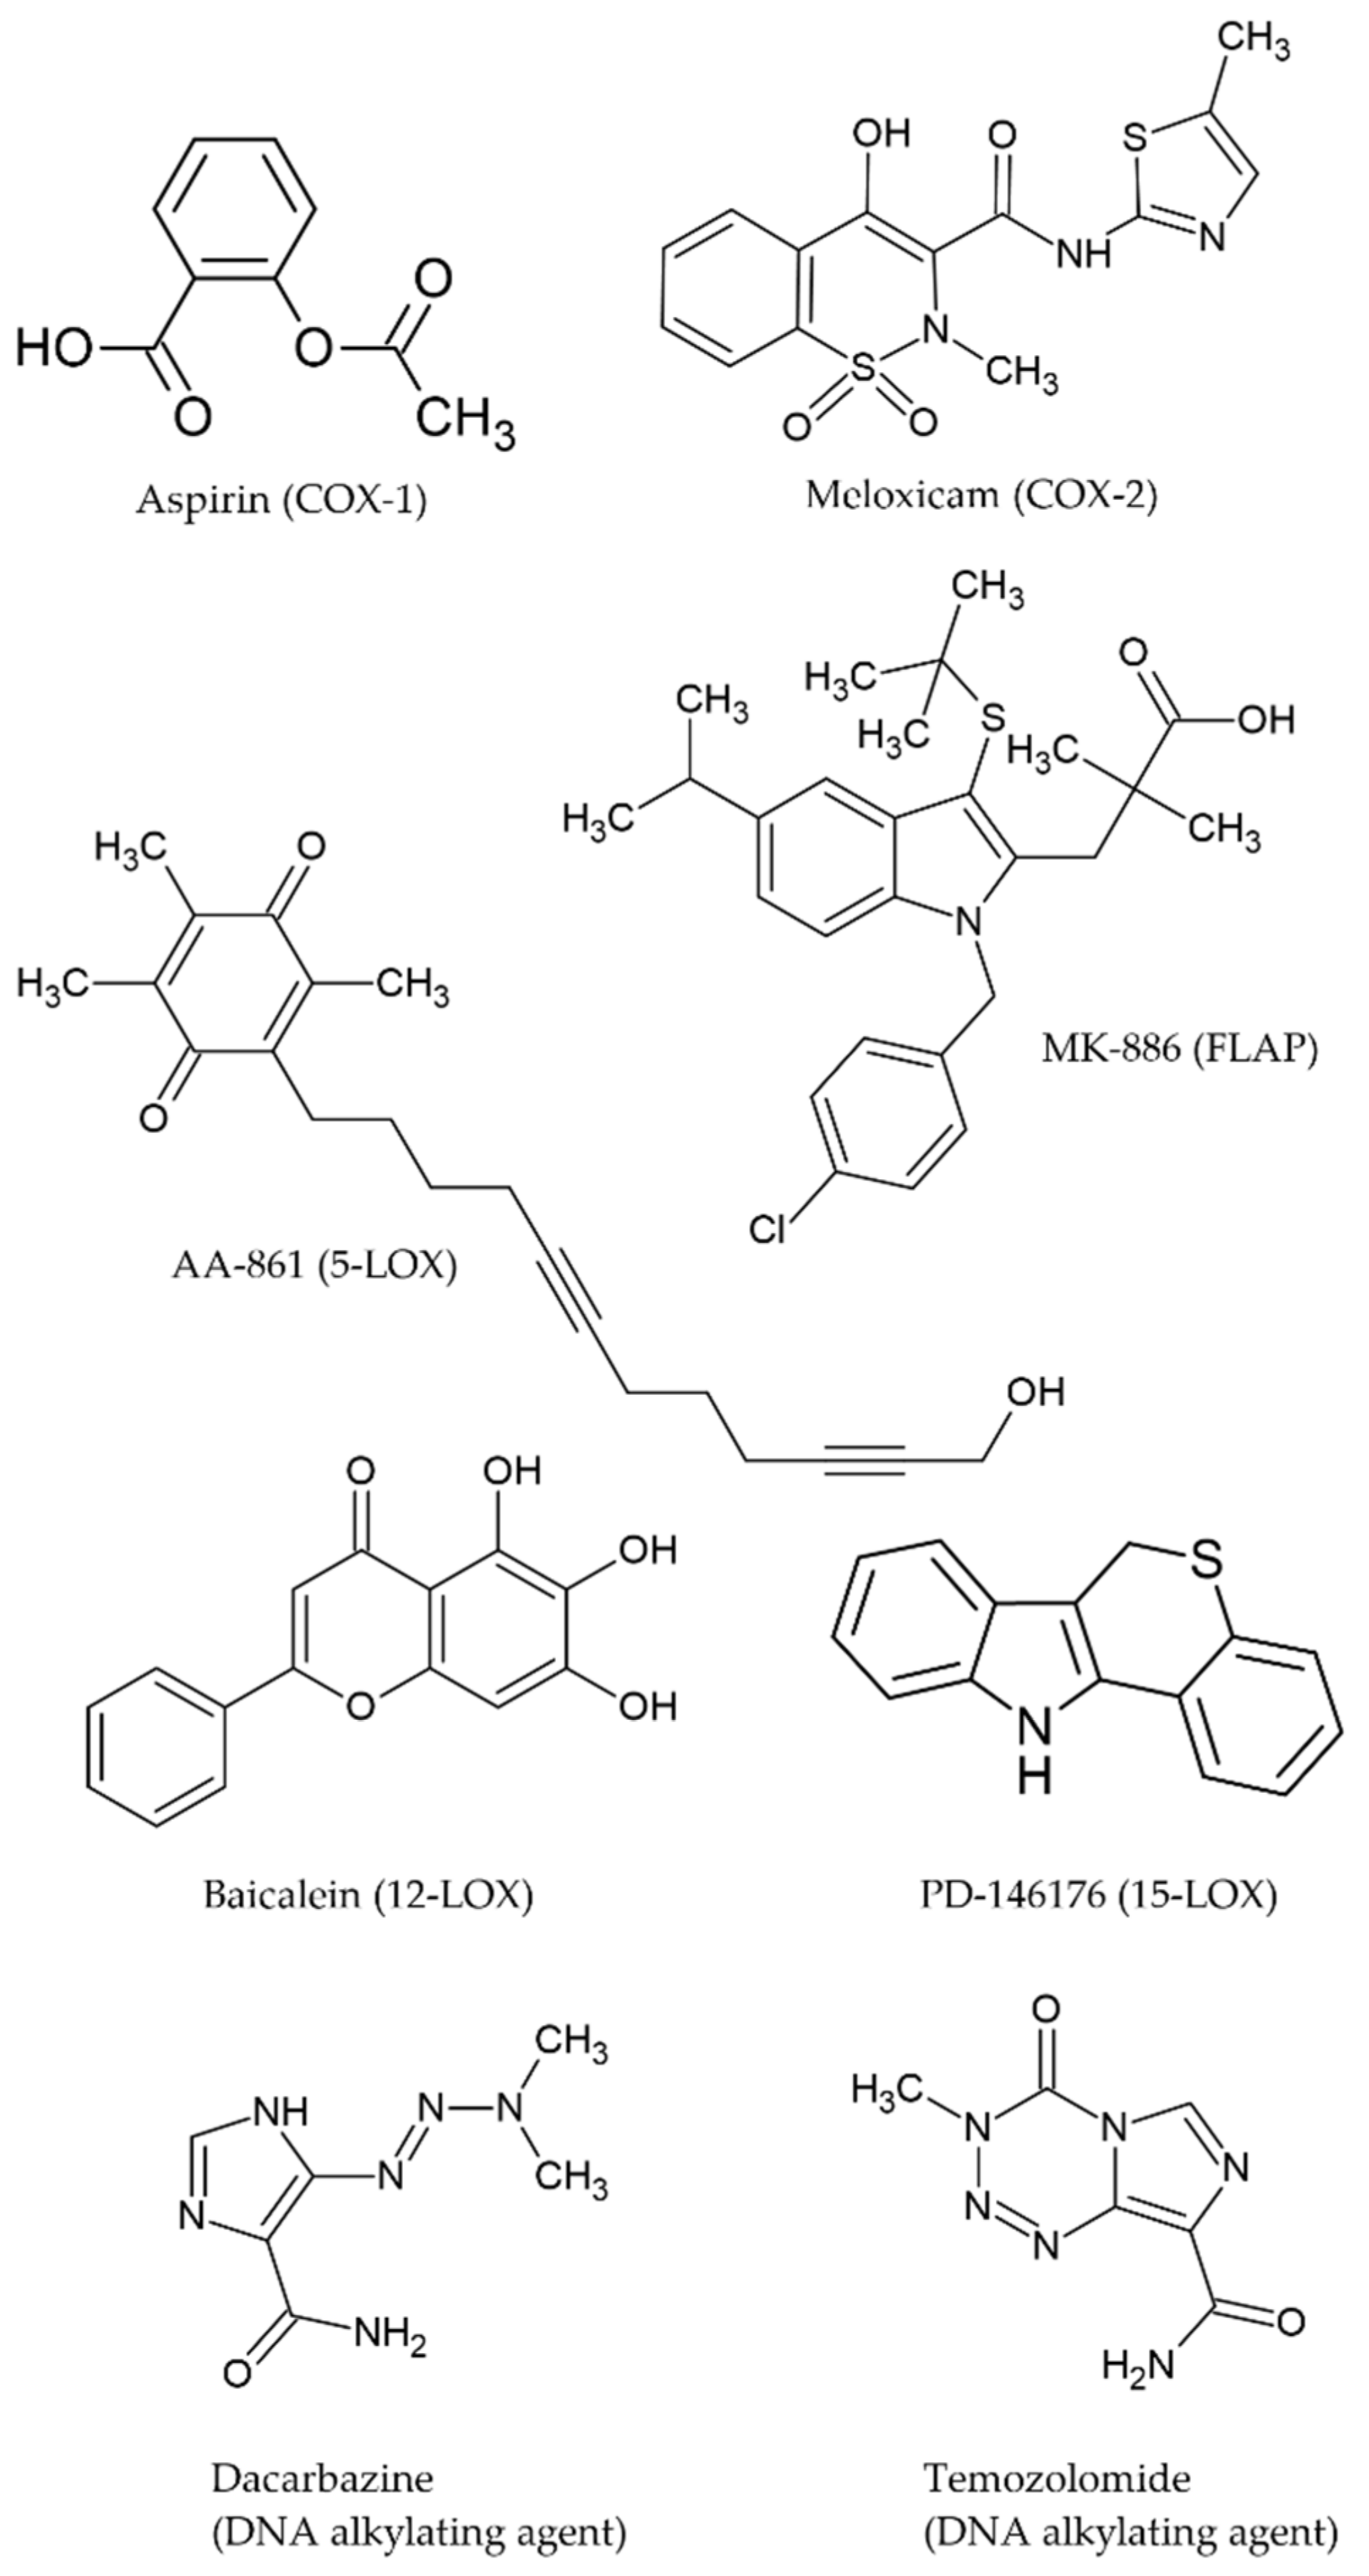
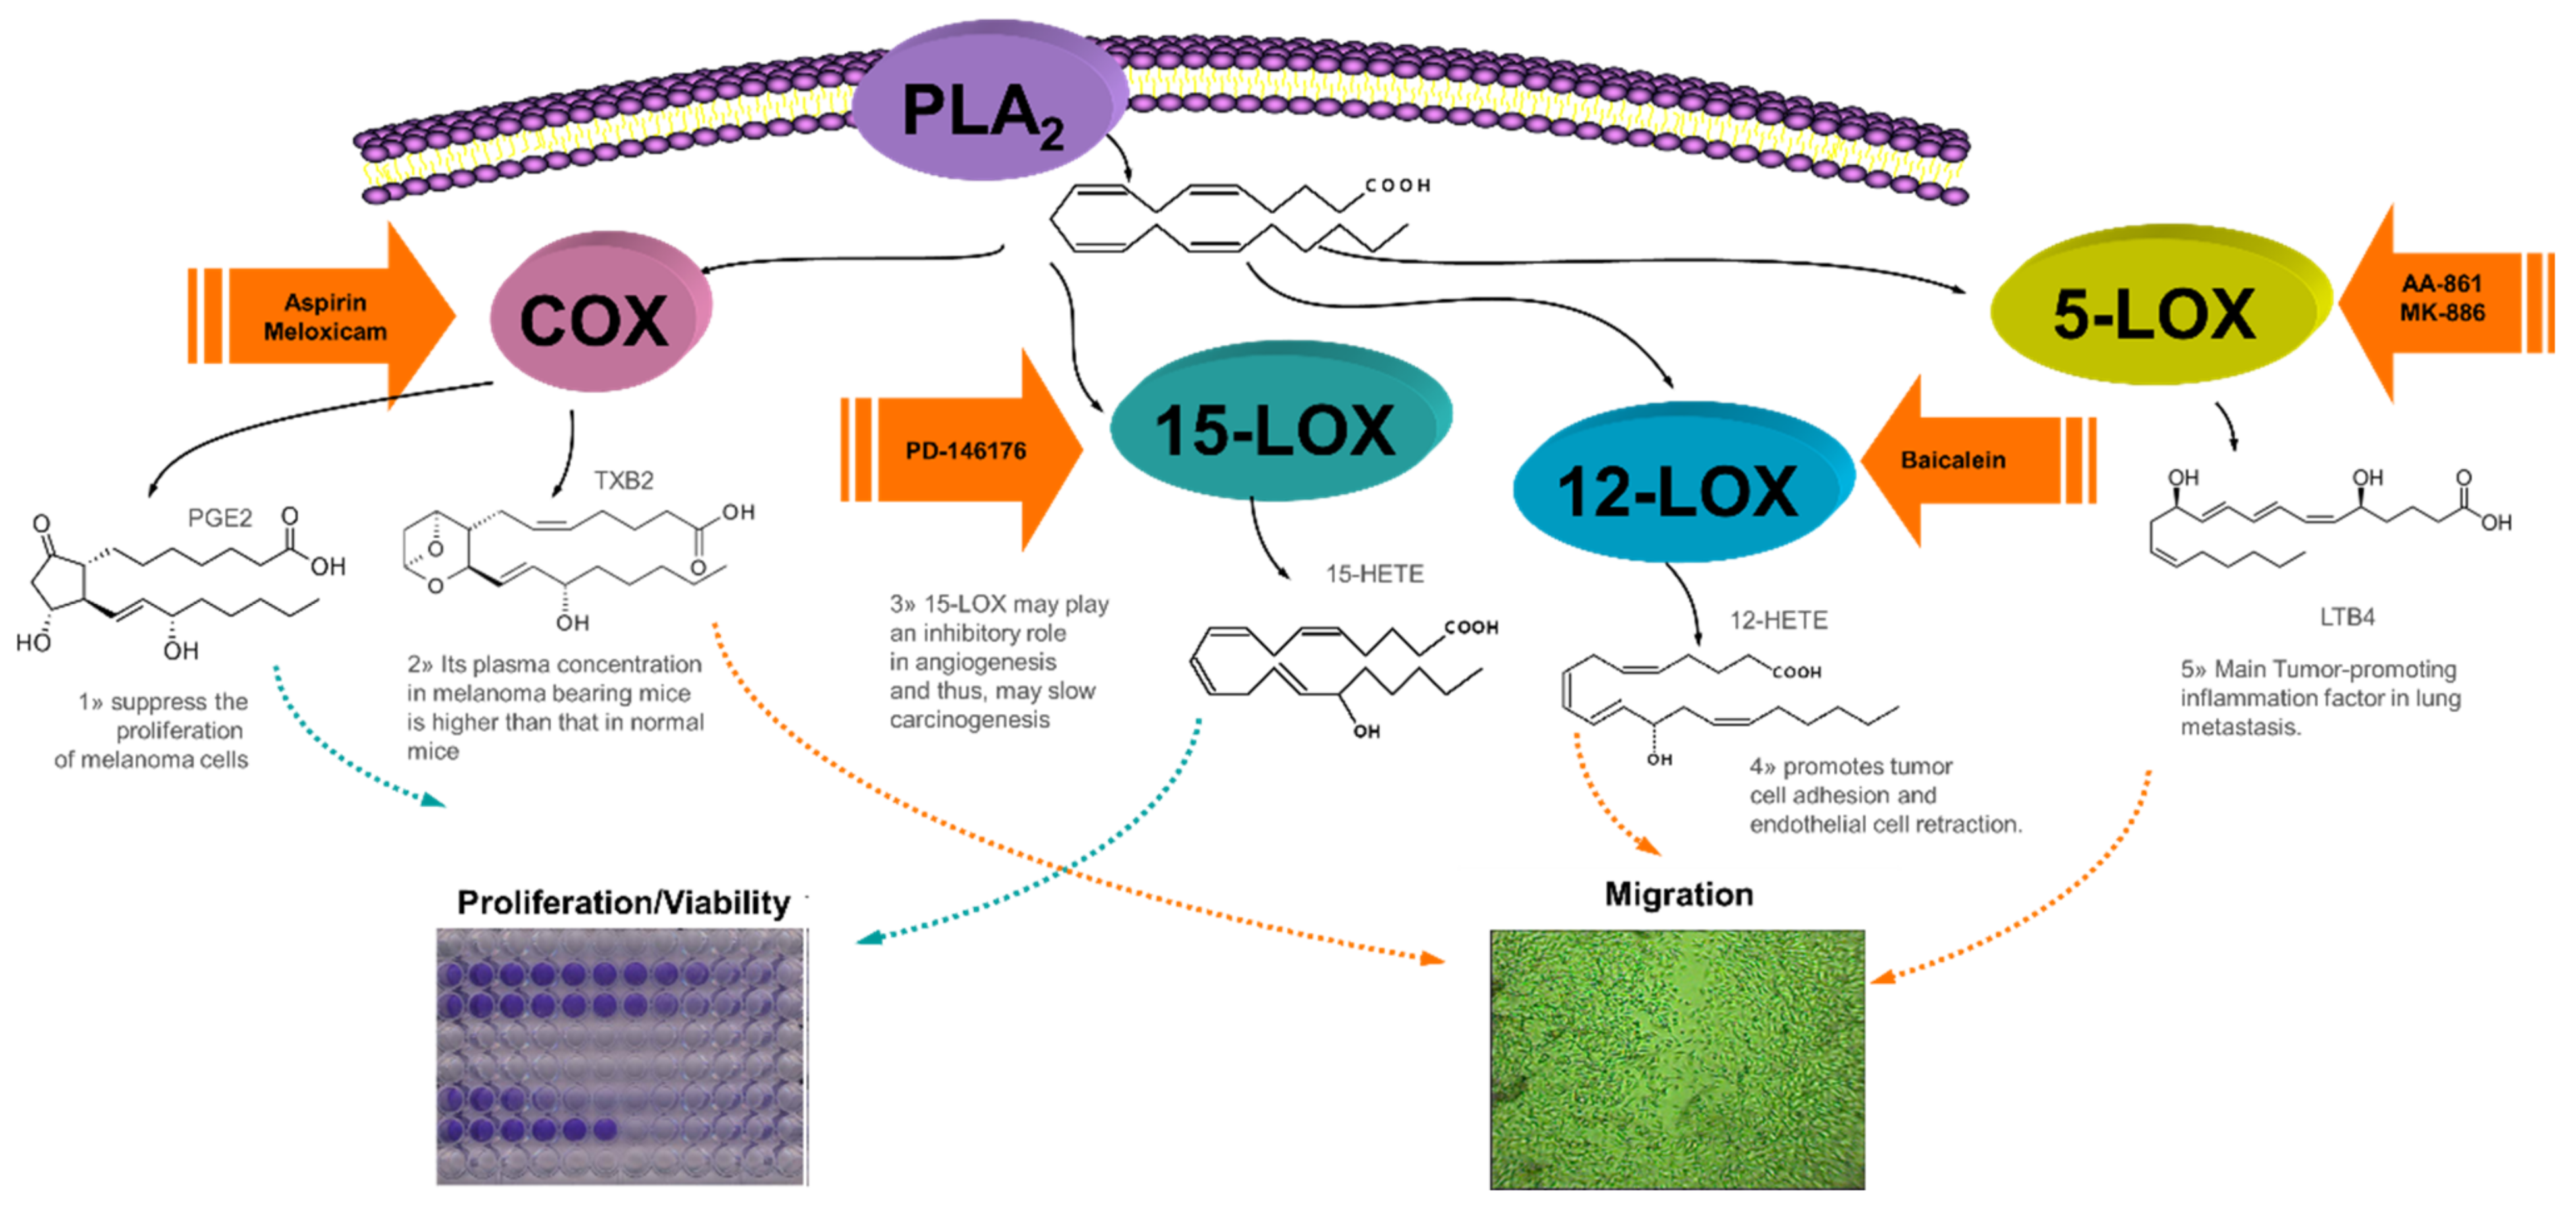
:1. Introduction
2. Results
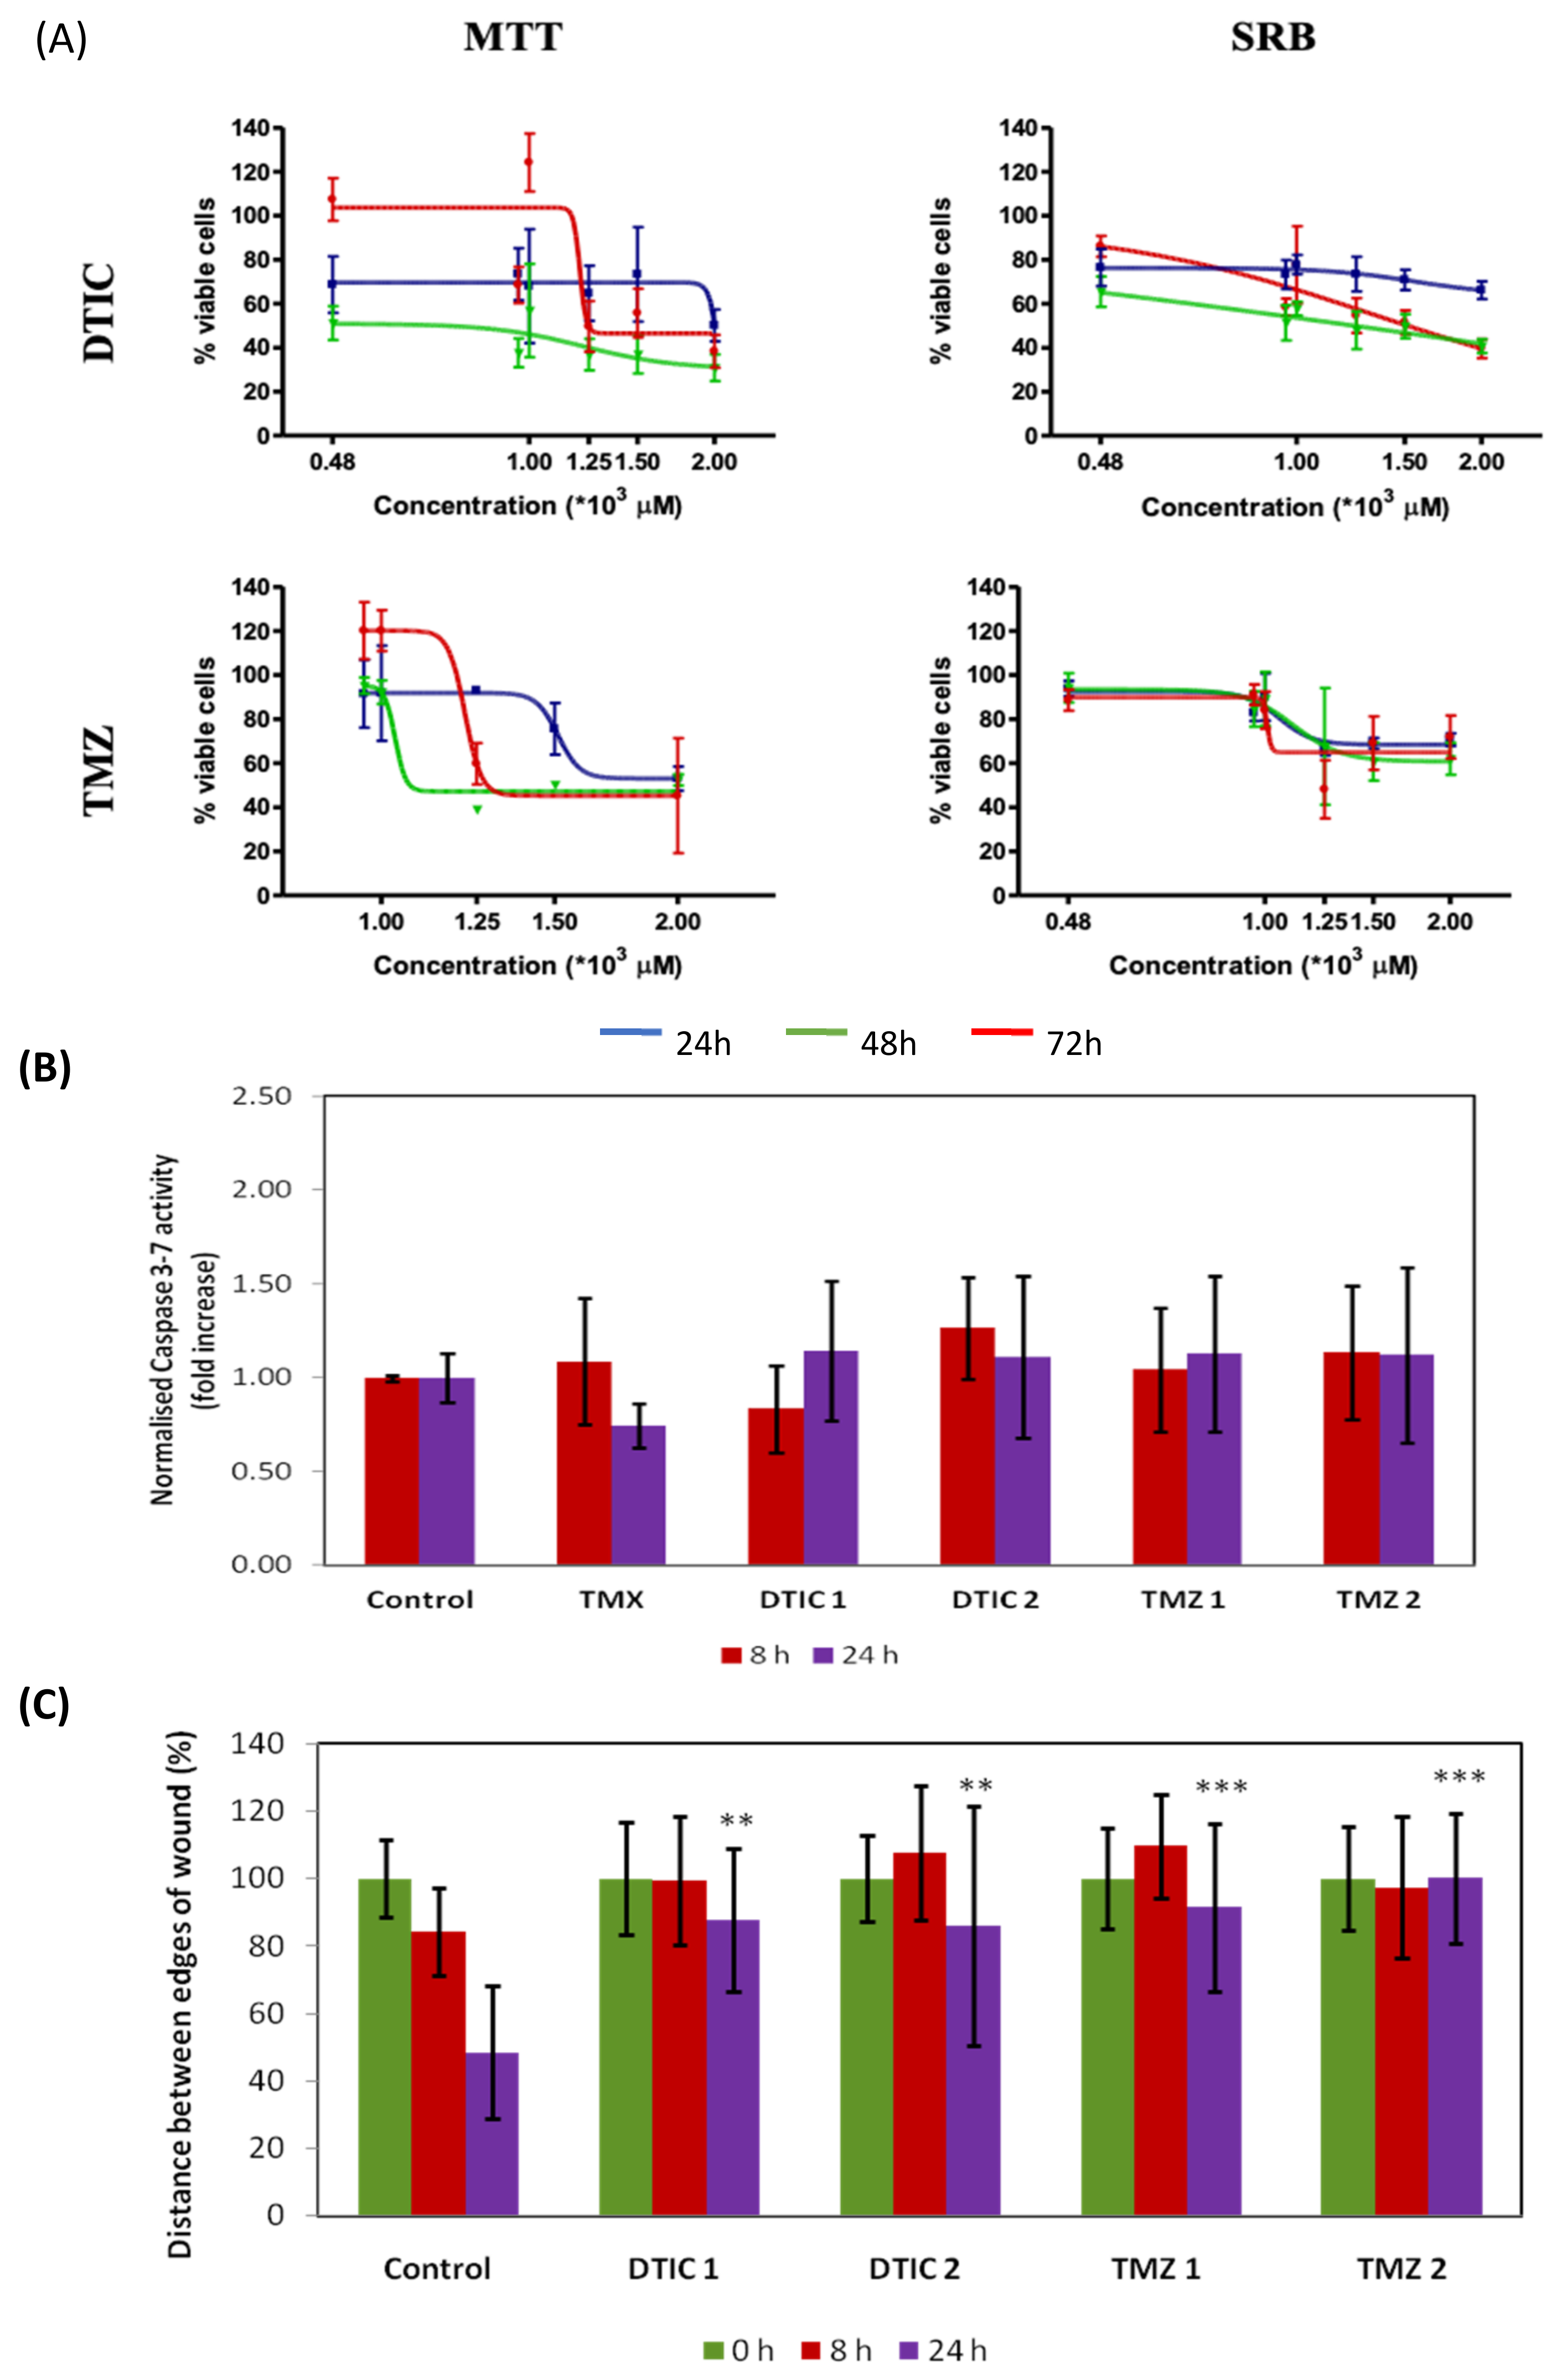
2.1. In Vitro Effects of the of the Antineoplastic Drugs Dacarbazine and Temozolomide on B16F10 Cells
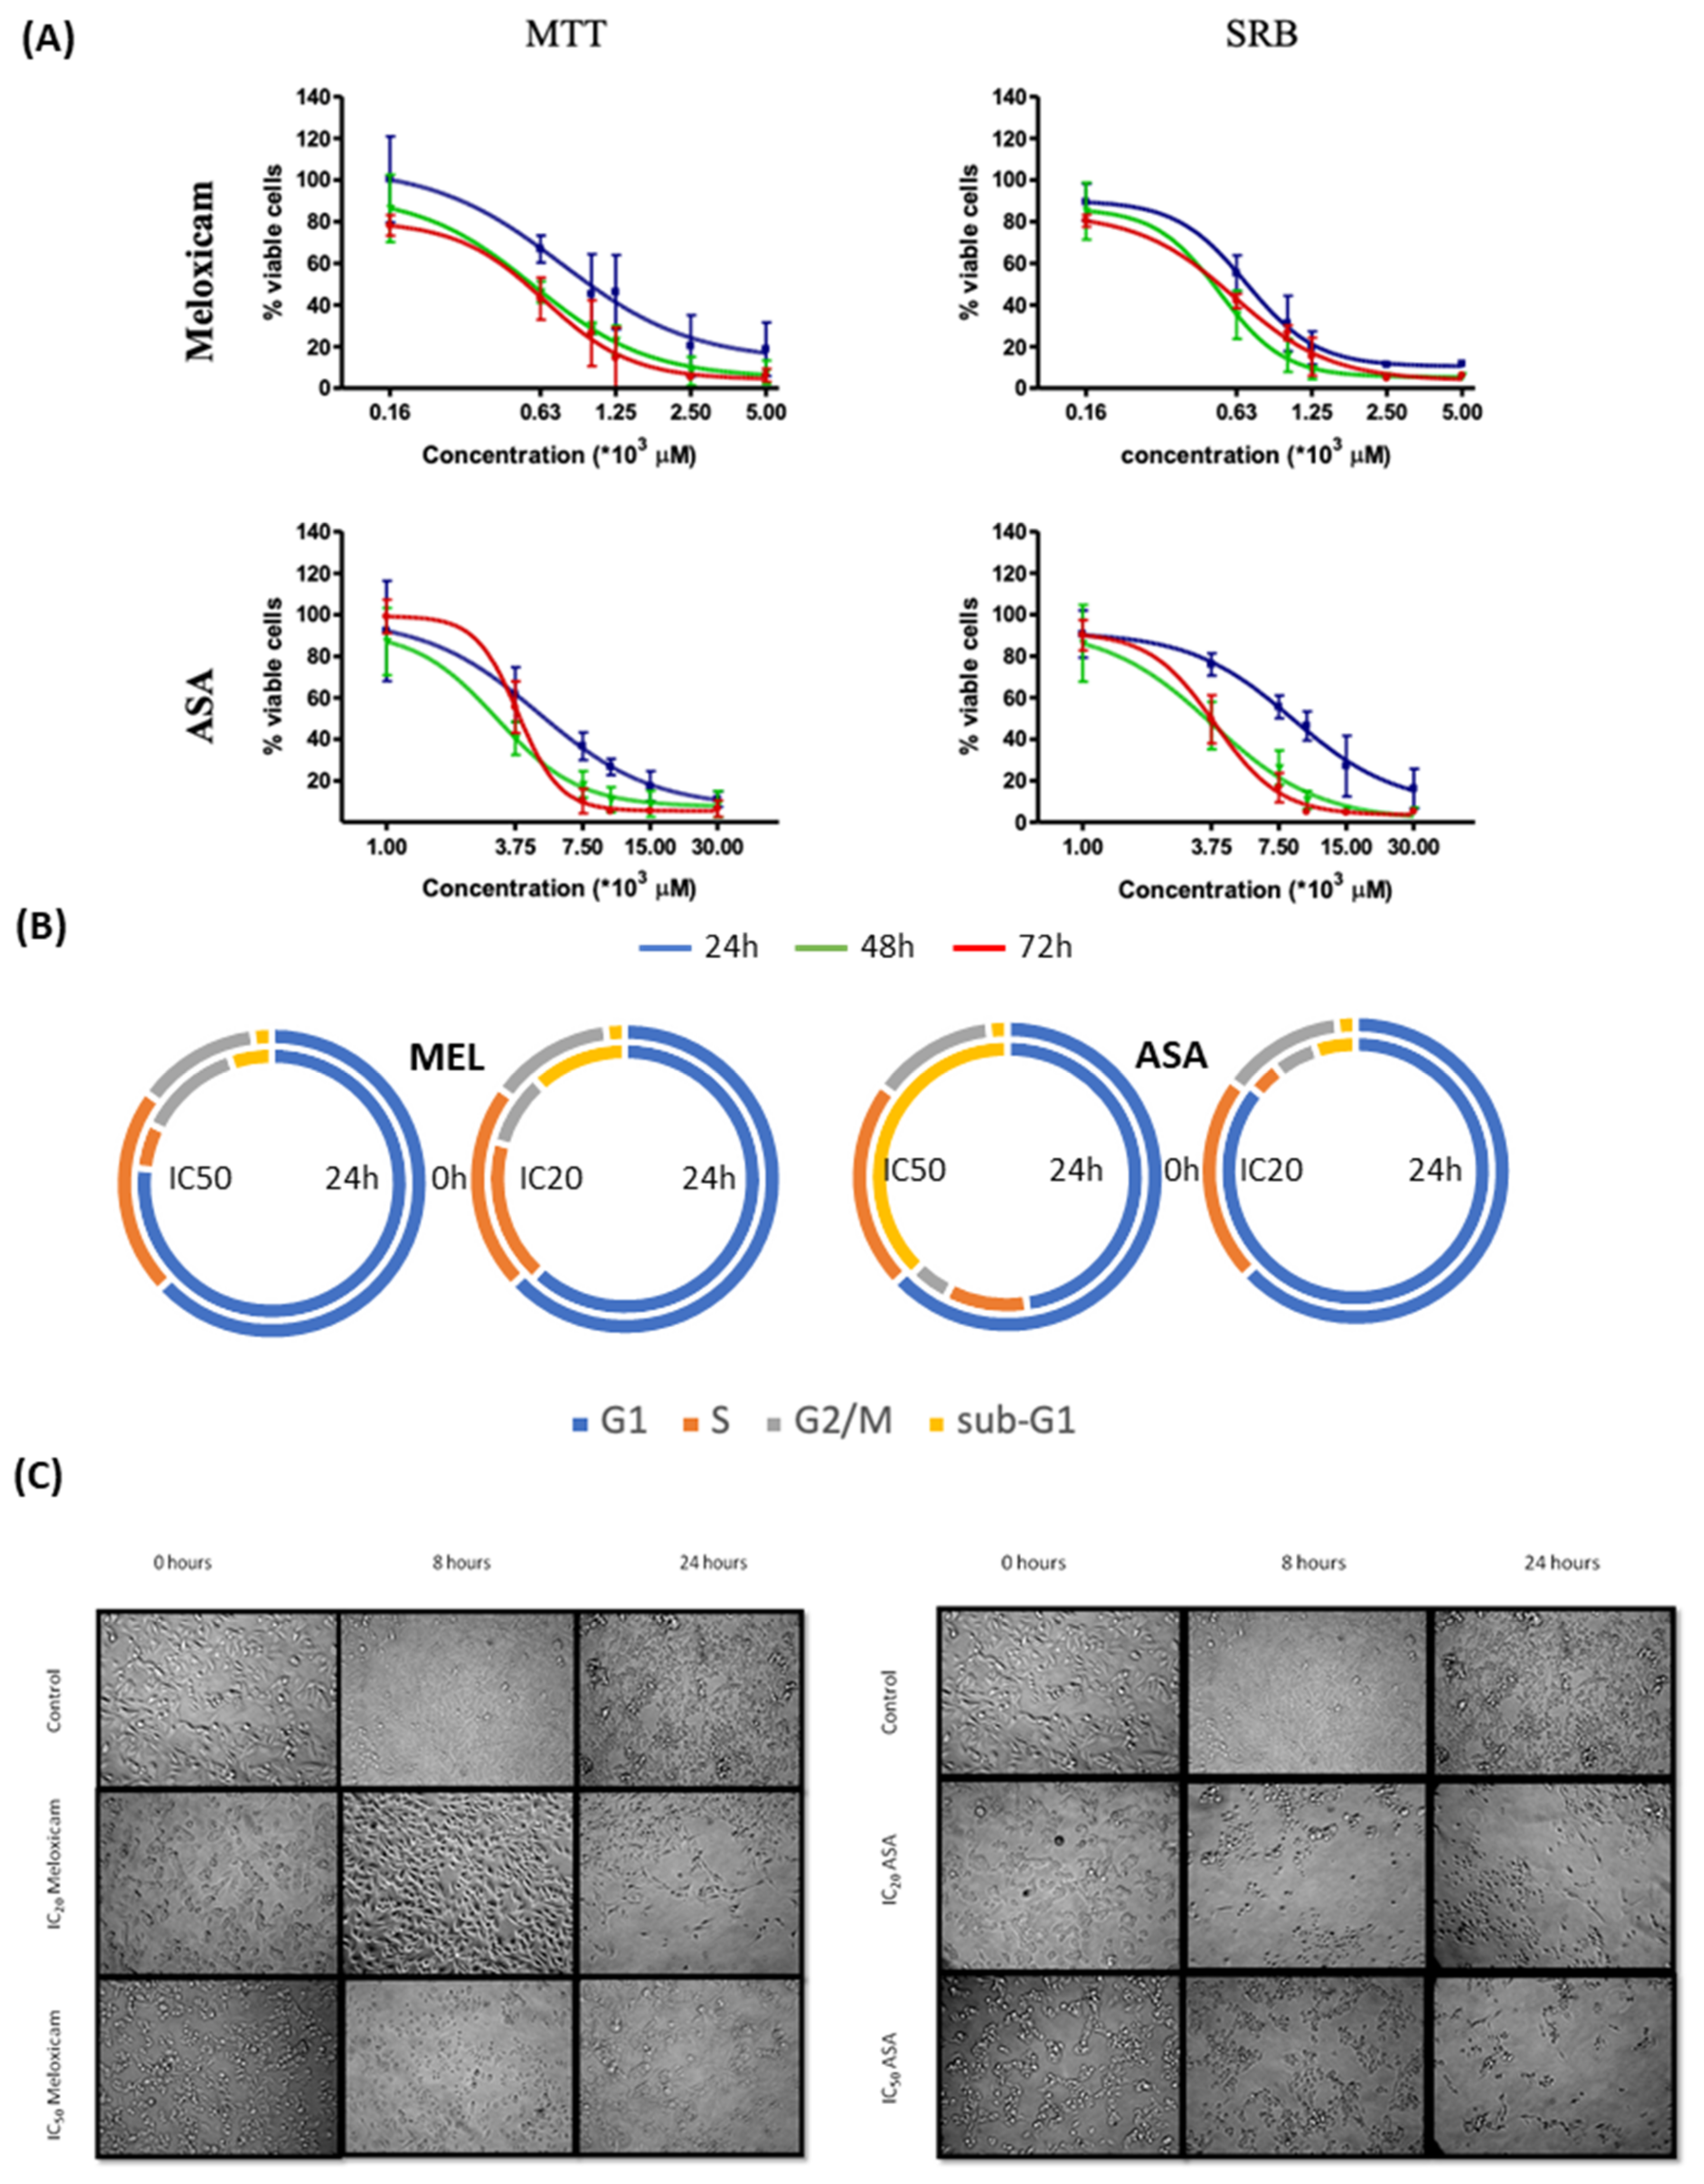
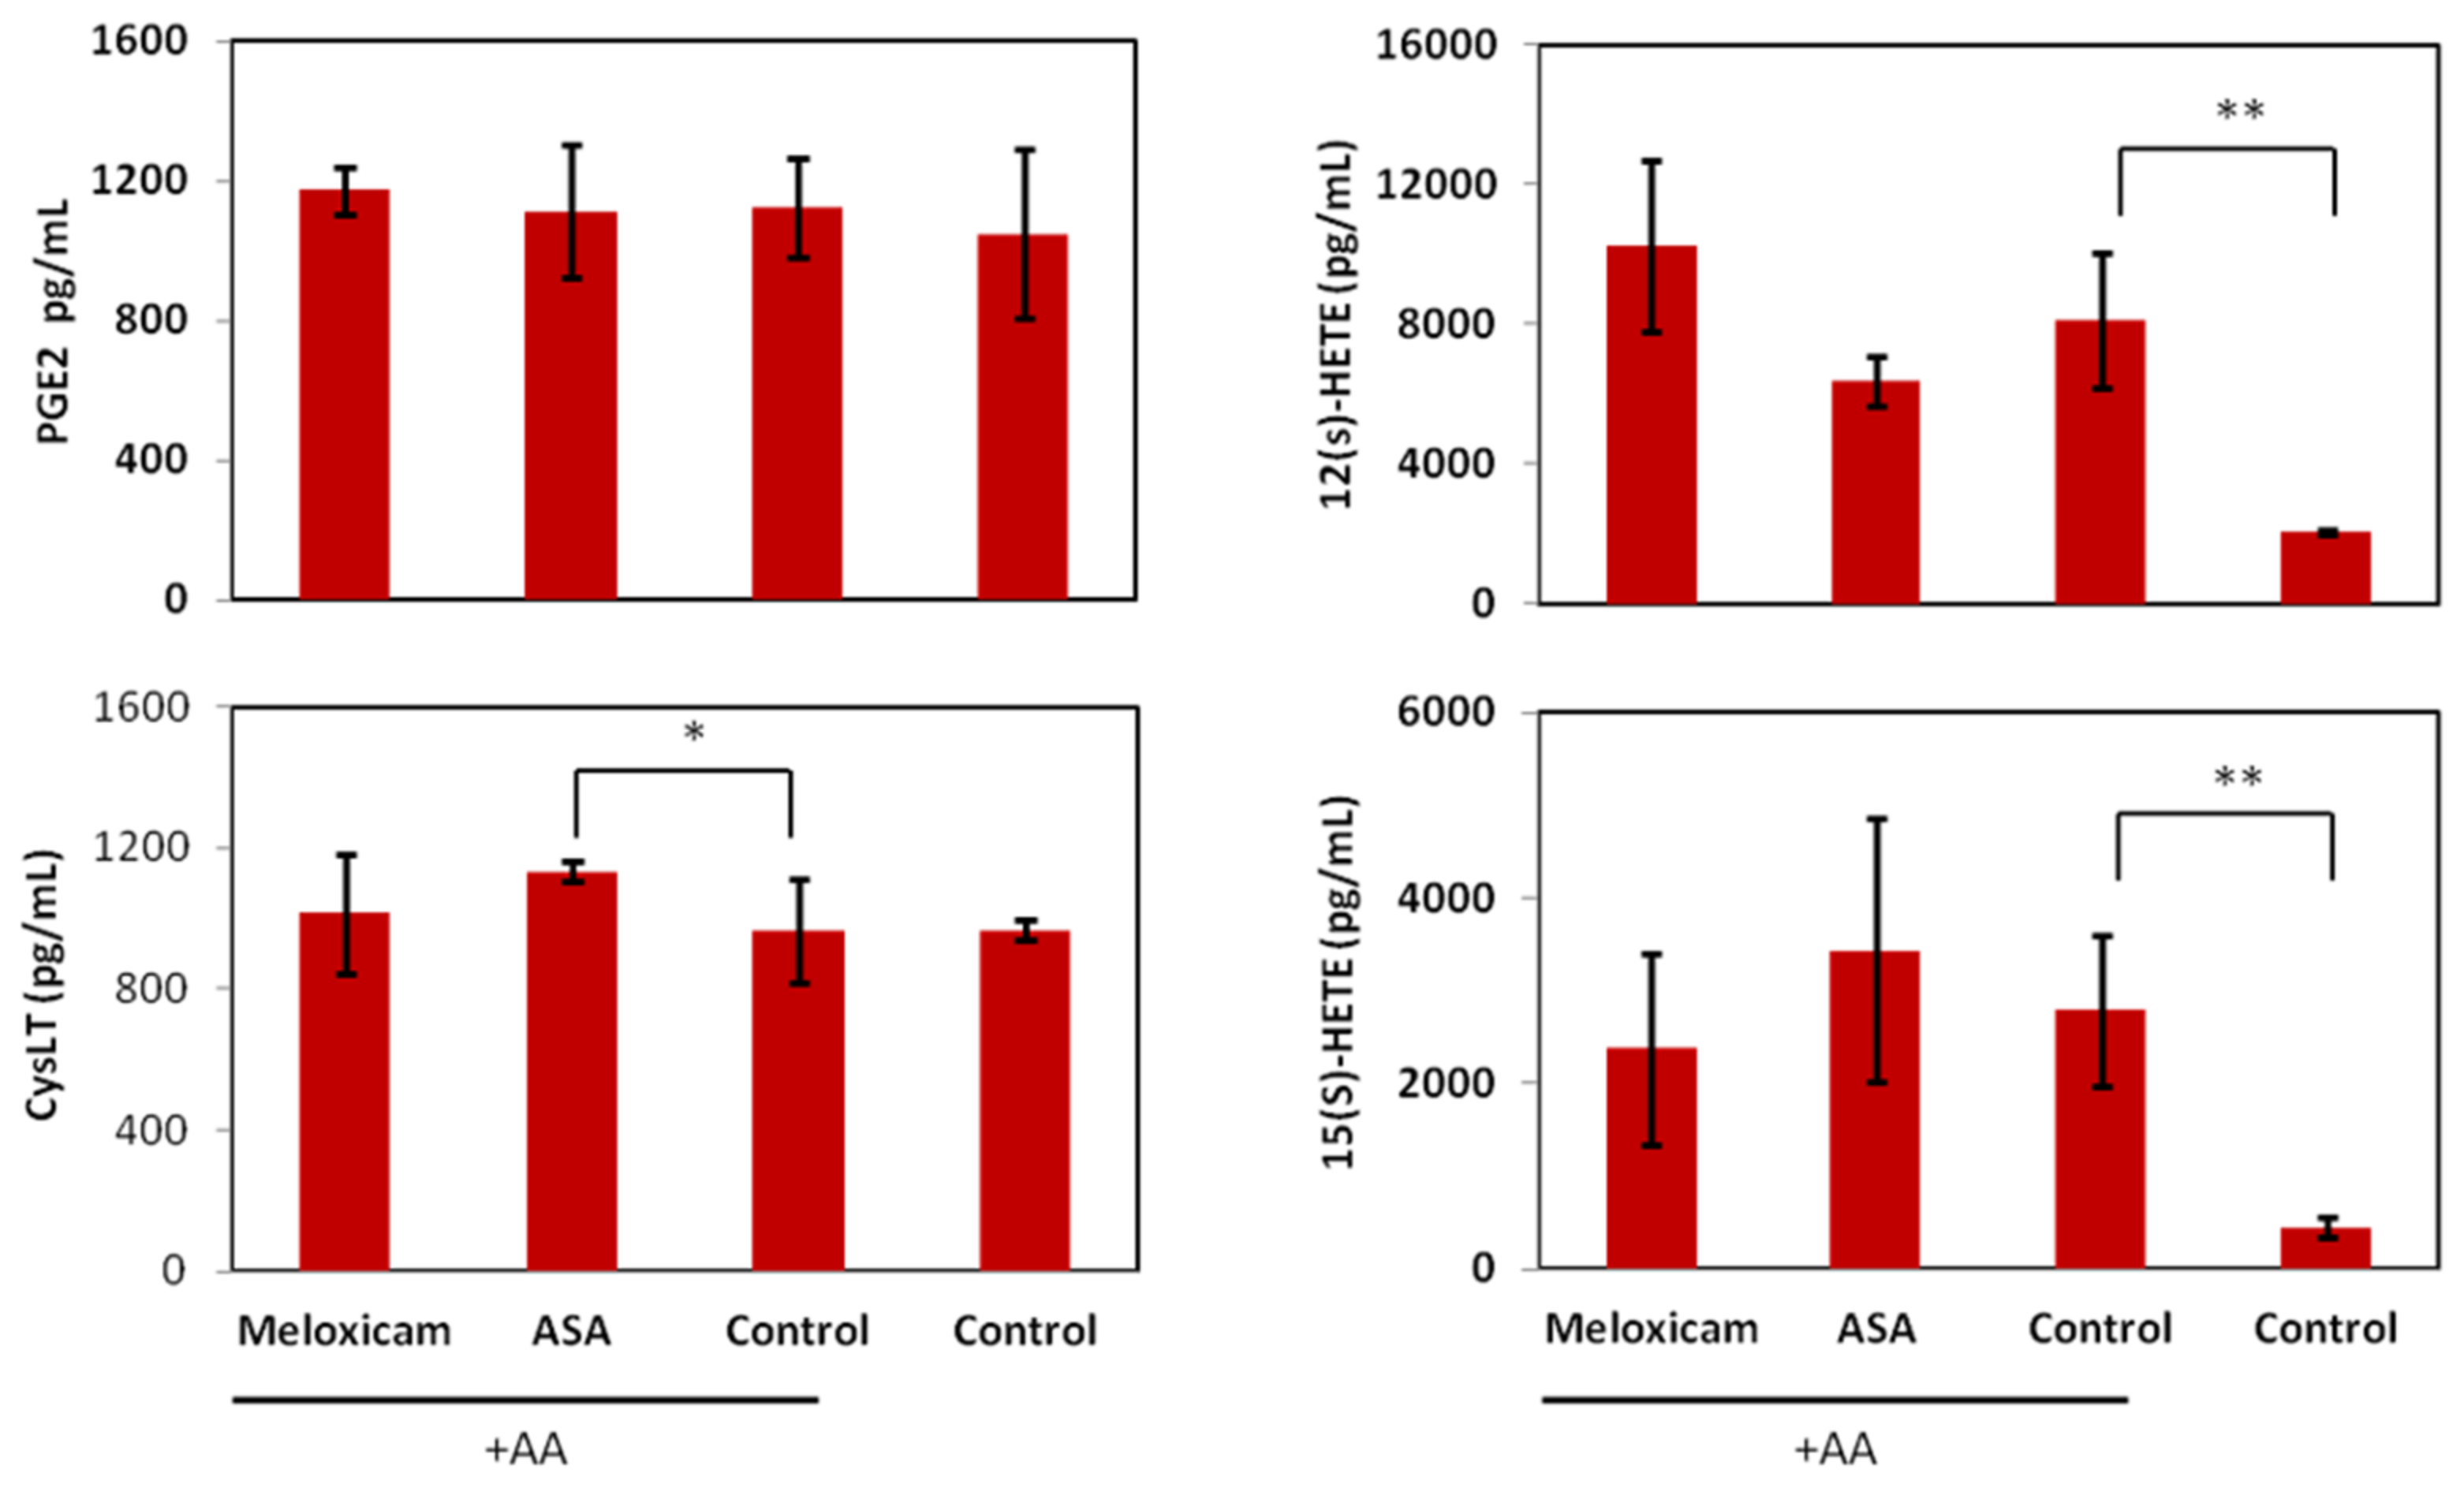
2.2. In Vitro Effects of the COX Inhibitors Meloxicam and ASA on B16F10 Cells
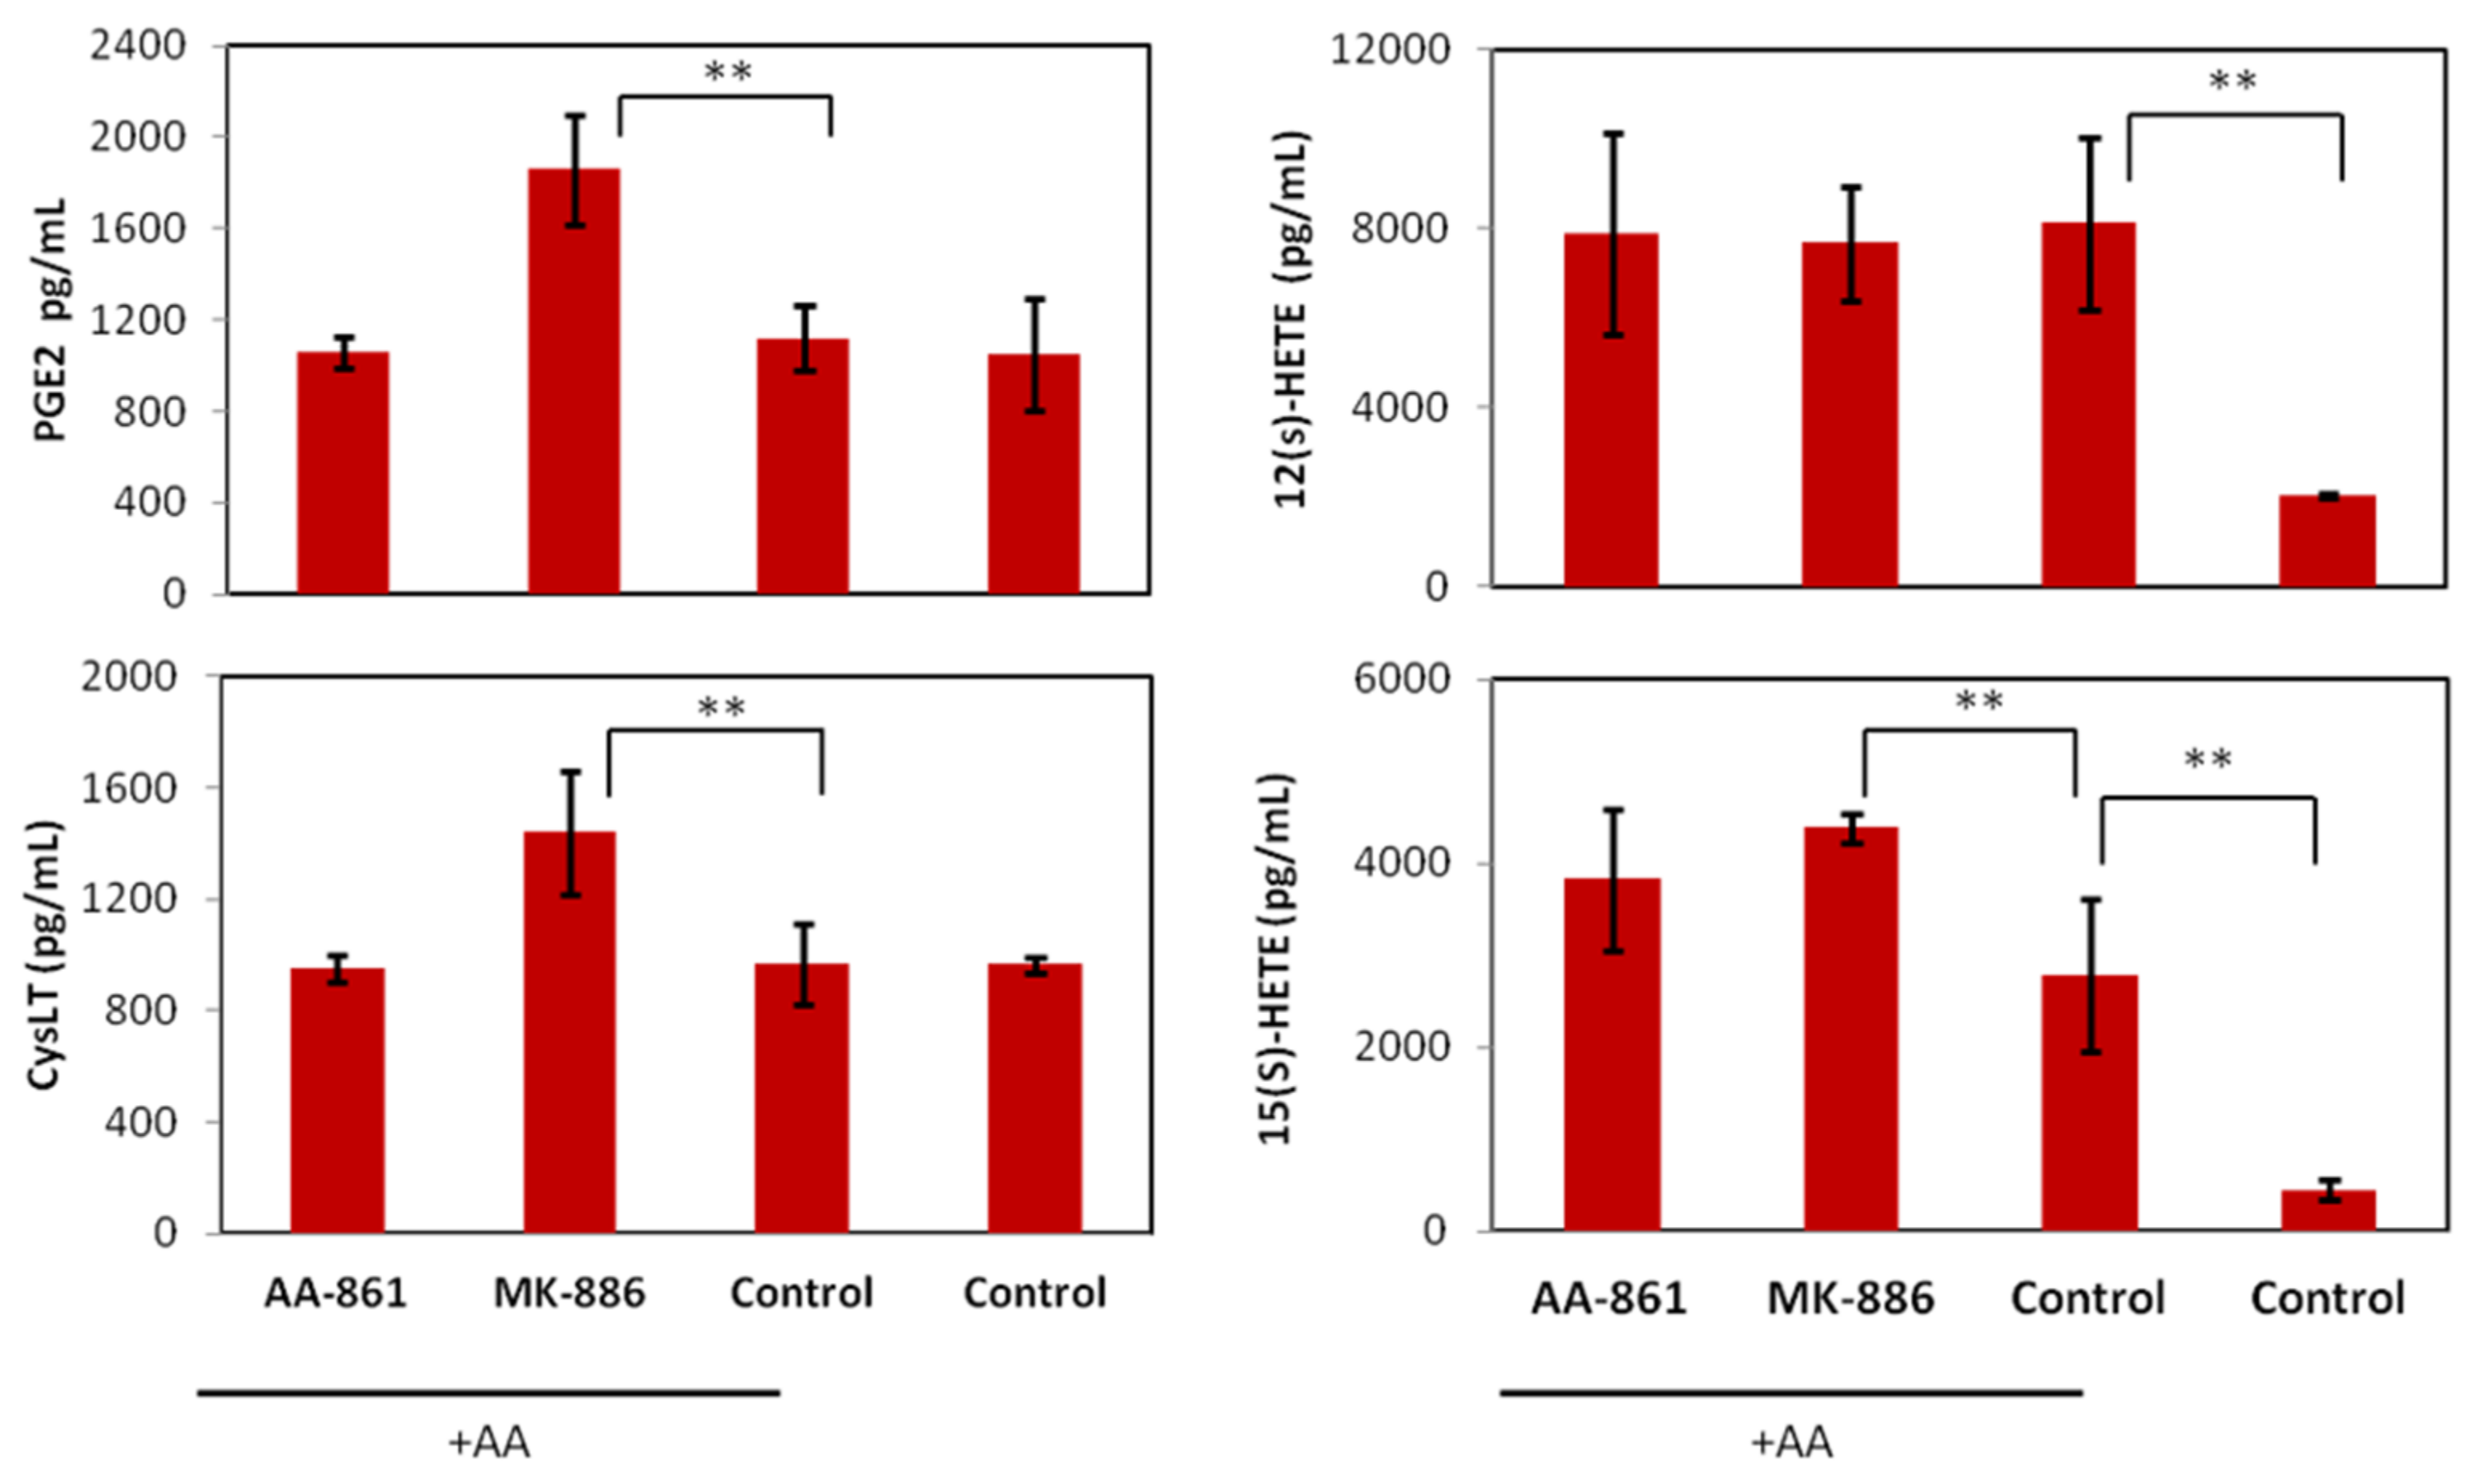
2.3. In Vitro Effects of the 5-LOX Inhibitors AA-861 and MK-886 on B16F10 Cells
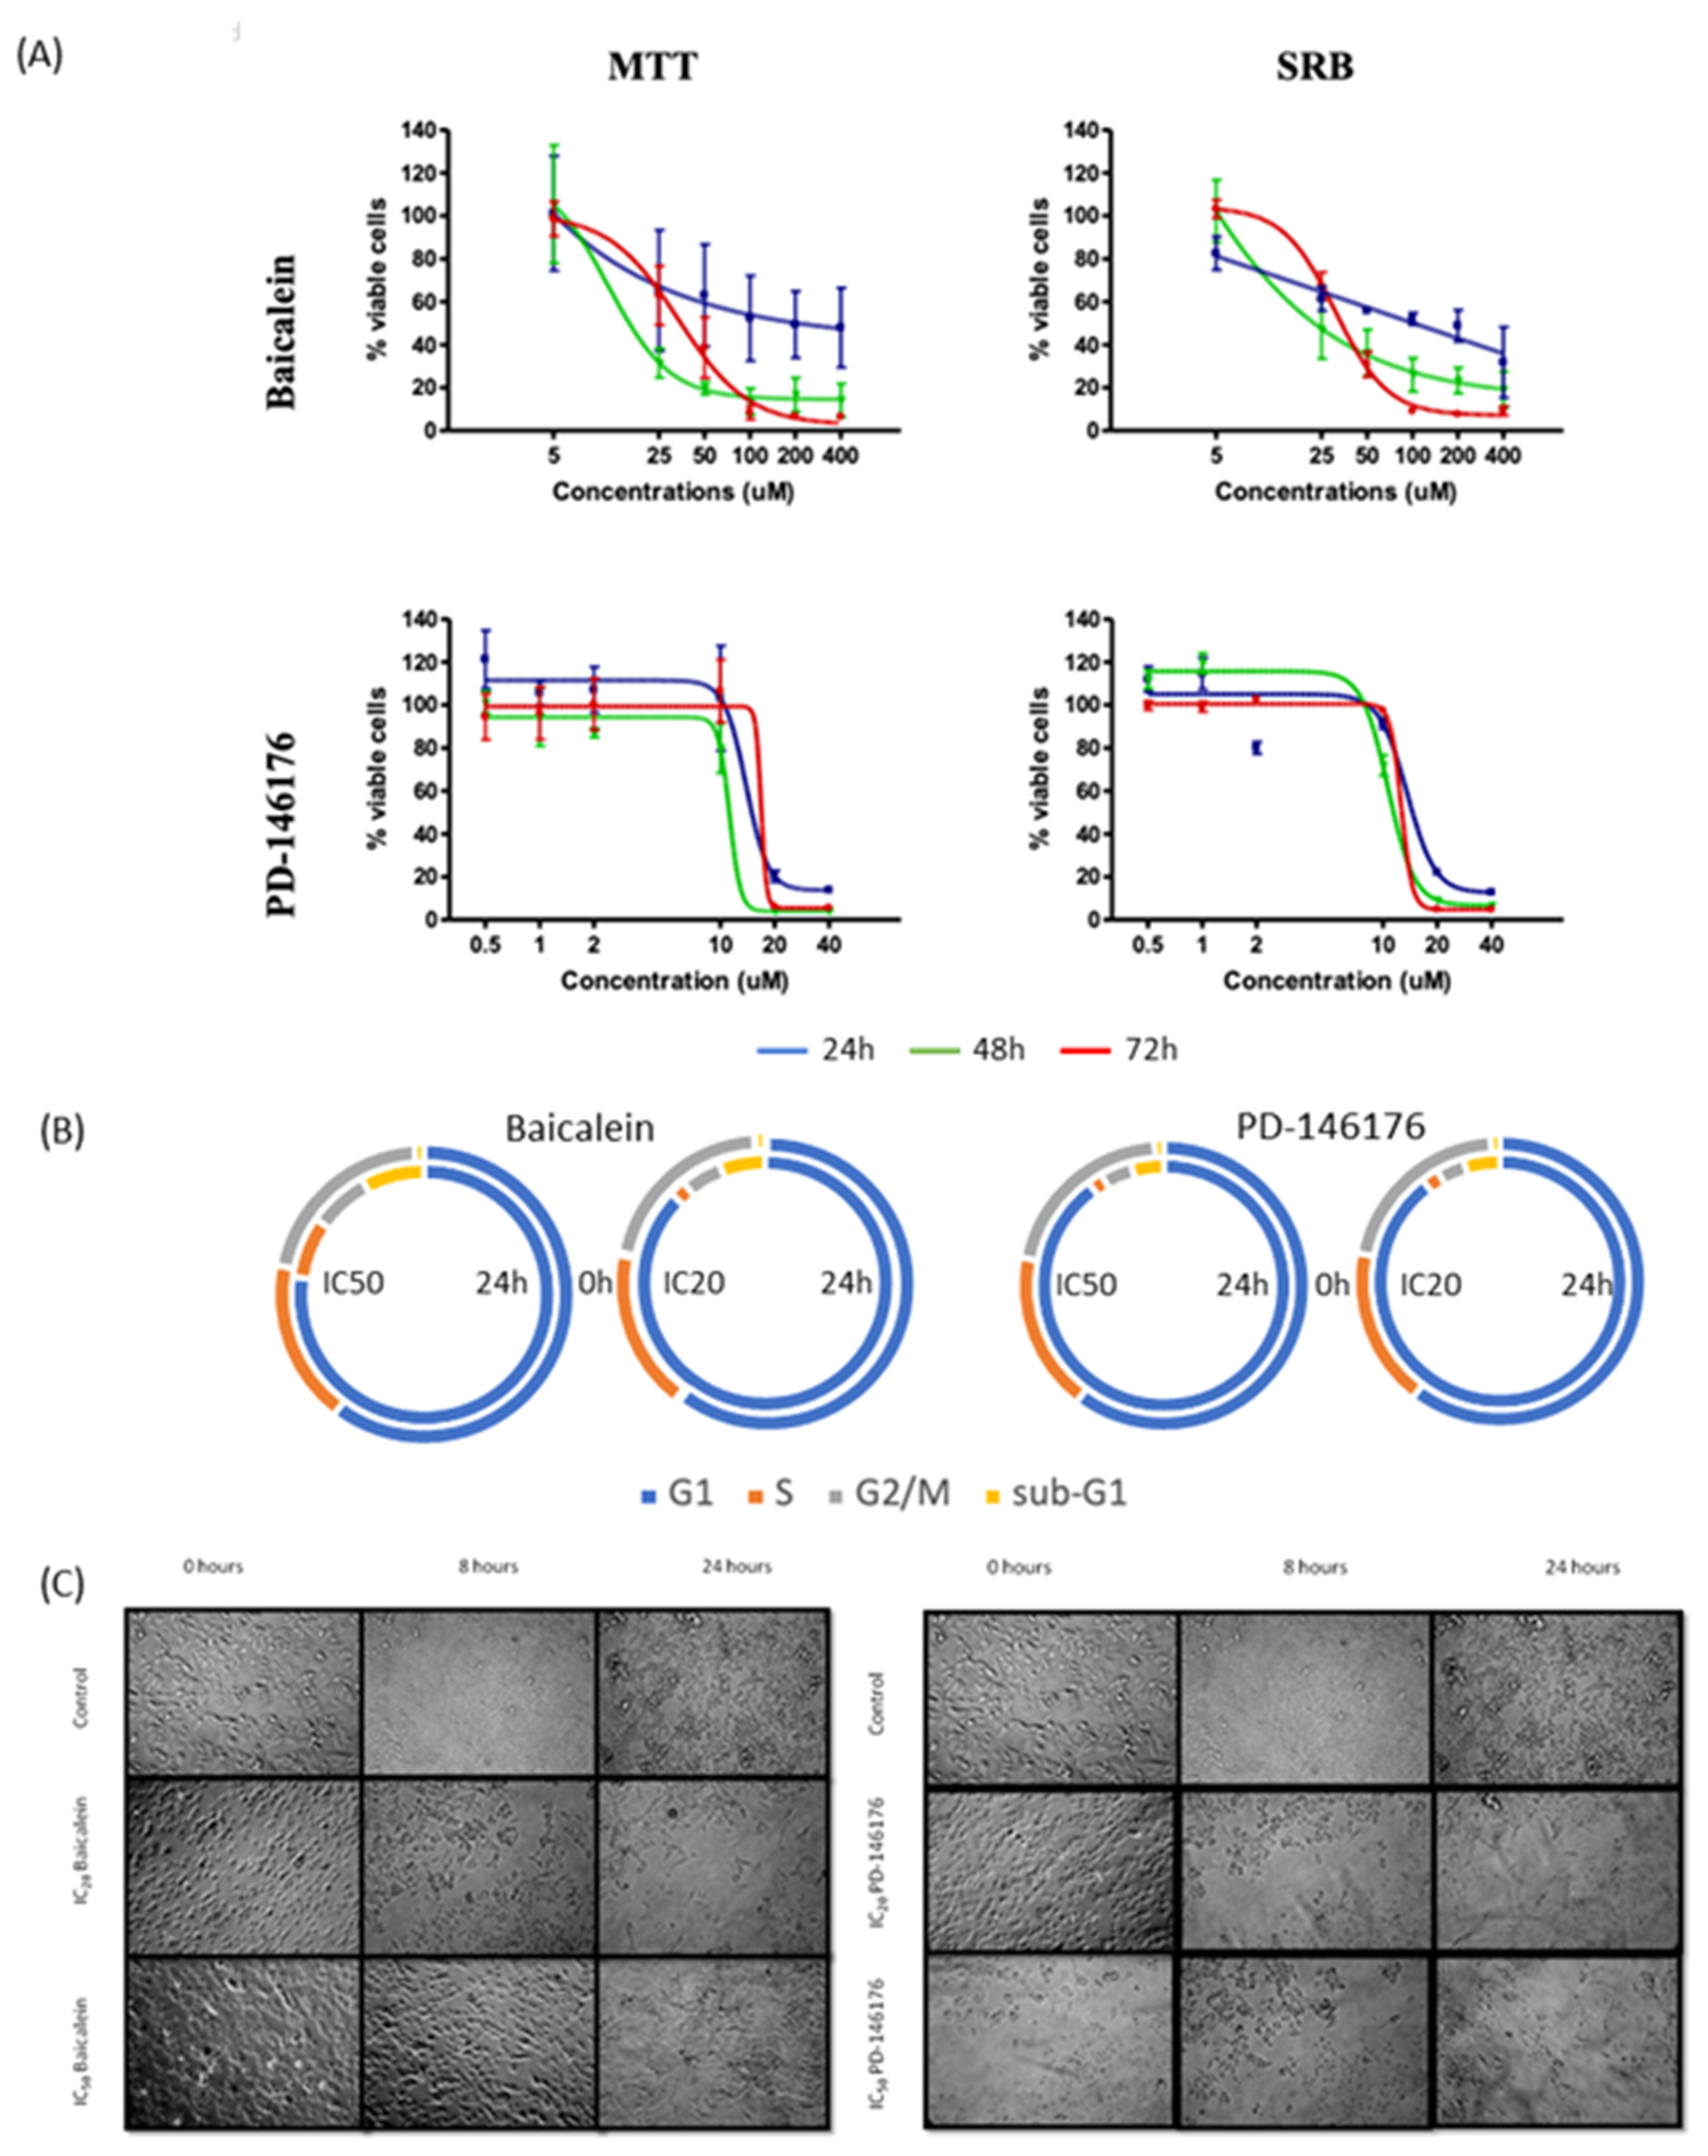
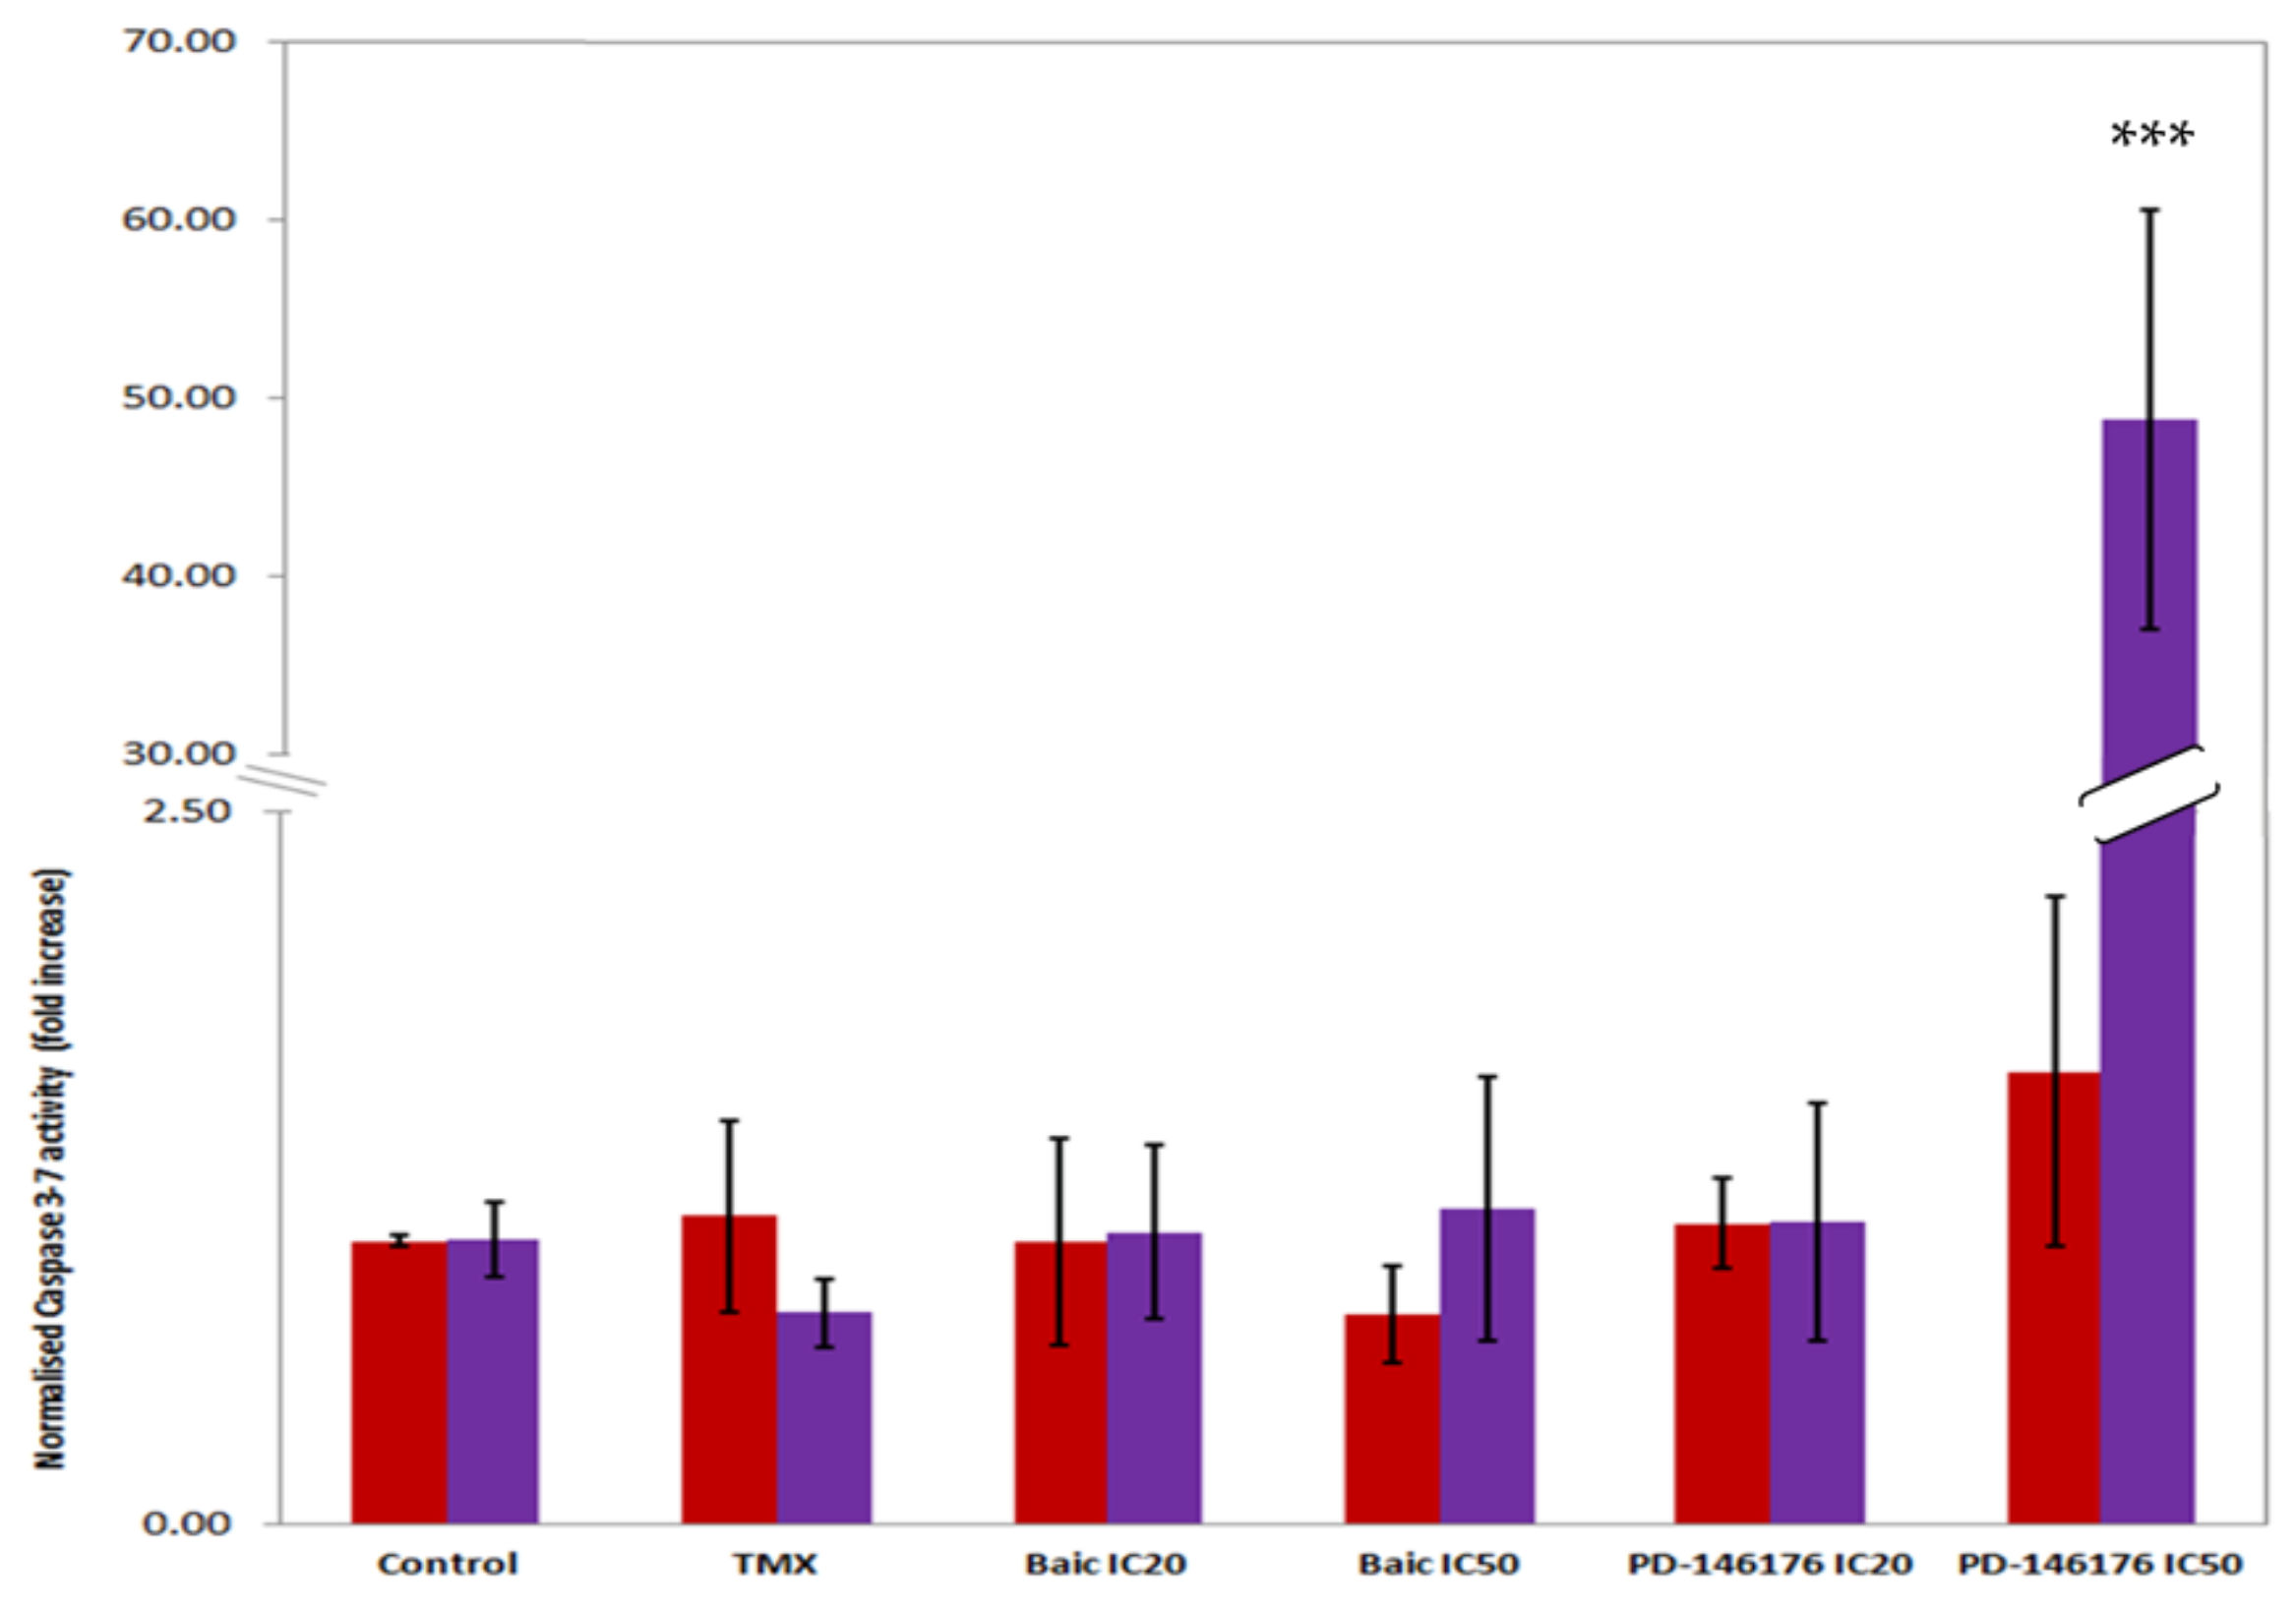
2.4. In Vitro Effects of the 12- and 15- Inhibitors Baicalein and PD-146176 on B16F10 Cells
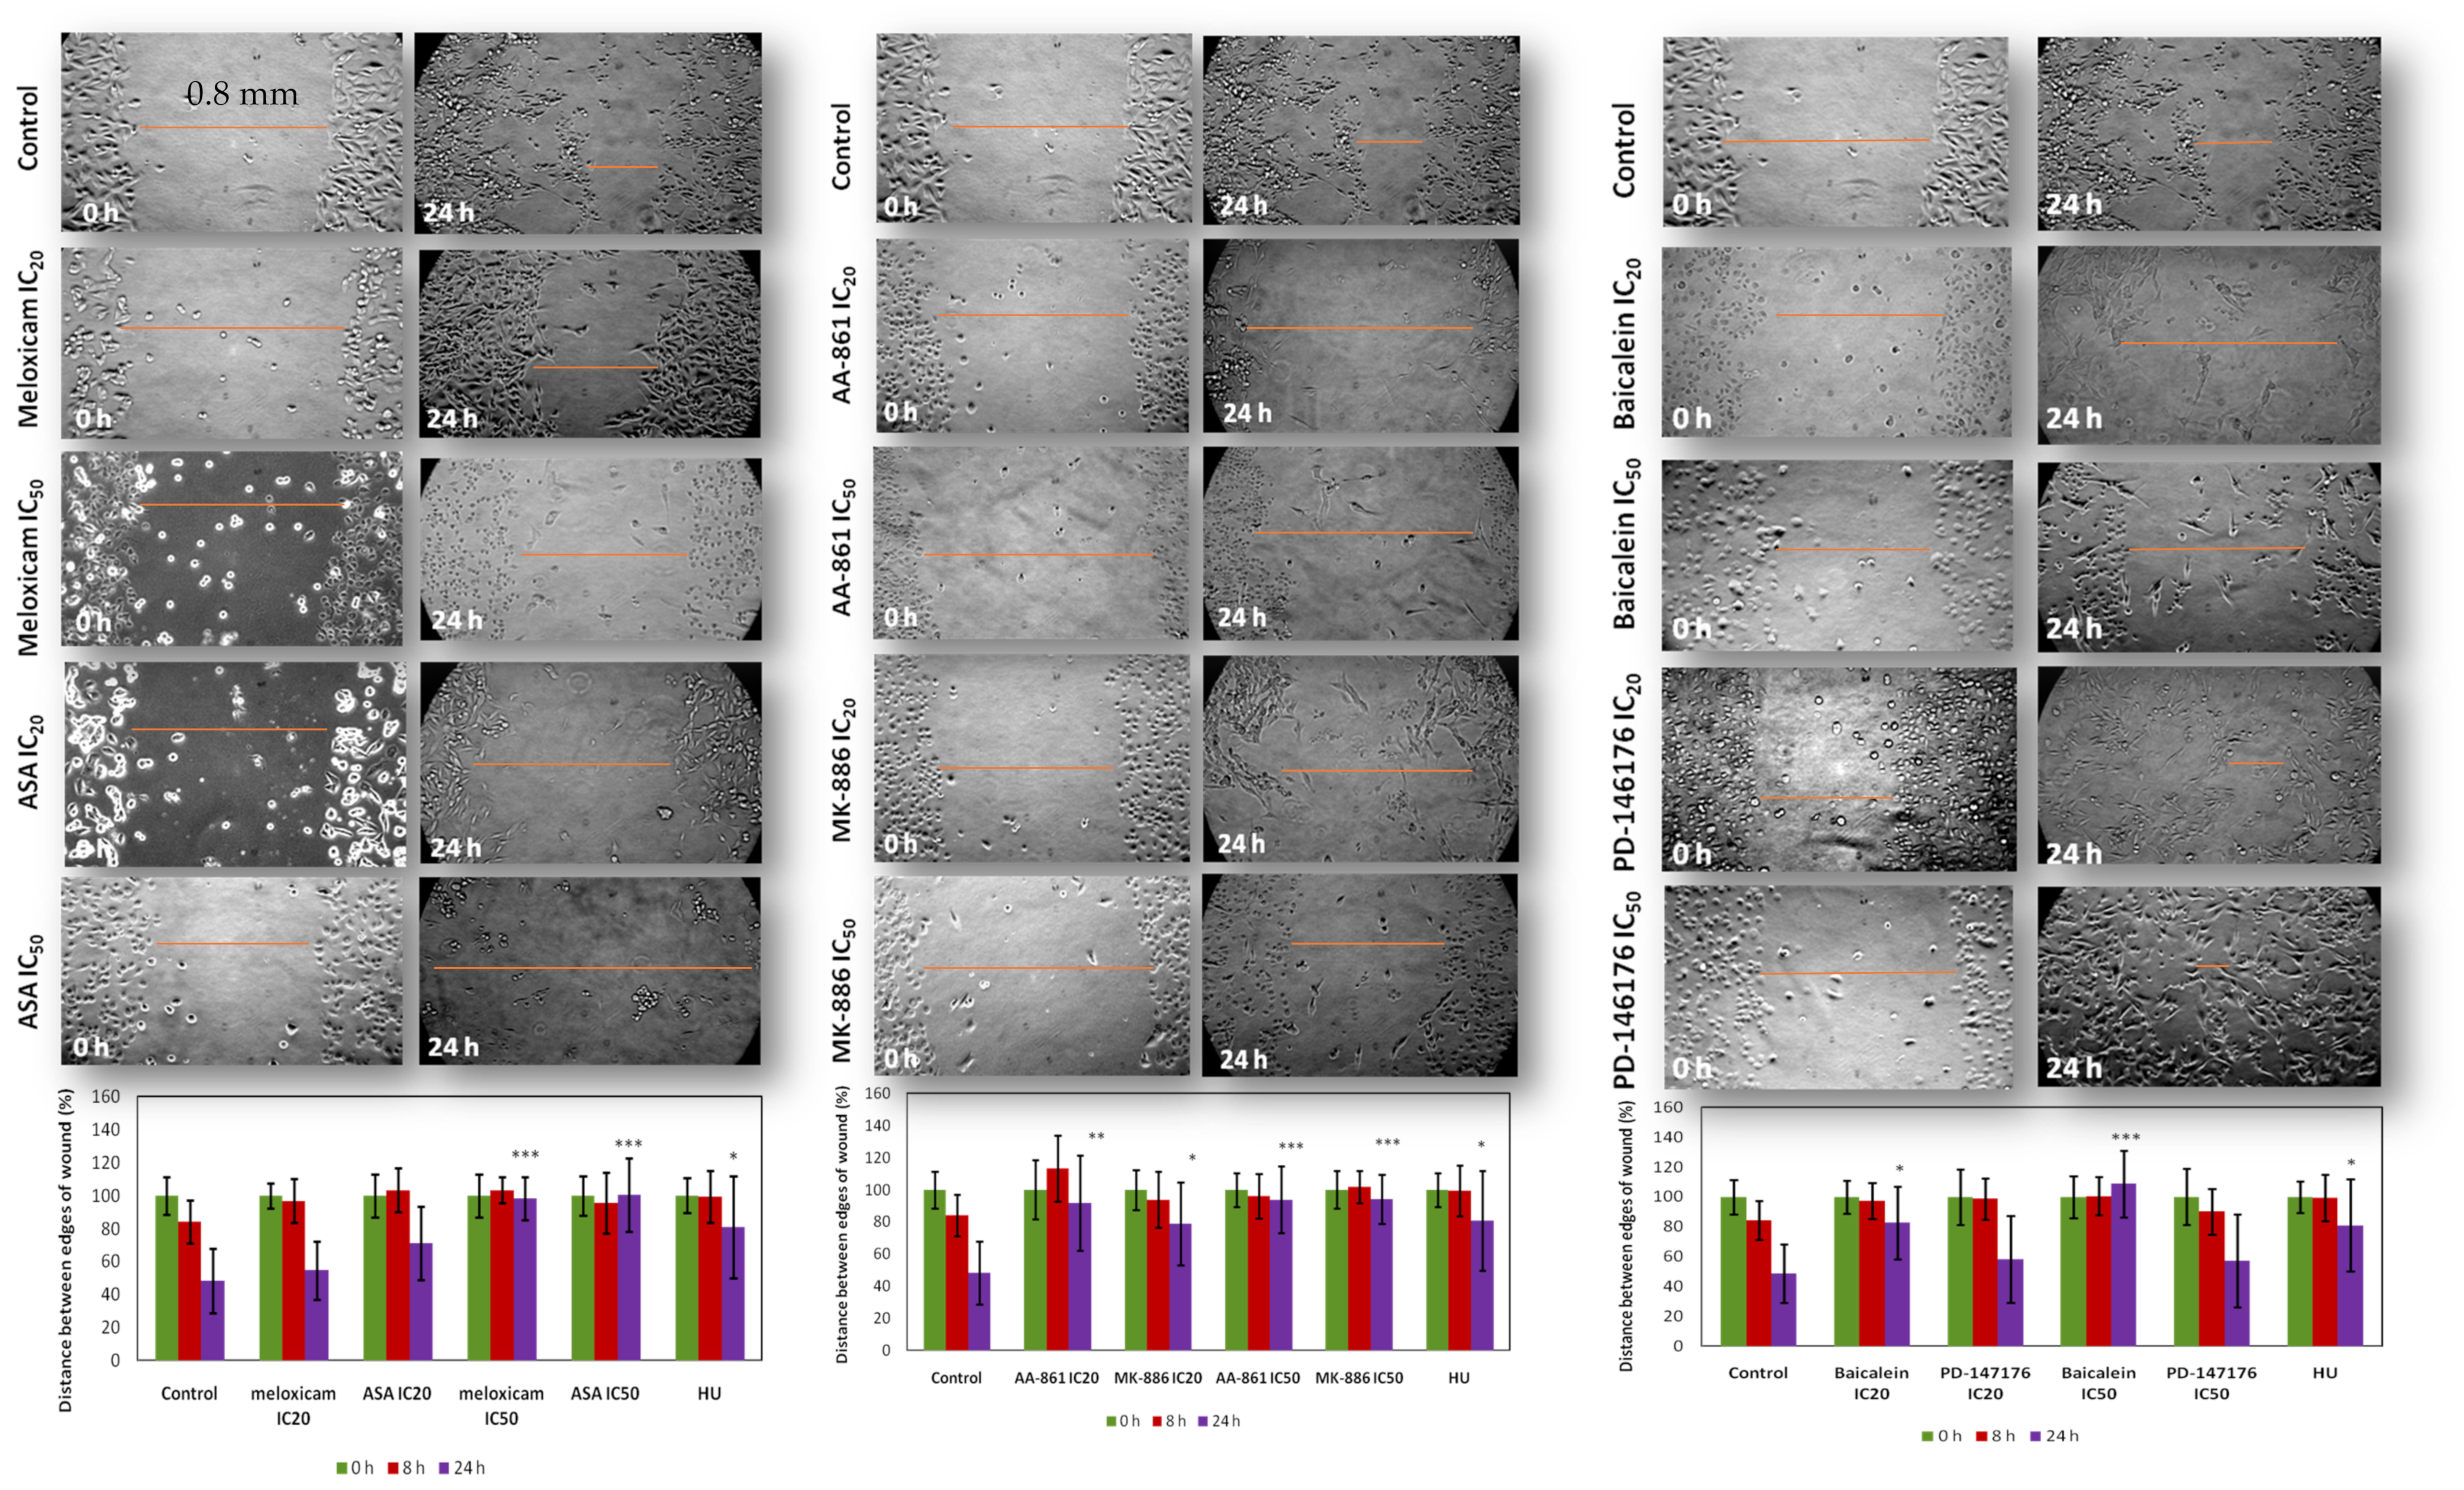
2.5. In Vitro Effect of COX and LOX Inhibitors on Cell 2D Migration/Motility
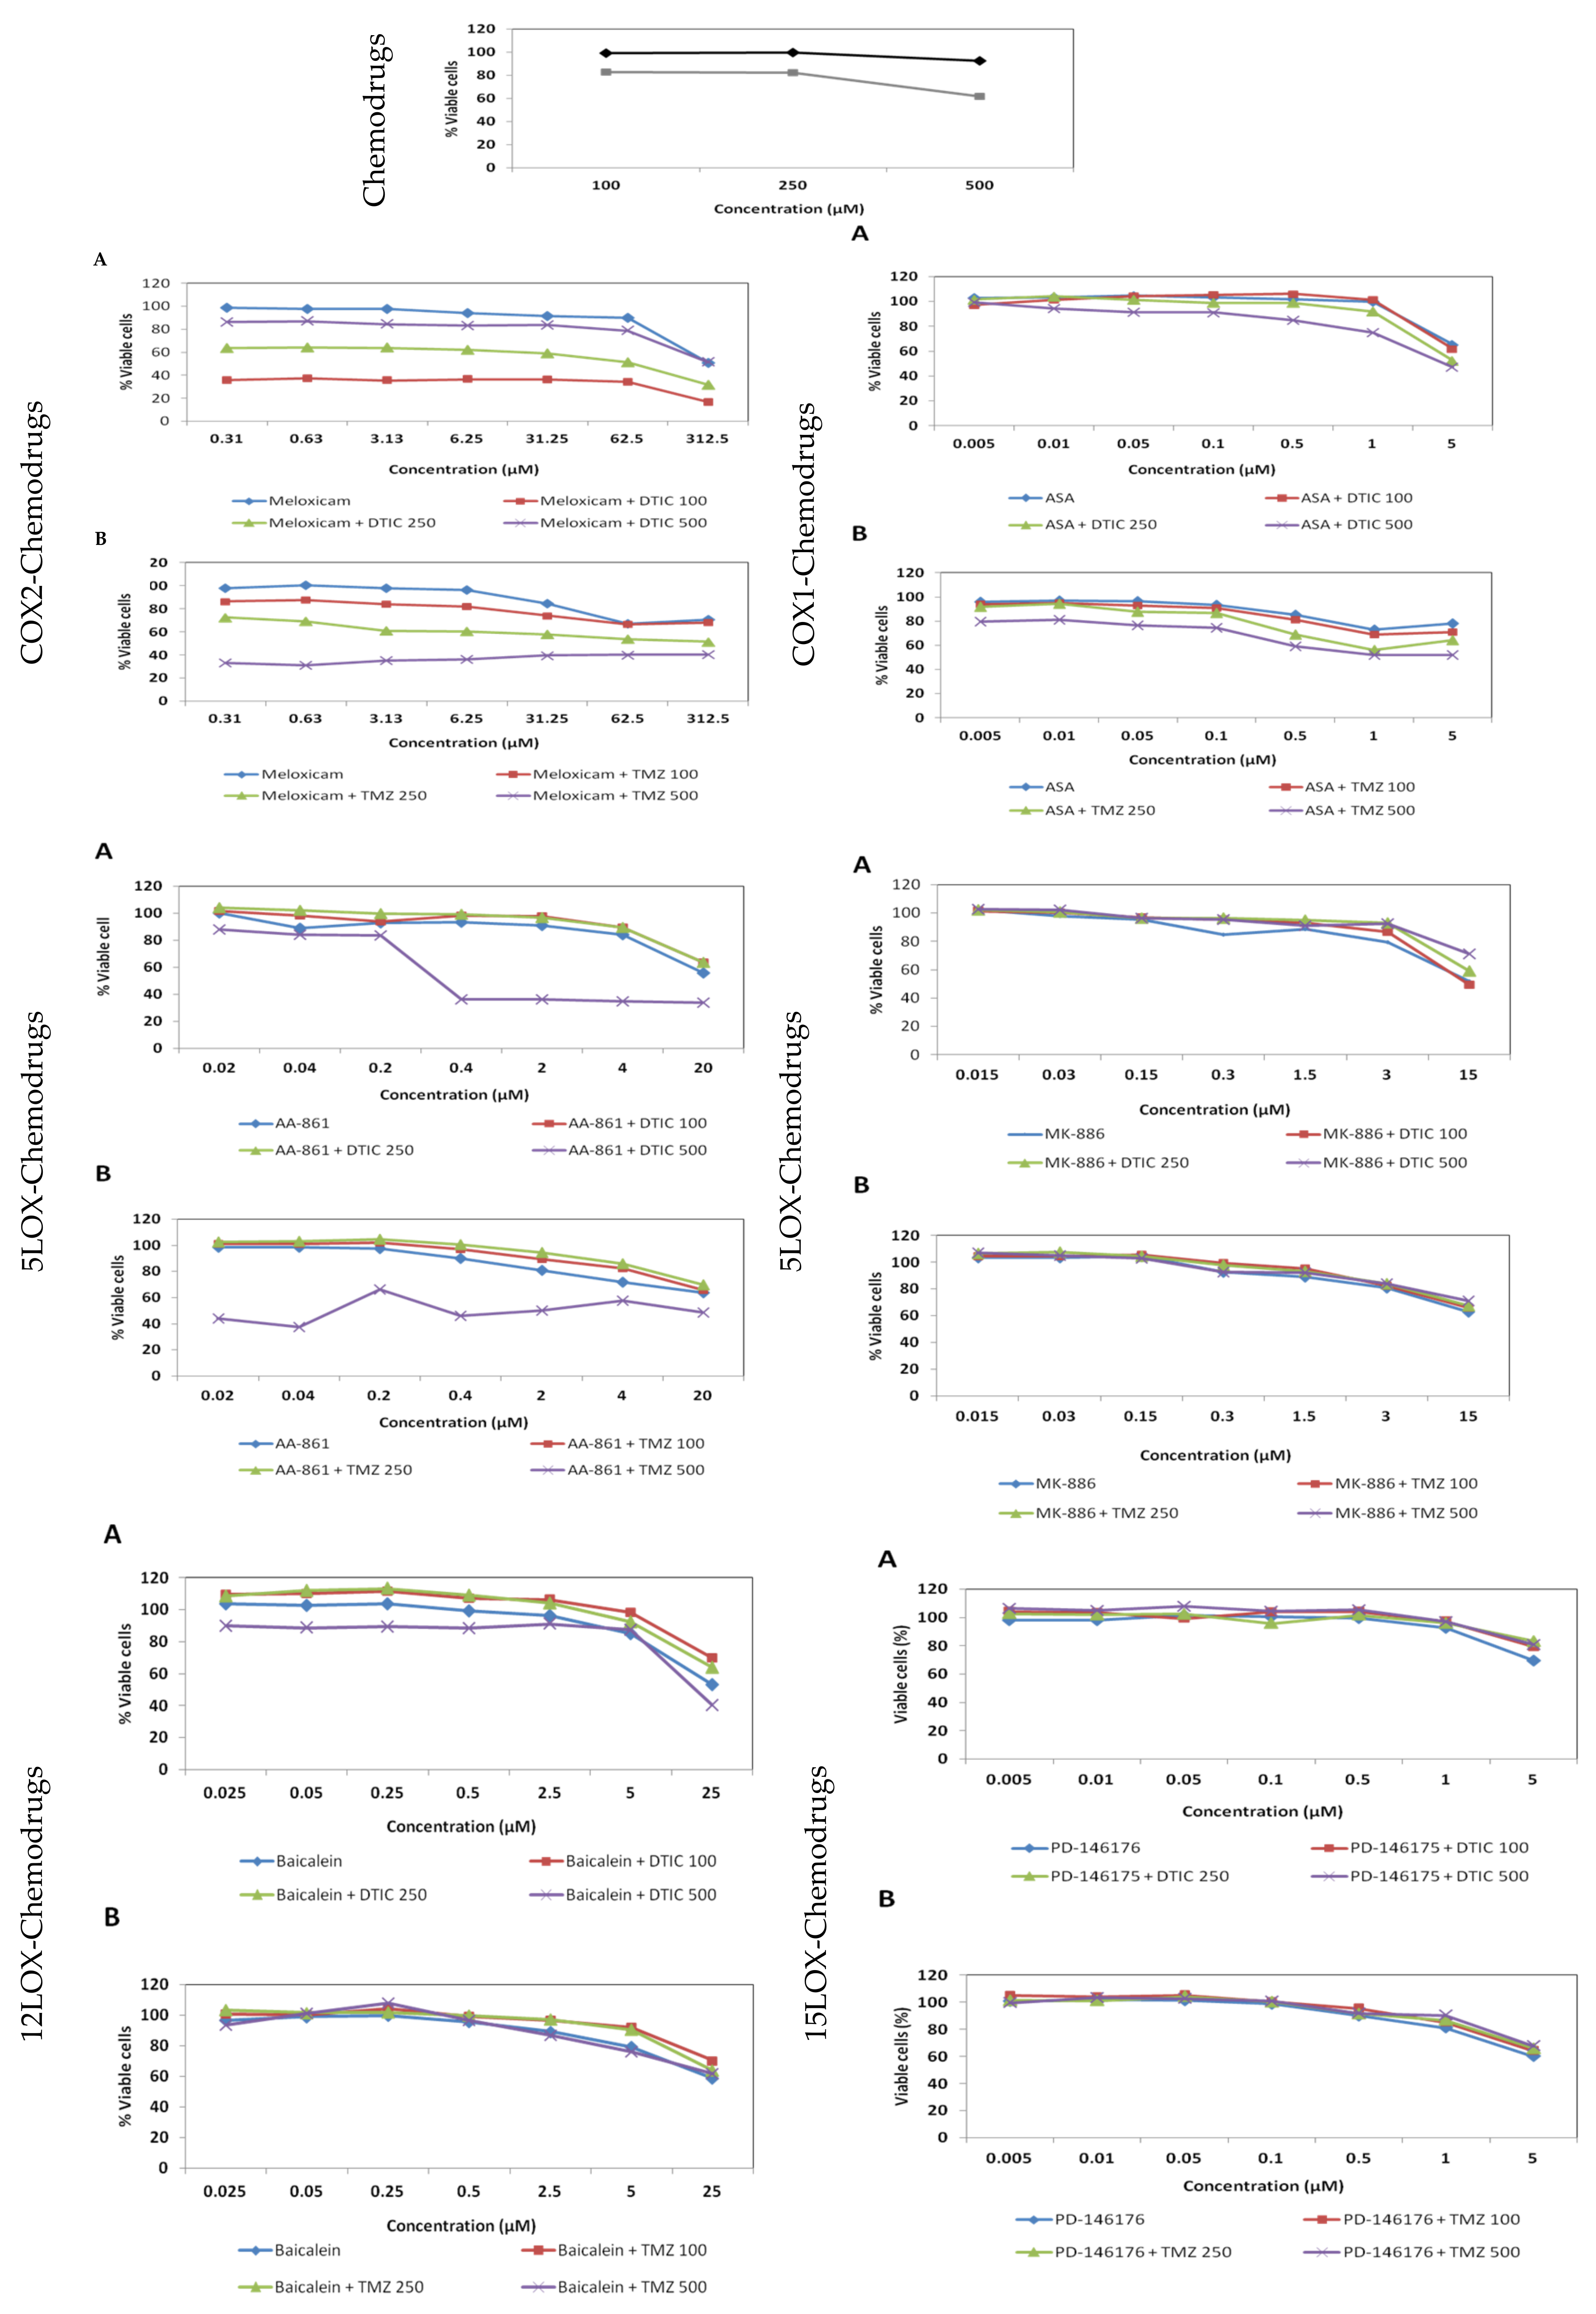
2.6. Effect of the COX/LOX Inhibitors and Antineoplastic Drugs in Combinatorial Treatments on the Proliferation of B16F10 Cells
3. Discussion
3.1. Single Treatments with COX/LOX Inhibitors in B16F10 Cells
3.2. Combinatorial COX/LOX Inhibitors-Antineoplastic Drug Treatments
4. Materials and Methods
4.1. Drug Treatments
4.2. Mammalian Cell Culture
4.3. Mitochondrial Viability Assay
4.4. Proliferation Assays
4.5. Morphology Studies
4.6. Quantification of Eicosanoids Using Enzyme Immune Assay
4.7. Fluorescence Activated Cell Sorting (FACS) Analysis by Propidium Iodide (PI) Staining
4.8. Apoptosis (Caspase 3/7 Activity)
4.9. Migration Assay in a 2D Environment (Scratch/Wound Healing Assay)
4.10. Synergies and Antagonism of Inhibitors and Chemotherapy Drug Combinatorial Treatments
4.11. Statistics
5. Conclusions
Supplementary Materials
Author Contributions
Funding
Institutional Review Board Statement
Informed Consent Statement
Data Availability Statement
Acknowledgments
Conflicts of Interest
References
- Wada-Ohno, M.; Ito, T.; Furue, M. Adjuvant Therapy for Melanoma. Curr. Treat. Options Oncol. 2019, 20, 63. [Google Scholar] [CrossRef]
- Namikawa, K.; Yamazaki, N. Targeted Therapy and Immunotherapy for Melanoma in Japan. Curr. Treat. Options Oncol. 2019, 20, 7. [Google Scholar] [CrossRef] [Green Version]
- Goodman, J.R.; Grossman, D. Aspirin and other NSAIDs as chemoprevention agents in melanoma. Cancer Prev. Res. 2014, 7, 557–564. [Google Scholar] [CrossRef] [Green Version]
- Ma, Y.; Yu, P.; Lin, S.; Li, Q.; Fang, Z.; Huang, Z. The association between nonsteroidal anti-inflammatory drugs and skin cancer: Different responses in American and European populations. Pharmacol. Res. 2020, 152, 104499. [Google Scholar] [CrossRef]
- Denkert, C.; Kobel, M.; Berger, S.; Siegert, A.; Leclere, A.; Trefzer, U.; Hauptmann, S. Expression of cyclooxygenase 2 in human malignant melanoma. Cancer Res. 2001, 61, 303–308. [Google Scholar] [PubMed]
- Becker, M.R.; Siegelin, M.D.; Rompel, R.; Enk, A.H.; Gaiser, T. COX-2 expression in malignant melanoma: A novel prognostic marker? Melanoma Res. 2009, 19, 8–16. [Google Scholar] [CrossRef]
- Winer, I.; Normolle, D.P.; Shureiqi, I.; Sondak, V.K.; Johnson, T.; Su, L.; Brenner, D.E. Expression of 12-lipoxygenase as a biomarker for melanoma carcinogenesis. Melanoma Res. 2002, 12, 429–434. [Google Scholar] [CrossRef]
- Panza, E.; De Cicco, P.; Ercolano, G.; Armogida, C.; Scognamiglio, G.; Anniciello, A.M.; Botti, G.; Cirino, G.; Ianaro, A. Differential expression of cyclooxygenase-2 in metastatic melanoma affects progression free survival. Oncotarget 2016, 7, 57077–57085. [Google Scholar] [CrossRef] [PubMed] [Green Version]
- Vad, N.M.; Kudugunti, S.K.; Wang, H.; Bhat, G.J.; Moridani, M.Y. Efficacy of acetylsalicylic acid (aspirin) in skin B16-F0 melanoma tumor-bearing C57BL/6 mice. Tumour Biol. 2014, 35, 4967–4976. [Google Scholar] [CrossRef] [PubMed]
- Wang, D.; Dubois, R.N. Eicosanoids and cancer. Nat. Rev. Cancer 2010, 10, 181–193. [Google Scholar] [CrossRef]
- Wang, D.Y.; McQuade, J.L.; Rai, R.R.; Park, J.J.; Zhao, S.; Ye, F.; Beckermann, K.E.; Rubinstein, S.M.; Johnpulle, R.; Long, G.V.; et al. The Impact of Nonsteroidal Anti-Inflammatory Drugs, Beta Blockers, and Metformin on the Efficacy of Anti-PD-1 Therapy in Advanced Melanoma. Oncologist 2020, 25, e602–e605. [Google Scholar] [CrossRef]
- Hammerlindl, H.; Ravindran Menon, D.; Hammerlindl, S.; Emran, A.A.; Torrano, J.; Sproesser, K.; Thakkar, D.; Xiao, M.; Atkinson, V.G.; Gabrielli, B.; et al. Acetylsalicylic Acid Governs the Effect of Sorafenib in RAS-Mutant Cancers. Clin. Cancer Res. 2018, 24, 1090–1102. [Google Scholar] [CrossRef] [PubMed] [Green Version]
- Agarwala, S.S.; Kirkwood, J.M. Temozolomide, a novel alkylating agent with activity in the central nervous system, may improve the treatment of advanced metastatic melanoma. Oncologist 2000, 5, 144–151. [Google Scholar] [CrossRef]
- Reich, R.; Martin, G.R. Identification of arachidonic acid pathways required for the invasive and metastatic activity of malignant tumor cells. Prostaglandins 1996, 51, 1–17. [Google Scholar] [CrossRef]
- Fausto de Souza, D.; Tsering, T.; Burnier, M.N.; Bravo-Filho, V.; Dias, A.B.T.; Abdouh, M.; Goyeneche, A.; Burnier, J.V. Acetylsalicylic Acid Exerts Potent Antitumor and Antiangiogenic Effects in Cutaneous and Uveal Melanoma Cell Lines. Ocul. Oncol. Pathol. 2020, 6, 442–455. [Google Scholar] [CrossRef]
- Vad, N.M.; Yount, G.; Moridani, M.Y. Biochemical mechanism of acetylsalicylic acid (Aspirin) selective toxicity toward melanoma cell lines. Melanoma Res. 2008, 18, 386–399. [Google Scholar] [CrossRef]
- Tsai, C.S.; Luo, S.F.; Ning, C.C.; Lin, C.L.; Jiang, M.C.; Liao, C.F. Acetylsalicylic acid regulates MMP-2 activity and inhibits colorectal invasion of murine B16F0 melanoma cells in C57BL/6J mice: Effects of prostaglandin F(2)alpha. Biomed. Pharmacother. 2009, 63, 522–527. [Google Scholar] [CrossRef] [PubMed]
- Sato, K.; Takahashi, H.; Iraha, R.; Toriyama, M. Down-regulation of tyrosinase expression by acetylsalicylic acid in murine B16 melanoma. Biol. Pharm. Bull. 2008, 31, 33–37. [Google Scholar] [CrossRef] [PubMed] [Green Version]
- Nishio, T.; Usami, M.; Awaji, M.; Shinohara, S.; Sato, K. Dual effects of acetylsalicylic acid on ERK signaling and Mitf transcription lead to inhibition of melanogenesis. Mol. Cell. Biochem. 2016, 412, 101–110. [Google Scholar] [CrossRef]
- Chou, D.S.; Hsiao, G.; Lai, Y.A.; Tsai, Y.J.; Sheu, J.R. Baicalein induces proliferation inhibition in B16F10 melanoma cells by generating reactive oxygen species via 12-lipoxygenase. Free Radic. Biol. Med. 2009, 46, 1197–1203. [Google Scholar] [CrossRef]
- Choi, E.O.; Cho, E.J.; Jeong, J.W.; Park, C.; Hong, S.H.; Hwang, H.J.; Moon, S.K.; Son, C.G.; Kim, W.J.; Choi, Y.H. Baicalein Inhibits the Migration and Invasion of B16F10 Mouse Melanoma Cells through Inactivation of the PI3K/Akt Signaling Pathway. Biomol. Ther. 2017, 25, 213–221. [Google Scholar] [CrossRef] [Green Version]
- Park, Y.G.; Choi, J.; Jung, H.K.; Kim, B.; Kim, C.; Park, S.Y.; Seol, J.W. Baicalein inhibits tumor progression by inhibiting tumor cell growth and tumor angiogenesis. Oncol. Rep. 2017, 38, 3011–3018. [Google Scholar] [CrossRef] [PubMed] [Green Version]
- Li, X.; Guo, L.; Sun, Y.; Zhou, J.; Gu, Y.; Li, Y. Baicalein inhibits melanogenesis through activation of the ERK signaling pathway. Int. J. Mol. Med. 2010, 25, 923–927. [Google Scholar] [CrossRef] [Green Version]
- Martínez, C.; Yàñez, J.; Vicente, V.; Alcaraz, M.; Benavente-García, O.; Castillo, J.; Lorente, J.; Lozano, J.A. Effects of several polyhydroxylated flavonoids on the growth of B16F10 melanoma and Melan-a melanocyte cell lines: Influence of the sequential oxidation state of the flavonoid skeleton. Melanoma Res. 2003, 13, 3–9. [Google Scholar] [CrossRef] [PubMed]
- Huang, L.; Peng, B.; Nayak, Y.; Wang, C.; Si, F.; Liu, X.; Dou, J.; Xu, H.; Peng, G. Baicalein and Baicalin Promote Melanoma Apoptosis and Senescence via Metabolic Inhibition. Front Cell Dev. Biol. 2020, 8, 836. [Google Scholar] [CrossRef]
- Lofgren, J.; Miller, A.L.; Lee, C.C.S.; Bradshaw, C.; Flecknell, P.; Roughan, J. Analgesics promote welfare and sustain tumour growth in orthotopic 4T1 and B16 mouse cancer models. Lab. Anim. 2018, 52, 351–364. [Google Scholar] [CrossRef] [PubMed] [Green Version]
- Alaaeddine, R.A.; Elzahhar, P.A.; AlZaim, I.; Abou-Kheir, W.; Belal, A.S.F.; El-Yazbi, A.F. The Emerging Role of COX-2, 15-LOX and PPARγ in Metabolic Diseases and Cancer: An Introduction to Novel Multi-target Directed Ligands (MTDLs). Curr. Med. Chem. 2021, 28, 2260–2300. [Google Scholar] [CrossRef] [PubMed]
- Sawada, N.; Kataoka, K.; Kondo, K.; Arimochi, H.; Fujino, H.; Takahashi, Y.; Miyoshi, T.; Kuwahara, T.; Monden, Y.; Ohnishi, Y. Betulinic acid augments the inhibitory effects of vincristine on growth and lung metastasis of B16F10 melanoma cells in mice. Br. J. Cancer 2004, 90, 1672–1678. [Google Scholar] [CrossRef] [Green Version]
- Schon, M.; Wienrich, B.G.; Kneitz, S.; Sennefelder, H.; Amschler, K.; Vohringer, V.; Weber, O.; Stiewe, T.; Ziegelbauer, K.; Schon, M.P. KINK-1, a novel small-molecule inhibitor of IKKbeta, and the susceptibility of melanoma cells to antitumoral treatment. J. Natl. Cancer Inst. 2008, 100, 862–875. [Google Scholar] [CrossRef] [Green Version]
- Mathieu, V.; Le Mercier, M.; De Neve, N.; Sauvage, S.; Gras, T.; Roland, I.; Lefranc, F.; Kiss, R. Galectin-1 Knockdown Increases Sensitivity to Temozolomide in a B16F10 Mouse Metastatic Melanoma Model. J. Investig. Dermatol. 2007, 127, 2399–2410. [Google Scholar] [CrossRef] [PubMed]
- Ganesh, R.; Marks, D.J.; Sales, K.; Winslet, M.C.; Seifalian, A.M. Cyclooxygenase/lipoxygenase shunting lowers the anti-cancer effect of cyclooxygenase-2 inhibition in colorectal cancer cells. World J. Surg. Oncol. 2012, 10, 200. [Google Scholar] [CrossRef] [PubMed] [Green Version]
- Decaestecker, C.; Debeir, O.; Van Ham, P.; Kiss, R. Can anti-migratory drugs be screened in vitro? A review of 2D and 3D assays for the quantitative analysis of cell migration. Med. Res. Rev. 2007, 27, 149–176. [Google Scholar] [CrossRef] [PubMed]
- McMillan, T.J.; Rao, J.; Hart, I.R. Enhancement of experimental metastasis by pretreatment of tumour cells with hydroxyurea. Int. J. Cancer 1986, 38, 61–65. [Google Scholar] [CrossRef]
- Yin, J.; Lu, J.; Yu, F.S. Role of small GTPase Rho in regulating corneal epithelial wound healing. Investig. Ophthalmol. Vis. Sci. 2008, 49, 900–909. [Google Scholar] [CrossRef] [PubMed] [Green Version]
- Da Costa Rocha, I. Effect of Cox and Lox Inhibitors on Melanoma. Ph.D. Thesis, University of London, London, UK, 2012. [Google Scholar]
- Jun, H.S.; Park, T.; Lee, C.K.; Kang, M.K.; Park, M.S.; Kang, H.I.; Surh, Y.J.; Kim, O.H. Capsaicin induced apoptosis of B16-F10 melanoma cells through down-regulation of Bcl-2. Food Chem. Toxicol. 2007, 45, 708–715. [Google Scholar] [CrossRef]
- Liu, X.; Shi, Y.; Guan, R.; Donawho, C.; Luo, Y.; Palma, J.; Zhu, G.D.; Johnson, E.F.; Rodriguez, L.E.; Ghoreishi-Haack, N.; et al. Potentiation of temozolomide cytotoxicity by poly(ADP)ribose polymerase inhibitor ABT-888 requires a conversion of single-stranded DNA damages to double-stranded DNA breaks. Mol. Cancer Res. 2008, 6, 1621–1629. [Google Scholar] [CrossRef] [Green Version]
- Ko, S.H.; Choi, G.J.; Lee, J.H.; Han, Y.A.; Lim, S.J.; Kim, S.H. Differential effects of selective cyclooxygenase-2 inhibitors in inhibiting proliferation and induction of apoptosis in oral squamous cell carcinoma. Oncol. Rep. 2008, 19, 425–433. [Google Scholar] [CrossRef]
- Bellosillo, B.; Pique, M.; Barragan, M.; Castano, E.; Villamor, N.; Colomer, D.; Montserrat, E.; Pons, G.; Gil, J. Aspirin and salicylate induce apoptosis and activation of caspases in B-cell chronic lymphocytic leukemia cells. Blood 1998, 92, 1406–1414. [Google Scholar] [CrossRef]
- Gogas, H.; Polyzos, A.; Stavrinidis, I.; Frangia, K.; Tsoutsos, D.; Panagiotou, P.; Markopoulos, C.; Papadopoulos, O.; Pectasides, D.; Mantzourani, M.; et al. Temozolomide in combination with celecoxib in patients with advanced melanoma. A phase II study of the Hellenic Cooperative Oncology Group. Ann. Oncol. 2006, 17, 1835–1841. [Google Scholar] [CrossRef]
- Ferrer, P.; Asensi, M.; Segarra, R.; Ortega, A.; Benlloch, M.; Obrador, E.; Varea, M.T.; Asensio, G.; Jorda, L.; Estrela, J.M. Association between pterostilbene and quercetin inhibits metastatic activity of B16 melanoma. Neoplasia 2005, 7, 37–47. [Google Scholar] [CrossRef] [PubMed] [Green Version]
- Stringfellow, D.A. Prostaglandins and metastasis. Symp. Fundam. Cancer Res. 1983, 36, 123–131. [Google Scholar] [PubMed]
- Fitzpatrick, F.A.; Stringfellow, D.A. Prostaglandin D2 formation by malignant melanoma cells correlates inversely with cellular metastatic potential. Proc. Natl. Acad. Sci. USA 1979, 76, 1765–1769. [Google Scholar] [CrossRef] [PubMed] [Green Version]
- Gava, B.; Zorzet, S.; Spessotto, P.; Cocchietto, M.; Sava, G. Inhibition of B16 melanoma metastases with the ruthenium complex imidazolium trans-imidazoledimethylsulfoxide-tetrachlororuthenate and down-regulation of tumor cell invasion. J. Pharmacol. Exp. Ther. 2006, 317, 284–291. [Google Scholar] [CrossRef]
- Ghosh, S.; Maity, P. Augmented antitumor effects of combination therapy with VEGF antibody and cisplatin on murine B16F10 melanoma cells. Int. Immunopharmacol. 2007, 7, 1598–1608. [Google Scholar] [CrossRef]
- Yao, Z.; Che, X.C.; Lu, R.; Zheng, M.N.; Zhu, Z.F.; Li, J.P.; Jian, X.; Shi, L.X.; Liu, J.Y.; Gao, W.Y. Inhibition by tyroserleutide (YSL) on the invasion and adhesion of the mouse melanoma cell. Mol. Med. 2007, 13, 14–21. [Google Scholar] [CrossRef]
- Hassan, S.; Carraway, R.E. Involvement of arachidonic acid metabolism and EGF receptor in neurotensin-induced prostate cancer PC3 cell growth. Regul. Pept. 2006, 133, 105–114. [Google Scholar] [CrossRef]
- Kelavkar, U.P.; Nixon, J.B.; Cohen, C.; Dillehay, D.; Eling, T.E.; Badr, K.F. Overexpression of 15-lipoxygenase-1 in PC-3 human prostate cancer cells increases tumorigenesis. Carcinogenesis 2001, 22, 1765–1773. [Google Scholar] [CrossRef] [Green Version]
- Mosmann, T. Rapid colorimetric assay for cellular growth and survival: Application to proliferation and cytotoxicity assays. J. Immunol. Methods 1983, 65, 55–63. [Google Scholar] [CrossRef]
- Rubinstein, L.; Shoemaker, R.; Paull, K.; Simon, R.; Tosini, S.; Skehan, P.; Scudiero, D.; Monks, A.; Boyd, M. Comparison of in vitro anticancer-drug-screening data generated with a tetrazolium assay versus a protein assay against a diverse panel of human tumor cell lines. J. Natl. Cancer Inst. 1990, 82, 1113–1118. [Google Scholar] [CrossRef] [PubMed]
- Skehan, P.; Storeng, R.; Scudiero, D.; Monks, A.; McMahon, J.; Vistica, D.; Warren, J.T.; Bokesch, H.; Kenney, S.; Boyd, M.R. New colorimetric cytotoxicity assay for anticancer-drug screening. J. Natl. Cancer Inst. 1990, 82, 1107–1112. [Google Scholar] [CrossRef]
- Liang, C.-C.; Park, A.Y.; Guan, J.-L. In Vitro scratch assay: A convenient and inexpensive method for analysis of cell migration in vitro. Nat. Protoc. 2007, 2, 329–333. [Google Scholar] [CrossRef] [PubMed] [Green Version]
- Yarrow, J.; Perlman, Z.; Westwood, N.; Mitchison, T. A high-throughput cell migration assay using scratch wound healing, a comparison of image-based readout methods. BMC Biotechnol. 2004, 4, 21. [Google Scholar] [CrossRef] [PubMed] [Green Version]
- Chou, T.C.; Talalay, P. Quantitative analysis of dose-effect relationships: The combined effects of multiple drugs or enzyme inhibitors. Adv. Enzym. Regul. 1984, 22, 27–55. [Google Scholar] [CrossRef]


| DTIC | ASA | TMZ | ASA | ||||||||||||
|---|---|---|---|---|---|---|---|---|---|---|---|---|---|---|---|
| 5 | 10 | 50 | 100 | 500 | 1000 | 5000 | 5 | 10 | 50 | 100 | 500 | 1000 | 5000 | ||
| 100 | + | 100 | 3S | 2S | + | 1S | 3S | 4S | + | ||||||
| 250 | 2A | 3S | + | 250 | 1S | 2A | 2S | 2S | 3S | 3S | 2S | ||||
| 500 | 3S | 3S | + | 500 | + | + | + | + | 3S | 3S | 3S | ||||
| DTIC | Meloxicam | TMZ | Meloxicam | ||||||||||||
| 0.31 | 0.63 | 3.13 | 6.25 | 31.25 | 62.50 | 312.50 | 0.31 | 0.63 | 3.13 | 6.25 | 31.25 | 62.50 | 312.50 | ||
| 100 | 5S | 5S | 5S | 5S | 5S | 5S | 5S | 100 | 4S | 4S | 4S | 3S | 3S | 3S | 1A |
| 250 | 4S | 4S | 4S | 4S | 4S | 4S | 4S | 250 | 3S | 3S | 3S | 3S | 3S | 3S | 2A |
| 500 | 3S | 3S | 3S | 3S | 3S | 3S | 3S | 500 | 3S | 3S | 3S | 3S | 3S | 3S | 1S |
| DTIC | AA-861 | TMZ | AA-861 | ||||||||||||
| 0.02 | 0.04 | 0.20 | 0.40 | 2.00 | 4.00 | 20.00 | 0.02 | 0.04 | 0.20 | 0.40 | 2.00 | 4.00 | 20.00 | ||
| 100 | 3A | 2S | 5A | 5A | 4A | 2S | 100 | 4A | 3A | 3A | 3A | ||||
| 250 | 5A | 5A | 5A | 5A | 4S | + | 250 | 4A | 3A | 3A | |||||
| 500 | 3S | 3S | 3S | 5S | 5S | 5S | 4S | 500 | 3S | 3S | 2S | 3S | 3S | 1S | 2A |
| DTIC | MK-886 | TMZ | MK-886 | ||||||||||||
| 0.015 | 0.030 | 0.150 | 0.300 | 1.500 | 3.000 | 15.000 | 0.015 | 0.030 | 0.150 | 0.300 | 1.500 | 3.000 | 15.000 | ||
| 100 | 4A | 3A | 4A | 4A | 3S | 100 | 5A | 5A | 3A | 2A | |||||
| 250 | 3A | 5A | 5A | 5A | 2A | 250 | 5A | 4A | 3A | 3A | |||||
| 500 | 3A | 4A | 4A | 5A | 3A | 500 | 3A | 4A | 3A | 3A | |||||
| DTIC | Baicalein | TMZ | Baicalein | ||||||||||||
| 0.025 | 0.050 | 0.250 | 0.500 | 2.500 | 5.000 | 25.000 | 0.025 | 0.050 | 0.250 | 0.500 | 2.500 | 5.000 | 25.000 | ||
| 100 | 4A | 3A | 100 | 5A | 4A | 4A | 2A | ||||||||
| 250 | 3A | 3A | 250 | 5A | 5A | 3A | 1A | ||||||||
| 500 | 3S | 3S | 3S | 3S | + | 2S | + | 500 | 4A | 3A | 2A | 2A | |||
| DTIC | PD-146176 | TMZ | PD-146176 | ||||||||||||
| 0.005 | 0.010 | 0.050 | 0.100 | 0.500 | 1.000 | 5.000 | 0.005 | 0.010 | 0.050 | 0.100 | 0.500 | 1.000 | 5.000 | ||
| 100 | 2A | 2A | 100 | 3A | 2A | 3A | |||||||||
| 250 | 2A | 3A | 250 | 3A | 3A | 3A | |||||||||
| 500 | 3A | 3A | 500 | 3A | 3A | 3A | |||||||||
| [CHEMODRUG] | |||||
|---|---|---|---|---|---|
| Vehicle | 1/10 IC50 | 1/4 IC50 | 1/2 IC50 | ||
| Vehicle | Control | SingleChemodrug | SingleChemodrug | SingleChemodrug | |
| [DRUG] | 1/2000 IC50 | SingleDrug | CombDrug-Chemodrug | CombDrug-Chemodrug | CombDrug-Chemodrug |
| 1/1000 IC50 | SingleDrug | CombDrug-Chemodrug | CombDrug-Chemodrug | CombDrug-Chemodrug | |
| 1/200 IC50 | SingleDrug | CombDrug-Chemodrug | CombDrug-Chemodrug | CombDrug-Chemodrug | |
| 1/100 IC50 | SingleDrug | CombDrug-Chemodrug | CombDrug-Chemodrug | CombDrug-Chemodrug | |
| 1/20 IC50 | SingleDrug | CombDrug-Chemodrug | CombDrug-Chemodrug | CombDrug-Chemodrug | |
| 1/10 IC50 | SingleDrug | CombDrug-Chemodrug | CombDrug-Chemodrug | CombDrug-Chemodrug | |
| 1/2 IC50 | SingleDrug | CombDrug-Chemodrug | CombDrug-Chemodrug | CombDrug-Chemodrug | |
Publisher’s Note: MDPI stays neutral with regard to jurisdictional claims in published maps and institutional affiliations. |
© 2021 by the authors. Licensee MDPI, Basel, Switzerland. This article is an open access article distributed under the terms and conditions of the Creative Commons Attribution (CC BY) license (https://creativecommons.org/licenses/by/4.0/).
Share and Cite
Da-Costa-Rocha, I.; Prieto, J.M. In Vitro Effects of Selective COX and LOX Inhibitors and Their Combinations with Antineoplastic Drugs in the Mouse Melanoma Cell Line B16F10. Int. J. Mol. Sci. 2021, 22, 6498. https://0-doi-org.brum.beds.ac.uk/10.3390/ijms22126498
Da-Costa-Rocha I, Prieto JM. In Vitro Effects of Selective COX and LOX Inhibitors and Their Combinations with Antineoplastic Drugs in the Mouse Melanoma Cell Line B16F10. International Journal of Molecular Sciences. 2021; 22(12):6498. https://0-doi-org.brum.beds.ac.uk/10.3390/ijms22126498
Chicago/Turabian StyleDa-Costa-Rocha, Ines, and Jose M. Prieto. 2021. "In Vitro Effects of Selective COX and LOX Inhibitors and Their Combinations with Antineoplastic Drugs in the Mouse Melanoma Cell Line B16F10" International Journal of Molecular Sciences 22, no. 12: 6498. https://0-doi-org.brum.beds.ac.uk/10.3390/ijms22126498