
Electrophysiology of hiPSC-Cardiomyocytes Co-Cultured with HEK Cells Expressing the Inward Rectifier Channel

 , , , and
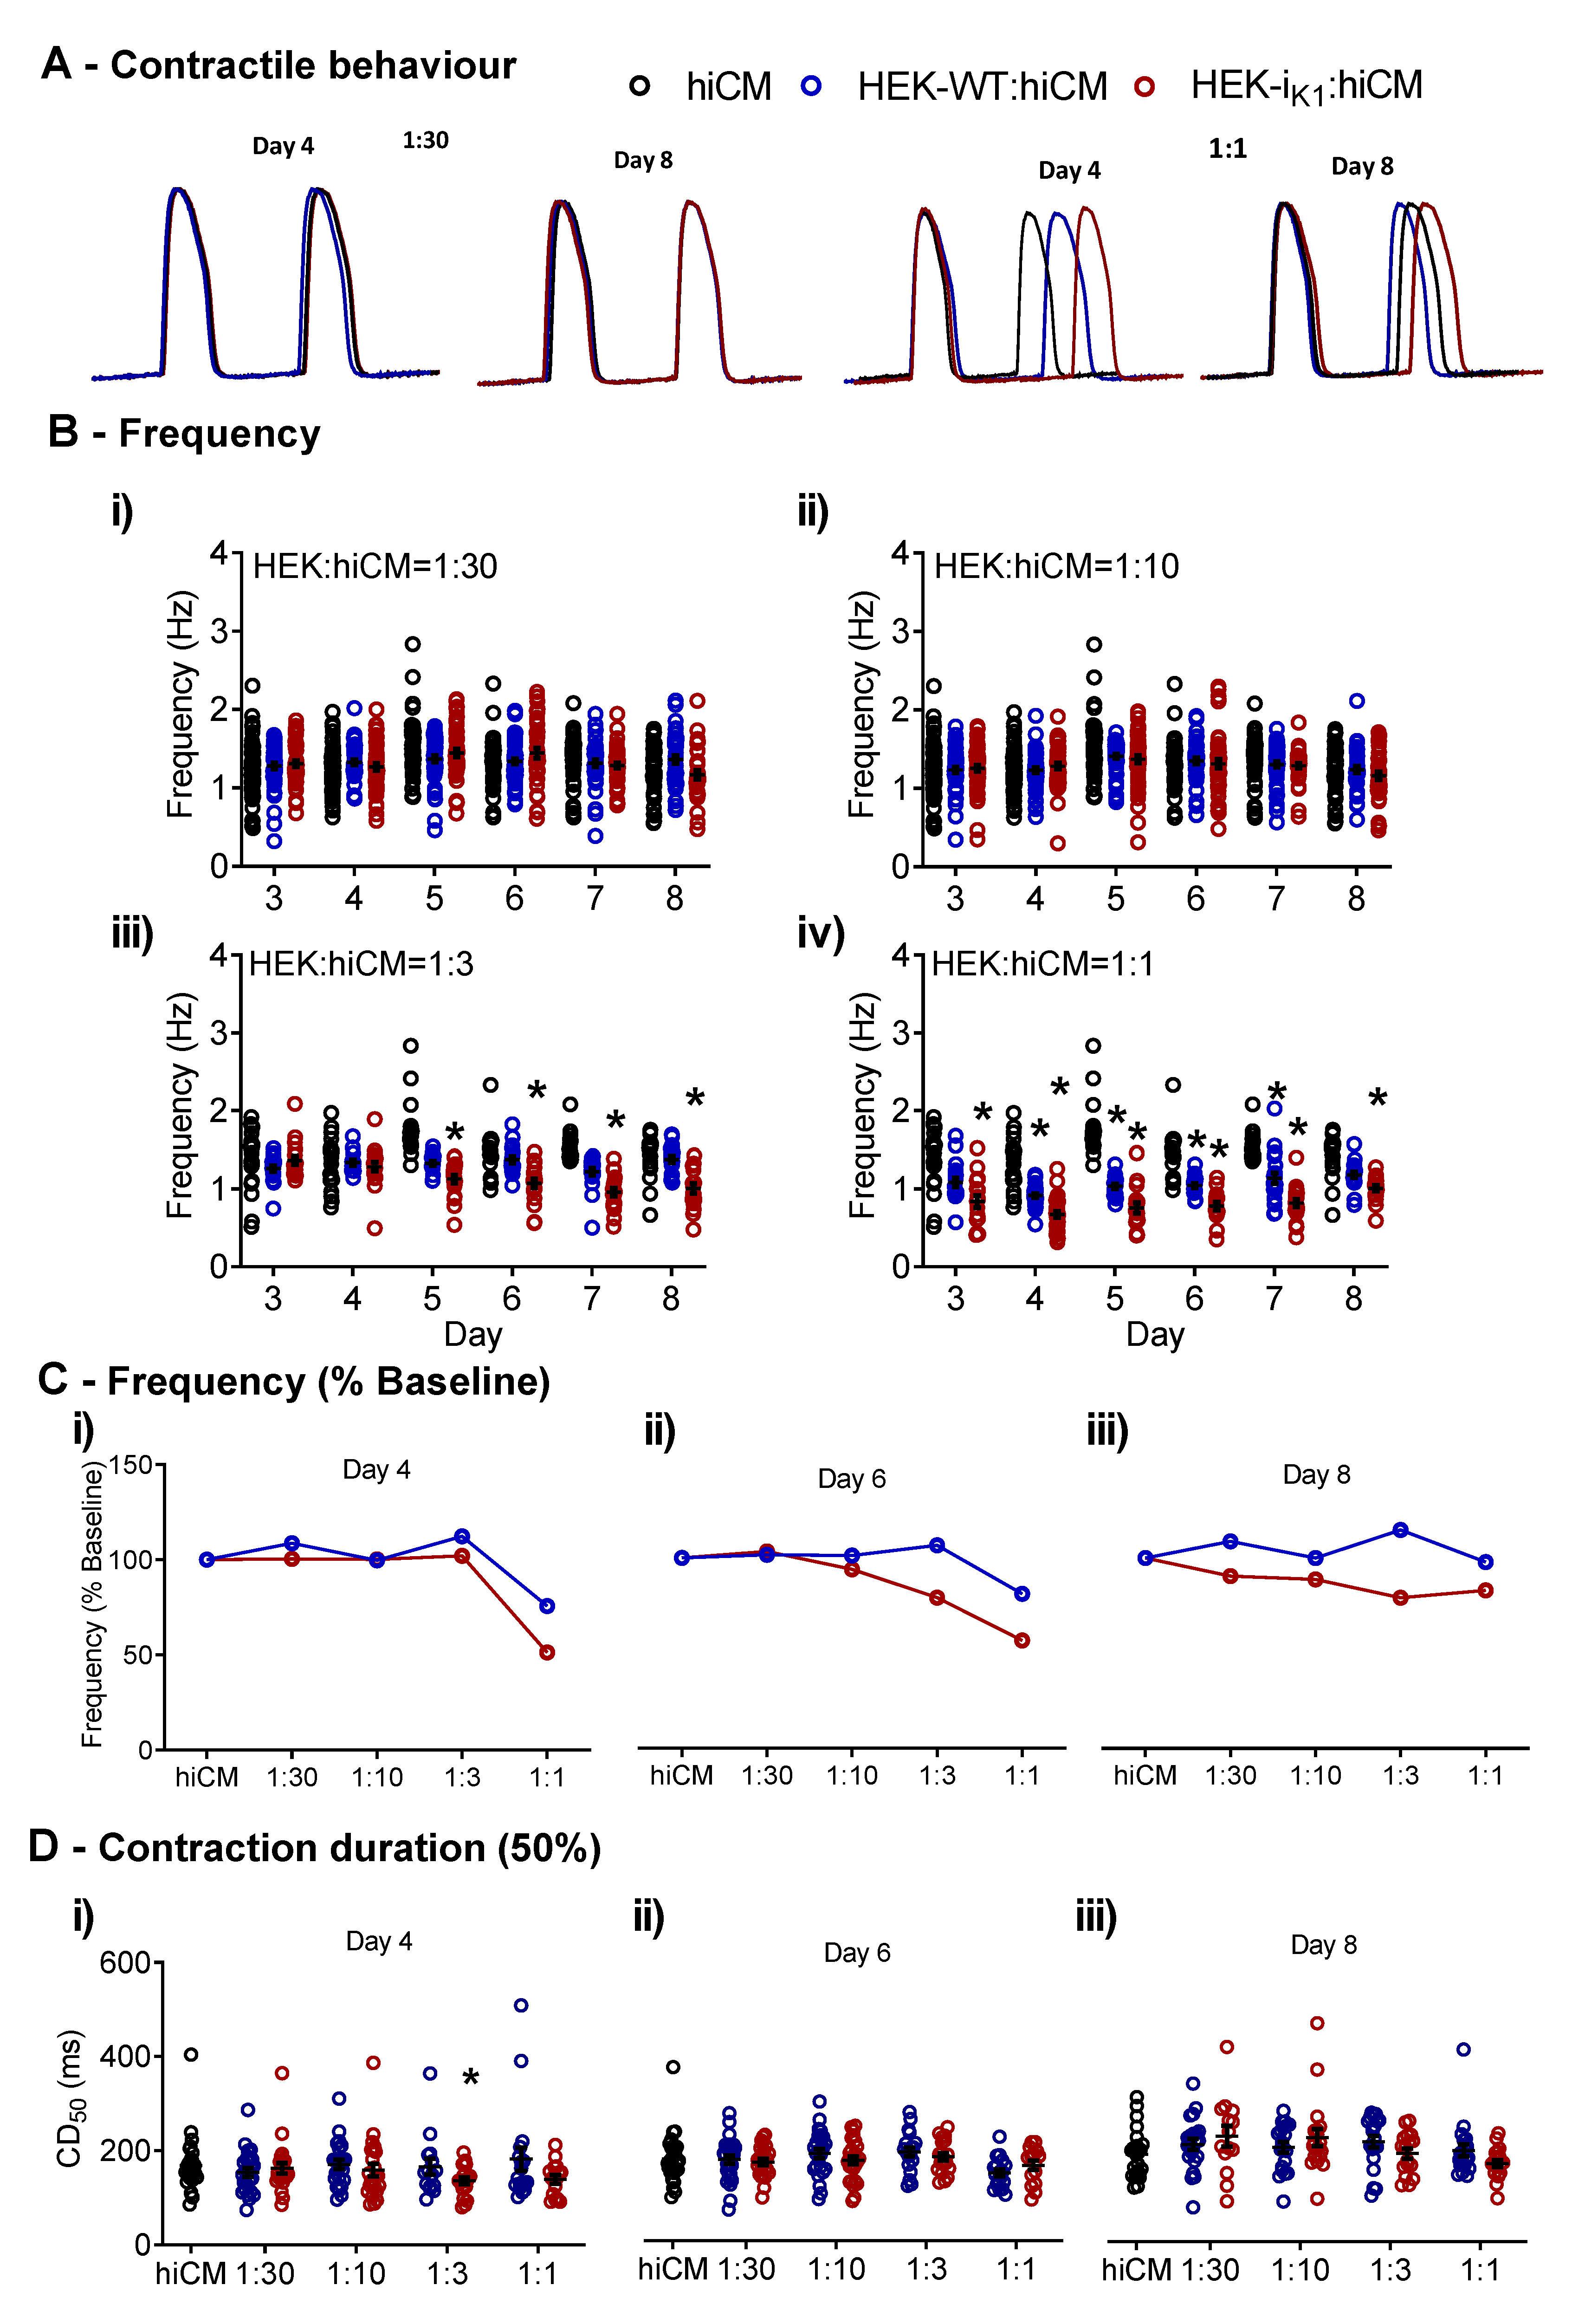
Abstract
:1. Introduction
2. Results
2.1. Effects of Co-Culture on Spontaneous Rate and Contraction Duration
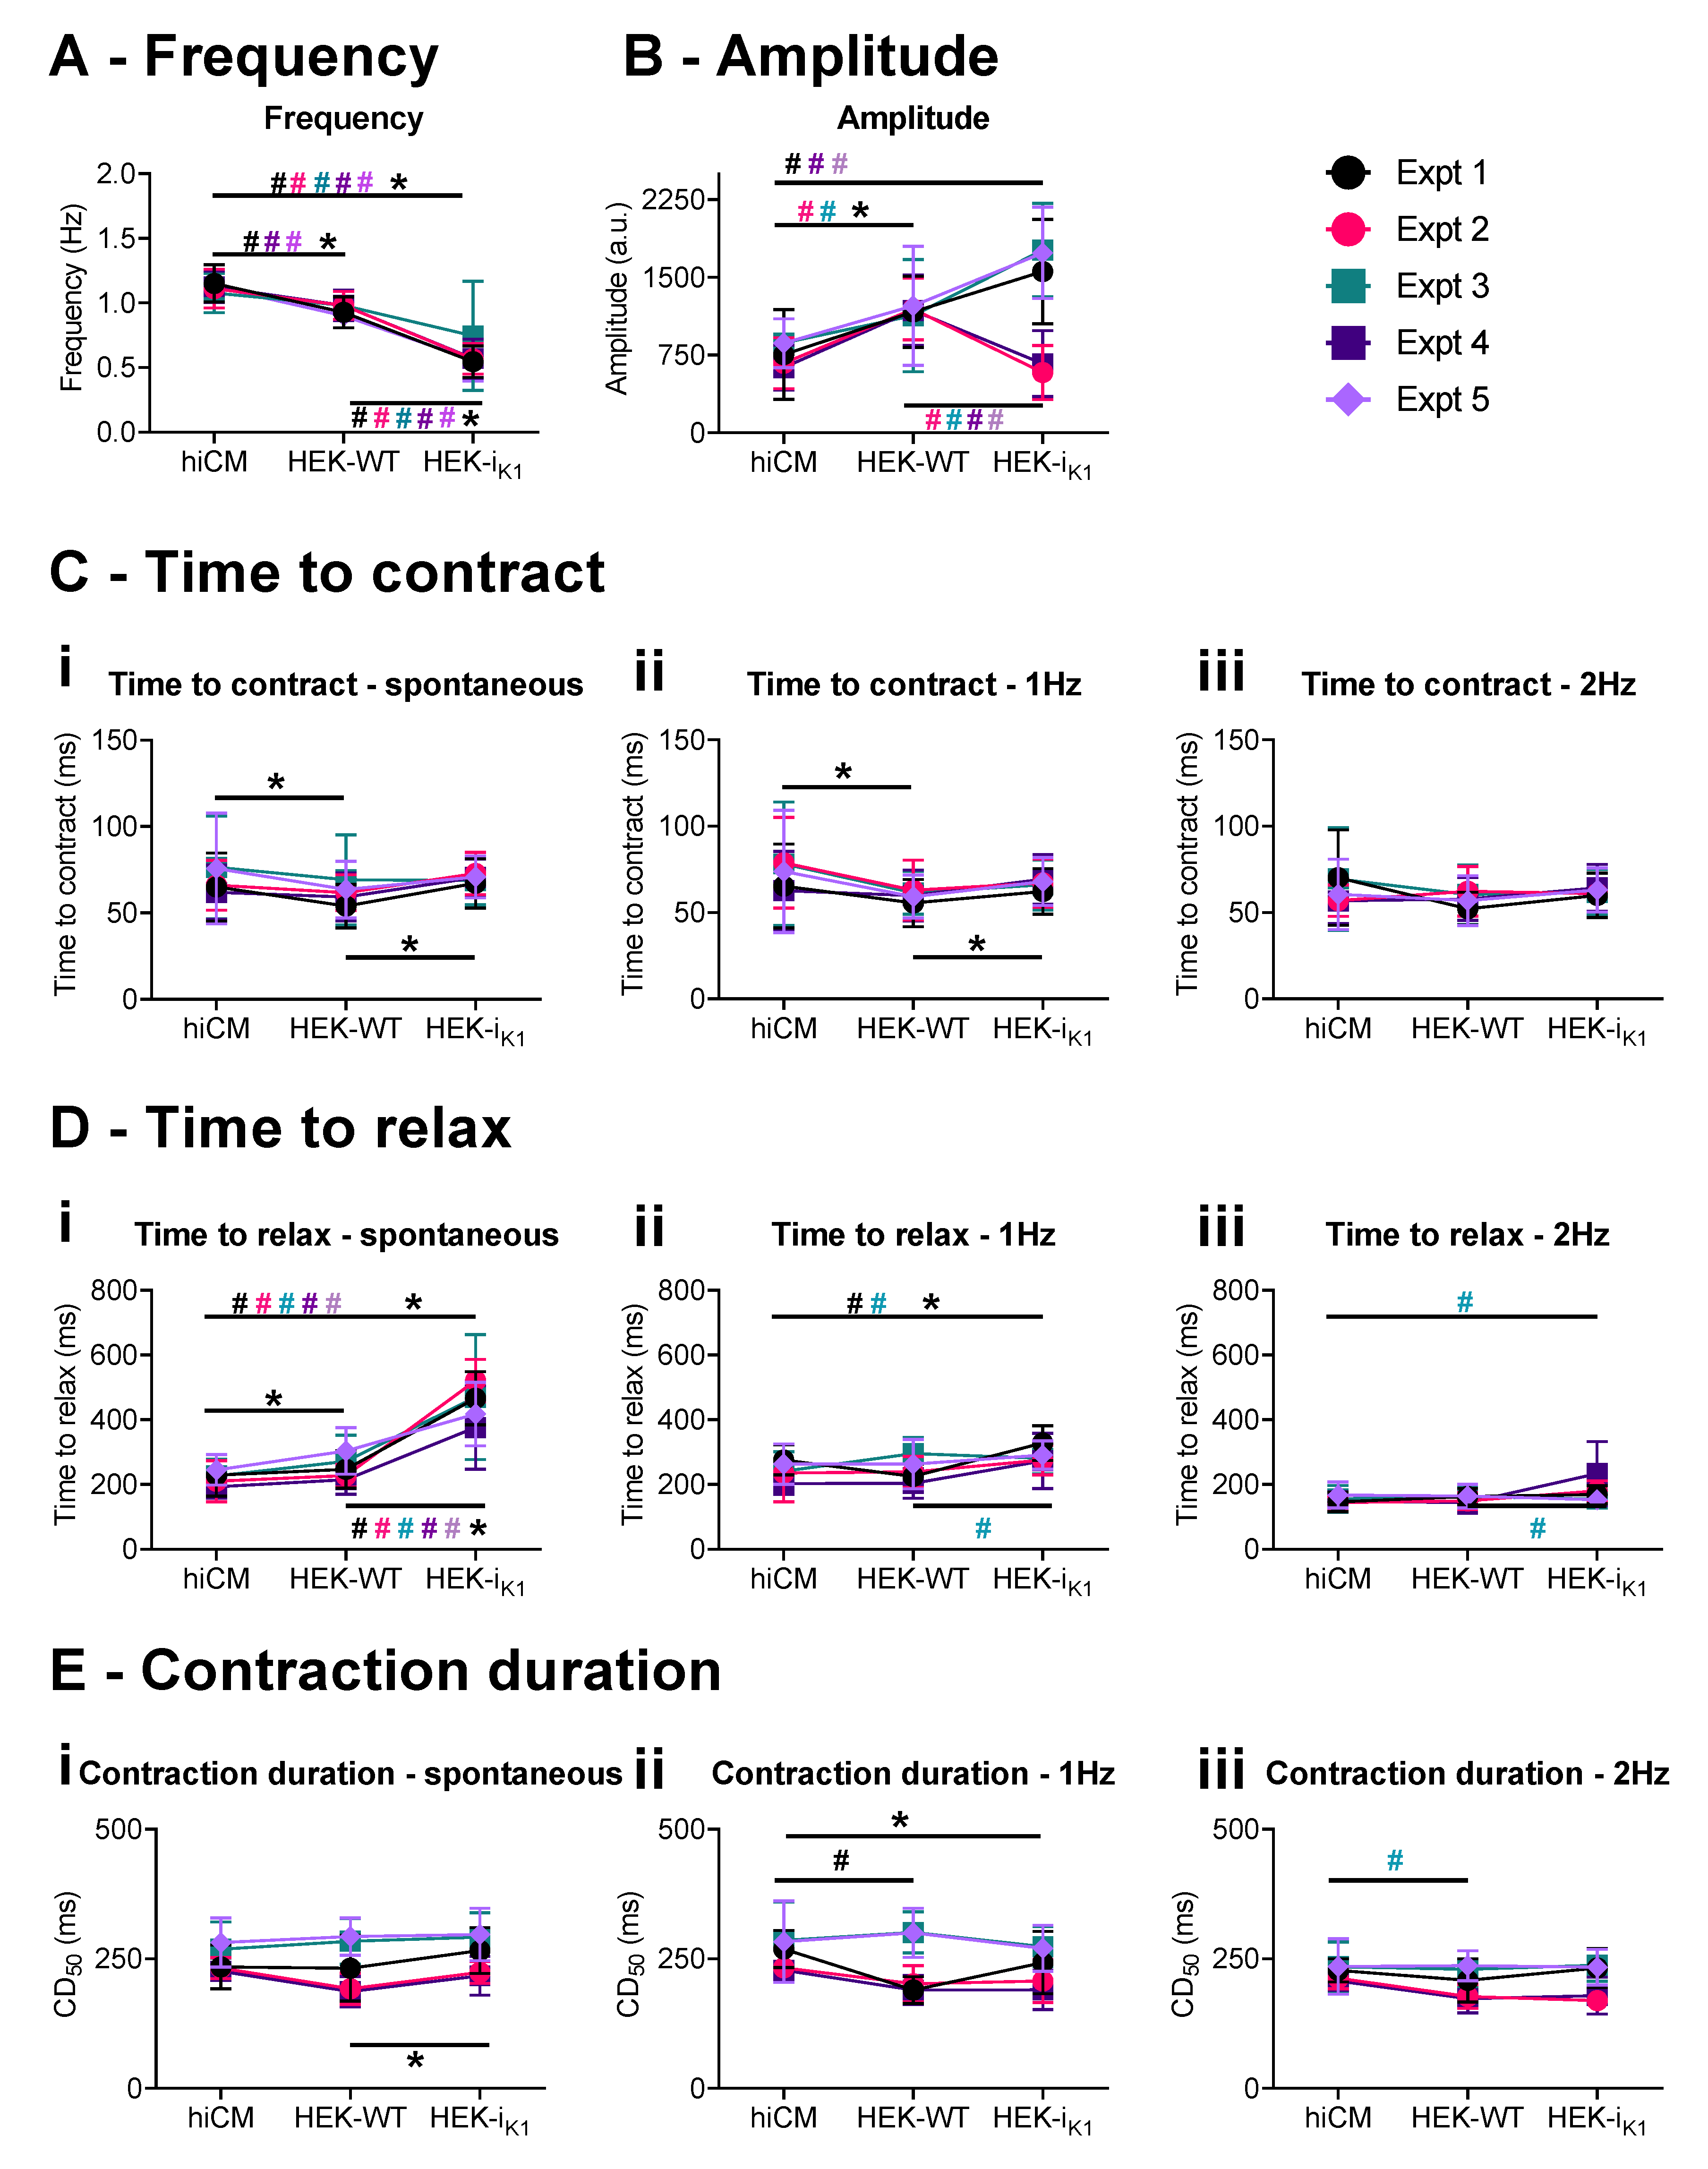
2.2. Effect of Co-Culture at Day 4 on Gross Contraction Characteristics
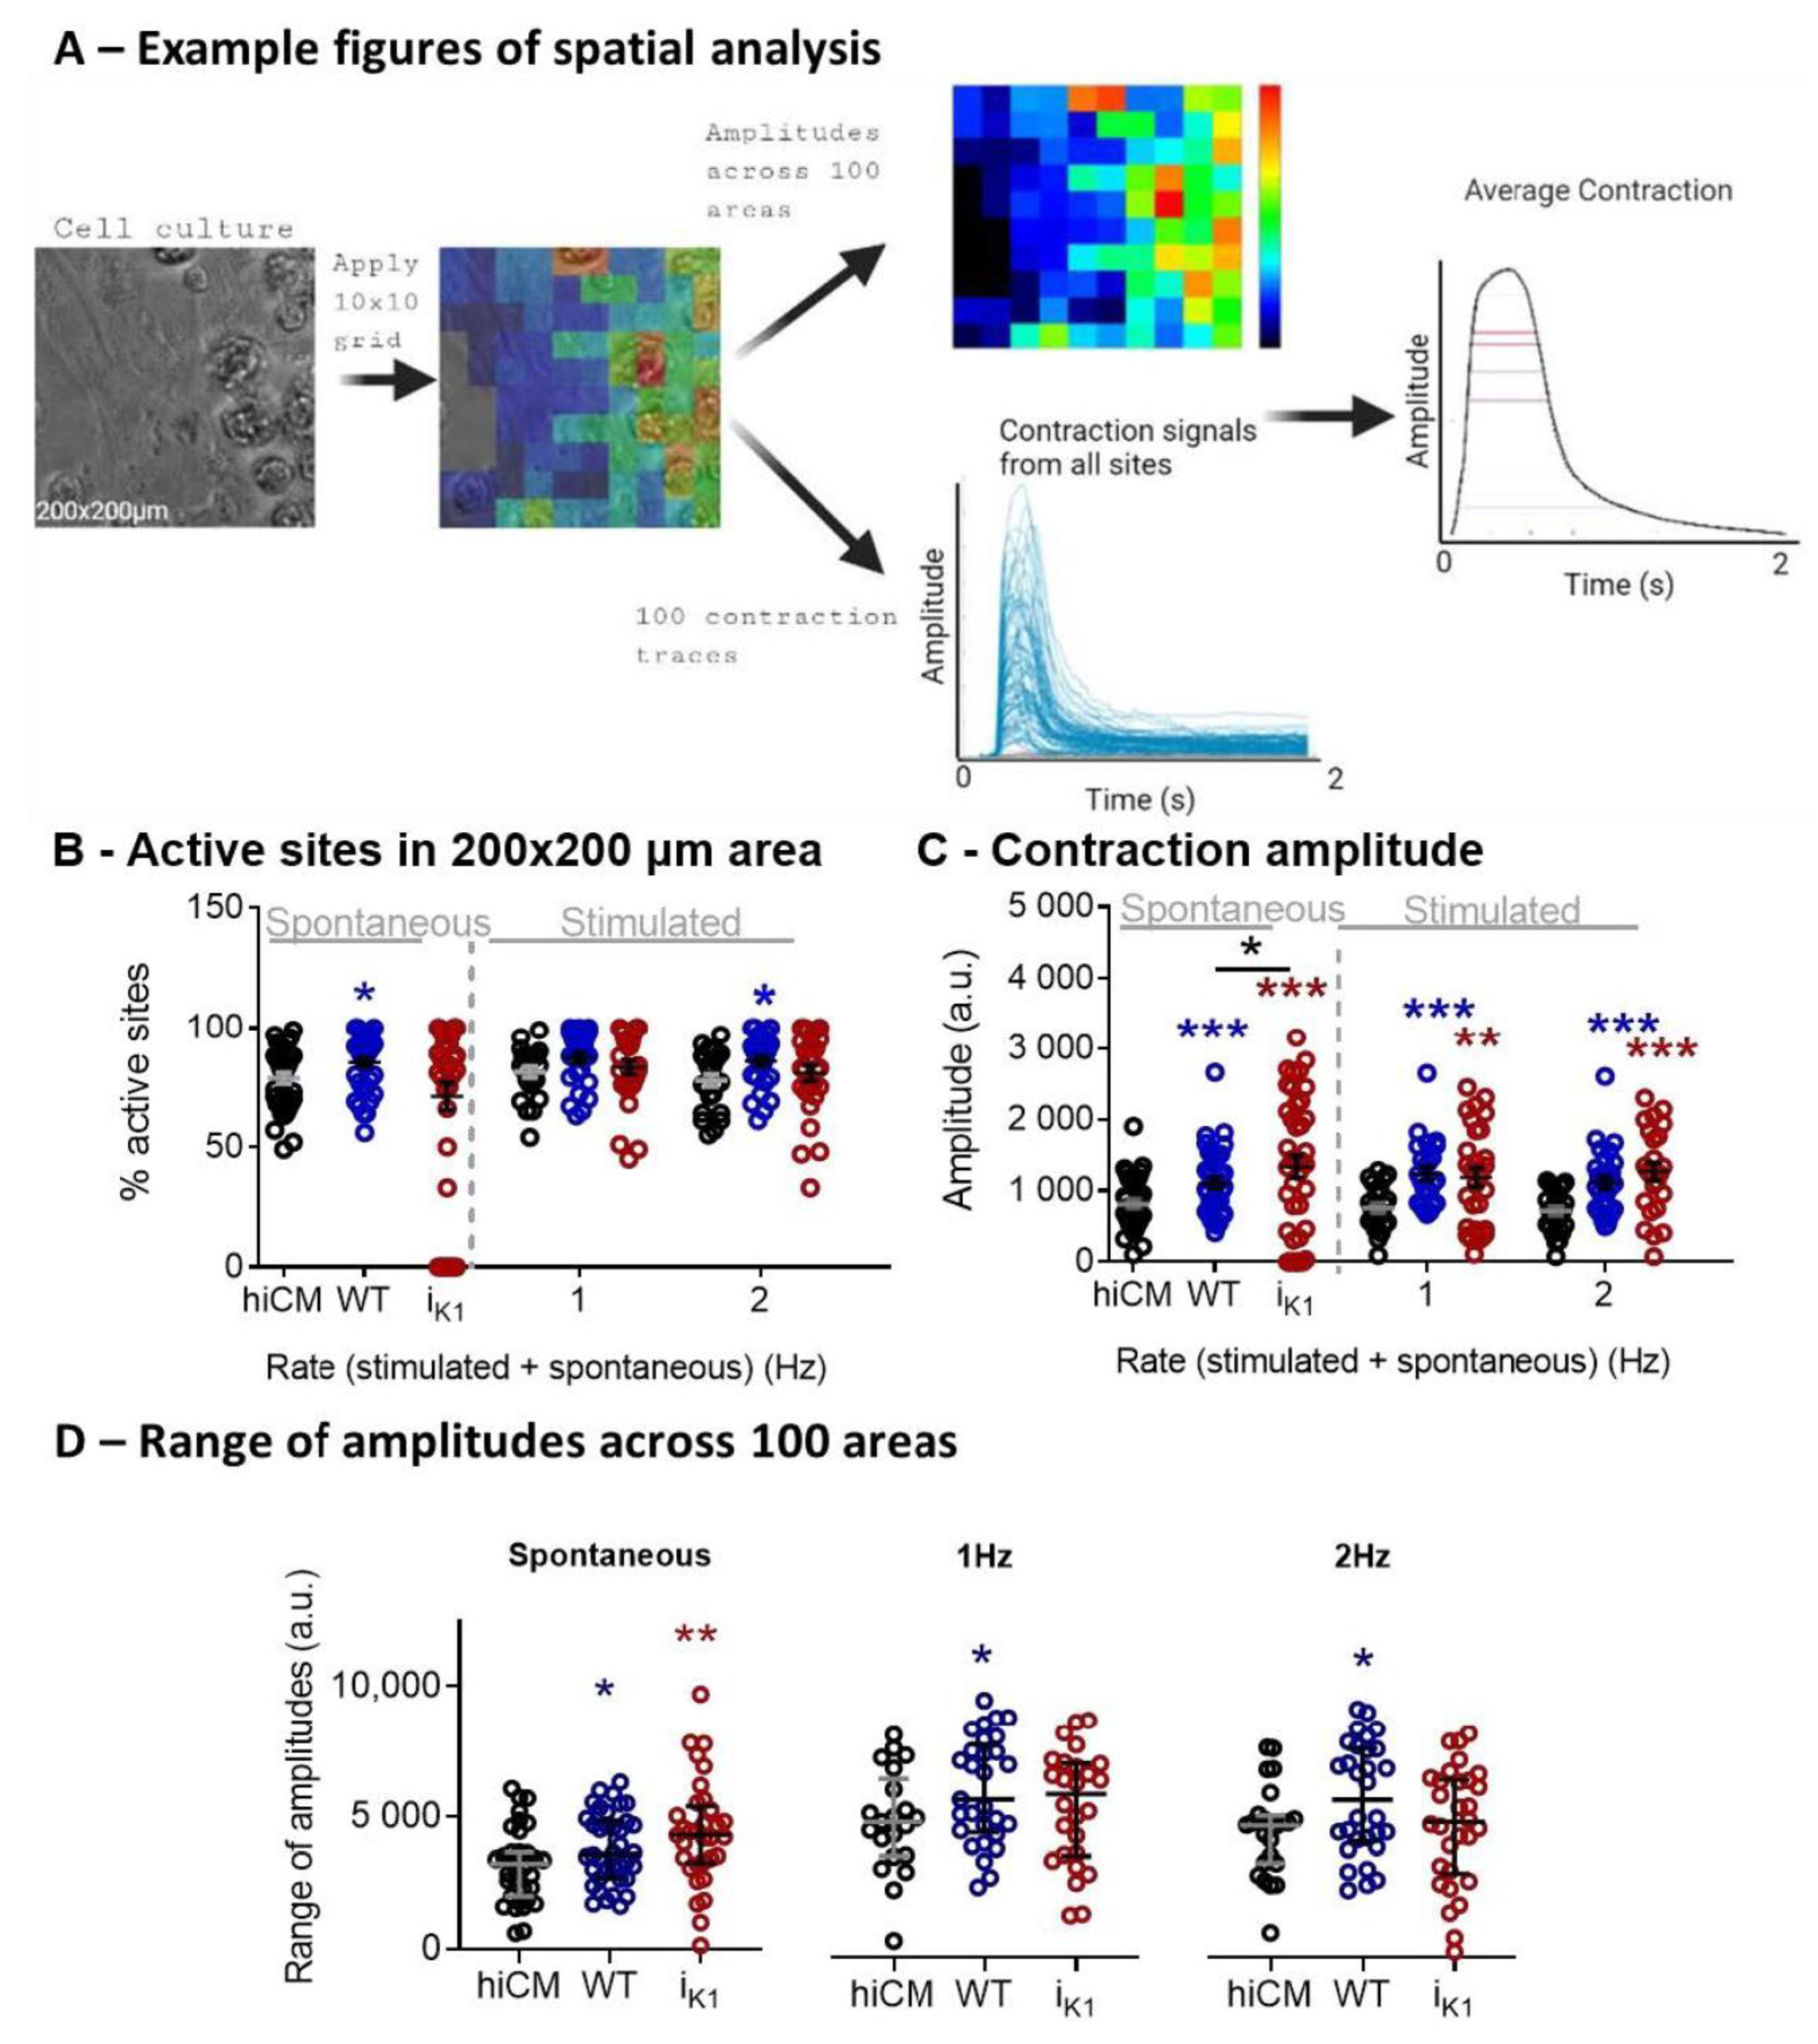
2.3. Effect of Co-Culture at Day 4 on Spatial Characteristics of Contraction
2.4. Effects of Co-Culture at Day 4 on Total Cellular Fluorescence after FluoVolt Staining
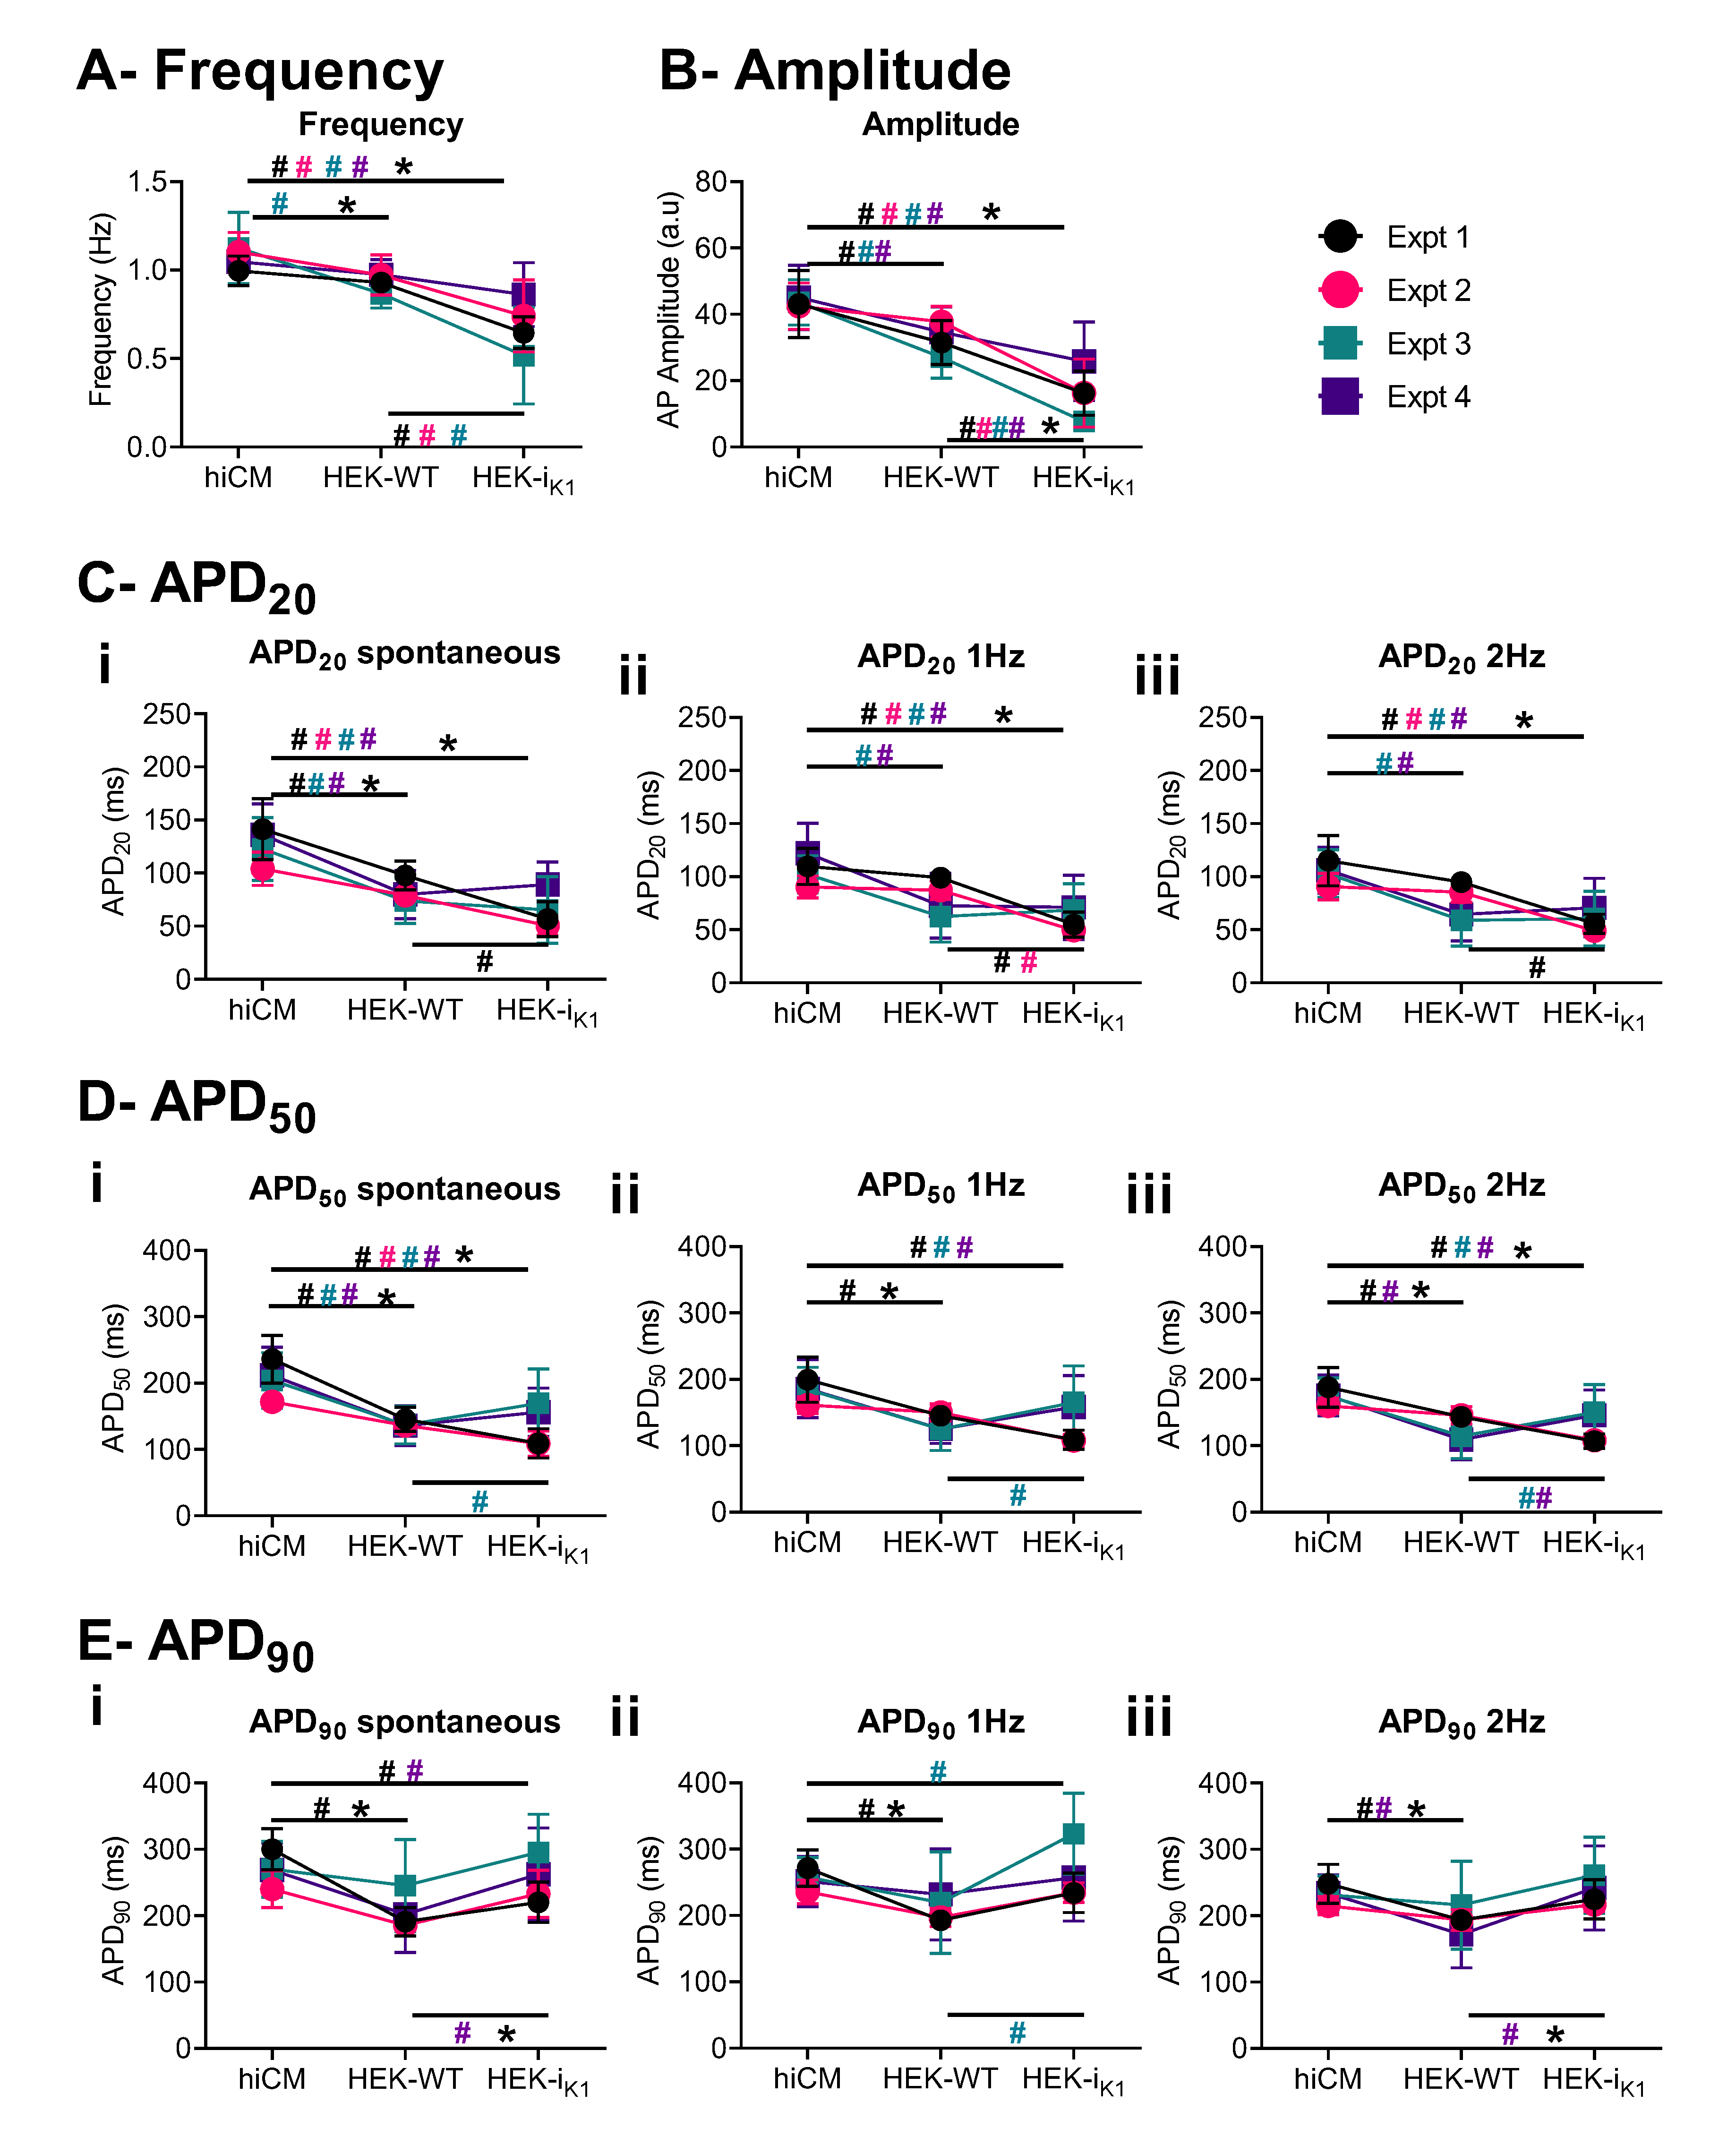
2.5. Effect of Co-Culture at Day 4 on Action Potential Waveform Characteristics
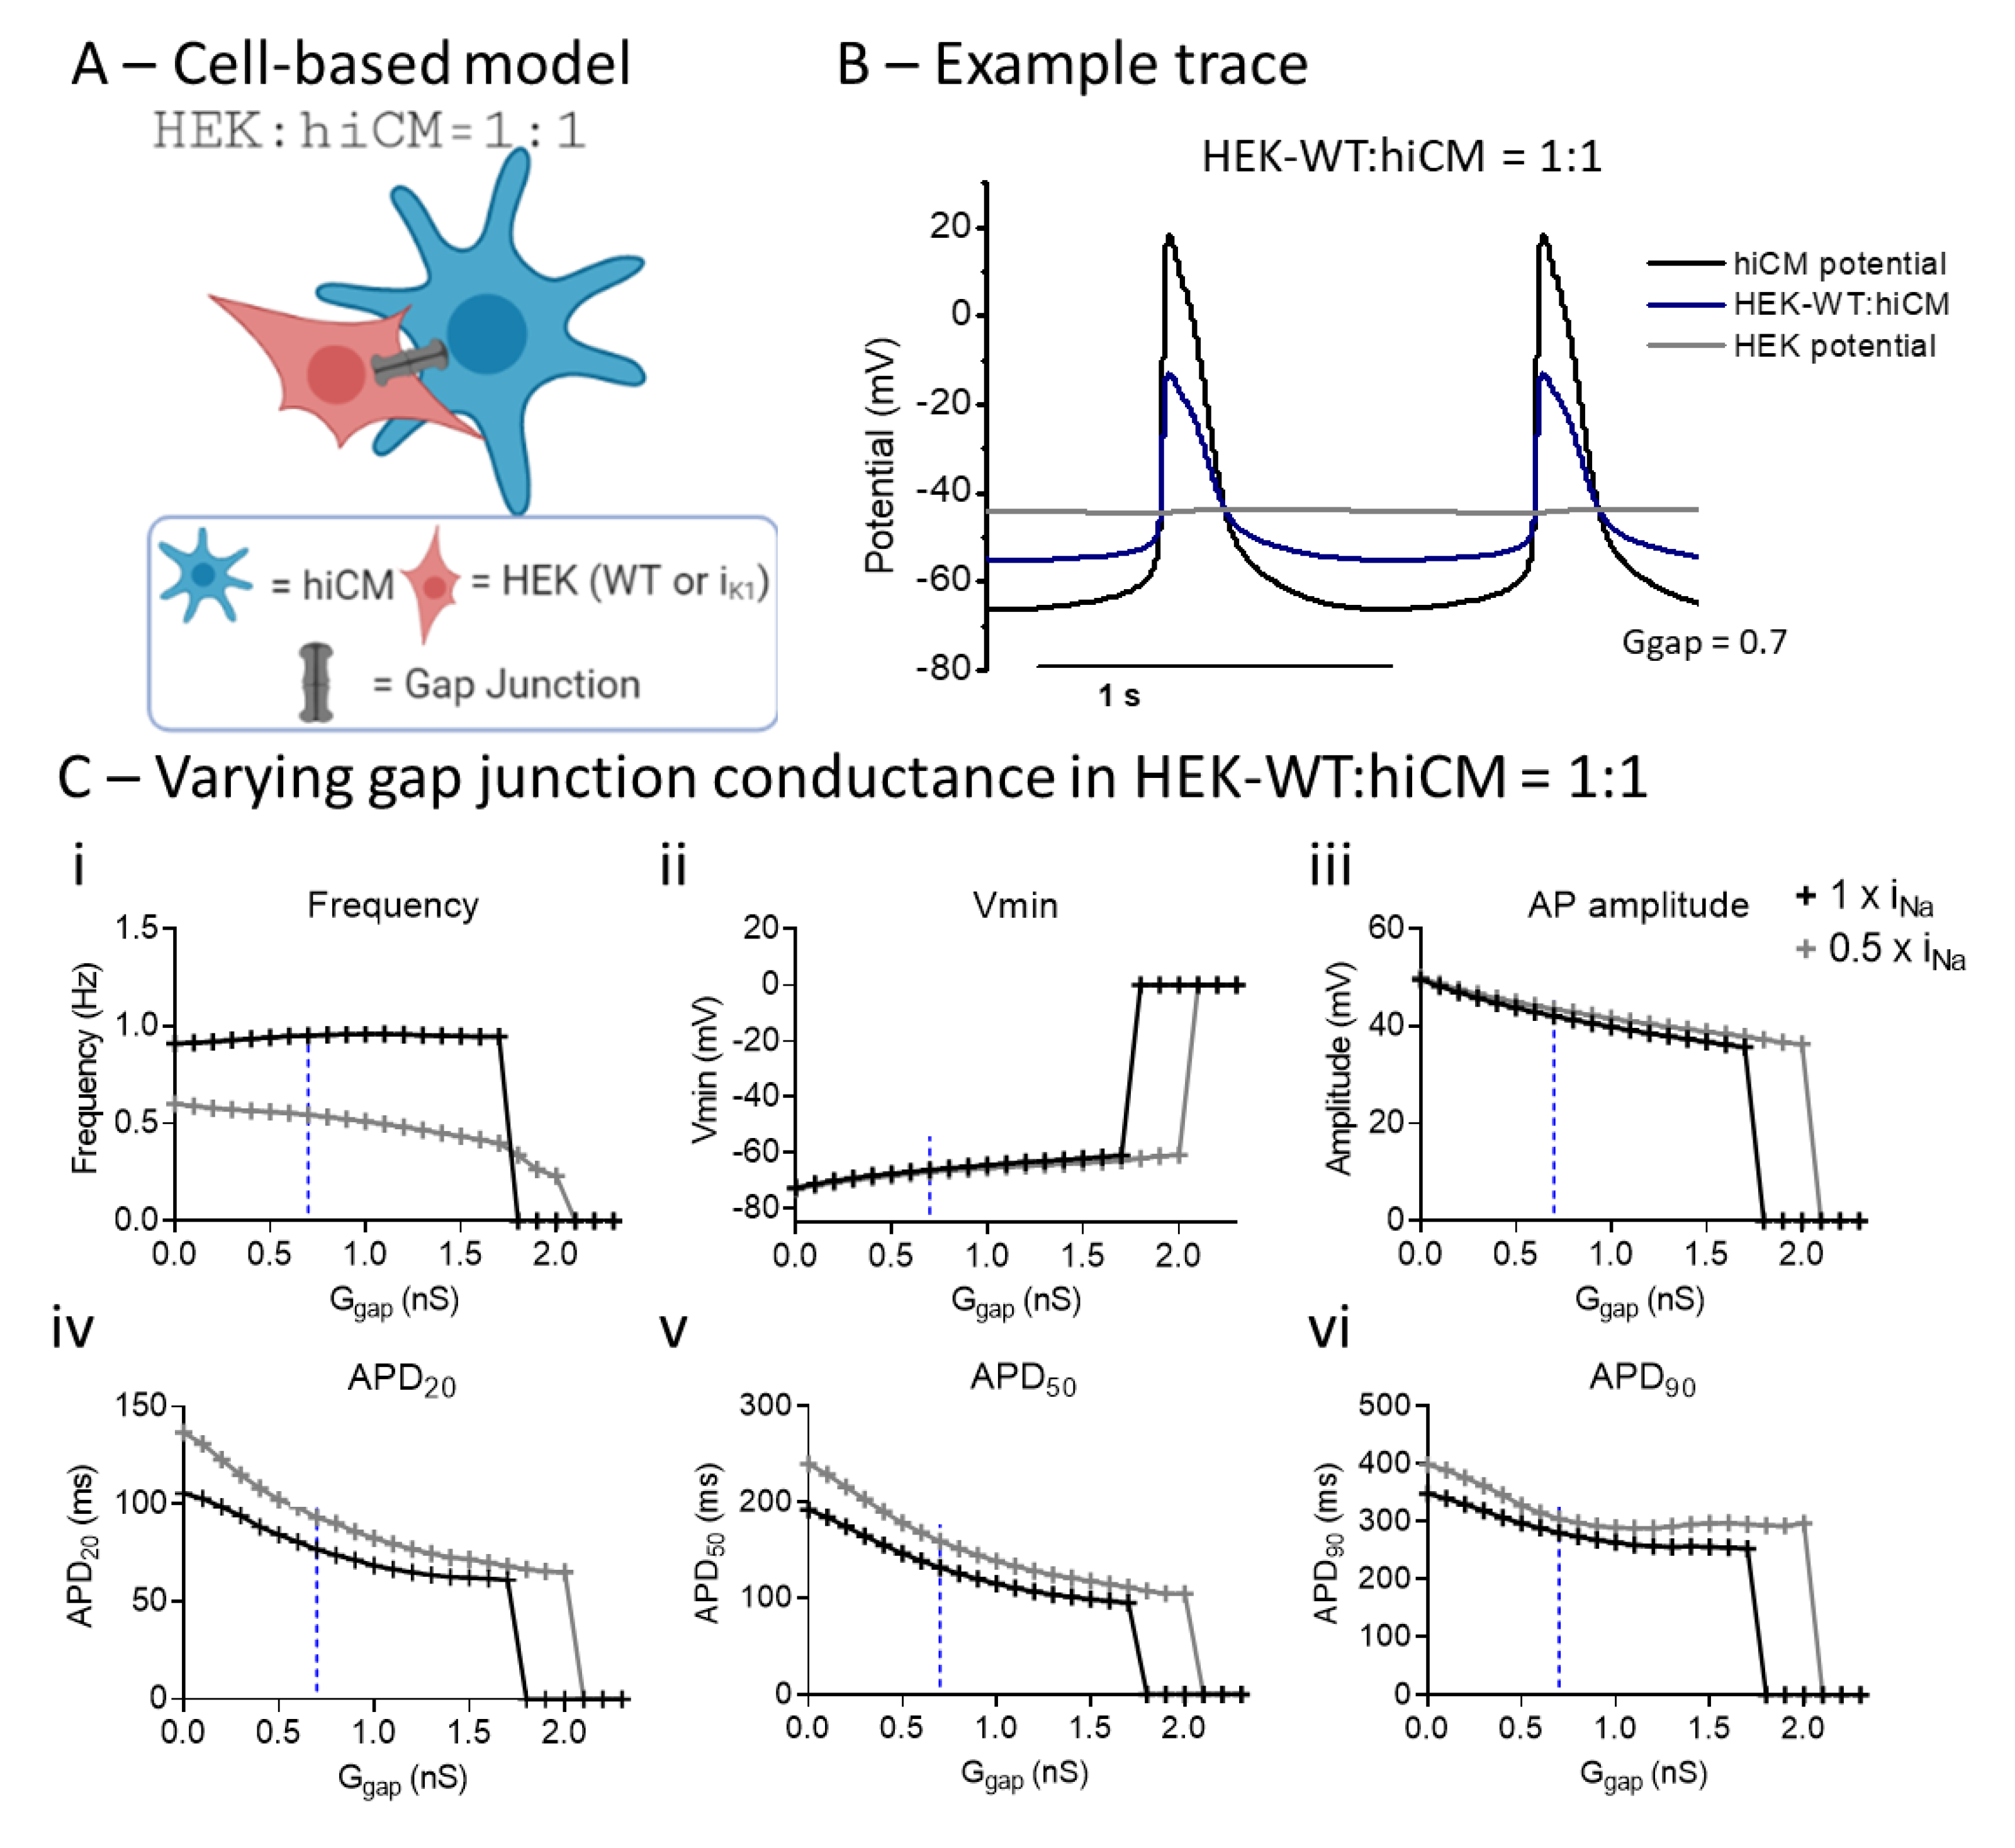
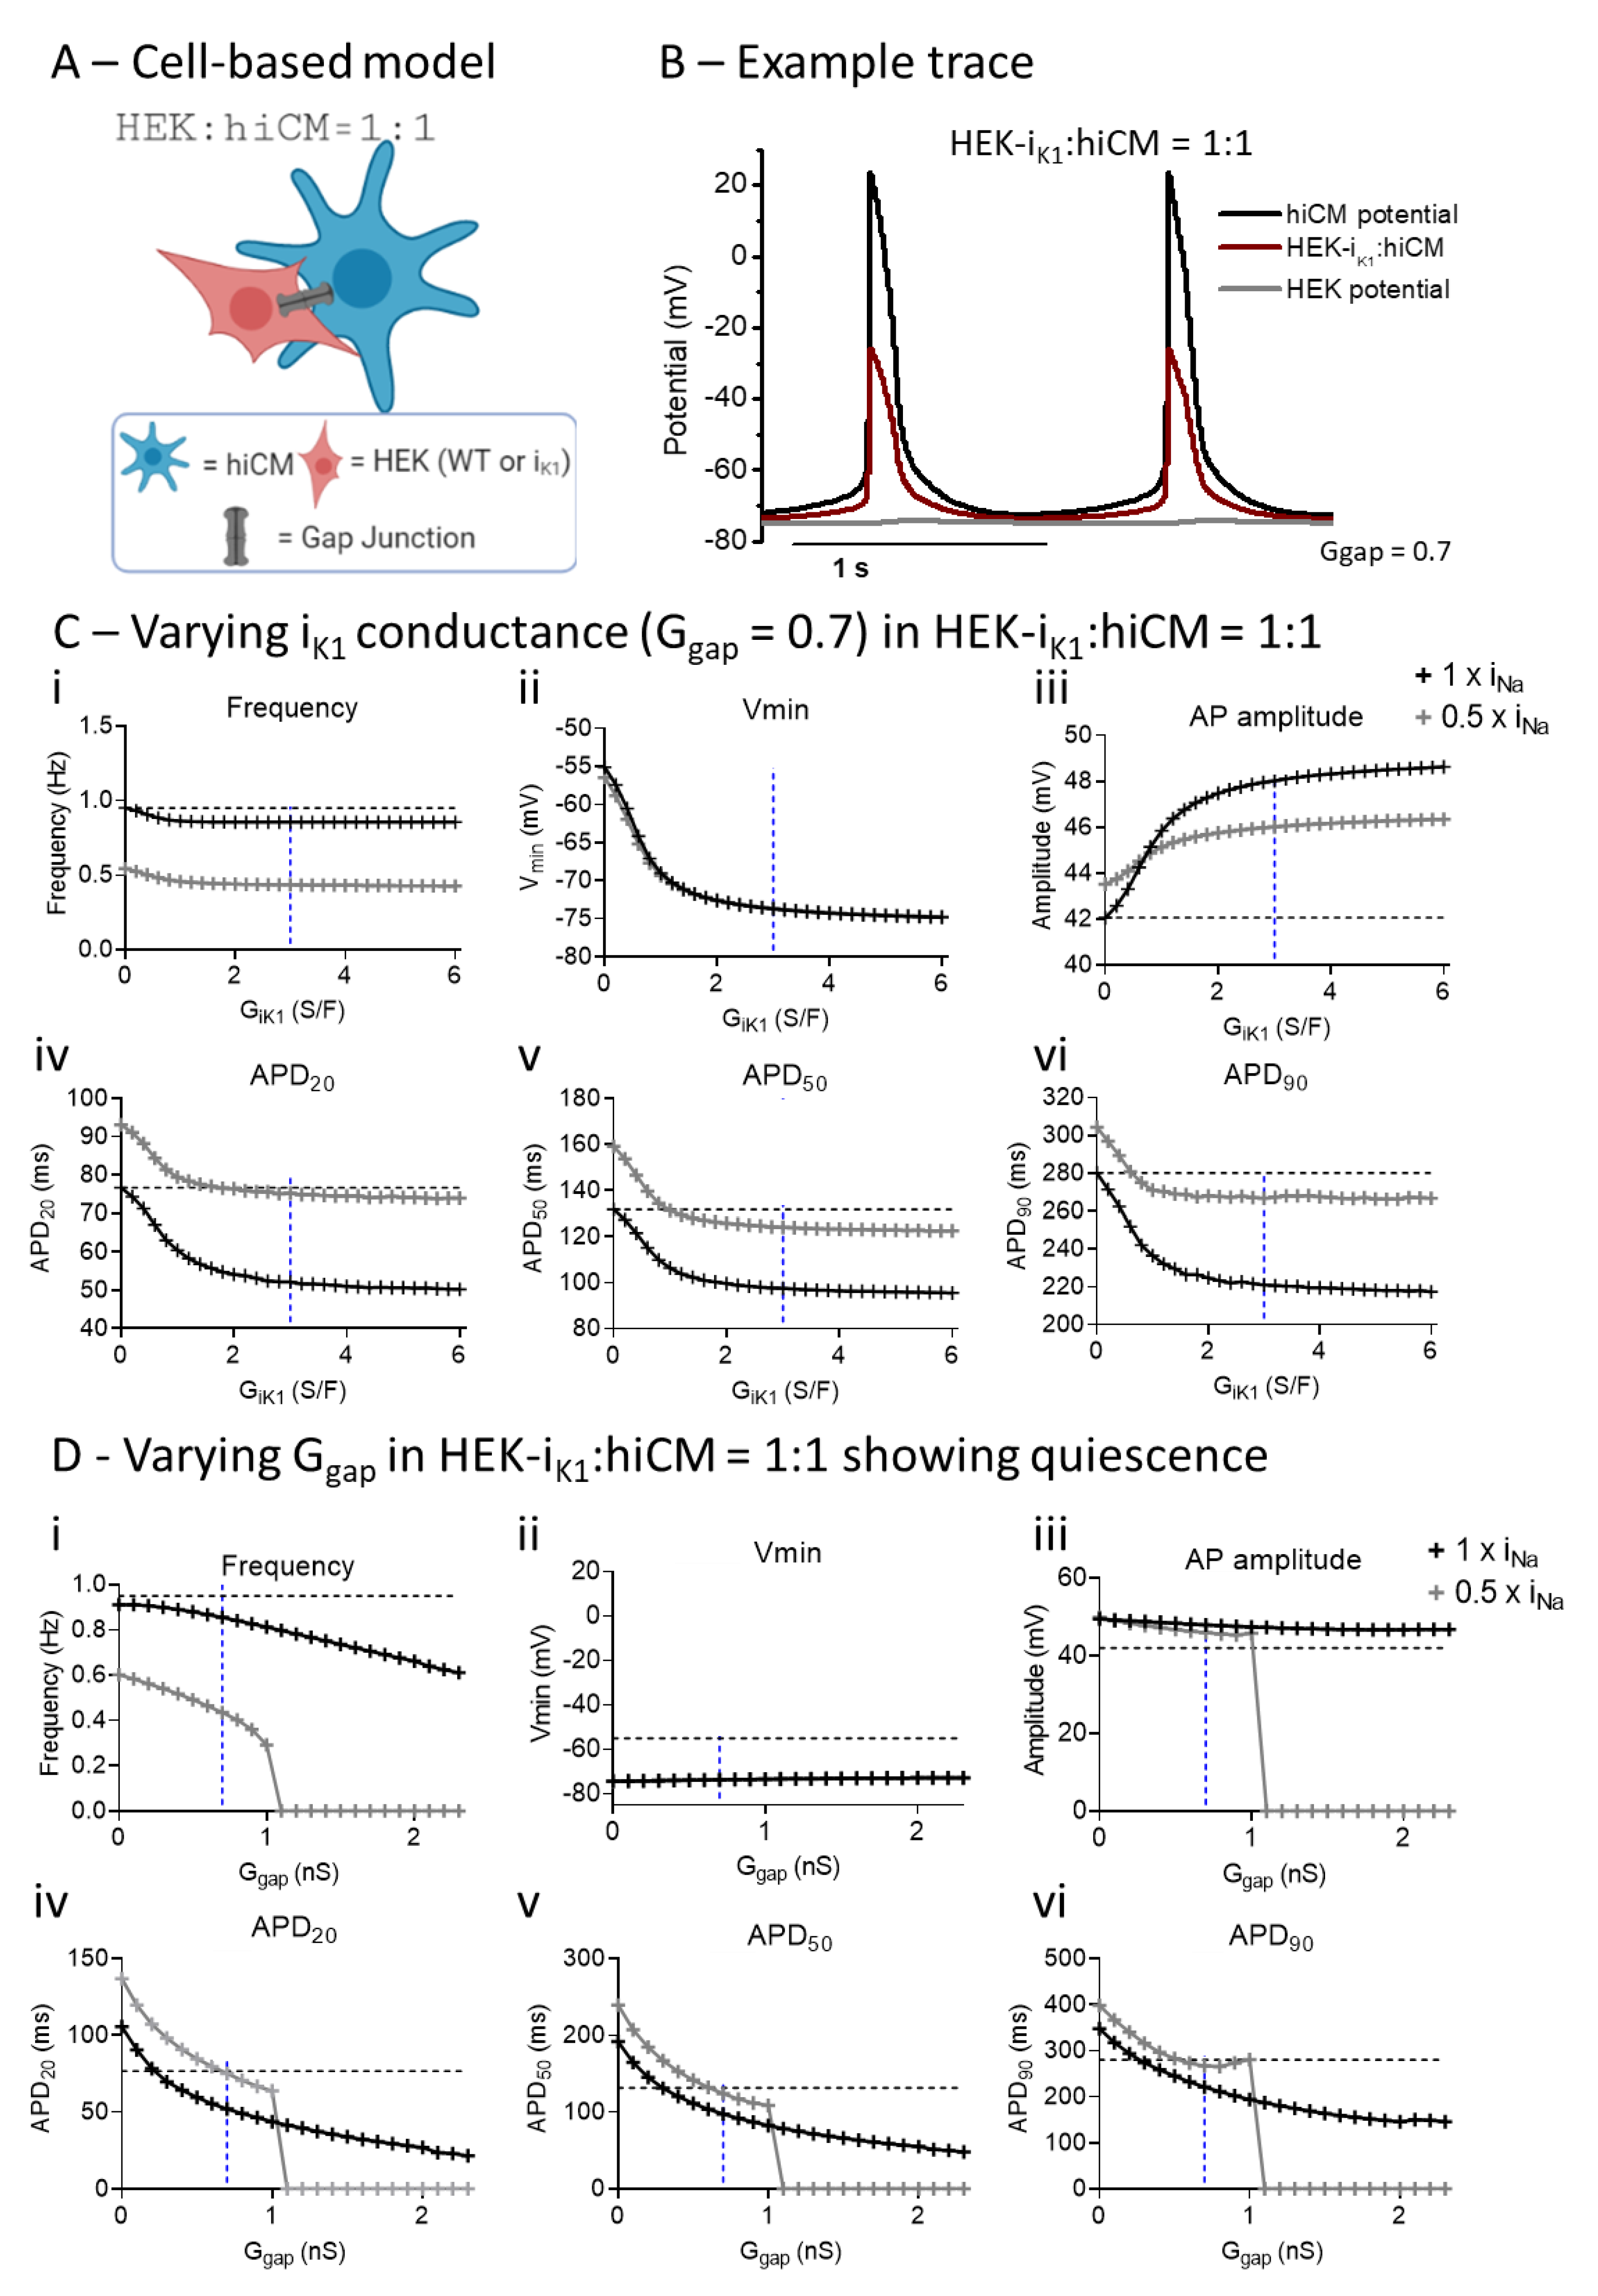
2.6. Computational Modelling of HEK:hiCM Coupling
3. Discussion
3.1. Effect of Co-Culture of hiCM with HEK–WT
3.2. Effect of Co-Culture with HEK-IK1 on Electrophysiology of hiCM
3.3. Comparing Enhanced IK1 vs. Coupling to HEK-IK1
4. Materials and Methods
4.1. Co-Culture with hiCMs and HEK
4.2. Contractility and Voltage Recordings
4.3. In Silico Modelling of Coupled HEK-Cardiomyocyte Electrophysiology
4.4. Immunocytochemistry
4.5. Data Analysis and Statistics
Supplementary Materials
Author Contributions
Funding
Institutional Review Board Statement
Informed Consent Statement
Data Availability Statement
Acknowledgments
Conflicts of Interest
References
- Verkerk, A.O.; Veerman, C.C.; Zegers, J.G.; Mengarelli, I.; Bezzina, C.R.; Wilders, R. Patch-clamp recording from human induced pluripotent stem cell-derived cardiomyocytes: Improving action potential characteristics through dynamic clamp. Int. J. Mol. Sci. 2017, 18, 1873. [Google Scholar] [CrossRef] [PubMed] [Green Version]
- Casini, S.; Verkerk, A.O.; Remme, C.A. Human iPSC-derived cardiomyocytes for investigation of disease mechanisms and therapeutic strategies in inherited arrhythmia syndromes: Strengths and limitations. Cardiovasc. Drugs Ther. 2017, 31, 325–344. [Google Scholar] [CrossRef] [PubMed] [Green Version]
- Hoekstra, M.; Mummery, C.L.; Wilde, A.A.M.; Bezzina, C.R.P.; Verkerk, A.O. Induced pluripotent stem cell derived cardiomyocytes as models for cardiac arrhythmias. Front. Physiol. 2012, 3, 346. [Google Scholar] [CrossRef] [PubMed] [Green Version]
- Burridge, P.W.; Keller, G.; Gold, J.D.; Wu, J.C. Production of de novo cardiomyocytes: Human pluripotent stem cell differentiation and direct reprogramming. Cell Stem Cell 2012, 10, 16–28. [Google Scholar] [CrossRef] [Green Version]
- Matsa, E.; Burridge, P.W.; Wu, J.C. Human stem cells for modeling heart disease and for drug discovery. Sci. Transl. Med. 2014, 6, 239ps6. [Google Scholar] [CrossRef] [Green Version]
- Mordwinkin, N.M.; Lee, A.S.; Wu, J.C. Patient-specific stem cells and cardiovascular drug discovery. JAMA 2013, 310, 2039–2040. [Google Scholar] [CrossRef] [Green Version]
- Bett, G.C.; Kaplan, A.D.; Lis, A.; Cimato, T.; Tzanakakis, E.S.; Zhou, Q.; Morales, M.J.; Rasmusson, R.L. Electronic “expression” of the inward rectifier in cardiocytes derived from human-induced pluripotent stem cells. Heart Rhythm 2013, 10, 1903–1910. [Google Scholar] [CrossRef] [Green Version]
- Sun, Y.; Timofeyev, V.; Dennis, A.; Bektik, E.; Wan, X.; Laurita, K.R.; Deschênes, I.; Li, R.A.; Fu, J.-D. A singular role of IK1 promoting the development of cardiac automaticity during cardiomyocyte differentiation by IK1-induced activation of pacemaker current. Stem Cell Rev. Rep. 2017, 13, 631–643. [Google Scholar] [CrossRef] [PubMed] [Green Version]
- Kim, J.J.; Yang, L.; Lin, B.; Zhu, X.; Sun, B.; Kaplan, A.D.; Bett, G.C.; Rasmusson, R.L.; London, B.; Salama, G. Mechanism of automaticity in cardiomyocytes derived from human induced pluripotent stem cells. J. Mol. Cell. Cardiol. 2015, 81, 81–93. [Google Scholar] [CrossRef] [PubMed] [Green Version]
- Horváth, A.; Lemoine, M.D.; Löser, A.; Mannhardt, I.; Flenner, F.; Uzun, A.U.; Neuber, C.; Breckwoldt, K.; Hansen, A.; Girdauskas, E.; et al. Low resting membrane potential and low inward rectifier potassium currents are not inherent features of hiPSC-derived cardiomyocytes. Stem Cell Rep. 2018, 10, 822–833. [Google Scholar] [CrossRef] [Green Version]
- Doss, M.X.; Di Diego, J.M.; Goodrow, R.J.; Wu, Y.; Cordeiro, J.M.; Nesterenko, V.V.; Barajas-Martínez, H.; Hu, D.; Urrutia, J.; Desai, M.; et al. Maximum Diastolic potential of human induced pluripotent stem cell-derived cardiomyocytes depends critically on IKr. PLoS ONE 2012, 7, e40288. [Google Scholar] [CrossRef]
- Dhamoon, A.S.; Jalife, J. The inward rectifier current (IK1) controls cardiac excitability and is involved in arrhythmogenesis. Heart Rhythm 2005, 2, 316–324. [Google Scholar] [CrossRef]
- Ibarra, J.; Morley, G.; Delmar, M. Dynamics of the inward rectifier K+ current during the action potential of guinea pig ventricular myocytes. Biophys. J. 1991, 60, 1534–1539. [Google Scholar] [CrossRef] [Green Version]
- Hibino, H.; Inanobe, A.; Furutani, K.; Murakami, S.; Findlay, I.; Kurachi, Y. Inwardly rectifying potassium channels: Their structure, function, and physiological roles. Physiol. Rev. 2010, 90, 291–366. [Google Scholar] [CrossRef] [Green Version]
- Goversen, B.; Becker, N.; Stoelzle-Feix, S.; Obergrussberger, A.; Vos, M.A.; van Veen, T.A.B.; Fertig, N.; de Boer, T.P. A hybrid model for safety pharmacology on an automated patch clamp platform: Using dynamic clamp to join iPSC-derived cardiomyocytes and simulations of Ik1 ion channels in real-time. Front. Physiol. 2018, 8, 1094. [Google Scholar] [CrossRef] [Green Version]
- Fabbri, A.; Goversen, B.; Vos, M.A.; van Veen, T.A.B.; de Boer, T.P. Required GK1 to suppress automaticity of iPSC-CMs depends strongly on IK1 model structure. Biophys. J. 2019, 117, 2303–2315. [Google Scholar] [CrossRef] [Green Version]
- Paci, M.; Hyttinen, J.; Rodriguez, B.L.; Severi, S. Human induced pluripotent stem cell-derived versus adult cardiomyocytes: An in silico electrophysiological study on effects of ionic current block. Br. J. Pharmacol. 2015, 172, 5147–5160. [Google Scholar] [CrossRef] [Green Version]
- Vaidyanathan, R.; Markandeya, Y.S.; Kamp, T.J.; Makielski, J.C.; January, C.T.; Eckhardt, L.L. IK1-enhanced human-induced pluripotent stem cell-derived cardiomyocytes: An improved cardiomyocyte model to investigate inherited arrhythmia syndromes. Am. J. Physiol. Heart Circ. Physiol. 2016, 310, H1611–H1621. [Google Scholar] [CrossRef] [Green Version]
- Haenseler, W.; Sansom, S.N.; Buchrieser, J.; Newey, S.E.; Moore, C.S.; Nicholls, F.J.; Chintawar, S.; Schnell, C.; Antel, J.P.; Allen, N.D.; et al. A highly efficient human pluripotent stem cell microglia model displays a neuronal-co-culture-specific expression profile and inflammatory response. Stem Cell Rep. 2017, 8, 1727–1742. [Google Scholar] [CrossRef] [Green Version]
- Hassanzadeh-Barforoushi, A.; Shemesh, J.; Farbehi, N.; Asadnia, M.; Yeoh, G.H.; Harvey, R.P.; Nordon, R.E.; Warkiani, M.E. A rapid co-culture stamping device for studying intercellular communication. Sci. Rep. 2016, 6, 35618. [Google Scholar] [CrossRef] [Green Version]
- Thomas, P.; Smart, T.G. HEK293 cell line: A vehicle for the expression of recombinant proteins. J. Pharmacol. Toxicol. Methods 2005, 51, 187–200. [Google Scholar] [CrossRef]
- Patel, D.; Zhang, X.; Veenstra, R.D. Connexin hemichannel and pannexin channel electrophysiology: How do they differ? FEBS Lett. 2014, 588, 1372–1378. [Google Scholar] [CrossRef] [Green Version]
- Paci, M.; Pölönen, R.-P.; Cori, D.; Penttinen, K.; Aalto-Setälä, K.; Severi, S.; Hyttinen, J. Automatic optimization of an in silico model of human iPSC derived cardiomyocytes recapitulating calcium handling abnormalities. Front. Physiol. 2018, 9, 709. [Google Scholar] [CrossRef] [Green Version]
- Paci, M.; Hyttinen, J.; Aalto-Setälä, K.; Severi, S. Computational Models of ventricular- and atrial-like human induced pluripotent stem cell derived cardiomyocytes. Ann. Biomed. Eng. 2013, 41, 2334–2348. [Google Scholar] [CrossRef]
- Lu, H.; Hortigon-Vinagre, M.; Zamora, V.; Kopljar, I.; De Bondt, A.; Gallacher, D.; Smith, G. Application of optical action potentials in human induced pluripotent stem cells-derived cardiomyocytes to predict drug-induced cardiac arrhythmias. J. Pharmacol. Toxicol. Methods 2017, 87, 53–67. [Google Scholar] [CrossRef]
- de Boer, T.P.; van Veen, T.A.B.; Houtman, M.J.C.; Jansen, J.A.; van Amersfoorth, S.C.M.; Doevendans, P.A.; Vos, M.A.; van der Heyden, M.A.G. Inhibition of cardiomyocyte automaticity by electrotonic application of inward rectifier current from Kir2.1 expressing cells. Med. Biol. Eng. Comput. 2006, 44, 537–542. [Google Scholar] [CrossRef]
- Karakikes, I.; Ameen, M.; Termglinchan, V.; Wu, J.C. Human induced pluripotent stem cell-derived cardiomyocytes: Insights into molecular, cellular, and functional phenotypes. Circ. Res. 2015, 117, 80–88. [Google Scholar] [CrossRef] [Green Version]
- James, E.; Tomaskovic-Crook, E.; Crook, J. Bioengineering clinically relevant cardiomyocytes and cardiac tissues from pluripotent stem cells. Int. J. Mol. Sci. 2021, 22, 3005. [Google Scholar] [CrossRef]
- Miake, J.; Marbán, E.; Nuss, H.B. Functional role of inward rectifier current in heart probed by Kir2.1 overexpression and dominant-negative suppression. J. Clin. Investig. 2003, 111, 1529–1536. [Google Scholar] [CrossRef]
- Rohr, S. Role of gap junctions in the propagation of the cardiac action potential. Cardiovasc. Res. 2004, 62, 309–322. [Google Scholar] [CrossRef]
- Varghese, A.; TenBroek, E.; Colesjr, J.; Sigg, D. Endogenous channels in HEK cells and potential roles in HCN ionic current measurements. Prog. Biophys. Mol. Biol. 2006, 90, 26–37. [Google Scholar] [CrossRef]
- Hortigon-Vinagre, M.P.; Zamora, V.; Burton, F.L.; Green, J.; Gintant, G.A.; Smith, G.L. The use of ratiometric fluorescence measurements of the voltage sensitive dye Di-4-ANEPPS to examine action potential characteristics and drug effects on human induced pluripotent stem cell-derived cardiomyocytes. Toxicol. Sci. 2016, 154, 320–331. [Google Scholar] [CrossRef] [Green Version]
- Hortigon-Vinagre, M.P.; Zamora, V.; Burton, F.L.; Smith, G.L. The use of voltage sensitive dye di-4-ANEPPS and video-based contractility measurements to assess drug effects on excitation-contraction coupling in human-induced pluripotent stem cell-derived cardiomyocytes. J. Cardiovasc. Pharmacol. 2021, 77, 280–290. [Google Scholar] [CrossRef] [PubMed]
- MacCannell, K.A.; Bazzazi, H.; Chilton, L.; Shibukawa, Y.; Clark, R.B.; Giles, W.R. A Mathematical model of electrotonic interactions between ventricular myocytes and fibroblasts. Biophys. J. 2007, 92, 4121–4132. [Google Scholar] [CrossRef] [PubMed] [Green Version]
- Kirkton, R.; Bursac, N. Engineering biosynthetic excitable tissues from unexcitable cells for electrophysiological and cell therapy studies. Nat. Commun. 2011, 2, 1–9. [Google Scholar] [CrossRef] [Green Version]
- Morgan, R.; Colman, M.A.; Chubb, H.; Seemann, G.; Aslanidi, O.V. Slow conduction in the border zones of patchy fibrosis stabilizes the drivers for atrial fibrillation: Insights from multi-scale human atrial modeling. Front. Physiol. 2016, 7, 474. [Google Scholar] [CrossRef] [PubMed]


Publisher’s Note: MDPI stays neutral with regard to jurisdictional claims in published maps and institutional affiliations. |
© 2021 by the authors. Licensee MDPI, Basel, Switzerland. This article is an open access article distributed under the terms and conditions of the Creative Commons Attribution (CC BY) license (https://creativecommons.org/licenses/by/4.0/).
Share and Cite
Costa, A.D.S.; Mortensen, P.; Hortigon-Vinagre, M.P.; van der Heyden, M.A.G.; Burton, F.L.; Gao, H.; Simitev, R.D.; Smith, G.L. Electrophysiology of hiPSC-Cardiomyocytes Co-Cultured with HEK Cells Expressing the Inward Rectifier Channel. Int. J. Mol. Sci. 2021, 22, 6621. https://0-doi-org.brum.beds.ac.uk/10.3390/ijms22126621
Costa ADS, Mortensen P, Hortigon-Vinagre MP, van der Heyden MAG, Burton FL, Gao H, Simitev RD, Smith GL. Electrophysiology of hiPSC-Cardiomyocytes Co-Cultured with HEK Cells Expressing the Inward Rectifier Channel. International Journal of Molecular Sciences. 2021; 22(12):6621. https://0-doi-org.brum.beds.ac.uk/10.3390/ijms22126621
Chicago/Turabian StyleCosta, Ana Da Silva, Peter Mortensen, Maria P. Hortigon-Vinagre, Marcel A. G. van der Heyden, Francis L. Burton, Hao Gao, Radostin D. Simitev, and Godfrey L. Smith. 2021. "Electrophysiology of hiPSC-Cardiomyocytes Co-Cultured with HEK Cells Expressing the Inward Rectifier Channel" International Journal of Molecular Sciences 22, no. 12: 6621. https://0-doi-org.brum.beds.ac.uk/10.3390/ijms22126621