Article

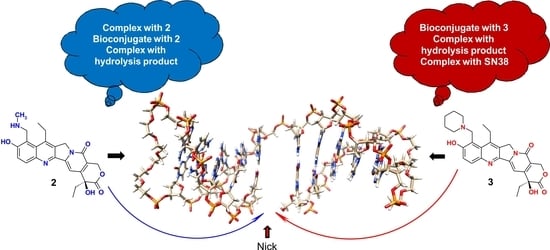
The Mode of SN38 Derivatives Interacting with Nicked DNA Mimics Biological Targeting of Topo I Poisons

by
Wojciech Bocian
1,
Beata Naumczuk
1,2,*,
Magdalena Urbanowicz
1,
Jerzy Sitkowski
1,
Anna Bierczyńska-Krzysik
3,
Elżbieta Bednarek
1,
Katarzyna Wiktorska
1,
Małgorzata Milczarek
1 and
Lech Kozerski
1,2
1
National Medicines Institute, 00-725 Warsaw, Poland
2
Institute of Organic Chemistry, Polish Academy of Sciences, 01-224 Warsaw, Poland
3
Łukasiewicz Industrial Chemistry Institute, 01-793 Warsaw, Poland
*
Author to whom correspondence should be addressed.
Int. J. Mol. Sci. 2021, 22(14), 7471; https://0-doi-org.brum.beds.ac.uk/10.3390/ijms22147471
Submission received: 25 June 2021 / Revised: 8 July 2021 / Accepted: 8 July 2021 / Published: 12 July 2021
(This article belongs to the Collection Feature Papers in Molecular Biophysics)

Abstract

:
The compounds 7-ethyl-9-(N-methylamino)methyl-10-hydroxycamptothecin (2) and 7-ethyl-9-(N-morpholino)methyl-10-hydroxycamptothecin (3) are potential topoisomerase I poisons. Moreover, they were shown to have favorable anti-neoplastic effects on several tumor cell lines. Due to these properties, the compounds are being considered for advancement to the preclinical development stage. To gain better insights into the molecular mechanism with the biological target, here, we conducted an investigation into their interactions with model nicked DNA (1) using different techniques. In this work, we observed the complexity of the mechanism of action of the compounds 2 and 3, in addition to their decomposition products: compound 4 and SN38. Using DOSY experiments, evidence of the formation of strongly bonded molecular complexes of SN38 derivatives with DNA duplexes was provided. The molecular modeling based on cross-peaks from the NOESY spectrum also allowed us to assign the geometry of a molecular complex of DNA with compound 2. Confirmation of the alkylation reaction of both compounds was obtained using MALDI–MS. Additionally, in the case of 3, alkylation was confirmed in the recording of cross-peaks in the 1H/13C HSQC spectrum of 13C-enriched compound 3. In this work, we showed that the studied compounds—parent compounds 2 and 3, and their potential metabolite 4 and SN38—interact inside the nick of 1, either forming the molecular complex or alkylating the DNA nitrogen bases. In order to confirm the influence of the studied compounds on the topoisomerase I relaxation activity of supercoiled DNA, the test was performed based upon the measurement of the fluorescence of DNA stain which can differentiate between supercoiled and relaxed DNA. The presented results confirmed that studied SN38 derivatives effectively block DNA relaxation mediated by Topo I, which means that they stop the machinery of Topo I activity.

Graphical Abstract

1. Introduction

Targeted chemotherapy is a key element of personalized medicine that is now at the frontier of biomedical research. Covalent binding is a crucial factor in targeted chemotherapy because it damages the tumor DNA and substantially enhances the effectiveness of a medicine. Therefore, research aimed toward discovering drugs with site selectivity and strong binding to biological macromolecules has been a topic of longstanding interest due to the potential breadth and diversity of its application to basic, applied, and medicinal research.
Targeted chemotherapy requires a drug that binds strongly and in a site-specific manner to its biological target. In the case of derivatives of the camptothecin family acting as the topoisomerase I (Topo I) poisons [1], this site is defined as a nick in the DNA of the inhibitor/DNA/Topo I ternary complex [2,3].
The inhibition of topoisomerase I is, thus, an important strategy in fighting cancer using chemotherapy. A number of effective bioorganic strategies are used to achieve this goal, such as the noncovalent binding of the poison at the site of degradation, [4,5] cross-linking using binding metals, [6] DNA alkylation [7,8,9,10] or photochemical DNA damage [11].
During the course of earlier research on camptothecin derivatives, we presented evidence for the formation of a molecular complex with the camptothecin core of topotecan (Hycamtin™), which occurred via selective interaction with the ultimate GC base pair in a natural DNA oligomer [12] and inside the nick of the model nicked DNA decamer [5,13]. Further studies [14] led us to disclose new SN38 derivatives that spontaneously alkylate DNA oligomers [15,16,17]. Covalent binding was confirmed in model 2′-deoxyguanosine (dG) [18], 2′-deoxycitidine (dC) [19], and 2′-deoxyadenosine (dA) [20] nucleosides. The GC base pair is considered to be a prerequisite presence in a nicked site of DNA for Topo I inhibition [21]. These results prompted us investigate the present compounds (Scheme 1) with the hope of acquiring more information on the mechanism of their interaction with model nicked DNA (Scheme 2). The possibility of the alkylation of the nitrogen bases inside the nick by potential Topo I poisons would result in pharmaceutics safe for a patient, a priority feature in oncological therapy, and devoid of side effects. This is especially important in view of the fact that the camptothecin derivative Irinotecan used in colorectal cancer therapy, considered by WHO as ‘an essential medicine’, metabolizes to compound SN38 which may result in lethal diarrhea.
The clear explanation for the above reasoning is found in reviews of Pommier et al. [22] who developed the concept of an ‘interfacial inhibitor’ role in the machinery of Topo I activity poisoning, explained on examples of experimental results and confirmed by metadynamic in silico modeling [23]. The central module of action of machinery is the interface of a ternary complex Topo I/DNA/Inhibitor. Most of the interfacial inhibitors are primarily kinetic inhibitors forming molecular complexes with ‘on–off’ rate timing and therefore all contacts between inhibitor and both enzyme and DNA are essential to keep the complex stable and reduce the ‘off-rate’. In the present contribution, the camptothecin derivatives are shown to alkylate the nitrogen bases on the face of a nick in DNA and they totally reduce the ‘off-rate’, stopping the machinery of Topo I activity. In other words, they act as a tool braking on the cogs in a working gear, an activity we wish to highlight in our contribution.
No reports have been published regarding compounds from the camptothecin group that are able to alkylate DNA without the assistance of chemistry or photochemistry, and instead, react spontaneously and therefore have potential for use as medicines in vivo. The mechanism of favorable cytotoxic activity of these compounds [17] has yet to be thoroughly investigated. Preliminary results of experiments on derivatives with DNA oligomers disclosed that, in addition to the alkylation products in a reaction mixture, compounds SN38 and 7-ethyl-9-hydroxymethyl-10-hydroxycamptothecin (4) were found. The formation of these side products influences the yield of desired alkylation and modulates the biological activity of the parent compound under in vitro physiological conditions. This situation is the basis for a discussion regarding the involved mechanism leading to the observation of the biological activity of compounds at the cellular level based on physicochemical properties, such as the half-life time of chemical stability, strength of intercalation, and kinetics of the reaction with oligonucleotides. Explanation will require the consideration of the structural properties that determine the biological activity through mechanisms such as alkylation via a quinone methide intermediate, direct nucleophilic substitution on the 9-C– carbon atom, and retro-Mannich reaction on the 9-C atom. This discussion will hopefully allow for a better understanding of how camptothecin derivatives can poison cancer cells better than other Topo I inhibitors. Therefore, in this study, we attempted to experimentally address these issues.
Previously, we designed the nicked DNA decamer [13] of structure 1 (Scheme 2), which has the GC base pair as a face in the nick and is able to interact with potential Topo I poisons.
It was previously shown [17] that studied compounds (Scheme 1) (Figures S2 and S3) have preferable anti-neoplastic effects on several cancer cells, and the derivatives 3 and 4 are nontoxic to normal cells. These properties prompted us to attempt to establish their pharmacological role at a molecular level as being Topo I poisons, as part of a process of increased understanding toward advancing the new camptothecins to the early phases of clinical studies. Accordingly, in this paper, we present NMR-derived evidence of the site-selective interaction of the SN38 derivatives 7-ethyl-9-(N-methylamino)methyl-10-hydroxycamptothecin hydrochloride (2) and 7-ethyl-9-(N-morpholino)methyl-10-hydroxycamptothecin hydrochloride (3) with the nick in the model decamer 1. We deliberately chose the two derivatives with the secondary and tertiary amine in a substituent at 9-C to determine the eventual differences in binding and reactivity.
We report the results alternatively for compounds 2 and 3, providing all complementary important information in the Supplementary Materials.
The preliminary results showed that the derivatives 2 and 3 react slowly in solution in the presence of DNA oligomers. Therefore, it was decided that the geometry of the molecular complex be characterized at an early stage of reaction and the products analyzed after the reaction was completed.
The kinetics of the interaction were followed by monitoring the 13C resonances in the 24-13C-enriched carbon atom in 3. Molecular modeling, using NOESY-derived cross-peaks, allowed the presentation of the geometry of the inclusion complexes in the nick of 1. The DOSY experiment on the final reaction product in the solution and MALDI–MS spectra of solid products allowed the confirmation of the existence of a site-selective alkylation of a base in the nick, in addition to the strong inclusion of molecular complexes with parent compounds and their hydrolysis product, compound 4.

2. Results and Discussion

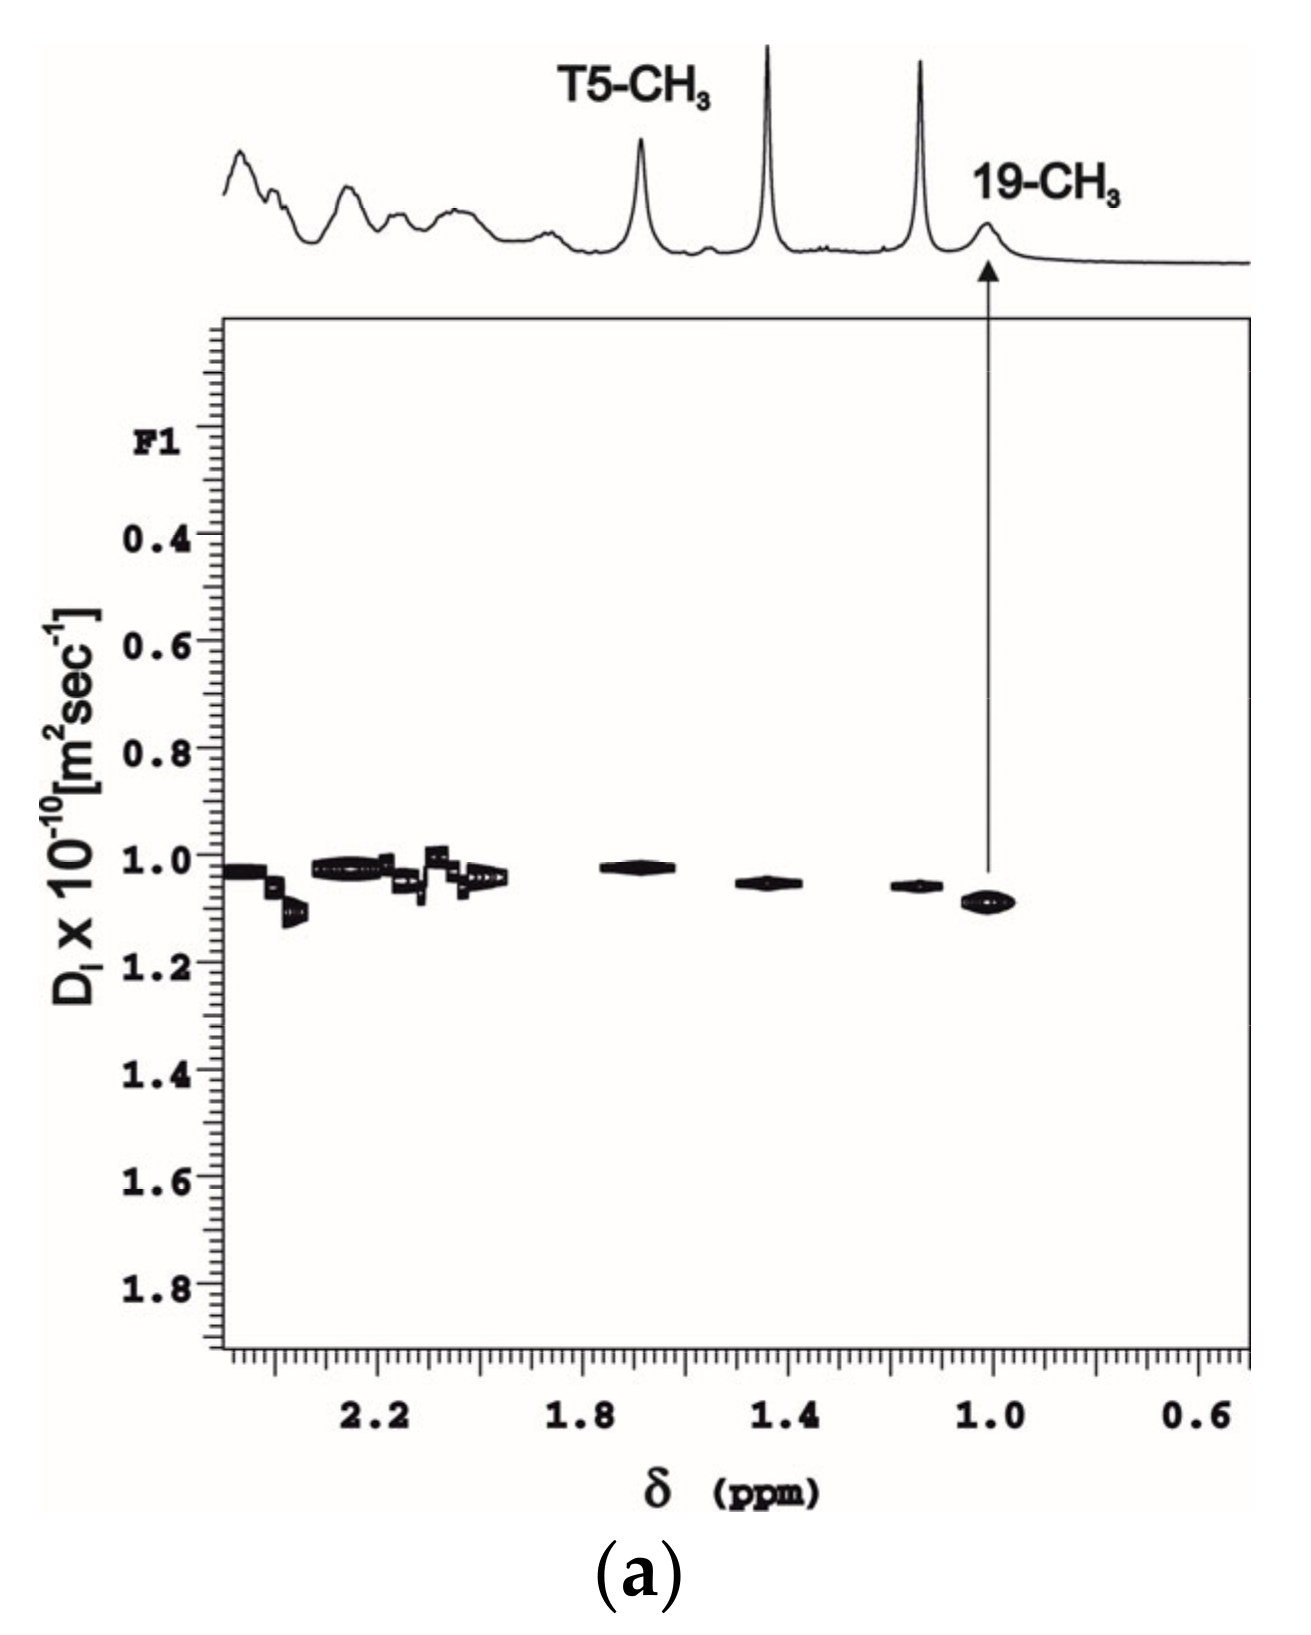
2.1. DOSY Experiments of Molecular Complexes

Diffusion ordered spectroscopy (DOSY) is a convenient NMR experiment for the quantitative analysis of the affinity of interacting molecules in solution [24,25]. It is based on measuring the diffusion coefficients Di × 10−10 (m2 s−1) of both free and complexed compounds. The small ligands 2 or 3 will have much smaller diffusion coefficients upon binding interaction with the larger host molecule 1 compared with the diffusion coefficients when they are free in a solution. The methodology for moving from diffusion coefficients to affinity constants is given in the Materials and Methods. The present results suggest (Table 1) that the binding is very strong. The diffusion coefficient Di for neat decamer 1 in the cited conditions is 1.13 × 10⁻¹⁰ (m2 s−1) [5] and 3.07 × 10⁻¹⁰ (m2s−1) for derivative 2. Taking into account that the derivative 2 is in a molar excess, the observed diffusion coefficient Di 1.47 × 10⁻¹⁰ (m2 s−1) is the mean value of a free and bound 2. Nevertheless, this experiment shows that both interacting molecules form a strong molecular complex. Table 1 shows the data used to calculate the binding constant of a complex. The data in Table 1 show that almost all of compound 1 is involved in a complex with guest 2. The DOSY experiments results for ligands 2 and 3 under similar conditions are presented in the Supplementary Materials (Figures S4,S5 and Figure S6a,b, respectively).
Therefore, a NOESY experiment was planned to gain insights into the geometry of the complex. Compound 2 was chosen for this experiment because it is easier to monitor the fate of the parent compound during the study period using a sharp N–CH3 signal (Figures S2 and S7).

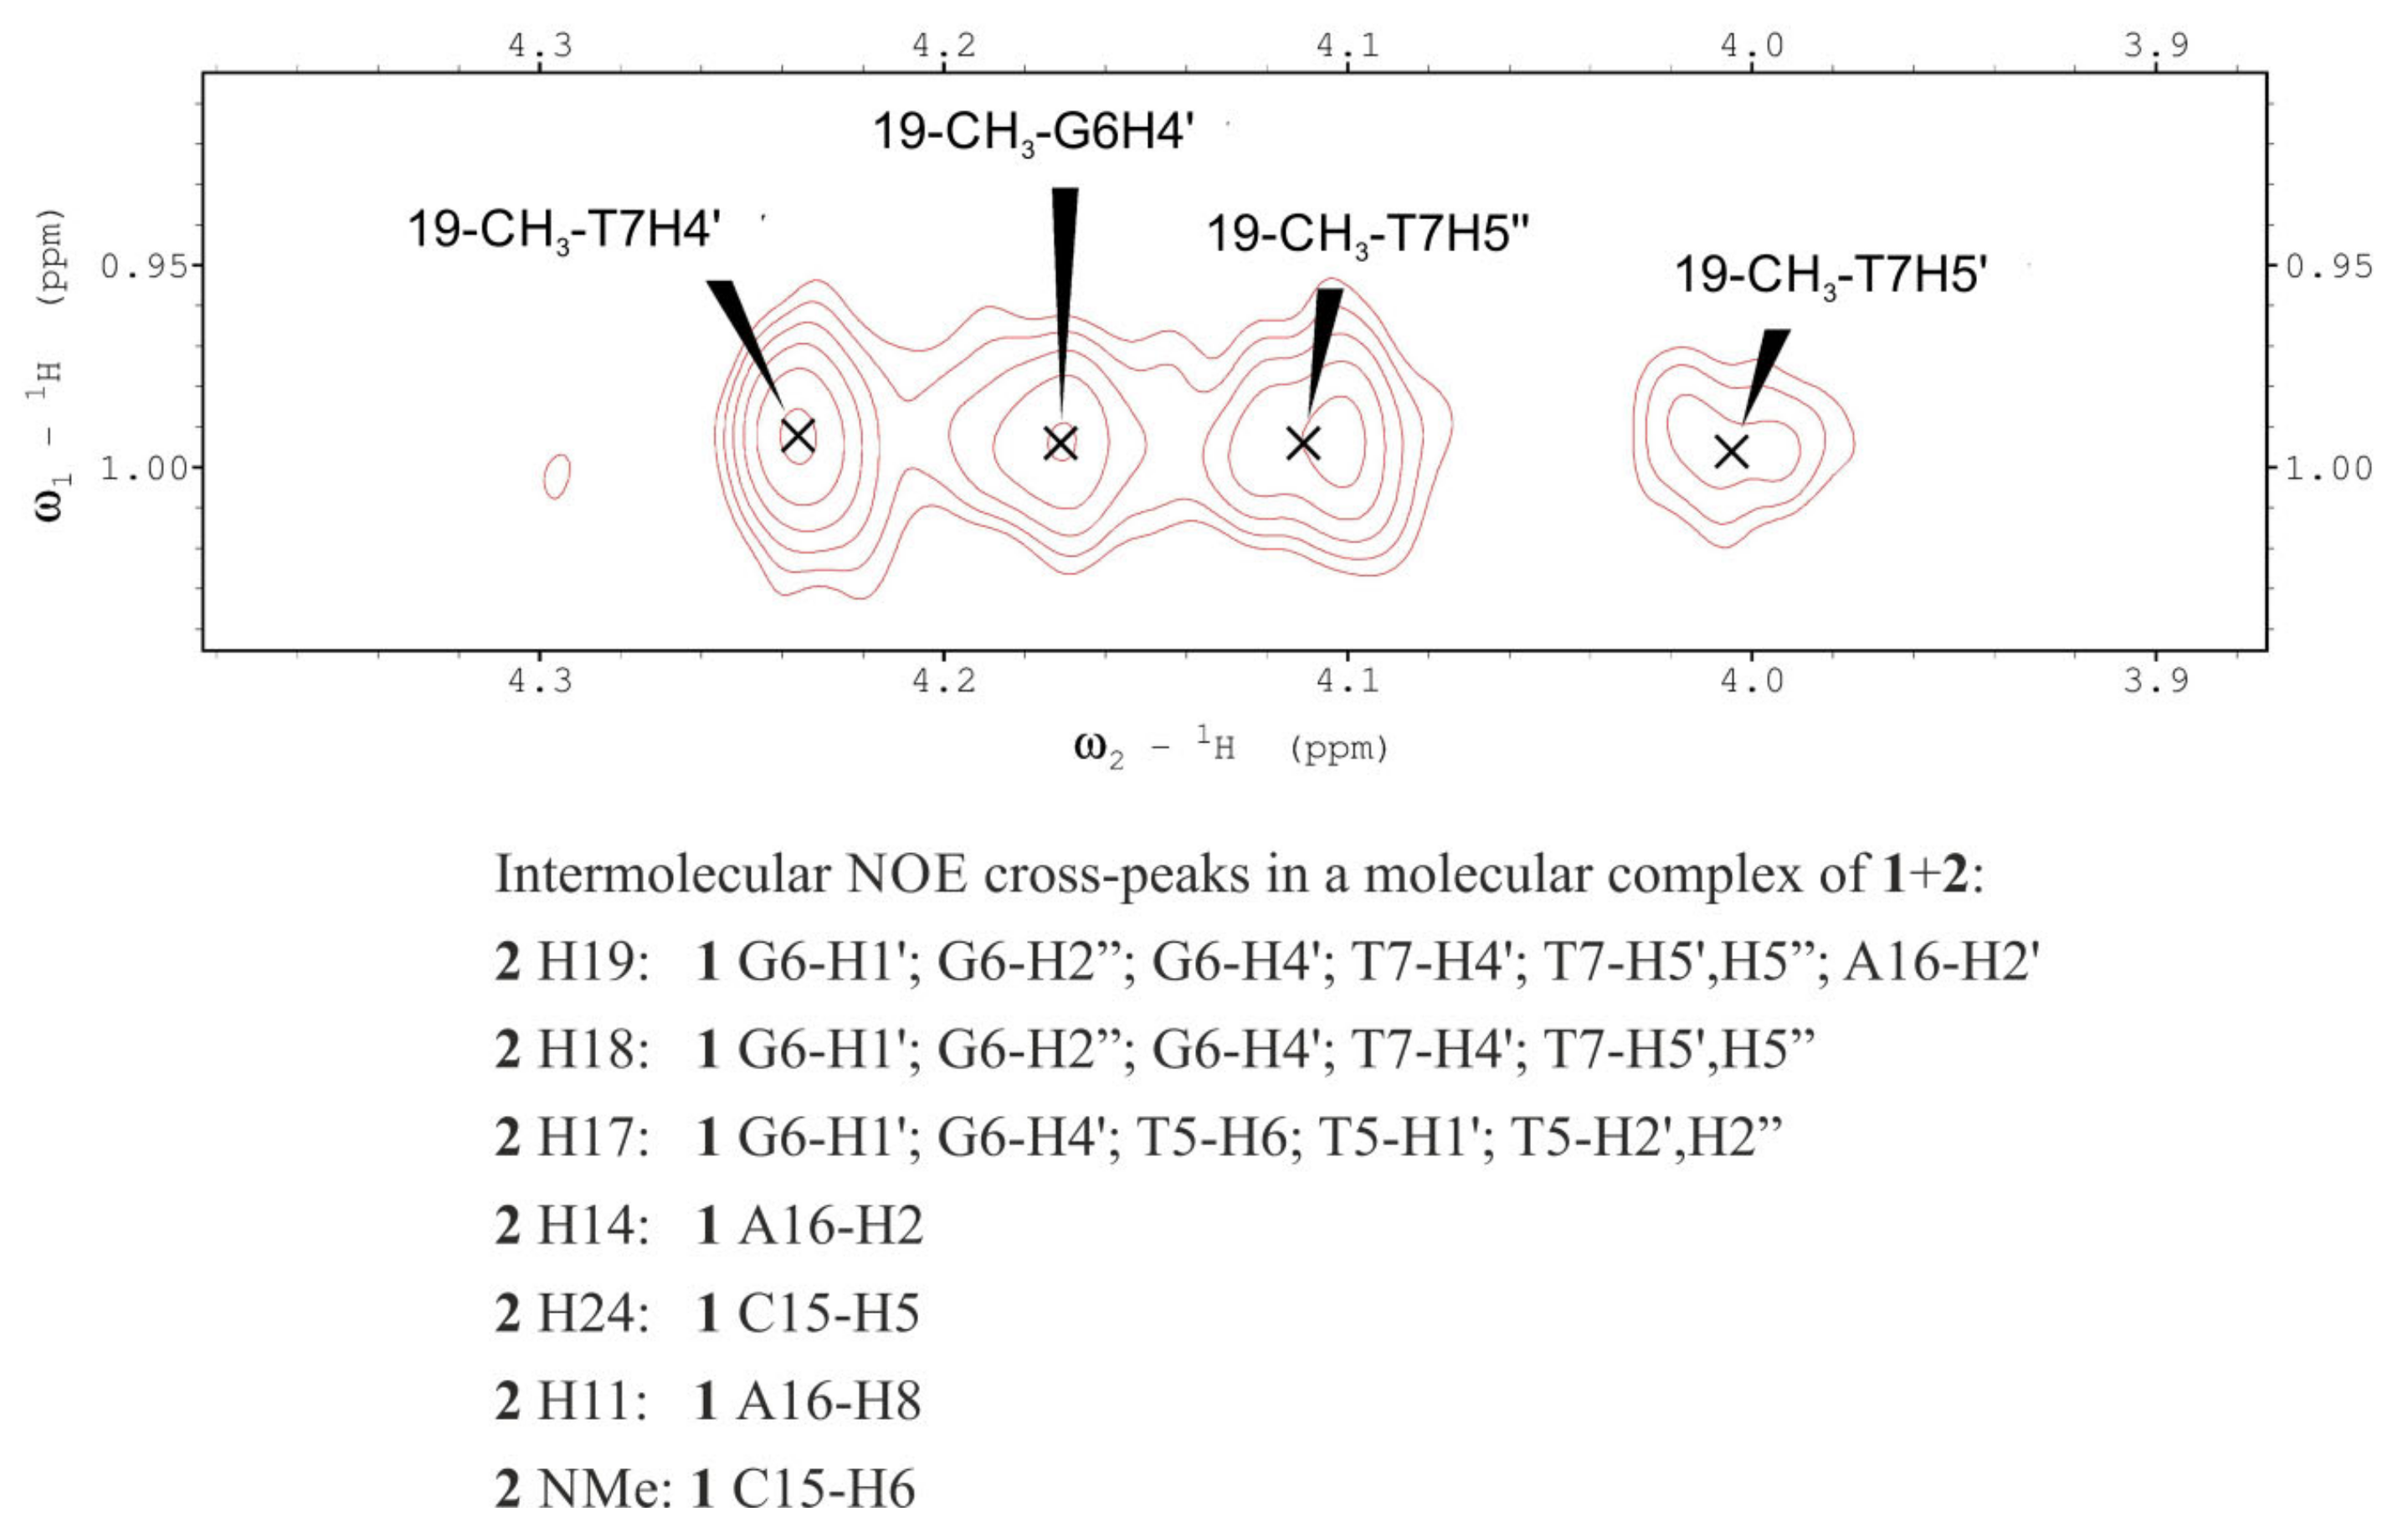
2.2. NOESY Experiment of the Molecular C Complex

The NOESY and TOCSY experiments are two-dimensional NMR techniques commonly used to study macromolecules such as proteins and DNA. TOCSY is an experiment in which we observe cross-peaks on spectra not only for directly coupled nuclei, but also between nuclei connected by a chain of couplings. This makes the technique very useful for the correct assignments of protons in individual units of a DNA sequence. The NOESY experiments are used to establish correlations between nuclei that are physically close to each other (correlation through the space within approximately 5 Å), whether or not there is a bond between them. The NOESY technique is typically used to determine the DNA sequence. Since we can observe the correlation peaks between the two interacting molecules on the NOESY spectra, the technique was also commonly used to study DNA molecular complexes with ligands.
The NOESY and TOCSY spectra were used to assign the protons’ chemical shifts of decamer 1 and compound 2 in complex at 1:2 ratio (Table S1 and Table 2), including the assignment of all the found intermolecular cross-peaks. Table 3 presents the changes induced in chemical shifts of neat decamer 1 [13] by interaction with 2. They are confined to the two base pairs flanking the nick because negligible changes were observed in more distant base pairs (Table 3 and Table S1). Table 2 also shows changes in chemical shifts induced in protons in compound 2 by interaction with decamer 1 in a complex.
The data presented in Table 2 and Table 3 show that, in both interacting molecules, most protons undergo low frequency shifts, which indicates the stacking of the aromatic core of derivative 2 and nitrogen bases in 1 (see Section 2.3). Strong interaction thus allows the intermolecular cross-peaks shown in Figure 1 to be observed.
The integrated volumes of all intermolecular NOE cross-peaks are cited in Table 4. These are given as a percentage of an intramolecular cross-peak volume between isolated pairs of spins of protons 11-H and 12-H in compound 2.
Based on the presented experimental data, several remarks can be made concerning the origin and geometry of a complex. From the presented complementary data of DOSY and NOESY, the conclusion can be drawn that interacting molecules 1 and 2 form a complex, which is in fast exchange at a chemical shift time scale at the NMR frequency used (500 MHz). The single spectra of both interacting species are observed. The correlation time of a molecular complex, its strong binding, and its apparent high population in an equilibrium at the NMR time scale and temperature used in the experiment allow the observation of dipolar contacts in a complex in the form of cross-peaks of intensity comparable to the intensity of intramolecular cross-peaks.
Both solutes are in exchange but strongly interacting, as indicated by DOSY. Relatively large chemical shift changes to lower frequencies, upon complex formation, also point to a mutual strong influence, suggesting stacking as an interaction mode. This reasoning is also true for the rigid positioning of a camptothecin core of topotecan entrapped in a nick of a crystal structure of a complex DNA/TPT, as shown in Figure 2.
The cross-peaks are nearly exclusively found in base pairs flanking the nick. This indicates that the guest molecule is placed in the nick. Furthermore, the individual cross-peaks indicate that ring A of compound 2 interacts with bases C15 and A16 in an unbroken strand of a duplex, whereas ring E is facing the T5 and G6 bases in a broken strand. This hints strongly at the geometry of a guest in the nick, as shown in Figure 2. It was therefore decided to qualitatively use these cross-peak volumes in a protocol of molecular modeling to confirm the above indications and choose one of the four possible geometries of stacking for the guest molecule in the nick of decamer duplex 1. The alternative protocol of quantitatively using cross-peak volumes is not possible in the present case due to experimental constraints in calculating the complex structure. The complexity of the mechanism of action prevents the construction of the buildup of small cross-peak volumes using mixing time in the NOESY experiment in a range of 50–200 µsec.

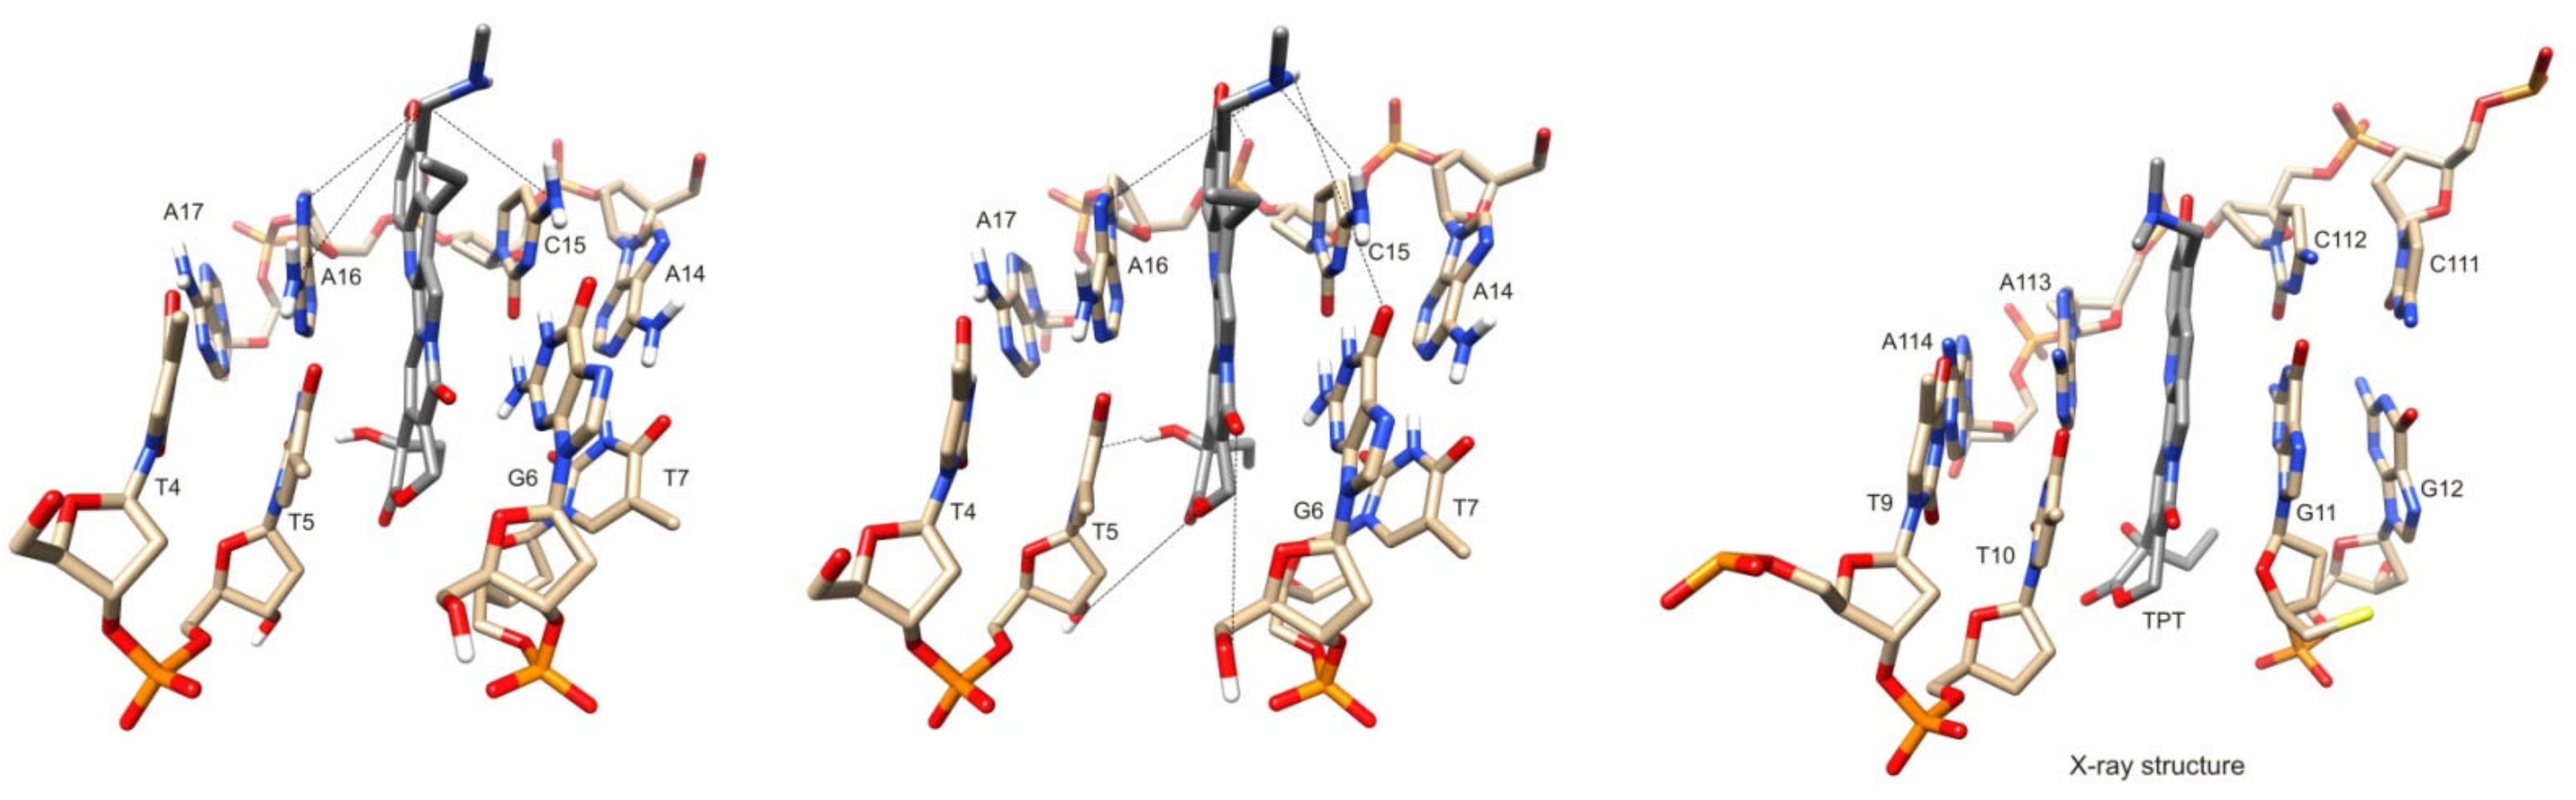
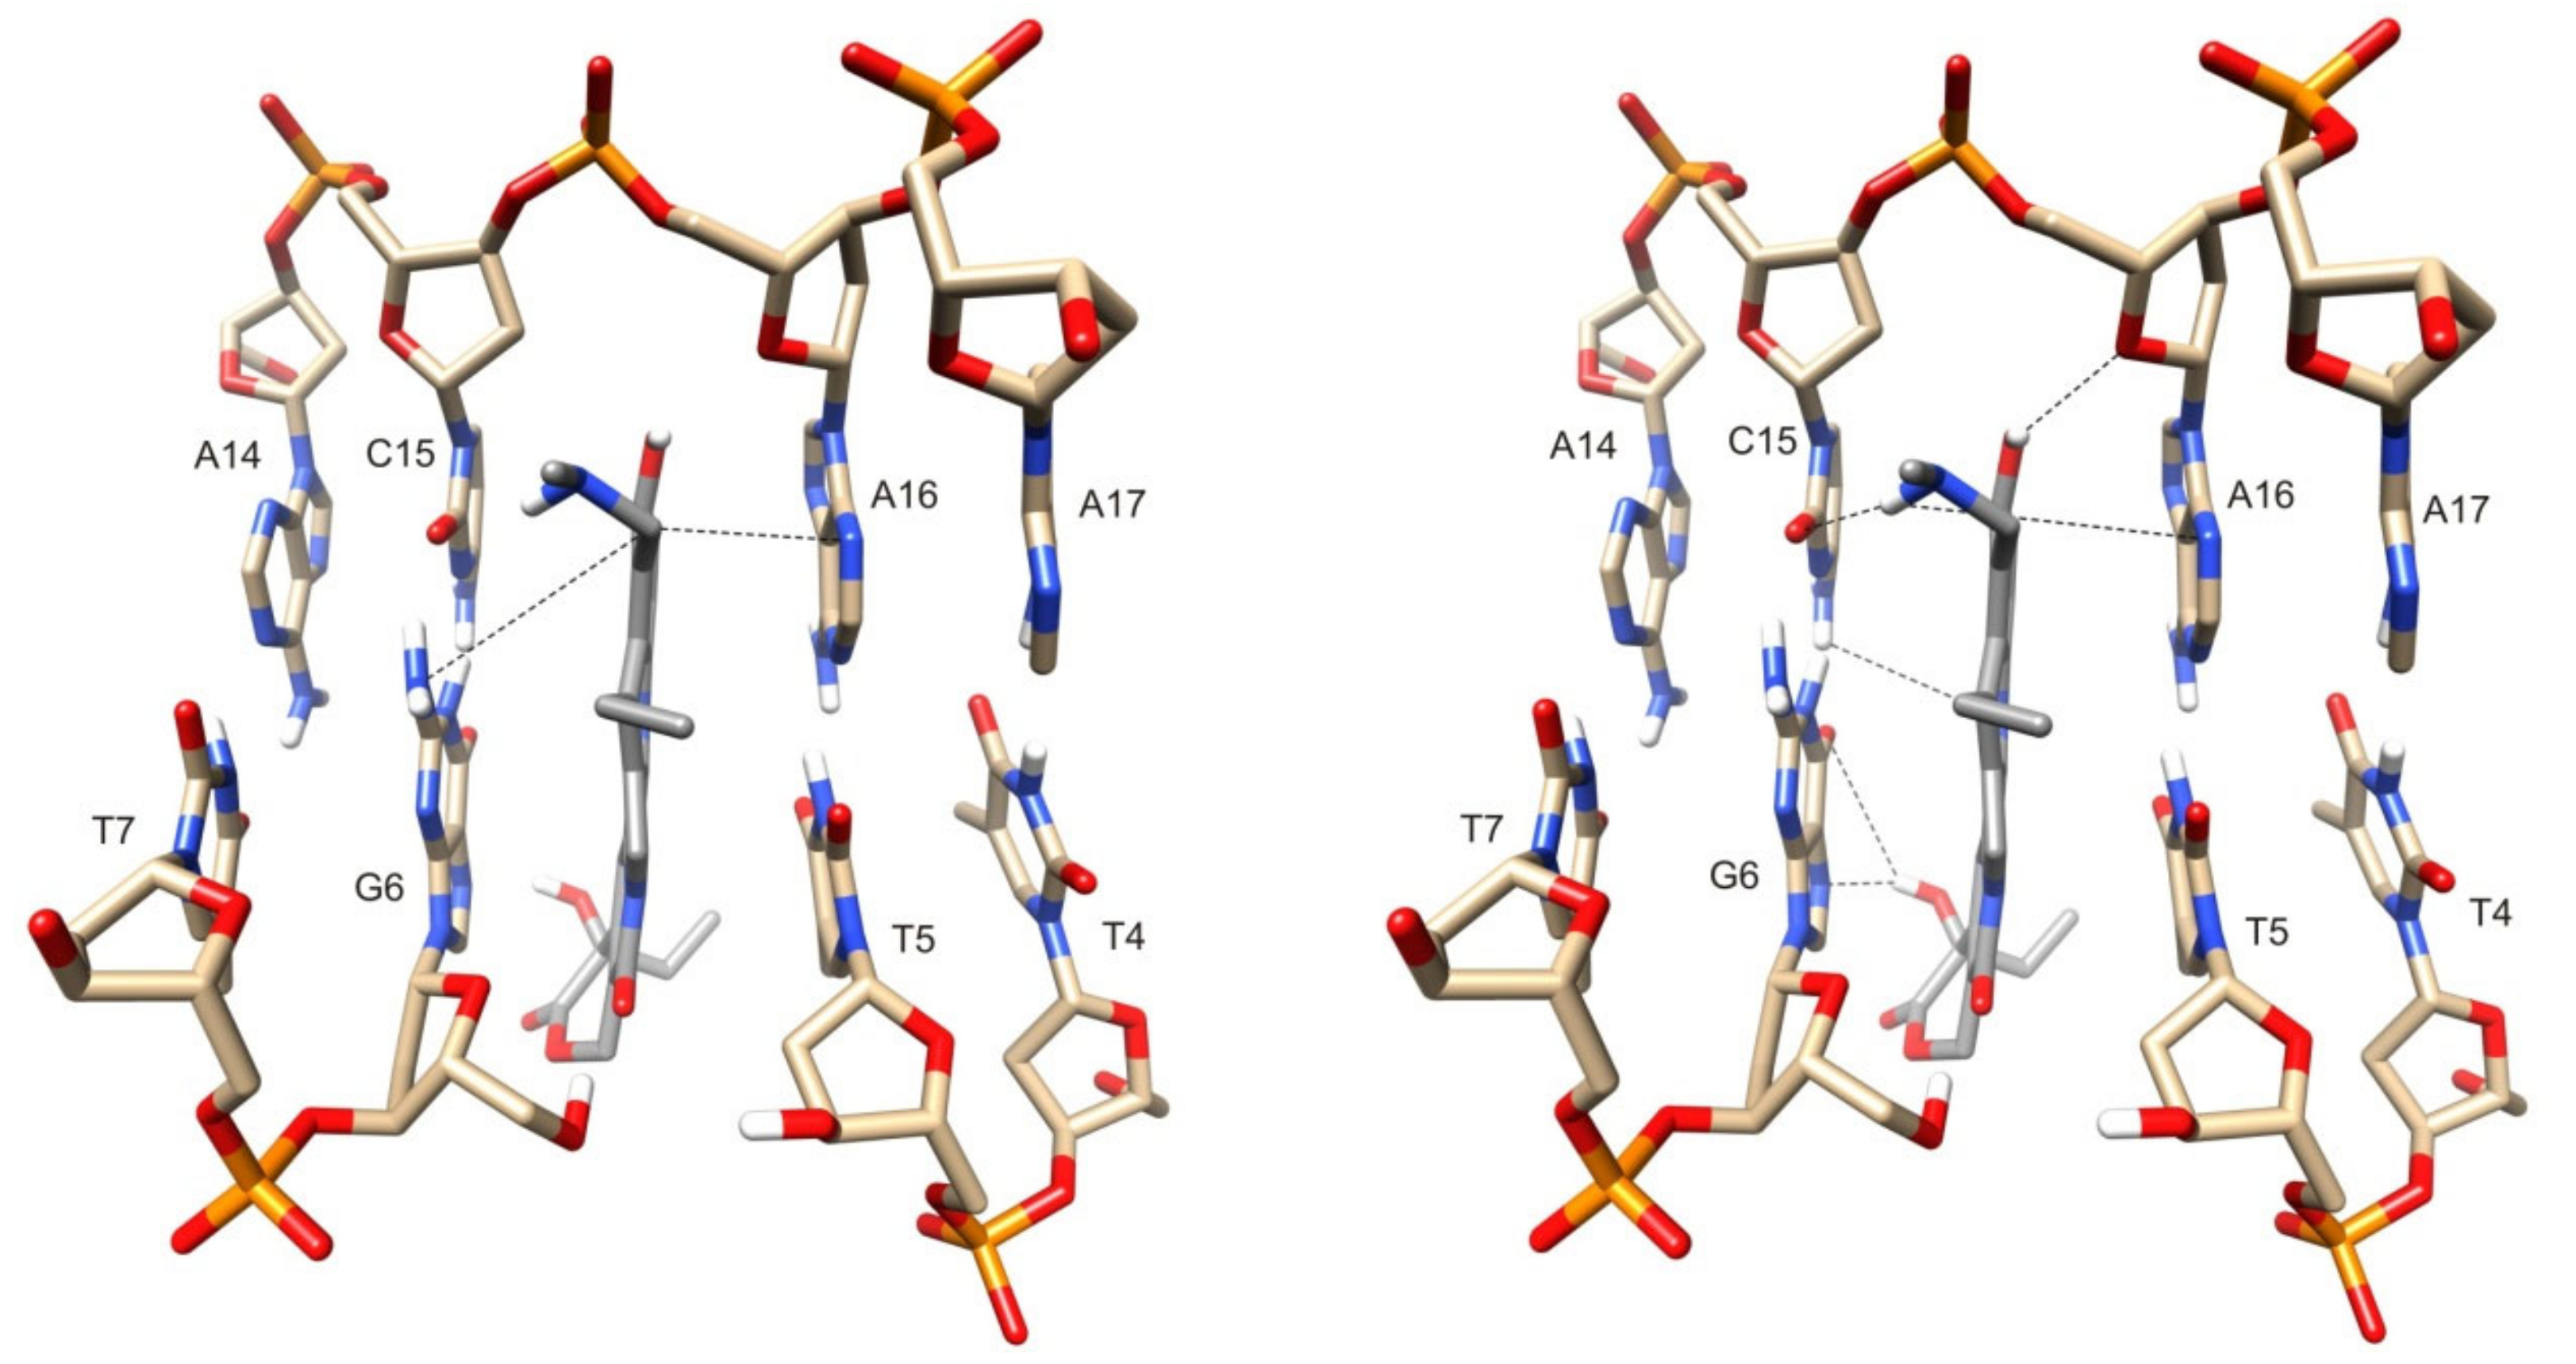
2.3. Molecular Modeling

The SN38 derivative was manually docked to the model structure of the nicked DNA receptor previously established by authors [13] in all four possible stacking orientations. The two starting orientations of the bulky substituents in 2 (9-CH2–NH–CH3 and 7-CH2–CH3) relative to the remainder of the camptothecin core were taken into consideration, resulting in a total of eight systems, which were then each subjected to 500 ns molecular dynamics (MD) calculations. The trajectories—which were doubled due to the starting orientation of the substituents—were combined into one, resulting in four distinct structures (Table S3). Table 4 shows the result of an analysis of the ensemble of conformations for each cluster, representing four structures of initial stacking orientation of 2 in the nick (Figures S11–S13; Tables S3 and S4). The first two columns define the interacting protons that give rise to a cross-peak, whereas column 3 indicates the distance between them, reflected by a cross-peak volume, which is calibrated vs. the distance between the 11-H and 12-H protons of 2. In an ensemble of conformations defining the four trajectories, the distance in each conformation between the given pair of protons was statistically evaluated according to five defined conditions (in Å), and the percentage of conformations meeting this requirement is shown in Table 4. Inspecting Table 4 clearly points to the structure of 1 (Figure 2) as the one which meets the requirements in a high percentage. It is worth noting that a high percentage of conformations meet the requirement of <4 Å, a distance which can give reliably measurable intermolecular NOE effects.
Furthermore, some statistical confirmations were found for structure 3, which is also characterized by facing the ring A of 2 with the unbroken strand, but the guest is turned over by 180° inside the nick along its long axis (Figure 3). Hence, the presence of cross-peaks is observed between the T5 base in a broken strand and 17-H of 2 (Figure 3). Further evidence of this is the structure in Figure 3. This geometry of a guest inside the nick justifies the absence of cross-peaks between 19-CH3 and ribose protons in G6, T7 in the molecular modeling of structure 3 (Table 4). This methyl group is further from the ribose rings of G6 and T7 than in structure 1 because it is on the opposite side of a camptothecin ring E.
The calculated averaged energies for MD trajectories for the investigated structures are given in Table S3. The differences between these are less than the accuracy of the calculations. Therefore, in this work, we place the main emphasis on the comparison of the calculated geometric parameters (dipolar contacts represented by cross-peaks due to the stacking of the aromatic rings of interacting species and intermolecular hydrogen bonds). Nevertheless, the energy analysis also confirms the preference for structures 3 and 1.
The distances between the given protons represented by cross-peaks in Table 4 fulfill most of the imposed conditions. Table 4 reports the statistical analysis of dipolar contacts in structures 1 and 3, and Table S4 reports the analysis of hydrogen bonds in ensembles 1–4. The dipolar contacts favor structure 1, but hydrogen bonding is favored in structure 3, with a higher percentage of existing hydrogen bonds compared with structure 1 (Table S4). Both phenomena (stacking and hydrogen bonding) contribute energy to the complex formation and therefore structures 1 and 3 were considered to best represent the geometry of a complex. Moreover, the geometry of structure 1 is also very similar to that seen in the X-ray structures of ternary complex Topo I/DNA/TPT [26] as shown in Figure 2. It is clearly seen that in both cases, the positioning of a camptothecin core is the same; with ring A facing A, C bases and ring E facing the T, G bases in a scissile strand. Additionally, in both cases, the substituents on the 9-C carbon atom, N-CH3 and N-(CH3)2 groups point towards a major groove. The camptothecin core is trapped in a nick mimicking stacking mode as if it were an additional base pair. These results are in agreement with the earlier molecular modeling of docking camptothecin core into a ternary cleavable complex. [27,28]
Both computed structures in Figure 2 and Figure 3 can be plausibly confirmed by the experimental results given in Table 2 and Table 3 and the observed cross-peaks. First, the observed changes of chemical shifts on DNA protons, upon complex formation, are almost entirely confined to aromatic bases flanking the nick from both sides. Second, the low frequency shifts induced on protons in 2 allow clear suggestions concerning the positioning of a camptothecin core inside the nick. The protons around ring A, namely, 11-H, 24-H, and N–CH3, show cross-peaks with the aromatic protons of C15 and A16, and therefore experience large low-frequency shifts being in the shielding cones of these aromatic bases from both sides. By comparison, the protons around ring E, namely 17-H, 18-H, and 19-H, have cross-peaks with the aromatic protons of G6 in a broken strand. This increases confidence in the identification of the nitrogen bases inside the nick of derivative 2 as possible sites of alkylation (Table 5). It can be supposed that the geometry of both structures 1 and 3 make alkylation of nucleophilic bases possible in the nick (Table 5). In structure 1, atom 24-C of a transient methide is facing the NH2 group of cytosine C15 or adenosine A16 and the N7 nitrogen atom of the adenosine. This course of a kinetic alkylation of N7 nitrogen atom was recently discussed in the reaction of compounds 2 and 3 with model 2′-deoxyadenosine [20]. In addition, structures 1 and 3 are stabilized by a network of hydrogen bonding from both ends of a camptothecin core (Figure S13, Table S4). In structure 3, the alkylation of the NH2 group of guanosine G6 is possible, and finds precedence in a recently published result of the alkylation of model 2′-deoxyguanosine [18]. The alkylation of the N3 nitrogen atom in adenine A16 is also indicated, as shown in a projection of structure 3, although it is less probable in view of earlier results [20].

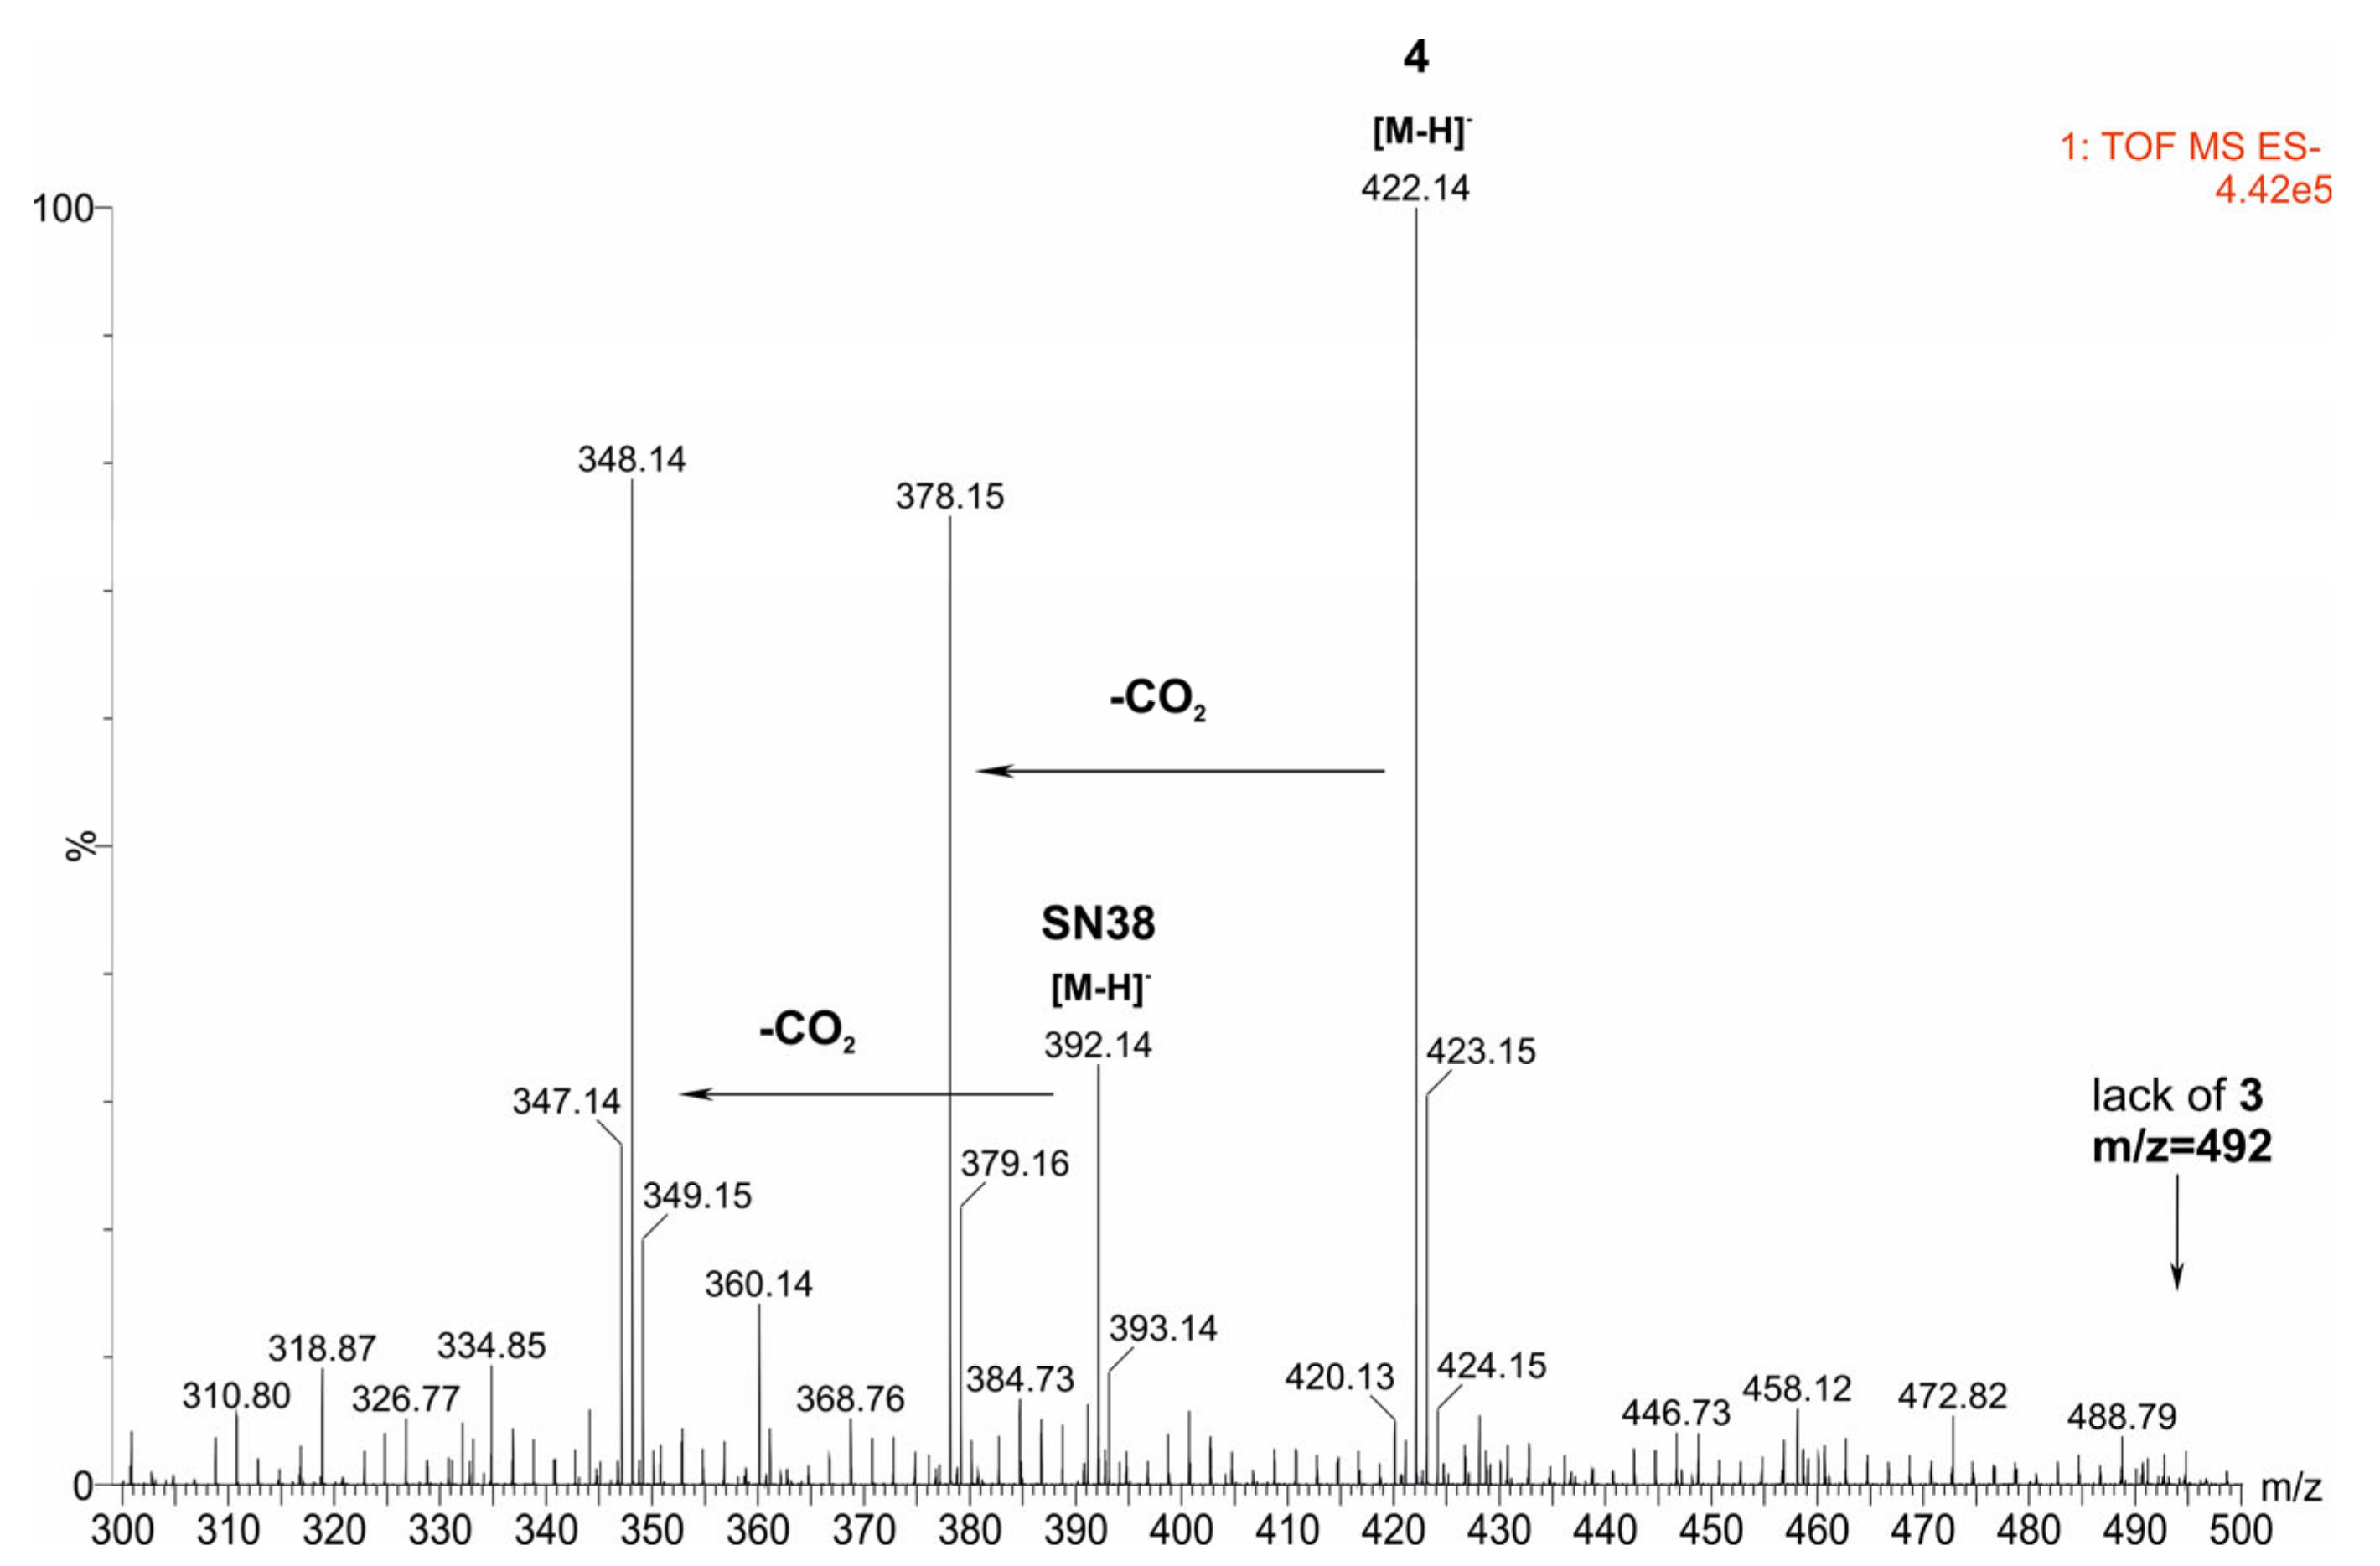
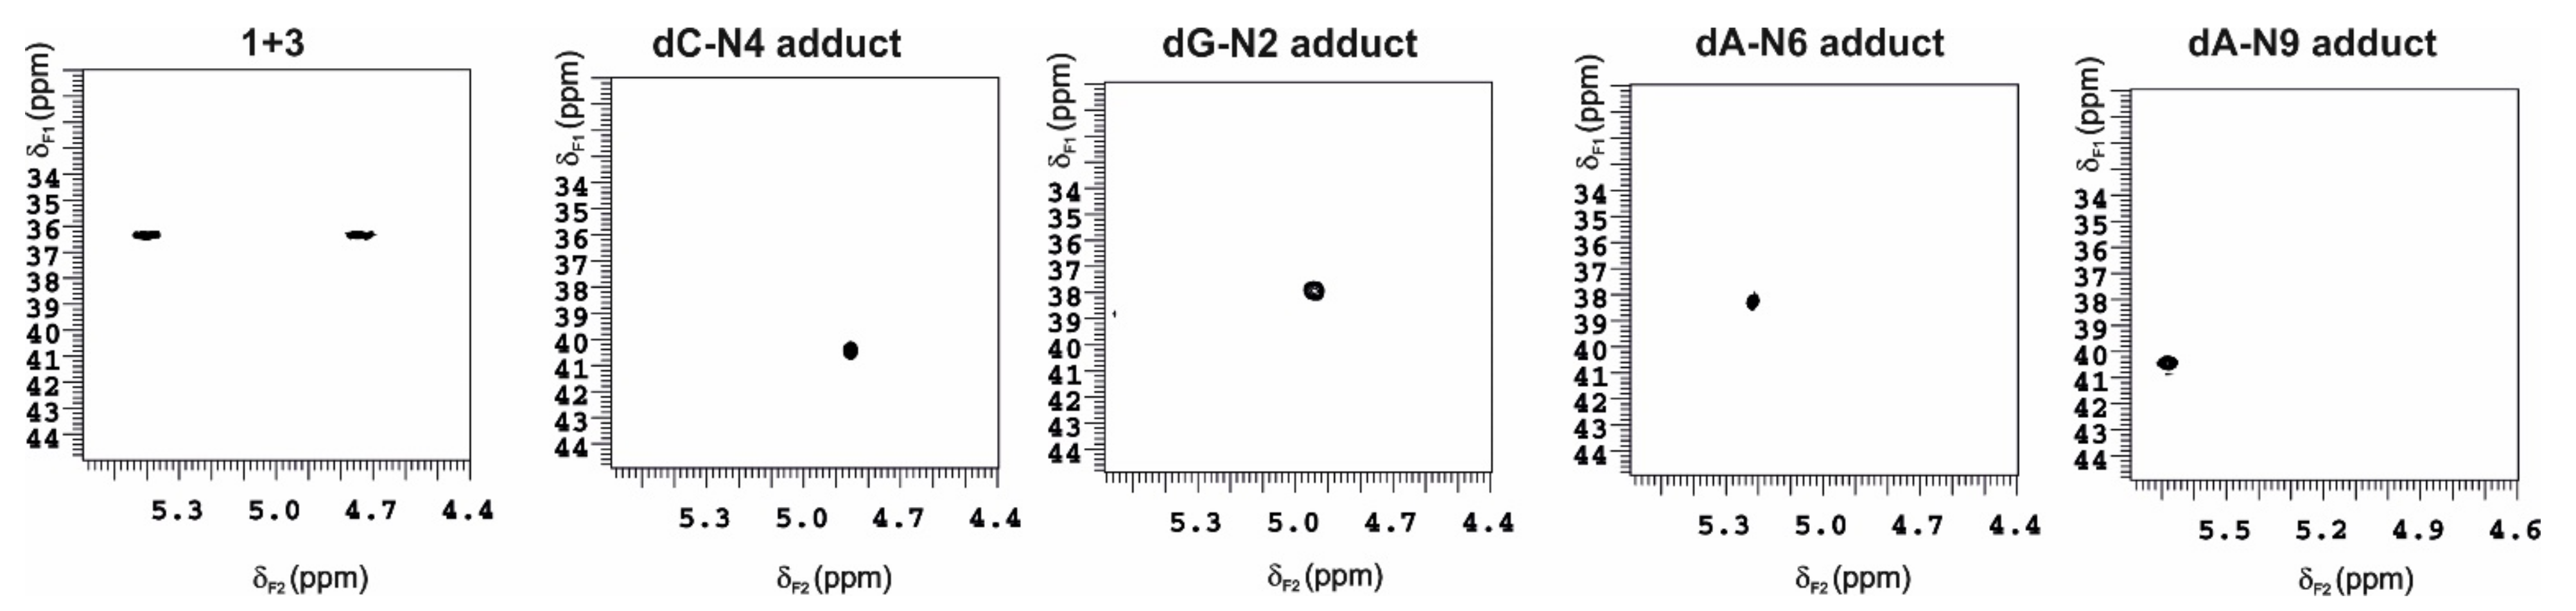
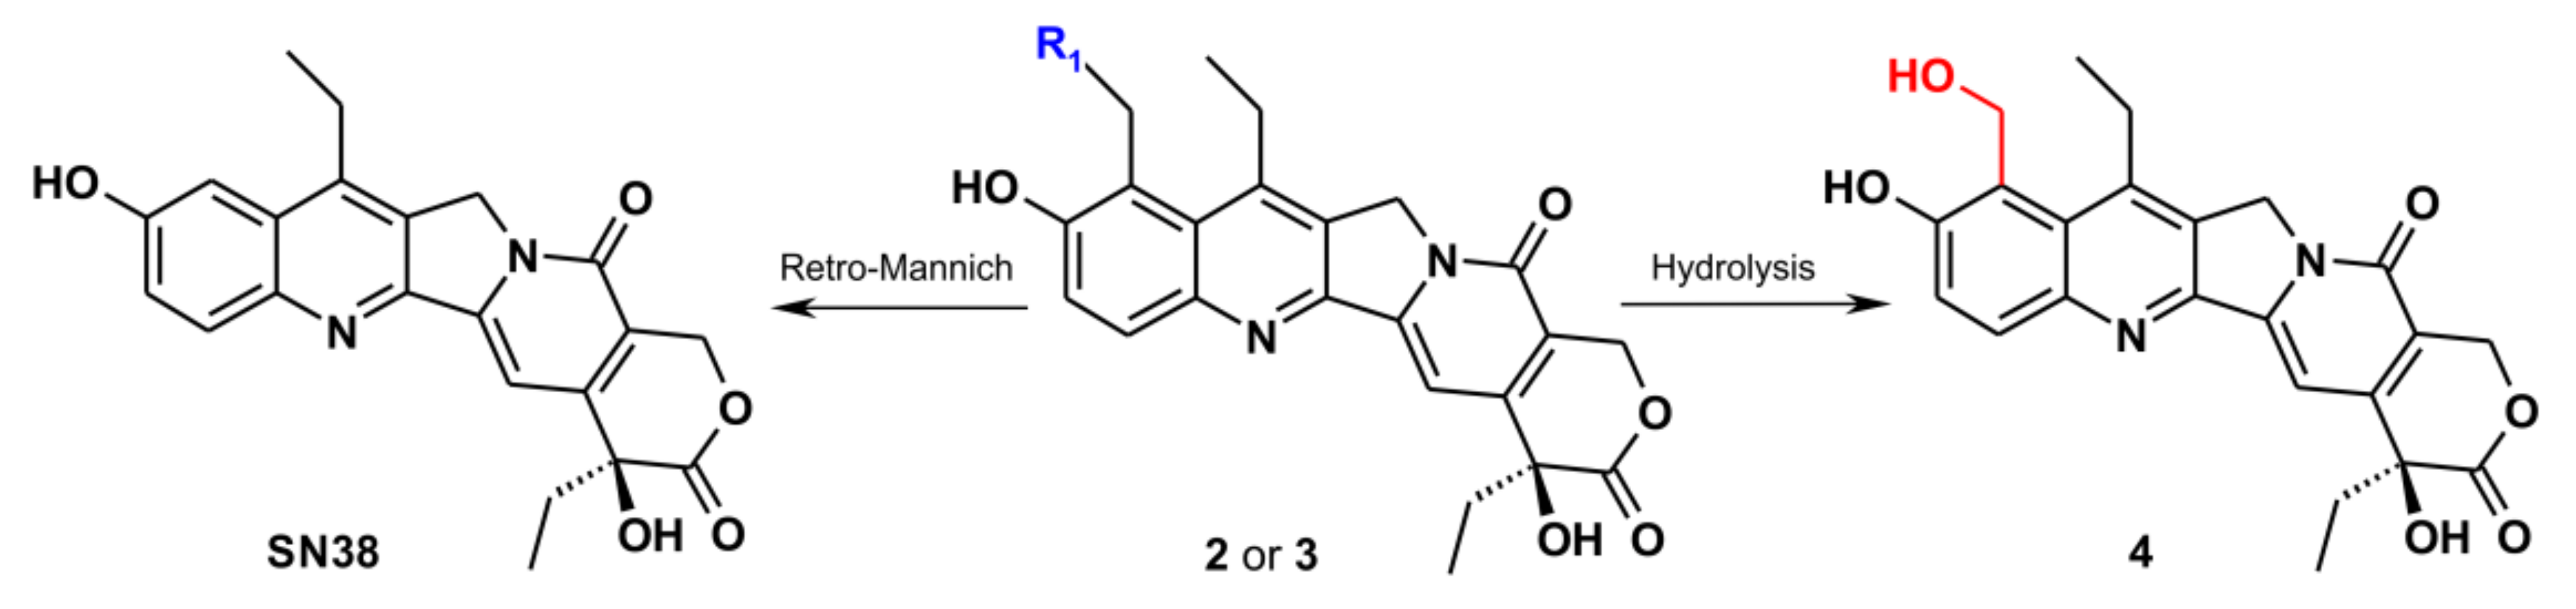
2.4. The Reaction Products Analysis

As the reaction solutions contain an excess of compound 2, which influences the value of the diffusion coefficient, Di, it was decided to remove it to establish the condition that enables the recording of the interaction in a 1:1 molar ratio of components. After filtering the reaction solution through a membrane to remove the unbound 2 and 7-ethyl-9-hydroxymetyl-10-hydroxycamptothecin, 4, the mother liquor (ML), was further incubated at room temperature for several weeks and the ratio of T7-CH3 and 19-CH3 was monitored by 1H NMR integration. The sample stabilized at the 1:1 ratio of components 1 and 2. The DOSY experiment in Figure S5 shows equal diffusion coefficients for both reactants (Di, 1.0 × 10⁻¹⁰ (m2 s−1)) in solution, indicating very strong binding in a molecular complex. In addition, the 1H NMR of the mother liquor (ML) (Figure S7) shows the same integration of N–CH3,19-CH3 of 2, and T7-CH3 of 1, indicating that parent compound 2 is a major component in the molecular complex with 1.
These indications are confirmed in the ESI–MS spectrum of the mother liquor shown in Figure 4, which presents the m/z range 300–500 of the ESI–MS spectrum of positive and negative ions. It shows mother peaks for parent compound 2 (m/z = 436, [M + H]+) and its hydrolysis product 4 (m/z = 421, [M − H]) as guest ligands of a broken molecular complex with 1. Interestingly, and also importantly, there is only a minor intensity peak due to SN38 (m/z = 391, [M − H]) in the negative ion spectrum (product of the retro-Mannich reaction, Scheme 3). In agreement with this, the MALDI–MS spectrum of lyophilized mother liquor in Figure 5 (Figure S14) shows free compound 1 (m/z = 6885.8) as a host molecule of a broken molecular complex and alkylated product (m/z = 7290.9).
The above information from DOSY, NOESY, MD, MALDI–MS, and ESI–MS spectra allows the conclusion to be drawn that compound 2, either in the form of a molecular complex or alkylated biohybrid, is bound inside the nick of a model DNA, mimicking the target for Topo I poisons regardless of the internal geometry of molecular complexes depicted as structures 1 and 3 from MD (Figure 2 and Figure 3). In both cases, the prerequisite conditions required for Topo I poisons, i.e., binding in a nick, are fulfilled.
The same procedure of filtering was applied to the reaction mixture of compounds 1 and 3 (fully enriched 24-13C). The solid, which precipitated during reaction, was analyzed separately by HPLC (Figure S15). The DOSY and HPLC analysis results of the mother liquor (ML) for reaction with compound 3 are given in Figure 6 (see also Figure S15).
The DOSY experiment (Figure 6a) shows that compounds in the ML solution have the same diffusion coefficient, although the broadening of 19-CH3 signal may suggest that broadening is due to the overlap of this signal derived from a few compounds strongly bound to DNA and a covalently bound bioconjugate. It cannot be directly judged from this experiment which ligand is bound to nicked DNA, although the HPLC analysis suggests the presence of the bioconjugate (Figure 6b, peak with the retention time ca. 2 min), and bound compound 4 and SN38 (Figure S15), because any of these can persist when bound to 1 in solution.
The ESI–MS spectrum of ML in Figure 7 does not show the mother peak of 3 (m/z = 492) in positive and negative ions. The spectrum shows a dominant peak of compound 4 (m/z = 422) and SN38 (m/z = 391) as a product of the retro-Mannich reaction of 3 (Scheme 3). Both can be considered as ligands of a broken molecular complex with 1. Consistent with this, the MALDI spectrum in the m/z range 5000–8000 (Figure S16a,b) shows a peak of neat DNA (m/z = 6888,2; [M + H]+) of a host molecule and peak (m/z = 7291.5, [M + H]+) of an alkylated biohybrid.
In view of the NOESY results and possible geometry established for the molecular complexes, which showed close contacts of the 24-C carbon atom of 2 with nucleophilic centers in the DNA nick, compound 3 was synthesized with fully 13C-enriched formalin (Figure S3a). This enabled the monitoring of the fate of the 24-C carbon atom during the reaction and provides preliminary information about the nitrogen base in the nick of 1 with the reactive methide intermediate of 3 as a site of alkylation [17]. Due to the low content of biohybrid 1 + 3 in the mother liquor, it was not possible to assign the site of alkylation and, therefore, we instead determined this by comparing the 13C chemical shift from the HSQC spectrum of the enriched 24-C13 in a biohybrid with the same carbon atoms in model nucleosides alkylated with 3.
Figure 8 presents a comparison of 1H/13C HSQC spectra of the relevant spectral ranges from the alkylation reaction of 1, 2′-deoxyguanosine [18], 2′-deoxycytidine [19], and 2′-deoxyadenosine [20] with 3. It can be seen that carbon chemical shifts of the 24-C atom fall in biohybrids within a narrow range of ca. 40 ppm.
The 1H chemical shift falls within the expected range of 4.6–5.5 ppm, although it can differ for reaction 1 + 3 from the model compounds because the former depends on various environmental effects in the nick, such as the anisotropy effect of aromatic rings or steric compression. These effects can also explain the observed nonequivalence of 24-CH2 protons. It can therefore be tentatively suggested that the observed HSQC cross-peaks reflect the alkylation of NH2, as in any of the model compounds. The molecular modeling discussion corroborates this tentative suggestion. It was shown (as is displayed in Figure 2 and Figure 3) that the 24-C carbon atom of intermediate o-methylene quinone of 2 is in close proximity to the NH2 protons in C15, A16, and G6.
In summary, the NMR experiments provide evidence of the interaction of alkylamino substituted in position 9-C SN38 derivatives, in the nick of the model nicked DNA duplex. The NMR, ESI–MS, and MALDI–MS experiments show that both compounds 2 and 3 react in a different way. It was shown that a strong molecular complex was formed with derivative 2 (Ka 4.07 mM−1) at the initial stage of the interaction, and it persists in a mother liquor (ML). In addition, a nucleophile in the nick is alkylated. Both of these phenomena confirm the strong binding of the target DNA, as confirmed by DOSY. The reaction products also contain the product of the hydrolysis reaction of derivative 2 and 3. The ESI–MS of the ML does not show the presence of SN38 in the case of compound 2. However, the ML of compound 3 shows the presence of the alkylated 1, compound 4, and a minor amount of SN38. These coexisting phenomena are confirmed by DOSY, 1H/13C HSQC, and MALDI–MS experiments.

2.5. The Topo I Relaxation Activity Test

Human Topo I is a type I topoisomerase that is able to relax supercoiled DNA. In order to confirm the influence of studied compounds on topoisomerase I relaxation activity, we performed the test based upon the measurement of fluorescence of DNA stain which can differentiate between supercoiled and relaxed DNA.
Camptothecin (CPT) and SN38 are well-known Topo I interfacial inhibitors acting as Topo I poisons and were chosen as the positive control and reference standard. First, the amount of Topo I needed to just fully relax the supercoiled plasmid was determined. We then observed concentration-dependent change in the ratio of relaxed plasmid after the addition of camptothecin and SN38 to the reaction mixture, containing DNA plasmid and Topo I (Figure 9). The calculated IC50 indexes are equal to 92.9 and 40.3 µM (Table 6) for CPT and SN38, respectively. At the concentration of 100 µM, SN38 was able to reduce the Topo I relaxation activity by 80%, while camptothecin only by half.
Then, the relaxation activity of human Topo I was measured after the addition of SN38 derivatives. The obtained results shows that derivative 2 reduced Topo I relaxation activity as effectively as camptothecin. The IC50 index reached the value of 100.7 µM. The significantly better properties than camptothecin and compound 2 exhibits derivative 3. The IC50 index calculated for 3 reached the value of 48.7 µM and was at the level established for SN38. Moreover, at the highest concentration (100 µM), the inhibition of Topo I relaxation activity was stronger for 3 than for SN38—the % of relaxed DNA plasmid was lower than 10% of initial amount, which is twice as much as that for SN38.
The presented results confirmed that studied SN38 derivatives effectively block DNA relaxation mediated by Topo I, which means that they stop the machinery of Topo I activity.

3. Materials and Methods

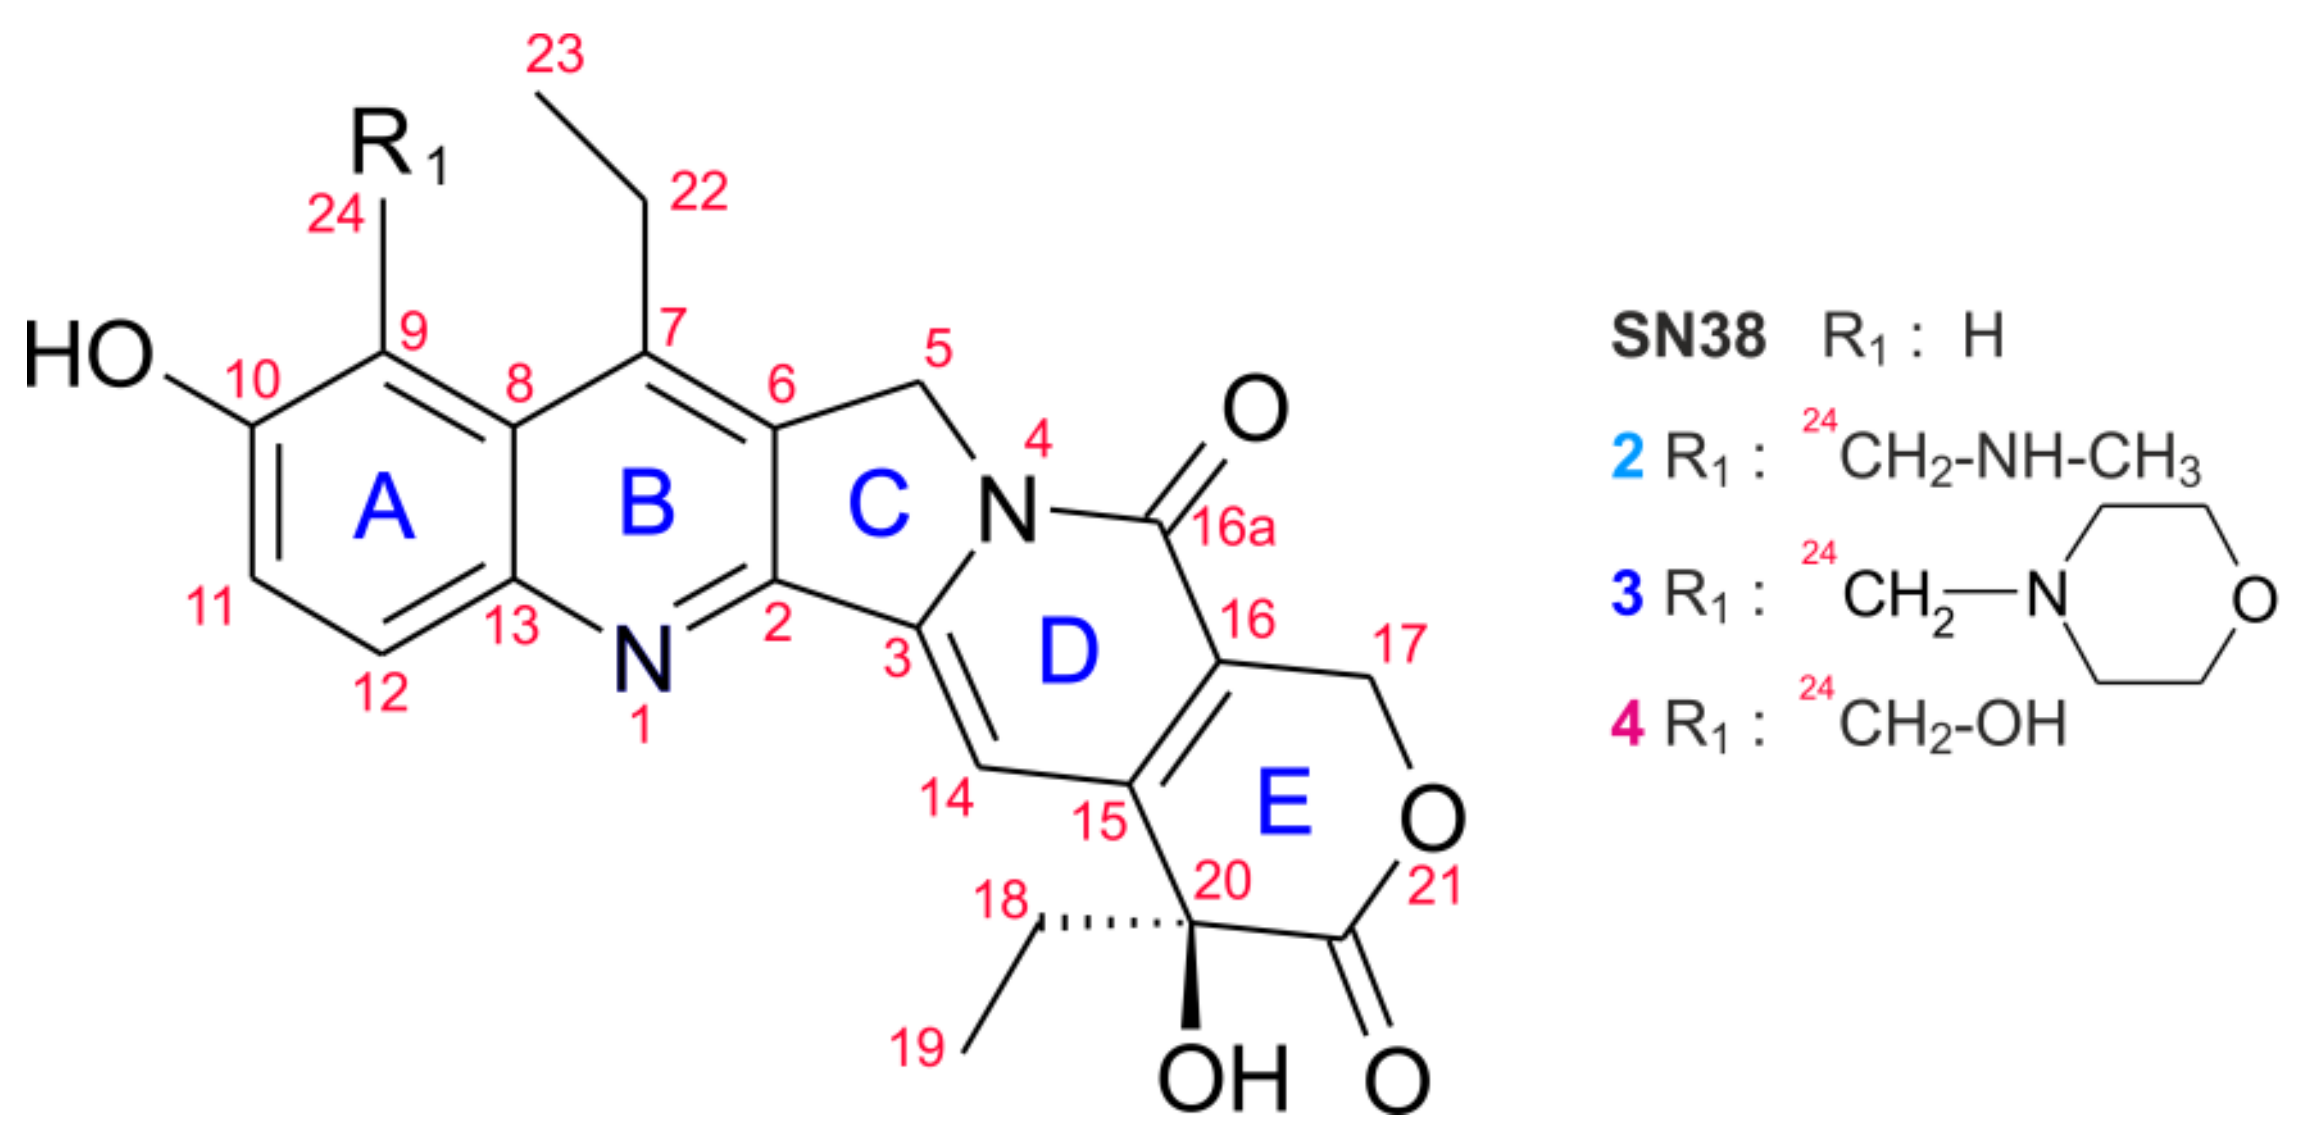
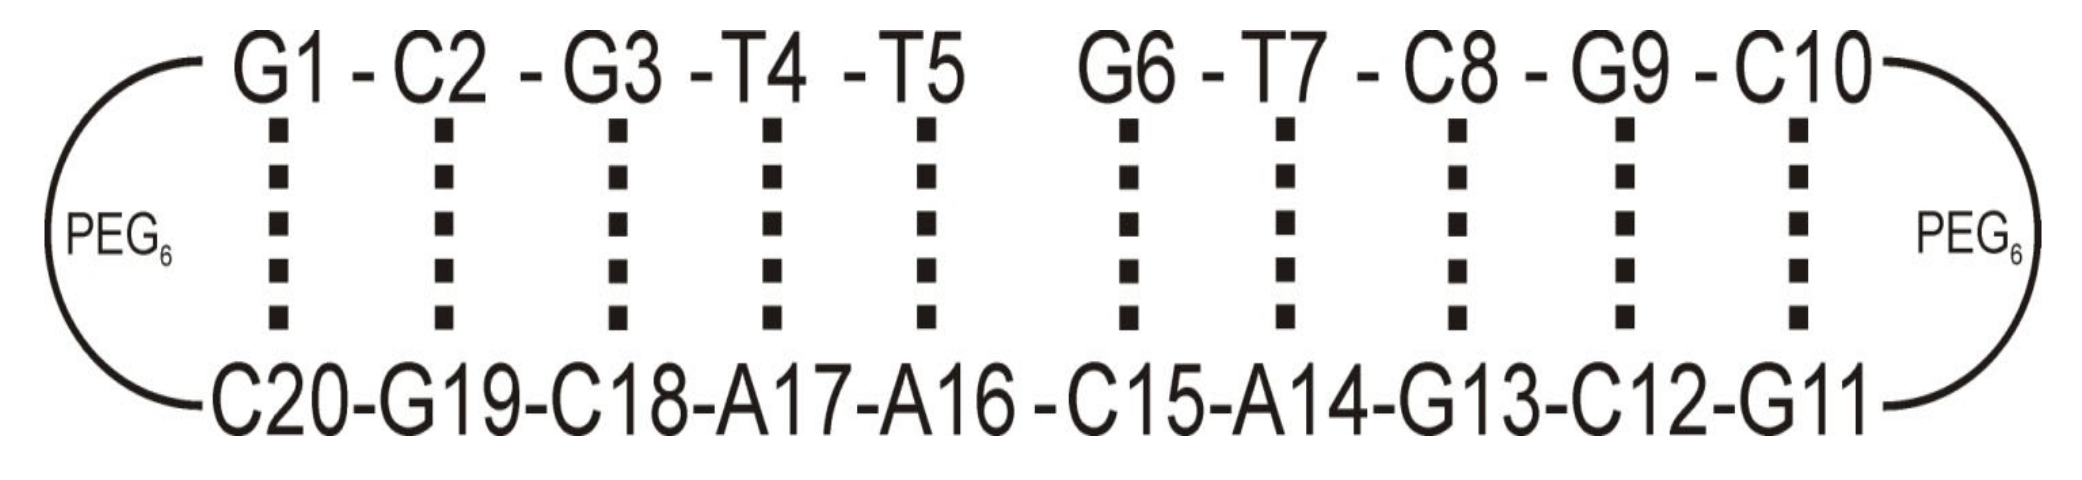
3.1. Chemical Substrates

The nicked decamer 1 was purchased from FutureSynthesis and purified by filtering on a membrane of 3 kDa. The compounds 2 (7-ethyl-9-(N-methylamino)methyl-10-hydroxycampthotecin) and 3 (7-ethyl-9-(N-morpholino)methyl-10-hydroxycampthotecin) were synthesized and purified as previously described [15]. The compounds enriched with 13C at the C-9 CH2 group were synthesized using the same prescription but using 13C-enriched formalin.

3.2. Sample Preparation
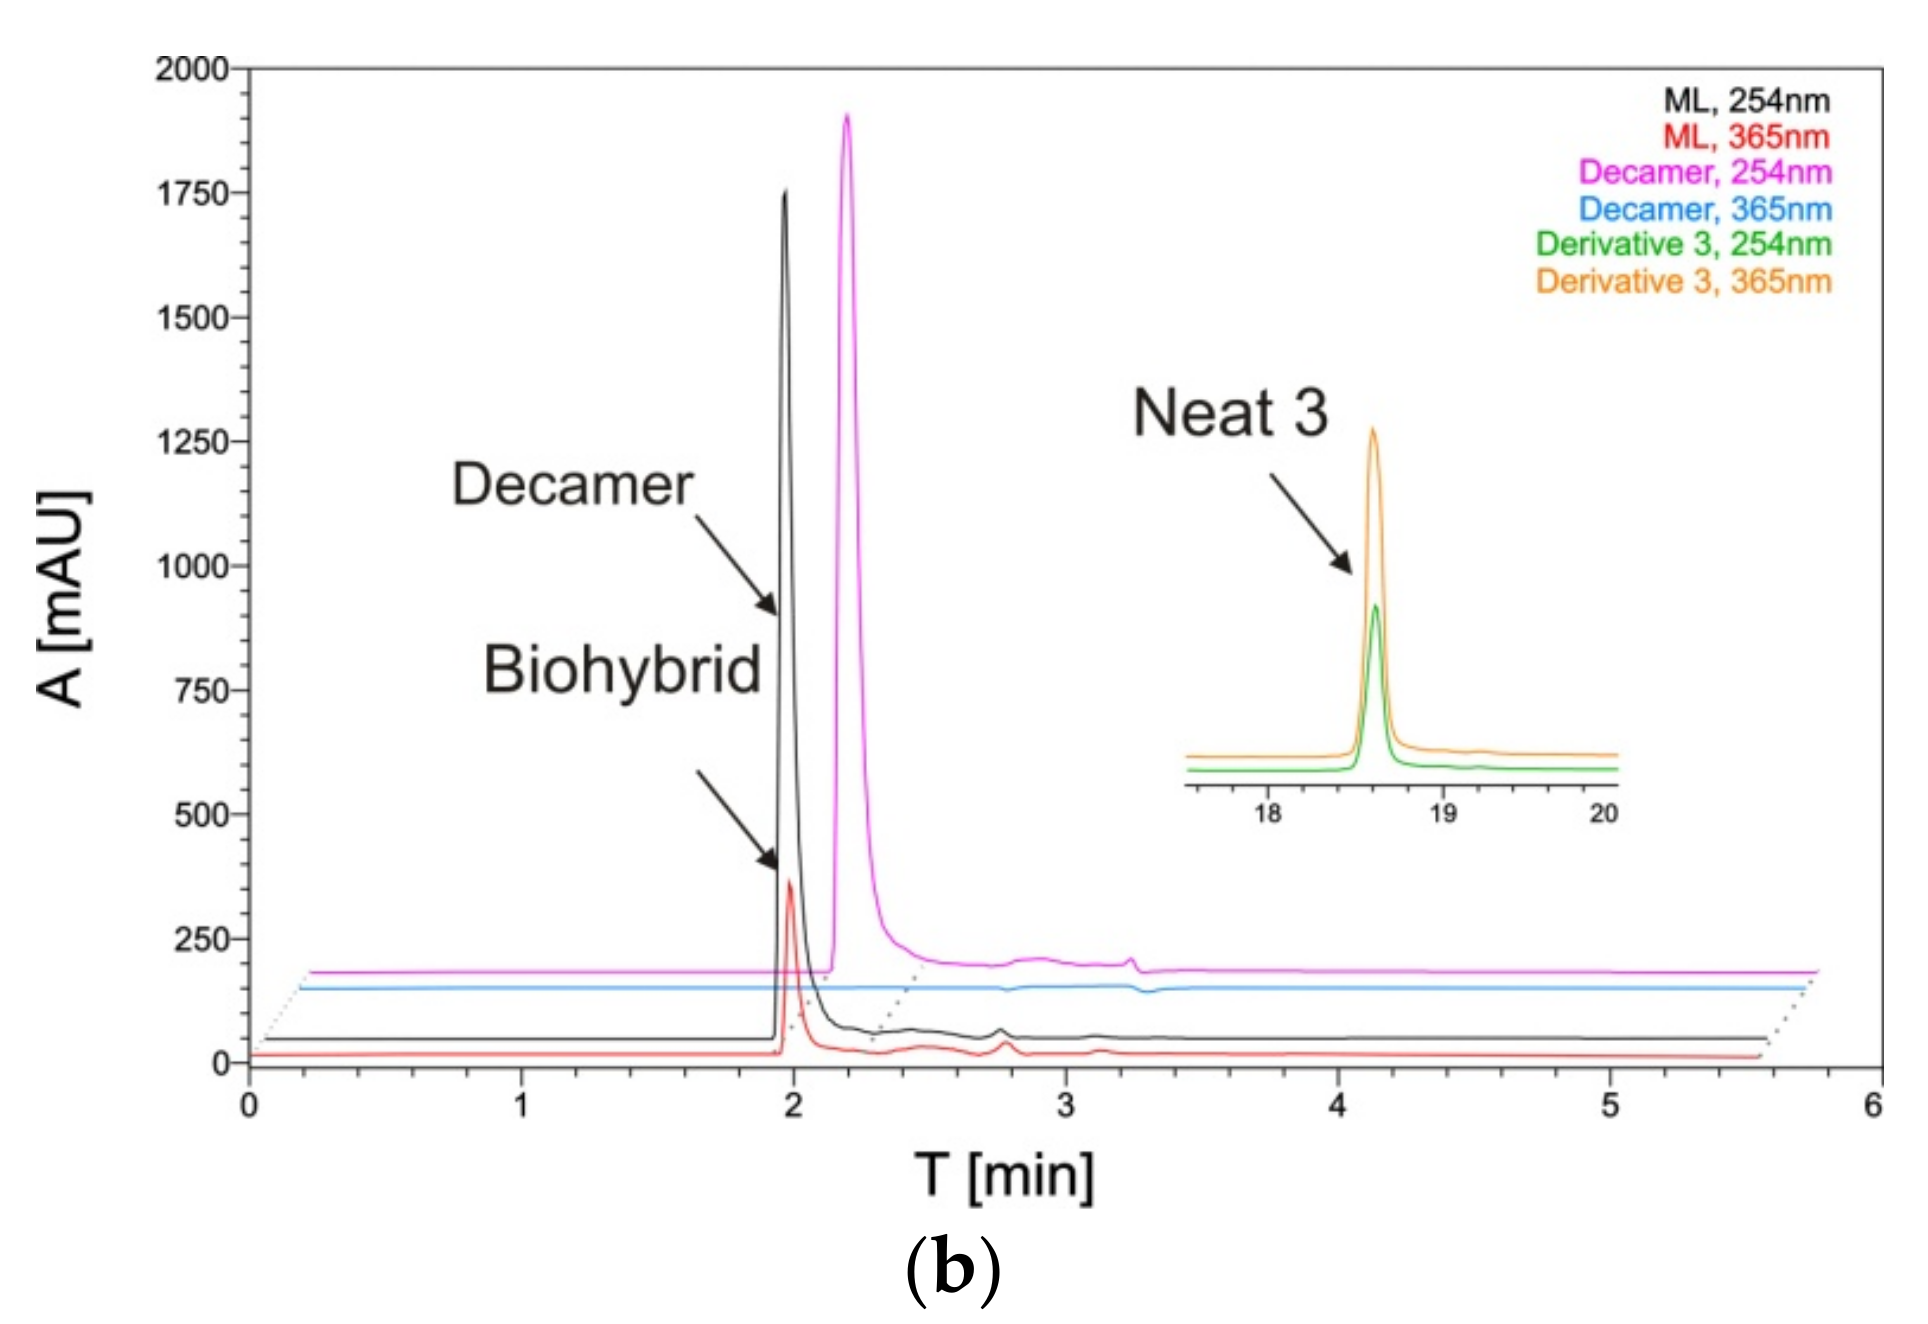
Intermolecular interactions were studied in NMR sample tubes of solutions as described below.
Sample 1 + 2: Decamer 1 (0.975 nmol dissolved in 650 µL in a buffer NaCl/K3PO4 25 mM each in D2O or H2O/D2O; 1:9) was dissolved and 2.925 nmol of derivative 2 (7-ethyl-9-(N-methylamino)methyl-10-hydroxycamptothecin was added as a solid and pH adjusted to 6.
Sample 1 + 3: Decamer 1 (0.900 nmol dissolved in 600 µL in a buffer NaCl/K3PO4 25 mM each in D2O or H2O/D2O; 1:9) was dissolved and 1.800 nmol of derivative 3 (7-ethyl-9-(N-morpholino)methyl-10-hydroxycamptothecin was added as a solid and pH adjusted to 6.

3.3. HPLC Analysis

HPLC analysis was performed using an HPLC system from Shimadzu USA Manufacturing Inc. (Canby, OR, USA) consisting of a low-pressure gradient flow LC-20AT pump, a DGU-20A online solvent degasser, an SPD-M20A photodiode array detector, an SIL-10AF sample injector, and an FRC-10A fraction collector. Data were monitored using a Shimadzu LabSolution system. The analysis was carried out a Phenomenex Gemini 5 µm NX-C18 110 Å, 250 mm × 4.6 mm (or Phenomenex Gemini 5 µm NX-C18 110 Å, 250 mm × 10 mm) column, with the following mobile phases: (A) 10 mM NH4COOH aqueous solution, pH = 6; (B) MeCN with a gradient of 5–30% for 0–15 min, 30–50% for 15–20 min, and 50% after 20 min. The flow rate of the mobile phase: 1 mL/min (or 3 mL/min). The course of the chromatography was monitored using UV detection at a wavelengths of 260–365 nm.

3.4. NMR Experiments

NMR spectra were recorded at 298 K on a Varian VNMRS-500 spectrometer equipped with a 5 mm Z-SPEC Nalorac IDG 500-5HT gradient probe. The experiments were performed in buffer solution (25 mM NaCl/25 mM K3PO4 in D2O). The spectra were referenced in D2O against TSPA-d4. Standard pulse sequences were used.
The experiments were performed under the following conditions:
TOCSY—spectral widths 5000 Hz in both dimensions, 750 complex points in t2, 512 complex points in t1, 64 scans per increment, 1 s relaxation delay, and 80 ms spin-lock time.
NOESY—spectral widths of 5000 Hz in both dimensions, 1024 complex points in t2, 512 complex points in t1, 64 scans per increment, 1 s relaxation delay, and 200 ms mixing time.
HSQC—spectral widths 8000 Hz in F2 and 22,600 Hz in F1, 1202 complex points in t2, 256 complex points in t1, 4 scans per increment, and 1 s relaxation delay.
Oneshot [29] DOSY spectra—1024 transients, 16 dummy scans, diffusion time (Δ) 150–220 ms, total diffusion encoding gradient duration (δ) 2 ms, and 16 values of the diffusion-encoding gradient incremented from 6 to 50 G/cm in such steps that the strength of the next gradient was equal to the previous gradient squared. Processing was carried out using the VARIAN VNMRJ software with the option of correction for spatially non-uniform pulsed field gradients.

3.5. ESI–MS Experiments

High-resolution ESI–MS spectra were acquired using an ultra-performance liquid chromatograph ACQUITY UPLC I-Class (Waters, Milford, MA, USA) coupled with a Synapt G2-S HDMS (Waters, Milford, MA, USA) mass spectrometer equipped with an electrospray ion source and q-TOF type mass analyzer. The instrument was controlled, and recorded data were processed using MassLynx V4.1 software package (Waters, Milford, MA, USA). The electrospray ionization–mass spectrometry (ESI–MS) spectra were recorded in the positive and negative ion mode in the m/z range 50–3000.

3.6. MALDI–MS Experiments

Mass spectra were acquired in negative or positive reflector mode on Applied Biosystems/MDS SCIEX MALDI 4800 Plus TOF/TOF spectrometer. Analyte ionization was achieved with a 355 nm Nd:YAG laser firing at 200 Hz rate. Laser fluence was within the 6000–6900 AU range. The analyzer was operated in delayed extraction mode from 250 to 650 ns. Typically, 1000 laser shots were accumulated. The raw spectrum was analyzed and edited (Gaussian smoothing, filter width: 99 points) using Data Explorer software, Applied Biosystems.

3.7. MALDI Sample Preparation

Solid sample (ca. 0.2 mg) was dissolved in water (ca. 20 μL) to reach the final concentration of about 10 mg/mL. A series of dilutions (with matrix solution) was then prepared: 1:1, 1:5, 1:10, 1:50 (v/v) ratio. As a matrix, a freshly prepared mixture of diammonium hydrogen citrate solution (50 mg/mL in water) and 3-hydroxypicolinic acid (50 mg/mL in acetonitrile/water 50:50 v/v) at a 1:8 v/v ratio was used. Aliquots (0.5 μL) of sample solutions were deposited on a stainless steel MALDI target plate and allowed to dry.

3.8. Calculating Binding Constants from the Diffusion Coefficients

The binding constants (Ka) of the complexes were estimated by the analysis of the diffusion coefficient of DNA (1), ligand (compound 2), and DNA–ligand complex as a function of the host and guest concentration [30] according to Equations (1) and (2):
DNA + L   DNA · L
K a = DNA · L DNA L  
In the case in which the exchange rate between the uncomplexed and complexed species was fast on the NMR timescale, the observed diffusion coefficients (D, (m2 s−1)) are a weighted average of the diffusion coefficients of the uncomplexed and complexed forms, where the weighting factors are the relative population sizes of the respective forms. Thus, the observed diffusion coefficients may be expressed as
D OBS L = MF L D L + 1 MF L D DNA · L
D OBS DNA = MF DNA D DNA + 1 MF DNA D DNA · L
where DOBS-L and DOBS-DNA are the observed averaged diffusion coefficients for L and DNA; DL and DDNA are the diffusion coefficients for uncomplexed L and uncomplexed DNA; MFL and MFDNA are the molar fractions of uncomplexed L and uncomplexed DNA in the solution containing both molecules; and D[DNA·L] is the diffusion coefficient for the complex.
The Ka can be also expressed as
K a = DNA · L C DNA DAN · L C L DNA · L
where CDNA and CL are the initial concentrations of DNA and L.
The unknown complex concentration can be calculated from equations:
DNA · L = 1 MF DNA C DNA  
DNA · L = 1 MF L C L
In the case in which the host molecule is much larger than the guest, it can be assumed that the diffusion coefficient of the host–guest complex is the same as that of the host molecule:
D D N A · L D O B S D N A
By combining Equations (3), (5), (7), and (8), Ka can be determined.

3.9. Molecular Dynamics Calculations

The modified DNA decamer structure previously established by us [13] (PDB ID: 1G1N) was used as the model structure for our DNA receptor. The SN38 derivative 2 compound was manually docked to the nick in this receptor in all four possible stacking orientations. Additionally, the two starting orientations of the bulky substituents of SN38 derivative 1 (9-CH2–NH–CH3 and 7-Et) relative to the remainder of SN38 derivative 2 compound were taken into consideration. This yielded a total of eight systems, which were then subjected to molecular dynamics (MD) calculations. Then, the trajectories—doubled due to the starting orientation of the substituents—were combined into one, which resulted in four distinct structures. All MD calculations were carried out using the AMBER 14 suite of programs [31]. The electrostatic potential (ESP) charges were obtained for both the SN38 derivative 2 compound and DNA linkers by the HF/6-31G* calculations using the Gaussian 09 program [32]. The RESP charges were then calculated by charge fitting with the multi-conformational procedure of the antechamber module implemented in Amber. The missing GAFF force field parameters were obtained using the parmchk module. Each complex was neutralized by adding Na+ cations, and then solvated by TIP3 water molecules with a spacing distance of about 12 Å around the system surface, creating a periodic box. All complexes were subjected to molecular dynamics (MD) simulations using the pmemd.cuda Amber 14 module with the NVIDIA GPU acceleration and mixed ff12SB-GAFF force field. The particle mesh Ewald (PME) method was used to treat long-range electrostatic interactions, and a 10 Å cutoff was applied to the nonbonded Lennard–Jones interactions. The SHAKE algorithm was applied to constrain all bonds involving hydrogen atoms and a 2 fs time step was used in the dynamics simulation. First, the systems were minimized in two stages: the first stage restrained the atomic positions of the solute and only relaxed the water, and the second stage released the restraint and allowed all atoms to relax (both with 10,000 minimization steps). The systems were then slowly heated to 300 K using an NVT ensemble and 1,000,000 steps with the Langevin dynamics temperature control (gamma_ln = 1.0). Then, the systems were carefully equilibrated at NPT ensemble simulations at 1 bar pressure with gamma_ln = 5.0. The equilibrations lasted until the system reached a converged density value, usually for 10–20 ns. Finally, the NPT production molecular dynamics were run for each of 8 trajectories for 500 ns of simulations. The trajectories with the only difference in orientations of the bulky substituents of SN38 derivative 2 were combined, and the four obtained trajectories corresponding to structures 1–4 were used for further calculations and analysis.

3.9.1. Calculating Binding Free Energies (Enthalpies) Using MM-PBSA and MM-GBSA Methods

The combined MD trajectories were uniformly sampled, yielding 50,000 samples for each structure 1–4. The water and Na+ cations were stripped, and the binding free energies (enthalpies) were calculated using MM-PBSA and MM-GBSA methods [33] according to the following equations:
ΔG°Bind,Solv = ΔG°Bind,Vacuum + ΔG°Solv,Complex − (ΔG°Solv,Ligand + ΔG°Solv,Receptor)
Solvation free energies were calculated by either solving the linearized Poisson–Boltzmann or generalized Born equation for each of the three states (this provides the electrostatic contribution to the solvation free energy) and adding an empirical term for hydrophobic contributions:
ΔG°Solv = ΔG°electrostatic,ϵ = 80 − ΔG°electrostatic,ϵ = 1 + ΔG°hydrophobic
ΔG°Vacuum was obtained by calculating the average interaction energy between receptor and ligand, and taking the entropy change upon binding into account.
ΔG°Vacuum = ΔE°MM − TΔS°
where G°Bind,Solv is the free energy of binding of solvated molecules; G°Bind,Vacuum is the binding free energy in vacuum; G°Solv,Complex, G°Solv,Ligand, and G°Solv,Receptor are the solvation free energy for complex, ligand, and receptor molecules; G°Electrostatic is the electrostatic solvation free energy; G°Hydrophobic is the hydrophobic (nonpolar) solvation free energy; E°MM is the molecular mechanic energy; T is the temperature; and S° is the entropy.
The entropy contribution in our calculations was neglected because of the comparison of states of similar entropy. All free energy calculations were carried out using the mm_pbsa.pl script from AmberTools.

3.9.2. PM7 Semi-Empirical Calculations

The combined MD trajectories were uniformly sampled to yield 5000 structures for each structure 1–4. The water and Na+ cations were stripped, the DNA was shortened to one GC, and one TA base pair complexed with a SN38 derivative on both sides, respectively. The remaining DNA base pairs were capped from the cut side with the phosphorane groups. The structures thus prepared were energy minimized with the PM7 method using the MOPAC2016 program [34]. The water solvent was approximated with the COSMO model [35].

3.9.3. Cluster Analysis

The CPPTRAJ module implemented in the Amber package was used for cluster analysis. During cluster analysis, similar conformations were identified and grouped together. The cluster analyses were performed for structures used in PBSA/GBSA calculations and for structures from PM7 energy minimizations. During clustering analysis, the k-means clustering algorithm was used. The RMSD of heavy atoms was used as a distance metric calculated only for the SN38 derivative and the neighboring two DNA base pairs in each side for the structures from PBSA/GBSA calculations and one DNA base pair for structures from PM7 calculations. The clustering procedure was repeated several times, and each time the low-population strange structures were gradually removed. Finally, for each system, the most populated clusters were obtained. For each cluster, the average energies were calculated (PBSA/GBSA or PM7) and the most representative structures were determined.

3.10. The Topo I Relaxation Activity Assay

The inhibition of topoisomerase I relaxation activity was tested in triplicate with Human Topoisomerase I Relaxation High Throughput Plate Assay (Inspiralis Ltd., Norwich, UK) according to Vendor’s Protocol. Briefly, the test was based upon the measurement of fluorescence of DNA stain which can differentiate between supercoiled and relaxed DNA. The inhibition of human Topo I relaxation activity was measured in assay mixture containing Topo I and supercoiled DNA substrate (plasmid pNO1). At the first step—the activity of Topo I—the amount of enzyme needed to fully relax the plasmid was determined. Then, for this specific amount of enzyme. the relaxation inhibition potency of the studied compound was tested. The increasing amounts of compounds (2–100 µM) were added to the reaction mixture together with the positive control and reference standard: camptothecin and SN38, respectively. The fluorescence of DNA plasmid stained with Diamond™ Nucleic Acid Dye (Promega, Madison, WI, USA) was read in fluorescence plate reader (495 nm/537 nm) [36,37].

4. Conclusions

It can be concluded that both parent compounds 2 and 3 yield some alkylated DNA. Compound 2 forms mainly a very stable and strong molecular complex with 1, whereas compound 3 more readily undergoes hydrolysis and retro-Mannich reaction to yield compound 4 and SN38 (Scheme 3). It is worth mentioning that both phenomena, alkylation and strong intercalation inside the nick, can play an important, cooperative role in Topo I inactivation. The alkylation of bases in a nick eliminates the tumor DNA from further proliferation because it poisons the role of Topo I, i.e., the relegation of a broken strand in a duplex DNA by trapping a cleavable complex. In addition, the strong molecular complex of 2–4 and SN38, simultaneously and in a complementary fashion, can prolong the lifetime of a ternary complex Topo I/nicked DNA/inhibitor and prevent the restoration of the double-stranded unstrained DNA. The most important information resulting from this discussion concerning the safety of eventual chemotherapy using the studied compounds as potential medicines in vivo is the lack of SN38 in the interaction of 2 with the nicked DNA as a model of the biological target of Topo I poisons. It is well recognized that the toxicity of SN38—as the main metabolite of Irinotecan, which is currently used in clinics—is a cause of lethal diarrhea [38].
The molecular modeling based on cross-peaks in the NOESY spectrum allows the geometry of molecular complex 1 + 2 to be assigned. The results indicate the two possible complexes inside the nick (structures 1 and 3). Both face the unbroken strand with ring A and are equally included inside the interior of the nick. These results provide plausible support to the suggestions derived from the experiments. The geometry of structure 1 is also comparable with the X-ray structure of the ternary complex Topo I/DNA/TPT. Considering the promising results concerning the role of the studied compounds in interaction with the biological target of Topo I interfacial inhibitors, the studied compounds can be considered to be potential Topo I poisons for safe targeted chemotherapy, and further research for the development of both compounds is planned.
In order to confirm the influence of studied compounds on the topoisomerase I relaxation activity of supercoiled DNA, we performed the test based upon the measurement of fluorescence of DNA stain which can differentiate between supercoiled and relaxed DNA. The presented results confirmed that studied SN38 derivatives effectively block DNA relaxation mediated by Topo I, which means that they stop the machinery of Topo I activity.

Supplementary Materials

The following are available online at https://0-www-mdpi-com.brum.beds.ac.uk/article/10.3390/ijms22147471/s1. Figure S1: The 1H NMR spectrum of nicked decamer 1; Figure S2: The 1H NMR spectrum of 2; Figure S3a,b: The 1H NMR spectrum of 3 and 4; Figures S4 and S5: DOSY spectrum of compounds 1 and 2; Figure S6a,b: DOSY spectrum of compounds 1 and 3; Figure S7: NMR spectrum of reaction mixture of 2 with 1; Table S1: The 1H NMR chemical shifts of DNA 1 with 2; Table S2: Chemical shifts changes of DNA decamer; Figures S8 and 8a: NOESY spectrum and cross-peaks in complex 1 + 2; Figure S9: NOESY spectrum of the sample 1 + 3; Figure S10: The example of the cross-peaks in sample 1 + 3; Figures S11 and S12: The best structure from modeling showing potential sites of hybrid formation in a molecular complex 1 + 2; Table S3: The most populated cluster energy from PBSA and GBSA analysis; Table S4: The real hydrogen bonds in 1 + 2 complex from PM7 calculations; Figure S13: The hydrogen bonding in structures best representing the most populated cluster in a complex 1 + 2; Figure S14: The MALDI–MS spectrum of ML 1 + 2; Figure S15: HPLC chromatograms for reaction 1 + 3; Figure S16a,b: The MALDI–MS spectrum of the ML from reaction 1 + 3.

Author Contributions

Conceptualization, W.B., L.K., and B.N.; methodology, W.B. and B.N.; formal analysis, E.B., W.B., L.K., B.N., J.S, K.W., M.M., and M.U.; investigation, E.B., W.B., L.K., B.N., J.S., K.W., M.M., and M.U.; resources, B.N. and M.U.; data curation, W.B., A.B.-K., B.N., M.M., K.W., and J.S.; writing—original draft preparation, W.B. and B.N.; writing—review and editing, E.B., W.B., L.K., B.N., J.S., K.W., and M.U.; visualization, W.B., B.N., and M.U.; supervision, L.K., and B.N.; project administration, W.B., L.K., and B.N.; funding acquisition, L.K. All authors have read and agreed to the published version of the manuscript.

Funding

The research was funded by National Research Centre grant number 2017/27/B/ST4/00190 and 2018/31/B/NZ7/02675.

Data Availability Statement

The authors confirm that the data supporting the findings of this study are available within the article and its Supplementary Materials.

Conflicts of Interest

The authors declare no conflict of interest.

References

  1. Pourquier, P.; Pommier, Y. Topoisomerase I-mediated DNA damage. Adv. Cancer Res. 2001, 80, 189–216. [Google Scholar]
  2. Stewart, L.; Redinbo, M.R.; Qiu, X.; Hol, W.G.; Champoux, J.J. A model for the mechanism of human topoisomerase I. Science 1998, 279, 1534–1541. [Google Scholar] [CrossRef]
  3. Pommier, Y. DNA topoisomerase I inhibitors: Chemistry, biology, and interfacial inhibition. Chem. Rev. 2009, 109, 2894–2902. [Google Scholar] [CrossRef] [Green Version]
  4. Dallavalle, S.; Merlini, L. Camptothecin and Analogs: Structure and Synthetic Efforts. In Modern Alkaloids; Fattorusso, E., Taglialatela-Scafati, O., Eds.; Wiley: Hoboken, NJ, USA, 2007; pp. 503–520. [Google Scholar]
  5. Bocian, W.; Kawęcki, R.; Bednarek, E.; Sitkowski, J.; Williamson, M.P.; Hansen, P.E.; Kozerski, L. Binding of Topotecan to a Nicked DNA Oligomer in Solution. Chem. A Eur. J. 2008, 14, 2788–2794. [Google Scholar] [CrossRef]
  6. Reedijk, J. Why does Cisplatin reach Guanine-n7 with competing s-donor ligands available in the cell? Chem. Rev. 1999, 99, 2499–2510. [Google Scholar] [CrossRef] [PubMed]
  7. Pande, P.; Shearer, J.; Yang, J.; Greenberg, W.A.; Rokita, S.E. Alkylation of Nucleic Acids by a Model Quinone Methide. J. Am. Chem. Soc. 1999, 121, 6773–6779. [Google Scholar] [CrossRef]
  8. Pommier, Y.; Kohlhagen, G.; Kohn, K.W.; Leteurtre, F.; Wani, M.C.; Wall, M.E. Interaction of an alkylating camptothecin derivative with a DNA base at topoisomerase I-DNA cleavage sites. Proc. Natl. Acad. Sci. USA 1995, 92, 8861–8865. [Google Scholar] [CrossRef] [Green Version]
  9. Veldhuyzen, W.F.; Lam, Y.F.; Rokita, S.E. 2′-Deoxyguanosine reacts with a model quinone methide at multiple sites. Chem. Res. Toxicol. 2001, 14, 1345–1351. [Google Scholar] [CrossRef]
  10. Wang, H.; Wahi, M.S.; Rokita, S.E. Immortalizing a transient electrophile for DNA cross-linking. Angew. Chem. Int. Ed. Engl. 2008, 47, 1291–1293. [Google Scholar] [CrossRef]
  11. Svoboda, J.; Konig, B. Templated photochemistry: Toward catalysts enhancing the efficiency and selectivity of photoreactions in homogeneous solutions. Chem. Rev. 2006, 106, 5413–5430. [Google Scholar] [CrossRef]
  12. Bocian, W.; Kawęcki, R.; Bednarek, E.; Sitkowski, J.; Pietrzyk, A.; Williamson, M.P.; Hansen, P.E.; Kozerski, L. Multiple binding modes of the camptothecin family to DNA oligomers. Chem. Eur. J. 2004, 10, 5776–5787. [Google Scholar] [CrossRef]
  13. Kozerski, L.; Mazurek, A.P.; Kawęcki, R.; Bocian, W.; Krajewski, P.; Bednarek, E.; Sitkowski, J.; Williamson, M.P.; Moir, A.J.; Hansen, P.E. A nicked duplex decamer DNA with a PEG(6) tether. Nucleic Acids Res 2001, 29, 1132–1143. [Google Scholar] [CrossRef] [Green Version]
  14. Naumczuk, B.; Hyz, K.; Kawęcki, R.; Bocian, W.; Bednarek, E.; Sitkowski, J.; Wielgus, E.; Kozerski, L. DOSY NMR and MALDI-TOF evidence of covalent binding the DNA duplex by trimethylammonium salts of topotecan upon near UV irradiation. Magn. Reson. Chem. 2015, 53, 565–571. [Google Scholar] [CrossRef]
  15. Kozerski, L.; Kawęcki, R.; Naumczuk, B.; Hyz, K.; Bocian, W.; Bednarek, E.; Sitkowski, J.; Wiktorska, K.; Lubelska, K. Derivatives of Camptothecin, A Method of Producing Them and Their Use. WO 2014/064654 A1, 1 May 2014. [Google Scholar]
  16. Naumczuk, B.; Kawęcki, R.; Bocian, W.; Bednarek, E.; Sitkowski, J.; Kozerski, L. Preliminary study of mechanism of action of SN38 derivatives. Physicochemical data, evidence of interaction and alkylation of DNA octamer d(GCGATCGC)2. Magn. Reson. Chem. 2017, 55, 128–136. [Google Scholar] [CrossRef] [PubMed]
  17. Naumczuk, B.; Wiktorska, K.; Lubelska, K.; Kawęcki, R.; Bocian, W.; Bednarek, E.; Sitkowski, J.; Chilmonczyk, Z.; Kozerski, L. New generation of camptothecin derivatives spontaneously alkylating DNA. New J. Chem. 2016, 40, 7978–7985. [Google Scholar] [CrossRef]
  18. Naumczuk, B.; Kawęcki, R.; Sitkowski, J.; Bocian, W.; Bednarek, E.; Kozerski, L. Spontaneous 2′-deoxyguanosine alkylation by a new generation of topoisomerase I inhibitors of the camptothecin family. New J. Chem. 2016, 40, 3010–3013. [Google Scholar] [CrossRef]
  19. Naumczuk, B.; Kawęcki, R.; Bocian, W.; Bednarek, E.; Sitkowski, J.; Kozerski, L. Regioselective alkylation reaction of the 2′deoxycitidine with 9-aminomethyl derivatives of SN38. J. Mol. Struct. 2019, 1176, 298–302. [Google Scholar] [CrossRef]
  20. Naumczuk, B.; Bocian, W.; Sitkowski, J.; Kawęcki, R.; Kozerski, L. Solvent-dependent regioselectivity of 2′-deoxyadenosine alkylation by 9-aminomethyl derivatives of SN38. New J. Chem. 2019, 43, 18975–18978. [Google Scholar] [CrossRef]
  21. Rivory, L.P.; Robert, J. Pharmacology of camptothecin and its derivatives. Bull. Cancer 1995, 82, 265–285. [Google Scholar]
  22. Pommier, Y.; Marchand, C. Interfacial inhibitors: Targeting macromolecular complexes. Nat. Rev. Drug Discov. 2011, 11, 25–36. [Google Scholar] [CrossRef]
  23. Coletta, A.; Desideri, A. Role of the protein in the DNA sequence specificity of the cleavage site stabilized by the camptothecin topoisomerase IB inhibitor: A metadynamics study. Nucleic Acids Res. 2013, 41, 9977–9986. [Google Scholar] [CrossRef]
  24. Antałek, B. Accounting for spin relaxation in quantitative pulse gradient spin echo NMR mixture analysis. J. Am. Chem. Soc. 2006, 128, 8402–8403. [Google Scholar] [CrossRef]
  25. Antałek, B. Using Pulsed Gradient Spin Echo NMR for Chemical Mixture Analysis: How to Obtain Optimum Results. Concepts Magn. Reson. 2002, 14, 225–258. [Google Scholar] [CrossRef]
  26. Staker, B.L.; Hjerrild, K.; Feese, M.D.; Behnke, C.A.; Burgin, A.B., Jr.; Stewart, L. The mechanism of topoisomerase I poisoning by a camptothecin analog. Proc. Natl. Acad. Sci. USA 2002, 99, 15387–15392. [Google Scholar] [CrossRef] [Green Version]
  27. Laco, G.S.; Collins, J.R.; Luke, B.T.; Kroth, H.; Sayer, J.M.; Jerina, D.M.; Pommier, Y. Human topoisomerase I inhibition: Docking camptothecin and derivatives into a structure-based active site model. Biochemistry 2002, 41, 1428–1435. [Google Scholar] [CrossRef]
  28. Fan, Y.; Weinstein, J.N.; Kohn, K.W.; Shi, L.M.; Pommier, Y. Molecular modeling studies of the DNA-topoisomerase I ternary cleavable complex with camptothecin. J. Med. Chem. 1998, 41, 2216–2226. [Google Scholar] [CrossRef]
  29. Pelta, M.D.; Morris, G.A.; Stchedroff, M.J.; Hammond, S.J. A one-shot sequence for high-resolution diffusion-ordered spectroscopy. Magn. Reson. Chem. 2002, 40, S147–S152. [Google Scholar] [CrossRef]
  30. Waldeck, A.R.; Kuchel, P.W.; Lennon, A.J.; Chapman, B.E. NMR diffusion measurements to characterise membrane transport and solute binding. Prog. Nucl. Magn. Reson. Spectrosc. 1997, 30, 39–68. [Google Scholar] [CrossRef]
  31. Case, D.A.; Berryman, J.T.; Betz, R.M.; Cerutti, D.S.; Cheatham, T.E., III; Darden, T.A.; Duke, R.E.; Giese, T.J.; Gohlke, H.; Goetz, A.W.; et al. AMBER 2015; University of California: San Francisco, CA, USA, 2015. [Google Scholar]
  32. Frisch, M.J.; Trucks, G.W.; Schlegel, H.B.; Scuseria, G.E.; Robb, M.A.; Cheeseman, J.R.; Scalmani, G.; Barone, V.; Mennucci, B.; Petersson, G.A.; et al. Gaussian 09, Revision A.01; MGaussian, Inc.: Wallingford, CT, USA, 2009. [Google Scholar]
  33. Luo, R.; David, L.; Gilson, M.K. Accelerated Poisson-Boltzmann calculations for static and dynamic systems. J. Comput. Chem. 2002, 23, 1244–1253. [Google Scholar] [CrossRef] [PubMed]
  34. Stewart, J. MOPAC2016, Version: 17181L. Available online: http://OpenMOPAC.net (accessed on 5 April 2021).
  35. Klamt, A.; Schuurmann, G. Cosmo—A New Approach to Dielectric Screening in Solvents with Explicit Expressions for the Screening Energy and Its Gradient. J. Chem. Soc. Perkin Trans. 1993, 2, 799–805. [Google Scholar] [CrossRef]
  36. Maxwell, A.; Burton, N.P.; O’Hagan, N. High-throughput assays for DNA gyrase and other topoisomerases. Nucleic Acids Res. 2006, 34, e104. [Google Scholar] [CrossRef] [Green Version]
  37. Seol, Y.; Zhang, H.; Agama, K.; Lorence, N.; Pommier, Y.; Neuman, K.C. Single-Molecule Supercoil Relaxation Assay as a Screening Tool to Determine the Mechanism and Efficacy of Human Topoisomerase IB Inhibitors. Mol. Cancer 2015, 14, 2552–2559. [Google Scholar] [CrossRef] [PubMed] [Green Version]
  38. Mathijssen, R.H.; van Alphen, R.J.; Verweij, J.; Loos, W.J.; Nooter, K.; Stoter, G.; Sparreboom, A. Clinical pharmacokinetics and metabolism of irinotecan (CPT-11). Clin. Cancer Res. 2001, 7, 2182–2194. [Google Scholar]
Scheme 1. The structure of SN38 and derivatives 2–4.
Ijms 22 07471 sch001
Scheme 2. Schematic representation of the biological target in the nicked DNA duplex in a model decamer with a PEG(6) tether at both ends of the duplex (Supplementary Materials Figure S1). The GC base pair on the right side of the nick (GC side) in nicked DNA portrays the nick environment in wild-type DNA.
Ijms 22 07471 sch002
Figure 1. The list of NOE cross-peaks found for molecular complex 1 + 2 and the part of the NOESY spectrum representing the intermolecular cross-peaks between 19-CH3 group in 2 and DNA bases in the nick of 1 (Figures S8 and S8a). For the NOESY and intermolecular cross-peaks in a complex 1 + 3, see Figures S9 and S10.
Ijms 22 07471 g001
Figure 2. Molecular view of the most probable geometry of complex 1 + 2. Structure 1 is from MD trajectories (Figure S11). The N–CH3 group is pointing towards a major groove. The left panel shows internuclear contacts for possible hybrid formation. The center panel shows possible hydrogen bond network stabilizing the structure (see Figure S13 and Table S4 for internuclear distances and assignments). For clarity, only two base pairs flanking the nick are shown. Right panel shows the fragment from X-ray complex of nicked 20-mer nicked DNA with topotecan (RCSB PDB:1K4T). [26].
Ijms 22 07471 g002
Figure 3. Molecular view of the second probable geometry of a complex 1 + 2. Structure 3 from MD trajectories (Figure S12). The molecule of 2 is turned over by 180° with respect to structure 1. The N–CH3 group is pointing into a minor groove. The left panel shows internuclear contact for possible hybrid formation. The right panel shows possible hydrogen bonds stabilizing the structure (see Figure S13 and Table S4 for internuclear distances and assignments).
Ijms 22 07471 g003
Figure 4. The ESI–MS spectrum (in the m/z range 300–500) of positive (upper trace) and negative ions (lower trace) of mother liquor of reaction 1 with 2.
Ijms 22 07471 g004
Scheme 3. Metabolites of parent compounds.
Ijms 22 07471 sch003
Figure 5. The part of the MALDI–MS spectrum of negative ions showing the mother peak for the neat parent nicked decamer, at m/z = 6885.8 ([M − H]), and a peak of the biohybrid of 2 with decamer 1 at m/z = 7290.9. The difference in masses M = 405 is due to transient intermediate o-methylene quinone formed from parent compound 2 or 3 [14].
Ijms 22 07471 g005
Figure 6. (a) The part of the DOSY spectrum of a 1:1 molar ratio of 1 and 3 in D2O buffer, pH 6, 25 °C in the mother liquor (ML) after filtration of the reaction mixture (Figure S6b). The diffusion coefficient Di, 1.0 ± 0.1 × 10⁻¹⁰ (m2 s-1) is equal for both components; (b) the part of the HPLC chromatogram run for the mother liquor as in DOSY, compared with neat decamer. The run monitored by 365 nm shows the same retention time of the compound bound to DNA. The inset shows the retention time for free compound 3.
Ijms 22 07471 g006aIjms 22 07471 g006b
Figure 7. The ESI–MS spectrum (in the m/z range 300–500) of negative ions of a mother liquor of 24-13C-enriched compound 3.
Ijms 22 07471 g007
Figure 8. Partial 1H/13C HSQC spectra for biohybrid 1 + 3 of the present study and alkylated model 2′-deoxynucleosides.
Ijms 22 07471 g008
Figure 9. The inhibition of human Topo I relaxation activity with regard to increasing concentrations of campthotecin (CPT), SN-38 and new Topo I poisons 2 and 3. The mean and SD are presented on a graph.
Ijms 22 07471 g009
Table 1. The diffusion constants Di × 10−10 (m2 s−1) and binding constant calculation of a complex 1 + 2 from the DOSY data.
SampleConcentration
(mM)
1 (T7-CH3) Integral2 (19-CH3) IntegralDi of 1
(10−10 m2 s−1)
Di of 2
(10−10 m2 s−−1)
Ka (mM−1)% of Complex
12
Complex of 1 + 2
after 5 days
1.5 a3.25 b36.51.1471.4754.0741% c
89% d
Compound 2-2.0---3.07--
Decamer 10.96---1.13---
a Concentration of 1 calculated from weighted amount (see experimental); b concentration of 2 calculated from the integral of 19-CH3 and T7-CH3 signals; c counted based on concentration of 2; and d counted based on concentration of 1.
Table 2. The 1H NMR chemical shift changes in SN38 derivative 2 after addition to DNA.
Compound 2Free; δ (ppm)Complex 1 + 2;
δ (ppm)
Δ (ppm)Δ (Hz)
19-CH30.960.9930.03316.5
23-CH31.501.377−0.123−61.5
18-CH21.951.908−0.042−21
N–CH32.822.8940.07437
22-CH23.092.911−0.179−89.5
24-CH24.544.512−0.028−14
24-CH24.624.512−0.108−54
5-CH25.024.65−0.370−185
17-CH25.365.259−0.101−50.5
17-CH25.515.259−0.251−125.5
14-CH7.187.041−0.139−69.5
11-CH7.327.081−0.239−119.5
12-CH7.717.333−0.377−188.5
Table 3. The 1H NMR chemical shifts δ (ppm) of changes between free DNA decamer and 2 after 4 days in D2O (1:2 ratio). * (Table S2).
BaseH1’H2’H2”H3’H4’H5’, H5”H6/8H2/5/Me
T4−0.008−0.026−0.0480.014−0.035-/−0.003−0.005−0.023
T50.0200.052−0.046−0.006−0.009−0.001/-0.067−0.012
nick--------------------------------------------------------------------------------------------
G6−0.342−0.284−0.0680.017−0.037−0.076/−0.2220.020-
T7−0.045−0.022−0.037−0.018−0.082-/0.013−0.204−0.025
A14−0.044−0.035−0.128−0.118−0.057-/-−0.093−0.058
C150.1700.010−0.199-0.021-/0.0000.027−0.245
A16−0.2300.024−0.093−0.0430.029-/-−0.224−0.204
A17−0.040−0.048−0.031−0.026−0.015-/0.073−0.069−0.081
* Bold is used to highlight the largest changes observed and red to highlight the protons involved in intermolecular cross-peaks.
Table 4. The analysis of measured distance statistics for selected protons in conformers recorded during MD trajectories for four possible structures with observed intermolecular NOE effects.
Deriv. 2DNA 1NOE (a)Structure 1 (b)Structure 2 (b)Structure 3 (b)Structure 4 (b)
<6Å<5Å<4Å<3Å<6Å<5Å<4Å<3Å<6Å<5Å<4Å<3Å<6Å<5Å<4Å<3Å
11C15H2”8.0%++++++++++++++ ++++++++*
12A16H88.4%+++++++++++ ++++
14A16H223.5%+++++++++++++++++ +++++++++++++
17aG6H1′11.0%+++++++++++++++ +
17b+++++++++++. ++++++*
17aG6H4′16.2%+++++++++++++++ ++.
17b+++++++++++++ ++++++++*
17aT5H1′6.9%+++++++* +*
17b++++++++++++ +
17aT5H2”14.8%+++++++++++ ++++++*
17b+++++++++++++++ ++++++++
17aT5H2′9.4%++++++++ +++++++++*
17b++++++++++++++ +++++++++
17aT5H64.7%+++++ ++++++++++
17b+++++++++++ ++++++++*
18G6H1’12.3%+++++++++++++* +*
18G6H2”9.1%+++++*
18G6H4′11.7%++++++++++ *
18T7H4′5.7%+++++++++* **
18T7H5”4.7%++++++++ *
18T7H5′11.5%+++++++++++++ **
19A16H22.3%+++* ++++++++++*
19G6H1′5.4%+++++++++* *
19G6H2”4.1%+++++*
19G6H4′7.9%+++++++++* *
19T7H4′12.1%+++++++++++++ **
19T7H5”5.7%+++++++++ **
19T7H5′10.9%+++++++++++++ **
24C15H55.7%+++++++++++
N–CH3C15H61.7%++* *
(a) Percentage of the intermolecular NOE effects measured by integrating the relative cross-peaks. between given protons compared to NOE between protons 11 and 12 of SN38 derivative 2. (b) ++++, +++, ++, +, and * indicate, respectively: >50%, >25%, >10%, >5%, and >1% (more than) MD sampled conformers for a given structure that meets the corresponding distance condition between indicated protons.
Table 5. The interatomic distances between atoms potentially interacting to form a hybrid (Figures S11 and S12).
Atom NamesAtom Distances in Structure 1 in (Å)
DNAComp. 2100% Cluster a50% Cluster a25% Cluster a
C15-N4-CH2NHCH37.23 ± 12.643.90 ± 0.333.62 ± 0.21
A16-N7-CH2NHCH37.53 ± 12.784.27 ± 0.324.01 ± 0.25
A16-N6-CH2NHCH38.47 ± 12.795.12 ± 0.494.75 ± 0.44
Atom Distances in Structure 3 in (Å)
G6-N2-CH2NHCH36.43 ± 10.884.03 ± 0.323.76 ± 0.21
A16-N3-CH2NHCH35.51 ± 10.653.37 ± 0.133.26 ± 0.09
a Represents the population of a cluster encompassing structures with shortest relevant distances between interacting atoms to form hybrid.
Table 6. The IC50 indices—the concentration required to reduce the relaxation Topo I activity by 50%.
IC50 (µM)
CPTSN3823
92.9 ± 16.140.3 ± 13.17100.7 ± 10.048.7 ± 8.2
Publisher’s Note: MDPI stays neutral with regard to jurisdictional claims in published maps and institutional affiliations.

