Article

Somatotroph Tumors and the Epigenetic Status of the GNAS Locus

1
Aix Marseille Univ, INSERM, APHM, MMG, UMR1251, Marmara Institute, La Conception, Hospital Laboratory of Molecular Biology, 13385 Marseille, France
2
Université Paris-Saclay, Inserm, Physiologie et Physiopathologie Endocriniennes, Assistance Publique-Hôpitaux de Paris, Hôpital Bicêtre, Service d’Endocrinologie et des Maladies de la Reproduction, Centre de Référence des Maladies Rares de l’Hypophyse, 94270 Le Kremlin-Bicêtre, Île-de-France, France
3
Medizinische Klinik und Poliklinik IV, LMU Klinikum, Ludwig Maximilian University Munich, 80336 Munich, Germany
4
APHM, La Conception Hospital, Laboratory of Molecular Biology, 13385 Marseille, France
5
Aix Marseille Univ, INSERM, APHM, MMG, UMR1251, Marmara Institute, La Timone Hospital Department of Neurosurgery, 13385 Marseille, France
6
Aix Marseille Univ, INSERM, MMG, UMR1251, Marmara Institute, 13385 Marseille, France
7
Université de Paris, Institut Cochin, Inserm U1016, CNRS UMR8104, F-75014 Paris, France
8
Aix-Marseille Univ, APHM, CNRS, INP, Inst Neurophysiopathol, CHU Timone, Service d’Anatomie Pathologique et de Neuropathologie, 13385 Marseille, France
9
Aix Marseille Univ, INSERM, APHM, MMG, UMR1251, Marmara Institute, Department of Endocrinology, Hospital La Conception, 13385 Marseille, France
10
Department of Endocrinology, Center for Rare Adrenal Diseases, Assistance Publique—Hôpitaux de Paris, Hôpital Cochin, 75014 Paris, France
*
Author to whom correspondence should be addressed.
Int. J. Mol. Sci. 2021, 22(14), 7570; https://0-doi-org.brum.beds.ac.uk/10.3390/ijms22147570
Submission received: 3 June 2021 / Revised: 9 July 2021 / Accepted: 10 July 2021 / Published: 15 July 2021
(This article belongs to the Special Issue Genomics and Epigenetics of Rare Tumors)

Abstract

:
Forty percent of somatotroph tumors harbor recurrent activating GNAS mutations, historically called the gsp oncogene. In gsp-negative somatotroph tumors, GNAS expression itself is highly variable; those with GNAS overexpression most resemble phenotypically those carrying the gsp oncogene. GNAS is monoallelically expressed in the normal pituitary due to methylation-based imprinting. We hypothesize that changes in GNAS imprinting of gsp-negative tumors affect GNAS expression levels and tumorigenesis. We characterized the GNAS locus in two independent somatotroph tumor cohorts: one of 23 tumors previously published (PMID: 31883967) and classified by pan-genomic analysis, and a second with 82 tumors. Multi-omics analysis of the first cohort identified a significant difference between gsp-negative and gsp-positive tumors in the methylation index at the known differentially methylated region (DMR) of the GNAS A/B transcript promoter, which was confirmed in the larger series of 82 tumors. GNAS allelic expression was analyzed using a polymorphic Fok1 cleavage site in 32 heterozygous gsp-negative tumors. GNAS expression was significantly reduced in the 14 tumors with relaxed GNAS imprinting and biallelic expression, compared to 18 tumors with monoallelic expression. Tumors with relaxed GNAS imprinting showed significantly lower SSTR2 and AIP expression levels. Altered A/B DMR methylation was found exclusively in gsp-negative somatotroph tumors. 43% of gsp-negative tumors showed GNAS imprinting relaxation, which correlated with lower GNAS, SSTR2 and AIP expression, indicating lower sensitivity to somatostatin analogues and potentially aggressive behavior.

1. Introduction

Somatotroph pituitary neuroendocrine tumors (PitNET) are benign tumors of the anterior pituitary gland. Somatotroph PitNET are growth hormone (GH) hypersecreting, leading to overproduction of insulin-like growth factor 1 (IGF-1) and resulting in gigantism in children and acromegaly in adults. Surgical removal leads to normalization of GH and IGF1 in 34–74% of cases depending on the series, related mostly to tumor size [1]. GH synthesis and secretion is primarily under stimulatory control of GH-releasing hormone (GHRH), while somatostatin inhibits GH release, mainly through the subtype 2 of the somatostatin receptor (SSTR2) [2]. SSTR2 is the primary target of the somatostatin analogues (SSAs) currently used to treat these tumors. However, 50% of patients remain resistant or partially resistant to these drugs due to a loss of SSTR2 expression [3].
Approximately 40% of somatotroph PitNET harbor activating mutations in the GNAS gene (NM_000516.7; HGNC:4392) encoding the α-subunit of the heterotrimeric GTP-binding protein (Gsα) [4,5]. Products of GNAS mutated at arginine 201 (R201) or glutamine 227 (Q227) are historically known as the gsp oncogene [4]. We have previously shown that the gsp oncogene impacts the tumoral phenotype, with gsp-positive tumors being smaller and more sensitive to treatment with the SSTR2 agonist octreotide, than gsp-negative ones [6,7,8,9,10].
The mRNA encoding for Gsα is one of the multiple transcripts from the complex imprinted GNAS locus on chromosome 20q11 [11] (Figure 1). Four distinct sense transcripts, three of which encode one or more peptides, are generated by alternative promoters and first exons that splice onto the second of twelve additional 3′ exons. However, there is evidence of additional transcript variants, some of which translate to distinct protein isoforms (Supplemental Table S1). The first exon of the NESP transcript (NM_016592.5) is the furthest 5′ relative to the first exon of GNAS, at 49 kilobases (kb) upstream. NESP encodes the 55 kDa neuroendocrine secretory protein (NESP55 or SCG6), a chromogranin-like protein. Thirty-five kb upstream of GNAS exon 1 is the first exon of the XL mRNA (NM_080425.4). XL encodes “extra-large alpha-s” (XLas), an isoform of GNAS with a long amino-terminal extension. This transcript also contains an alternative reading frame that can be translated into the unrelated protein ALEX (alternative gene product encoded by XL-exon), which interacts with XLas to restrain its adenylate cyclase stimulatory activity [12]. About 2.5 kb upstream of GNAS, a fourth alternative first exon defines the start of the noncoding A/B transcript (NR_132273.1) a long non-coding (lnc)RNA lacking a translation initiation codon that is also transcribed as a shorter splice variant (NR_132272.2). Finally, GNAS-AS1 (NR_002785.2) is another lncRNA, whose first antisense facing exon is found between the first exons of NESP and XL (Figure 1).
The GNAS locus is imprinted at several differentially methylated regions (DMR) in the promoters of all GNAS locus transcripts, except GNAS itself (Figure 1). NESP is expressed exclusively from the maternal allele, due to imprinted methylation of its paternal DMR. GNAS-AS1, XL and A/B are expressed from the paternal allele, due to methylation of their respective DMRs on the maternal allele. GNAS is biallelically expressed in all tissues except a few, including the pituitary, the renal proximal tubule, the thyroid and the gonads [8,13,14]. In these tissues, GNAS is exclusively expressed from the maternal allele, and the imprinting that affects GNAS transcription occurs through the differential methylation of A/B upstream of the GNAS promoter in both animal models and humans [15]. It is suspected that tissue-specific maternal methylation of the A/B DMR normally prevents binding of an unidentified to date GNAS transcriptional repressor. This mechanism would explain pseudohypoparathyroidism type 1B, a rare disease characterized by DMR hypomethylation at A/B with concomitant loss of GNAS expression in tissues where GNAS is normally imprinted [16].
We have shown that in gsp-positive somatotroph PitNETs, the mutation occurs almost exclusively on the maternal allele, reflecting GNAS imprinting [8]. GNAS mRNA levels are highly variable among somatotroph PitNETs. The highest expression is observed in gsp-negative tumors [9,17,18] and is associated with smaller tumor size and higher sensitivity to SSA [19]. GNAS imprinting relaxation is observed in some somatotroph PitNETs [8,19], but the mechanism underlying this relaxation has not been elucidated.
We hypothesize that epigenetic defects on the GNAS locus are involved in the relaxation of GNAS imprinting and GNAS expression and could consequently contribute to somatotroph tumorigenesis.

2. Materials and Methods

2.1. Somatotroph Tumors

This work included 2 independent cohorts of somatotroph tumors selected on histopathological criteria: cohort I included 23 somatotroph tumors from a previously published large collection of 134 PitNETs that was used to support a pan-genomic classification of PitNETs [20]. Genomic, transcriptomic and epigenetic data were reanalyzed as previously described [20], focusing on the GNAS locus. Cohort II included 82 additional somatotroph tumors, fifteen of which treated by SSAs before surgery. In addition, six normal human pituitaries serve as controls for the cohort II.

2.2. Genetic and Epigenetic Analysis

Genomic DNA of cohort II was extracted using the QIAamp DNA Mini kit (Qiagen, Courtabœuf, France). Gsp-oncogene was identified by Sanger sequencing targeting exons 8 and 9 of GNAS (GNAS exon 8-F TGAGCCTGACCTTGTAGAGAGACAC, GNAS exon 8-R AACATGCTGGTGGGGAGGAGGACAG, GNAS exon 9-F TCATGGTTTCTTGACATTCACC, GNAS exon 9-R TAA ACA GTGCAGACCAGGGC) on an AB3130XL (ThermoFisher Scientific, Waltham, MA, USA).
The methylation level of the A/B DMR (A/B ML) was determined by pyrosequencing on a Pyromark MD (Qiagen) after bisulfite conversion using the Epitect Bisulfite Kit (Qiagen) with the Hs_GNAS_04_PM_Q96 methylation assay kit (Qiagen) [21]. This assay targets 6 CpG doublets at the position chr20(GRCH37):57463600-57463700. The A/B ML was calculated from the mean of the methylation at the 6 CpG doublets. Three of these 6 CpG doublets correspond to the cg26767990, cg17652507, and cg22407822 of the Infinium® MethylationEPIC BeadChip (Illumina) used in the pan-genomic study [20]. These 3 CpG doublets were used to determine the methylation indices of A/B DMR (A/B MI) in the DNA methylation profiling of cohort I.

2.3. Expression Analysis of GNAS, SSTR2 and AIP of Cohort II:

For RNA extraction, 30 mg of each pituitary fragment conserved at −80 °C was ground over dry ice using a FastPrep device (MP Biomedical, Illkirch Cedex, France). The total RNA fraction was extracted with the RNeasy Plus Mini kit (Qiagen). Reverse transcription was performed with the First Strand cDNA Synthesis kit (GE Healthcare, Tremblay-en-France, France) according to the manufacturer’s instructions. The β-glucuronidase (BGUS) and GNAS transcripts were quantified using in-house assays as previously described [19]. The AIP and SSTR2 transcripts were quantified using commercial assays hSST2 (ID Hs00265624_s1) and hAIP (ID Hs00610222_m1, Applied Biosystems) respectively. Quantitative PCR was performed with the TaqMan gene expression kit (Applied Biosystems, Waltham, MA, USA) on a Viia7 thermal cycler (Roche Diagnostics, Meylan, France). A plasmid range was performed for each assay and absolute quantification was performed, normalized to the amount of BGUS housekeeping transcripts for each sample.

2.4. Allelic Quantification (AQ) of GNAS Expression

The AQ of GNAS expression (quantification of allele-specific GNAS expression) was based on the polymorphism that induces sensitivity to the Fok1 restriction endonuclease in GNAS exon 5, rs7121, c.393C > T, p.(Ile131Ile), which is expressed in the general population at an allelic frequency of 35%. Only somatotroph tumors and normal pituitary glands that were heterozygous for the Fok1 polymorphism were selected. GNAS AQ was done by pyrosequencing, using one pair of PCR primers, the forward of which is specifically located in exon 1 of GNAS, and the reverse of which carries a biotin group, targeting sequence includes the Fok1 position, and a sequencing primer, adjacent to the Fok1 position (RT-PCR-primer-F CGTGAGGCCAACAAAAAGAT, RT-PCR-primer-R: biotin-ATGGCAGTCACATCGTTGAA, pyroseq-primer F: GAGAACCAGTTCAGAGT) [22]. Mono-allelic GNAS expression was distinguished from a bi-allelic one (Supplemental Figure S1) using a threshold value determined from normal pituitaries, expressing GNAS only from the maternal allele.

2.5. Statistical Analysis

Statistical analyses were performed using Prism v9.0 (GraphPad Software, La Jolla, CA, USA). The Agostino and Pearson normality test was used to determine if methylation and expression values followed a normal distribution or not. This test computes skewness and kurtosis to quantify how far the distribution is from Gaussian. It then calculates how far each of these values differs from the value expected in a Gaussian distribution. If the distribution is normal, the means ± 2SD were considered to be within the threshold of “normal” values for A/B methylation and GNAS expression. Tumor characteristics were compared using the unpaired non-parametric Mann–Whitney test for quantitative values, and the Fisher exact test for qualitative values.

3. Results

3.1. Cohort I

Twenty-three somatotroph tumors were selected from a large cohort of 134 pitNETs classified in 6 categories (t1 to t6) according to their transcriptomic profiles obtained by RNAseq [20]. Six somatotroph tumors (6/23, 26% of somatotroph tumors) clustered in the t5 class, which also included five thyrotroph and five pluri-hormonal Pit1-positive PitNETs. The 17 others were assigned to the t6 class named the “somatotroph group”, which was subdivided into two subgroups, t6a and t6b. The t6a group included seven somatotroph tumors (7/23, 30% of the somatotroph tumors) and two mixed somato-lactotroph tumors. The t6b group included 10 somatotroph tumors (10/23, 44% of somatotroph tumors), six mixed somato-lactotroph tumors and two pluri-hormonal Pit1-positive tumors. The mixed somato-lactotroph tumors and the pluri-hormonal Pit-1 tumors were excluded from this analysis.
Sequencing revealed 14 gsp-negative (61%, 14/23) and nine gsp-positive (39%, 9/23) tumors. Among the gsp-positive tumors, 7/9 were assigned to the t6b subgroup, one to t5, and the last to t6a. The GNAS mRNA levels obtained by transcriptomic analysis (normalized counts of transcripts per million as calculated with DESeq2) were lower in gsp-positive tumors than in gsp-negative ones (median 17.4 counts vs. 17.8, p = 0.002, Figure 2A). Accordingly, the t6b subgroup had significantly lower GNAS expression than t6a tumors (t6a median = 17.9, t6b median = 17.4, p = 0.009). The gene copy number analysis was available for 15 somatotroph tumors. A copy gain on chromosome 20q was observed for three, including one gsp-positive tumor, but GNAS expression was not significantly increased in comparison to tumors without copy gain. The A/B DMR methylation indices (A/B MI) were significantly higher in gsp-negative tumors compared to gsp-positive tumors (median 0.56 vs. 0.50 respectively, p = 0.028, Figure 2C).

3.2. Cohort II

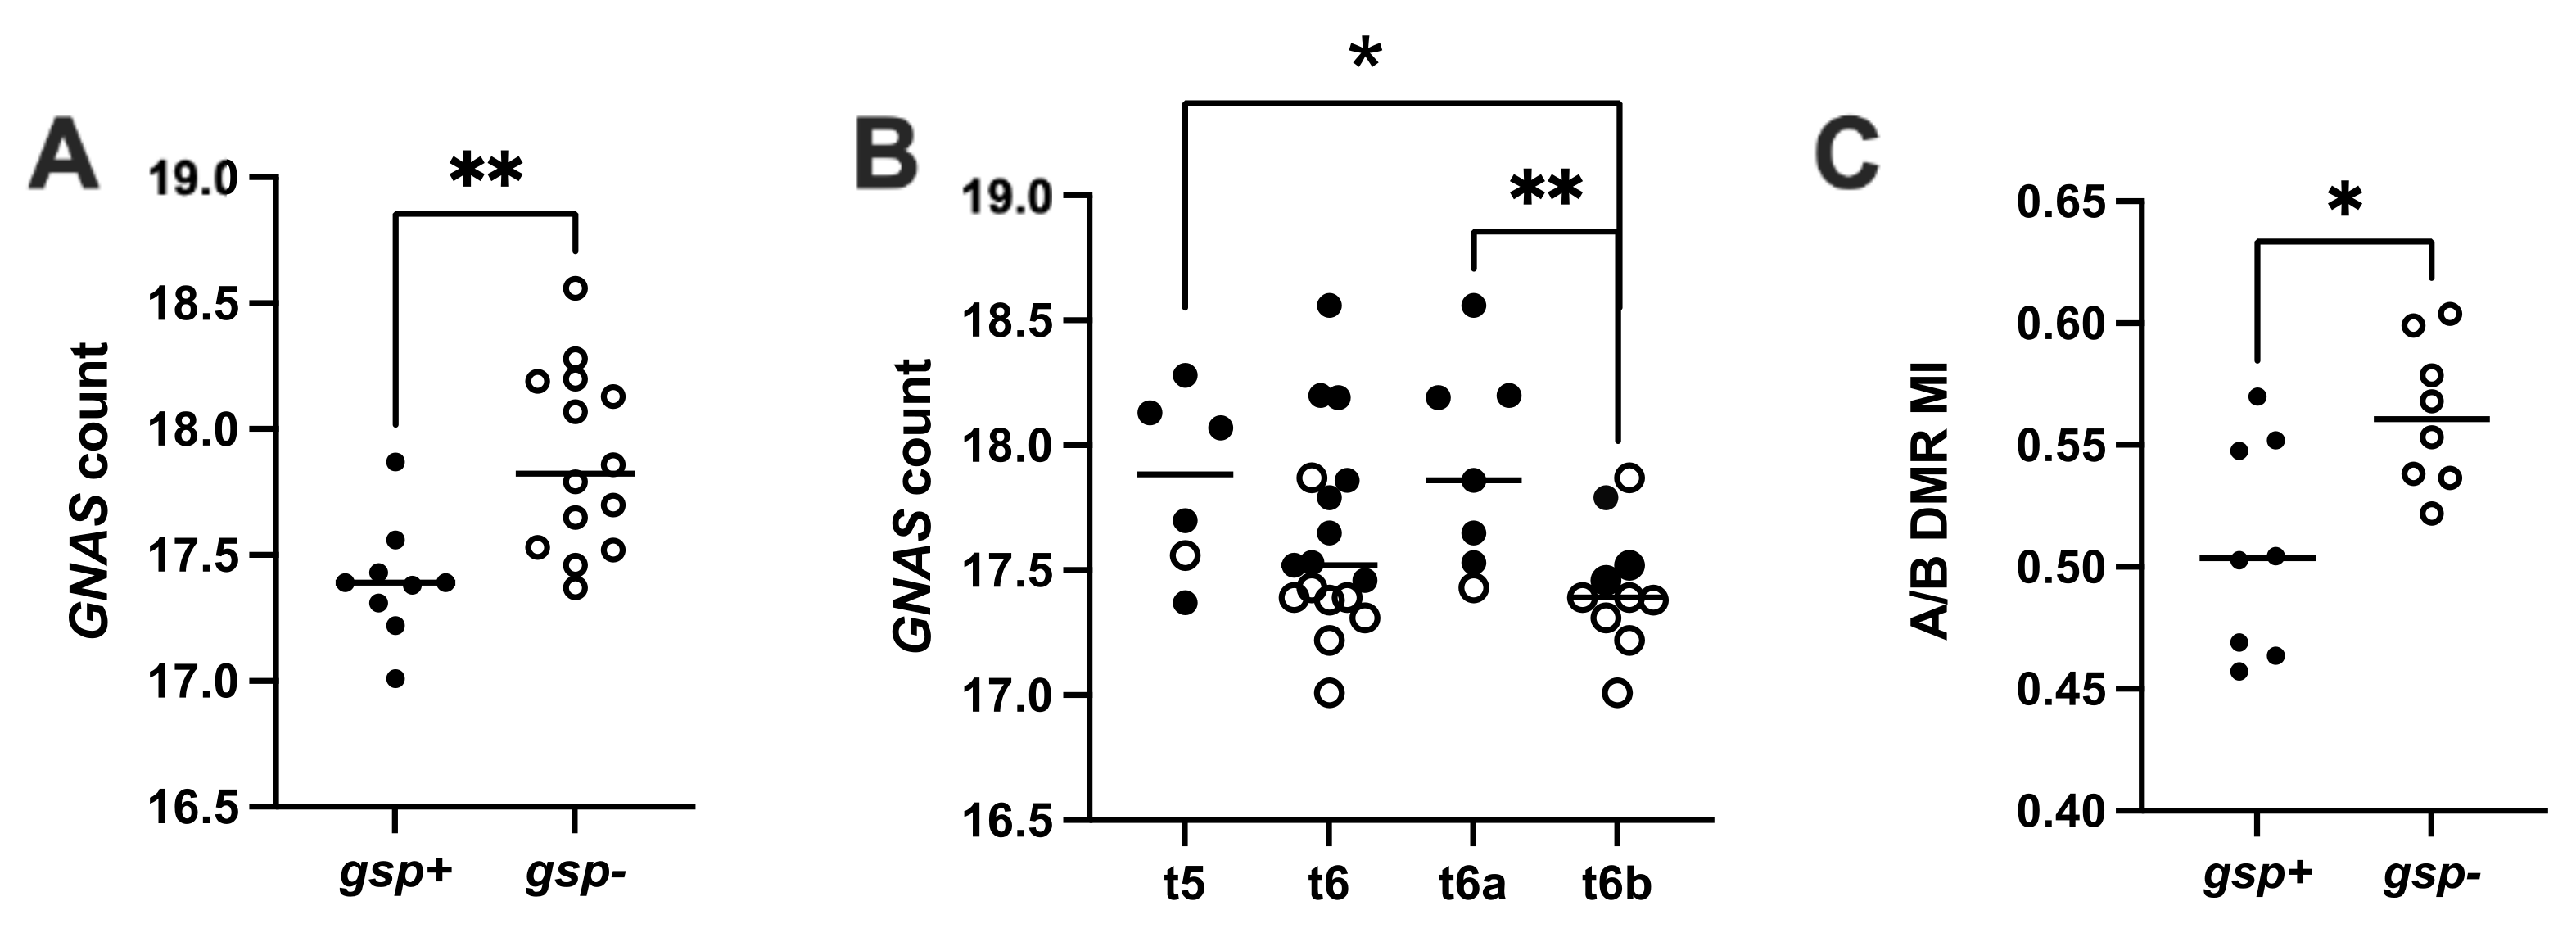
3.2.1. Gsp Oncogene Status and GNAS Expression

Nineteen somatotroph tumors carried gsp. The GNAS, AIP, and SSTR2 mRNA expression levels were not statistically different between presurgical SSAs treated and un-pretreated gsp-negative tumors.
As in cohort I, the GNAS mRNA levels in the 19 gsp-positive tumors were lower than in the 63 gsp-negative ones (median 293 vs. 536 × 1000 copies per copy BGUS p = 0.019, Figure 3A). The AIP mRNA expression level was also lower, but this was not significant (median 102.7 vs. 167.2 × 1000 copies/copy BGUS, p = 0.07, Figure 3B). In contrast, SSTR2 expression levels were similar in both groups (median 106 vs. 144 × 1000 copies/copy BGUS p = 0.9, Figure 3C). GNAS mRNA expression levels followed a normal distribution in gsp-positive tumors (p = 0.7), but not in gsp-negative tumors. Therefore, we used the values of GNAS expression in gsp-positive tumors to determine an overexpression threshold for GNAS. In gsp-negative tumors, GNAS was considered to be overexpressed when the value was higher than the mean ± SD (517 × 1000 copies/copy BGUS). Among the 63 gsp-negative tumors of cohort II, 34 overexpressed GNAS. In this subgroup, the AIP expression level was also significantly higher (median 82.4 vs. 20.7 × 1000 copies/copy BGUS p = 0.0001, Figure 3B), while the SSTR2 expression level remained not statistically different (median 99 vs. 167 × 1000 copies/copy BGUS, p = 0.2; Figure 3C).

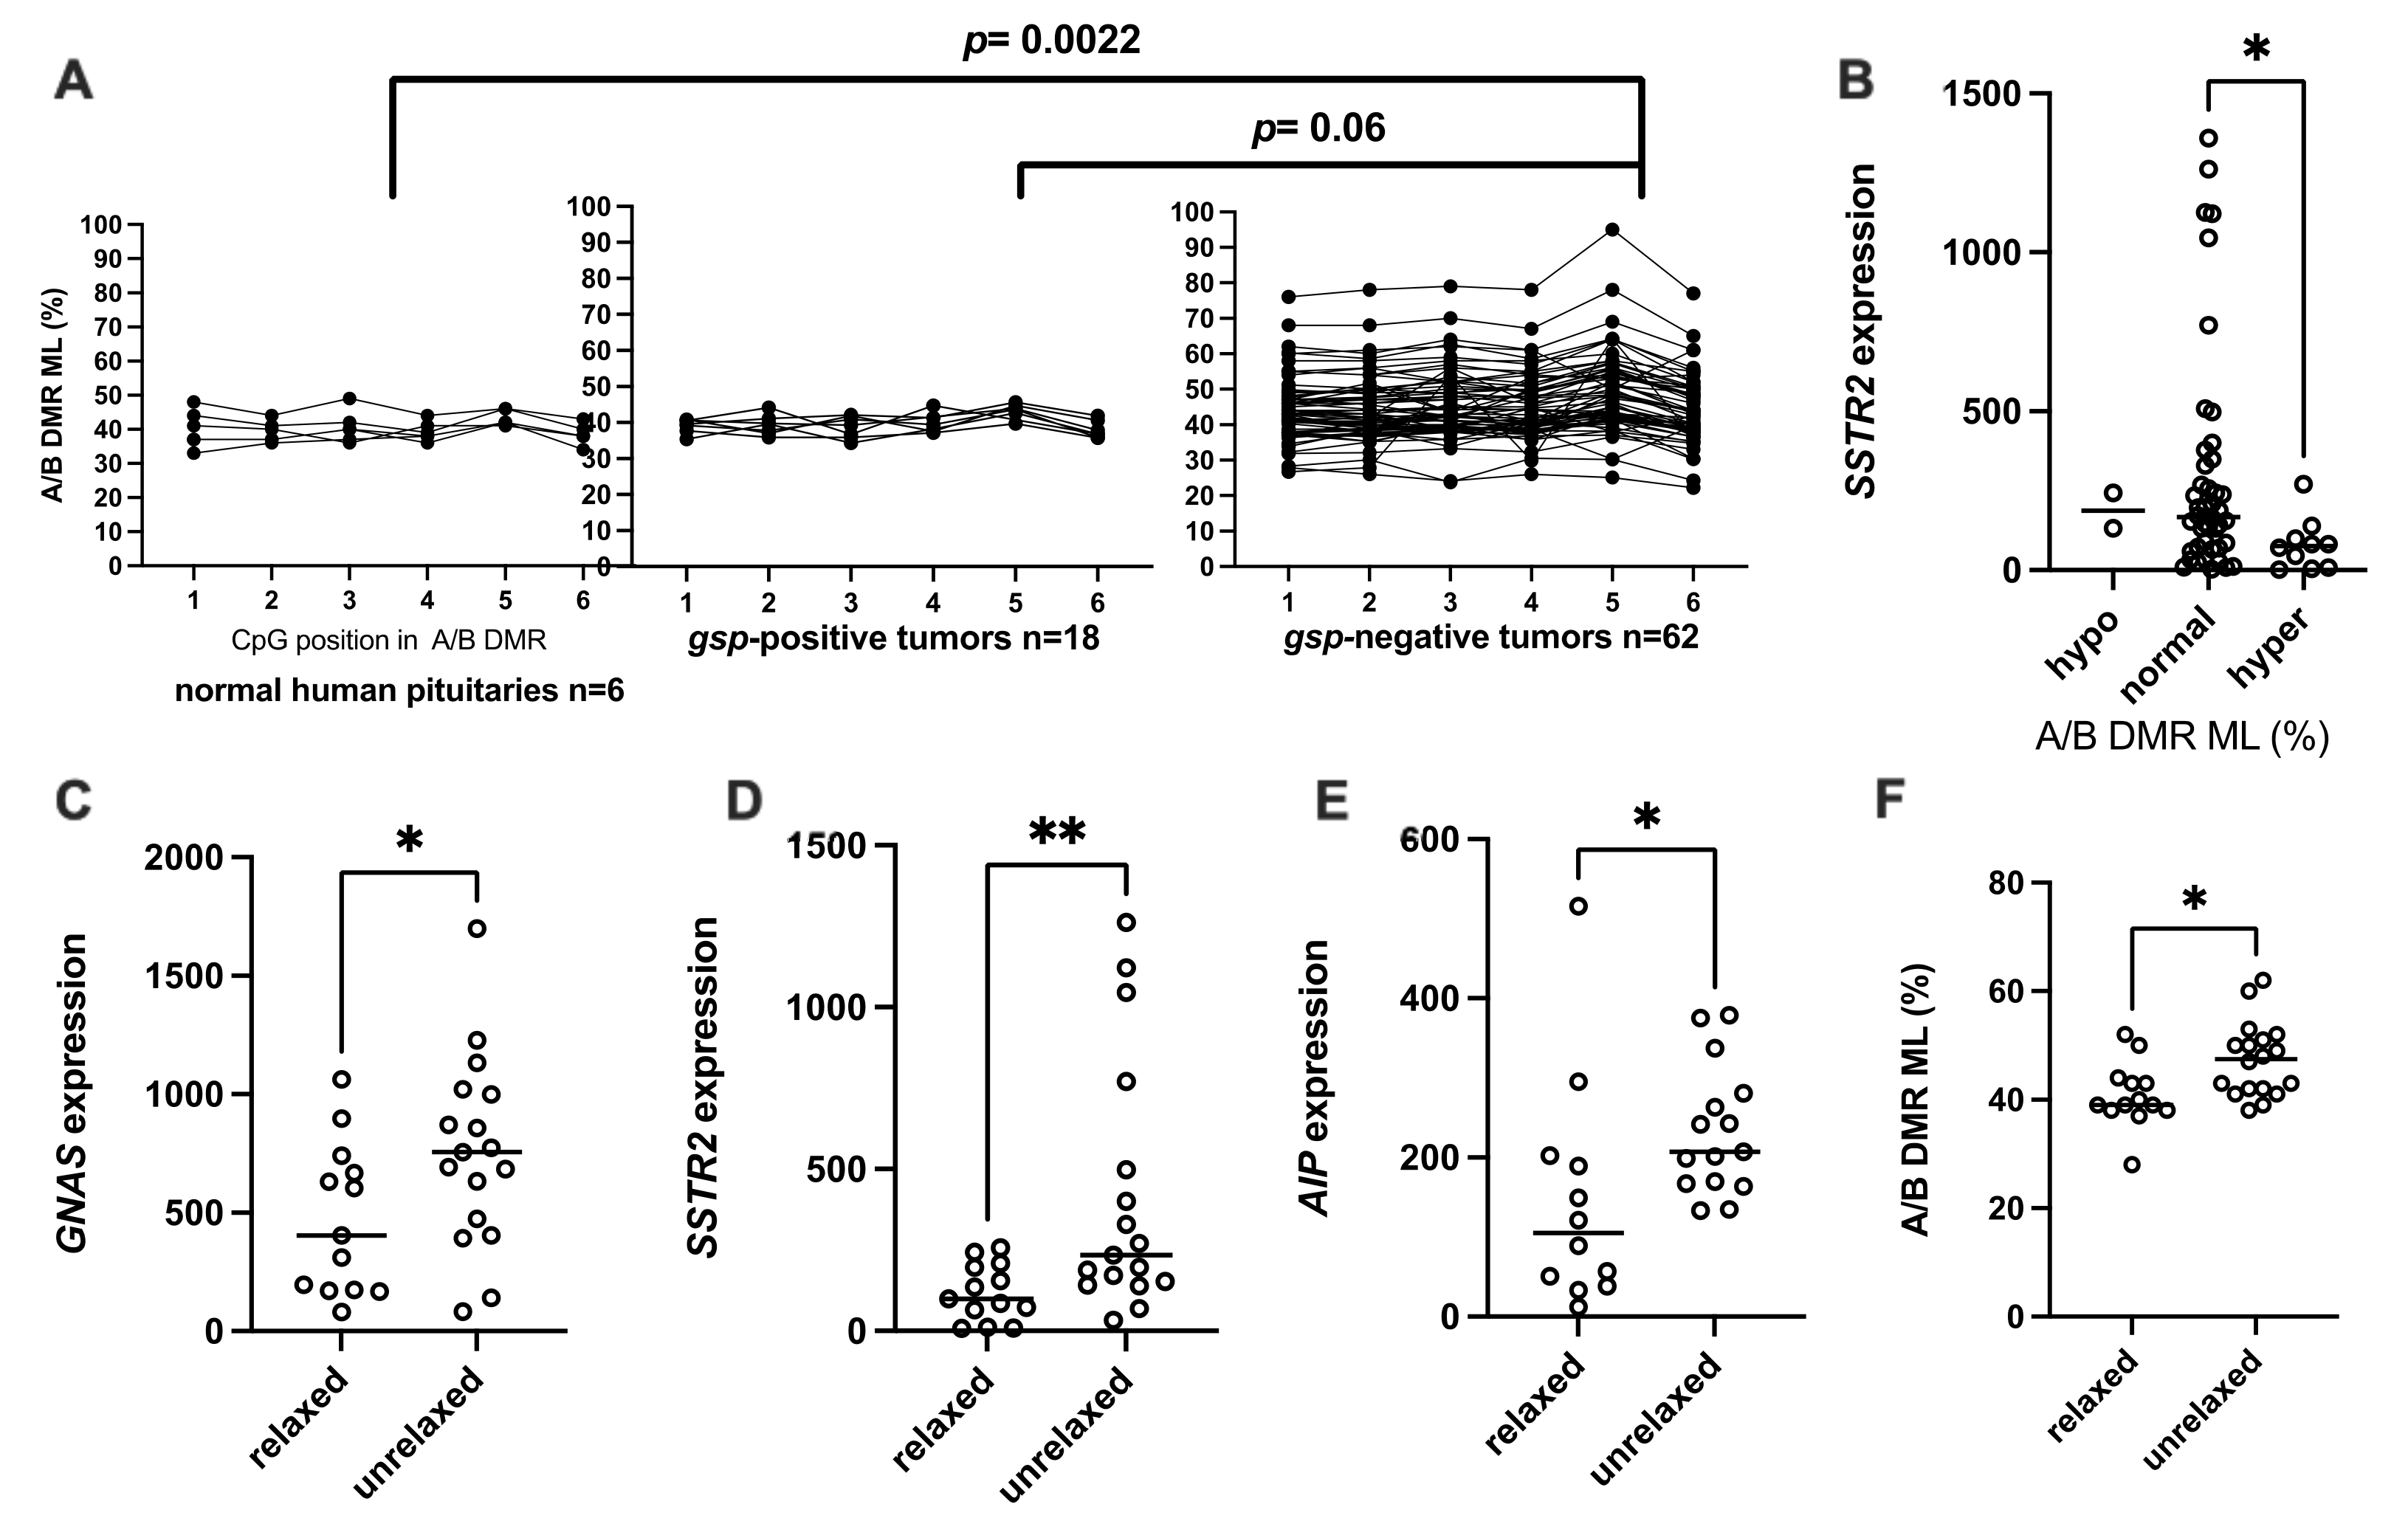
3.2.2. Methylation Levels of A/B DMR (A/B ML)

The A/B ML median was at 39% (range 36–46%) in the normal pituitaries and covered the same range in the gsp-positive tumors (median 40%, 37–42%, Figure 4A). In contrast, A/B ML were highly variable in the gsp-negative adenomas (median 43%, 25–81%), and different from that of normal pituitaries (p = 0.022) or gsp-positive tumors (p = 0.06). The A/B ML in gsp-positive tumors followed a normal distribution (p = 0.98). The mean ± 2SD in this group was chosen as the threshold to assign a hypo- or hyper-methylated status (42.4 ± 11.4%). Two gsp-negative tumors (3%) were thus hypo-methylated at the A/B DMR while 12 (20%) were A/B-hyper-methylated. Somewhat surprisingly, they also showed no correlation to the GNAS expression level. GNAS expression was lower, but not significantly so, in these A/B-hyper-methylated gsp-negative tumors relative to the normo-methylated ones (median 378 vs. 603 × 1000 copies/copy BGUS, p = 0.18). AIP expression levels showed a similar tendency (median 150.8 vs. 179.5 × 1000 copies/copy BGUS, p = 0.5). Only SSTR2 expression levels were significantly lower in the A/B-hyper-methylated, gsp-negative tumors compared to the normo-methylated ones (median 76 vs. 167 × 1000 copies/copy BGUS, p = 0.012, Figure 4B).

3.2.3. Relaxation of GNAS Imprinting

Thirty-two gsp-negative tumors and 3 normal pituitary fragments were heterozygous for a known SNV that induces a Fok1 restriction enzyme cleavage site, and thereby informative for allelic quantification (AQ). In the normal pituitary, the A/B DMR upstream of GNAS is paternally imprinted, such that only the maternal allele of GNAS is expressed in this tissue. Using the AQ of normal pituitaries as a reference, “relaxation” of GNAS imprinting was defined as when GNAS expression from the minor expressed allele was greater than 20% of total GNAS expression. Among the 32 informative gsp-negative tumors, 18 were considered normally imprinted while 14 were relaxed. These 18 unrelaxed, gsp-negative tumors transcribed significantly more GNAS, AIP and SSTR2 than the relaxed ones (median 755 vs. 405 × 1000 GNAS copies/copy BGUS, p = 0.05; 634 vs. 203 × 1000 SSTR2 copies/copy BGUS, p = 0.02; and 207.5 vs. 105.1 × 1000 AIP copies/copy BGUS, p = 0.007; Figure 4C–E respectively). On the other hand, A/B ML was higher in unrelaxed gsp-negative tumors compared to relaxed gsp-negative tumors (47.5%, min 38%, max 62%, versus 39%, min 28%, max 52%, p = 0.013 Figure 4F).

4. Discussion

We hypothesized that epigenetic defects at the GNAS locus could impact GNAS imprinting, GNAS transcription, and ultimately, somatotroph tumorigenesis. This hypothesis was based on the molecular mechanism underlined in pseudohypoparathyroidism type 1B (PHP1B), an imprinting disorder. PHP is a group of rare diseases characterized by end-organ resistance to parathyroid hormone (PTH) but also to GHRH or TSH. The corresponding hormonal receptors are transmembrane receptors coupled to the Gαs subunit. In some tissues, including the pituitary gland [8], GNAS is mono-allelically expressed from the maternal allele. PHP1B develops due to the loss of GNAS expression in a tissue where GNAS is normally imprinted, following hypo-methylation of the A/B DMR [16]. We therefore investigated whether somatotroph tumorigenesis may have an analogous pathogenetic mechanism to PHP1B, through aberrant methylation at the GNAS locus
The gsp-oncogene was detected in 39% of somatotroph tumors from the cohort I, and 25% from the cohort II, which findings are consistent with the literature [23]. In the cohort I, the gsp-positive tumors mainly clustered in the same transcriptomic class (t6) whereas gsp-negative tumors clustered either in t6 or in another class (t5). The pan-genomic classification thus highlights a population of somatotroph tumors that are gsp-negative but behave functionally like gsp-positive tumors. These tumors, belonging to the t6a subgroup, had higher GNAS expression than t6b ones (p = 0.009), including the mainly gsp-positive tumors.
Transcriptomic and targeted RT-PCR analysis of these independent cohorts I and II confirmed a significant difference of GNAS expression level between gsp-positive tumors and gsp-negative ones, as previously reported [18]. Among the gsp-negative tumors, we identified a population over-expressing GNAS. This group also expressed higher AIP mRNA levels. AIP is a chaperone protein that behaves like a tumor suppressor in somatotroph tumors. High levels of AIP mRNA are a marker of reduced invasiveness of somatotroph tumors [24]. AIP-dependent regulation of the cAMP pathway seems to play a predominant role in this protective function [25,26]. Immunohistochemistry has shown that high AIP expression is correlated with better SSA response [27]. Nevertheless, in the literature, AIP and SSTR2 are independent, uncorrelated markers of response to SSAs.
We have demonstrated here for the first time, through methylome analysis and pyrosequencing, differential methylation at the A/B DMR between gsp-negative and gsp-positive tumors. In the cohort II, we showed that A/B DMR methylation levels were similar in the gsp-positive group and in normal pituitaries, while they were highly variable in the gsp-negative tumors. As predicted by our hypothesis, hyper-methylation was detected in 20% of gsp-negative tumors, in agreement with the higher A/B MI observed in the gsp-negative group of cohort I. However, in these, GNAS mRNA expression levels were not correlated with the A/B ML, perhaps due to the complex epigenetic regulation at the GNAS locus.
Relaxation of GNAS imprinting was observed in almost half of the 32 informative gsp-negative tumors (14/32). Surprisingly, a higher A/B ML was not observed in the relaxed, gsp-negative group compared to the unrelaxed, gsp-negative one (Figure 4F). On the contrary, A/B ML was higher in the unrelaxed group. This is not in agreement with our first hypothesis, which stated that hypermethylation of A/B DMR would be involved in the increased expression of GNAS in some gsp-negative tumors by an enhancer mechanism involving a protein binding to the methylated regions. Nevertheless, using KO mice harboring deletion of A/B DMR, Williamson et al. showed that a paternal deletion of this DMR abolishes tissue-specific imprinting of Gnas [28]. This result was confirmed by Liu et al. [29]. Their conclusion is that the unmethylated A/B DMR contains a silencer for Gnas expression, which is active on the unmethylated paternal allele. However, contrary to what we observed in human tumors, in these models imprinting relaxation resulted in overexpression of Gnas. In our previous work, we have shown that in somatotroph tumors the re-expression of the GNAS paternal allele is compensated by a decrease in the expression of the GNAS maternal allele [19]. Here, the expression of GNAS was found higher in unrelaxed tumors (with higher A/B ML) than in relaxed ones (with lower A/B ML, Figure 4C). In unrelaxed, gsp-negative tumors, higher expression of GNAS was associated with higher levels of SSTR2 and AIP gene expression.
In conclusion, somatic GNAS imprinting relaxation and A/B DMR methylation levels have little effect on GNAS expression itself in the context of somatotroph tumors, in contrast to what is observed at the germline level in pseudohypoparathyroidism [19]. Overall, our results suggested that the GNAS relaxation and loss of A/B DMR methylation could be one of the steps in the dedifferentiation drift including a loss of GNAS, AIP and SSTR2 expression that may contribute to the tumor promotion. Data from the cohort II allows us to distinguish three groups of tumors: gsp-positive tumors with low GNAS mRNA expression, unrelaxed gsp-negative tumors with high GNAS, SST2 and AIP expression levels, and relaxed gsp-negative tumors with low GNAS, SSTR2 and AIP expression levels (Table 1). The relationship between imprinting loss and tumor aggressiveness remains to be clinically determined.

Supplementary Materials

The following are available online at https://0-www-mdpi-com.brum.beds.ac.uk/article/10.3390/ijms22147570/s1, Figure S1: Allelic quantification of GNAS expression by pyrosequencing, Table S1: No tittle, Table S2: Clincobiological characteristics of patients and tumors from cohort I, Table S3: Biological characteristics of the 82 tumors from cohort II.

Author Contributions

Conceptualization, A.B., P.R. and G.A.; methodology, A.B. and P.R.; software, D.D.M.; experimental work, P.R., J.G., C.R., G.M. and M.H.; resources, M.T., D.F.-B., H.D., T.G., P.K. and G.A.; writing—original draft preparation, P.R. and A.B.; writing—review and editing, P.R., J.G., P.K., M.H., M.T., C.R., T.G., H.C.E., D.D.M., G.M., D.F.-B., H.D., T.C., G.A. and A.B.; supervision, A.B.; funding acquisition, H.C.E. and A.B. All authors have read and agreed to the published version of the manuscript.

Funding

All phases of this study were supported by grants from the Institut National de lutte contre le Cancer (INCa), and the French Ministry of Health. The project resulting in this publication received funding from the Groupement de Recherche CREST-NET (GDR2031) and Excellence Initiative of Aix Marseille University—A*Midex—a French “Investissement d’Avenir”—Institute MarMaRa AMX-19-IET- 007.

Institutional Review Board Statement

The study was conducted according to the guidelines of the Declaration of Helsinki. AP-HM Tumor Bank authorization number: AC2018-31053; CRB BB-0033-00097.

Informed Consent Statement

All patients have done their contentment for tissue collection to the tumor bank and its use in research.

Data Availability Statement

MiRNA and mRNA read counts are available at the European Bioinformatics Institute (EMBL-EBI) Array Express under accession numbers E-MTAB-7969 and E-MTAB-7768 respectively. Methylome data are available under EMBL-EBI Array Express accession number E-MTAB-7762. Sequencing data (exome, mRNA and MiRNA sequencing) has been deposited at the European Genome- phenome Archive (EGA) which is hosted at the EBI and the CRG, under accession number EGAS00001003642.

Conflicts of Interest

The authors declare no conflict of interest.

References

  1. Ludecke, D.K.; Abe, T. Transsphenoidal microsurgery for newly diagnosed acromegaly: A personal view after more than 1,000 operations. Neuroendocrinology 2006, 83, 230–239. [Google Scholar] [CrossRef] [PubMed]
  2. Vélez, E.J.; Unniappan, S. A Comparative Update on the Neuroendocrine Regulation of Growth Hormone in Vertebrates. Front. Endocrinol. Lausanne 2021, 11, 1174. [Google Scholar] [CrossRef] [PubMed]
  3. Plöckinger, U.; Albrecht, S.; Mawrin, C.; Saeger, W.; Buchfelder, M.; Petersenn, S.; Schulz, S. Selective loss of somatostatin receptor 2 in octreotide-resistant growth hormone-secreting adenomas. J. Clin. Endocrinol. Metab. 2008, 93, 1203–1210. [Google Scholar] [CrossRef] [PubMed] [Green Version]
  4. Landis, C.A.; Masters, S.B.; Spada, A.; Pace, A.M.; Bourne, H.R.; Vallar, L. GTPase inhibiting mutations activate the alpha chain of Gs and stimulate adenylyl cyclase in human pituitary tumours. Nature 1989, 340, 692–696. [Google Scholar] [CrossRef]
  5. Lyons, J.; Landis, C.; Harsh, G.; Vallar, L.; Grunewald, K.; Feichtinger, H.; Duh, Q.; Clark, O.; Kawasaki, E.; Bourne, H.; et al. Two G protein oncogenes in human endocrine tumors. Science 1990, 249, 655–659. [Google Scholar] [CrossRef]
  6. Romano, D.; Magalon, K.; Pertuit, M.; Rasolonjanahary, R.; Barlier, A.; Enjalbert, A.; Gerard, C. Conditional Overexpression of the Wild-Type Gs α as the gsp Oncogene Initiates Chronic Extracellularly Regulated Kinase 1/2 Activation and Hormone Hypersecretion in Pituitary Cell Lines. Endocrinology 2007, 148, 2973–2983. [Google Scholar] [CrossRef] [Green Version]
  7. Pertuit, M.; Barlier, A.; Enjalbert, A.; Gérard, C. Signalling pathway alterations in pituitary adenomas: Involvement of Gsalpha, cAMP and mitogen-activated protein kinases. J. Neuroendocrinol. 2009, 21, 869–877. [Google Scholar] [CrossRef]
  8. Hayward, B.E.; Barlier, A.; Korbonits, M.; Grossman, A.B.; Jacquet, P.; Enjalbert, A.; Bonthron, D.T. Imprinting of the G(s)alpha gene GNAS1 in the pathogenesis of acromegaly. J. Clin. Investig. 2001, 107, R31–R36. [Google Scholar] [CrossRef] [PubMed] [Green Version]
  9. Barlier, A.; Pellegrini-Bouiller, I.; Gunz, G.; Zamora, A.J.; Jaquet, P.; Enjalbert, A. Impact of gsp oncogene on the expression of genes coding for G(s)α, Pit-1, G(i)2α, and somatostatin receptor 2 in human somatotroph adenomas: Involvement in octreotide sensitivity. J. Clin. Endocrinol. Metab. 1999, 84, 2759–2765. [Google Scholar] [CrossRef] [PubMed] [Green Version]
  10. Pertuit, M.; Romano, D.; Zeiller, C.; Barlier, A.; Enjalbert, A.; Gerard, C. The gsp oncogene disrupts Ras/ERK-dependent prolactin gene regulation in gsp inducible somatotroph cell line. Endocrinology 2011, 152, 1234–1243. [Google Scholar] [CrossRef] [Green Version]
  11. Hayward, B.E.; Kamiya, M.; Strain, L.; Moran, V.; Campbell, R.; Hayashizaki, Y.; Bonthron, D.T. The human GNAS1 gene is imprinted and encodes distinct paternally and biallelically expressed G proteins. Proc. Natl. Acad. Sci. USA 1998, 95, 10038–10043. [Google Scholar] [CrossRef] [Green Version]
  12. Freson, K.; Jaeken, J.; Van Helvoirt, M.; de Zegher, F.; Wittevrongel, C.; Thys, C.; Hoylaerts, M.F.; Vermylen, J.; Van Geet, C. Functional polymorphisms in the paternally expressed XLαs and its cofactor ALEX decrease their mutual interaction and enhance receptor-mediated cAMP formation. Hum. Mol. Genet. 2003, 12, 1121–1130. [Google Scholar] [CrossRef] [PubMed] [Green Version]
  13. Liu, J.; Erlichman, B.; Weinstein, L.S. The stimulatory G protein alpha-subunit Gs alpha is imprinted in human thyroid glands: Implications for thyroid function in pseudohypoparathyroidism types 1A and 1B. J. Clin. Endocrinol. Metab. 2003, 88, 4336–4341. [Google Scholar] [CrossRef] [PubMed] [Green Version]
  14. Mantovani, G.; Ballare, E.; Giammona, E.; Beck-Peccoz, P.; Spada, A. The gsalpha gene: Predominant maternal origin of transcription in human thyroid gland and gonads. J. Clin. Endocrinol. Metab. 2002, 87, 4736–4740. [Google Scholar] [CrossRef] [Green Version]
  15. Liu, J.; Yu, S.; Litman, D.; Chen, W.; Weinstein, L.S. Identification of a methylation imprint mark within the mouse Gnas locus. Mol. Cell. Biol. 2000, 20, 5808–5817. [Google Scholar] [CrossRef] [Green Version]
  16. Liu, J.; Litman, D.; Rosenberg, M.J.; Yu, S.; Biesecker, L.G.; Weinstein, L.S. A GNAS1 imprinting defect in pseudohypoparathyroidism type IB. J. Clin. Investig. 2000, 106, 1167–1174. [Google Scholar] [CrossRef] [PubMed] [Green Version]
  17. Ballaré, E.; Mantovani, S.; Lania, A.; Di Blasio, A.M.; Vallar, L.; Spada, A. Activating mutations of the G(s)α gene are associated with low levels of Gsα protein in growth hormone-secreting tumors. J. Clin. Endocrinol. Metab. 1998, 83, 4386–4390. [Google Scholar] [CrossRef] [Green Version]
  18. Lania, A.; Mantovani, G.; Spada, A. Genetics of pituitary tumors: Focus on G-protein mutations. Exp. Biol. Med. 2003, 228, 1004–1017. [Google Scholar] [CrossRef] [PubMed]
  19. Picard, C.; Silvy, M.; Gerard, C.; Buffat, C.; Lavaque, E.; Figarella-Branger, D.; Dufour, H.; Gabert, J.; Beckers, A.; Brue, T.; et al. Gs alpha overexpression and loss of Gs alpha imprinting in human somatotroph adenomas: Association with tumor size and response to pharmacologic treatment. Int. J. Cancer 2007, 121, 1245–1252. [Google Scholar] [CrossRef] [PubMed]
  20. Neou, M.; Villa, C.; Armignacco, R.; Jouinot, A.; Raffin-Sanson, M.L.; Septier, A.; Letourneur, F.; Diry, S.; Diedisheim, M.; Izac, B.; et al. Pangenomic Classification of Pituitary Neuroendocrine Tumors. Cancer Cell 2020, 37, 123–134. [Google Scholar] [CrossRef] [PubMed]
  21. Romanet, P.; Osei, L.; Netchine, I.; Pertuit, M.; Enjalbert, A.; Reynaud, R.; Barlier, A. Case report of GNAS epigenetic defect revealed by a congenital hypothyroidism. Pediatrics 2015, 135, e1079–e1083. [Google Scholar] [CrossRef] [Green Version]
  22. Romanet, P.; Guerin, C.; Pedini, P.; Essamet, W.; Castinetti, F.; Sebag, F.; Roche, P.; Cascon, A.; Tischler, A.S.; Pacak, K.; et al. Pathological and Genetic Characterization of Bilateral Adrenomedullary Hyperplasia in a Patient with Germline MAX Mutation. Endocr. Pathol. 2017, 28, 302–307. [Google Scholar] [CrossRef] [PubMed]
  23. Ronchi, C.L.; Peverelli, E.; Herterich, S.; Weigand, I.; Mantovani, G.; Schwarzmayr, T.; Sbiera, S.; Allolio, B.; Honegger, J.; Appenzeller, S.; et al. Landscape of somatic mutations in sporadic GH-secreting pituitary adenomas. Eur. J. Endocrinol. 2016, 174, 363–372. [Google Scholar] [CrossRef] [PubMed] [Green Version]
  24. Jaffrain-Rea, M.-L.; Angelini, M.; Gargano, D.; Tichomirowa, M.A.; Daly, A.F.; Vanbellinghen, J.-F.; D’Innocenzo, E.; Barlier, A.; Giangaspero, F.; Esposito, V.; et al. Expression of aryl hydrocarbon receptor (AHR) and AHR-interacting protein in pituitary adenomas: Pathological and clinical implications. Endocr. Relat. Cancer 2009, 16, 1029–1043. [Google Scholar] [CrossRef] [PubMed]
  25. Formosa, R.; Xuereb-Anastasi, A.; Vassallo, J. Aip regulates cAMP signalling and GH secretion in GH3 cells. Endocr. Relat. Cancer 2013, 20, 495–505. [Google Scholar] [CrossRef] [Green Version]
  26. Tuominen, I.; Heliövaara, E.; Raitila, A.; Rautiainen, M.-R.; Mehine, M.; Katainen, R.; Donner, I.; Aittomäki, V.; Lehtonen, H.J.; Ahlsten, M.; et al. AIP inactivation leads to pituitary tumorigenesis through defective Gαi-cAMP signaling. Oncogene 2014, 34, 1174–1184. [Google Scholar] [CrossRef]
  27. Jaffrain-Rea, M.-L.; Rotondi, S.; Turchi, A.; Occhi, G.; Barlier, A.; Peverelli, E.; Rostomyan, L.; Defilles, C.; Angelini, M.; Oliva, M.-A.; et al. Somatostatin analogues increase AIP expression in somatotropinomas, irrespective of Gsp mutations. Endocr. Relat. Cancer 2013, 20, 753–766. [Google Scholar] [CrossRef] [Green Version]
  28. Williamson, C.M.; Ball, S.T.; Nottingham, W.T.; Skinner, J.A.; Plagge, A.; Turner, M.D.; Powles, N.; Hough, T.; Papworth, D.; Fraser, W.D.; et al. A cis -acting control region is required exclusively for the tissue-specific imprinting of Gnas. Nat. Genet. 2004, 36, 894–899. [Google Scholar] [CrossRef]
  29. Liu, J.; Chen, M.; Deng, C.; Bourc’his, D.; Nealon, J.G.; Erlichman, B.; Bestor, T.H.; Weinstein, L.S. From the Cover: Identification of the control region for tissue-specific imprinting of the stimulatory G protein α-subunit. Proc. Natl. Acad. Sci. USA 2005, 102, 5513. [Google Scholar] [CrossRef] [PubMed] [Green Version]
Figure 1. General organization of the GNAS locus. The dark gray and light gray boxes represent the coding and noncoding exons, respectively. The broken lines indicate the splicing patterns. Numbers indicate the numbers of the exons.
Ijms 22 07570 g001
Figure 2. GNAS expression and methylation indices of A/B DMR determined by pan-genomic analysis of the somatotroph tumors from the cohort I. GNAS count by TPM estimated from transcriptomic analysis using DESeq2. A/B DMR MI: methylation indices of A/B DMR. (A) gsp-negative tumors show higher GNAS transcription than gsp-positive tumors. (B) Differential GNAS expression in tumors after pan-genomic classification. Tumors from the t5 and t6a subgroups express more GNAS than t6b tumors. (C) Differential methylation indices (MI) at the A/B DMR in gsp-negative and gsp-positive tumors of cohort I. *: p < 0.05; **: p < 0.01; gsp-: tumors without the gsp oncogene, white dots; gsp+: tumors with the gsp oncogene, black dots.
Ijms 22 07570 g002
Figure 3. Characterization of GNAS, AIP and SSTR2 expression in the cohort II. (A) GNAS expression (copies/copy × 1000 BGUS) in gsp-negative tumors versus gsp-positive tumors. (B) AIP expression (copies/copy × 1000 BGUS) in gsp-negative tumors versus gsp-positive tumors, and in gsp-negative tumors according to GNAS expression levels. (C) SSTR2 expression (copies/copy × 1000 BGUS) in gsp-negative tumors versus gsp-positive tumors and in gsp-negative tumors according to GNAS expression levels. *: p < 0.05; ***: p < 0.001; gsp-: tumors without the gsp oncogene, white dots; gsp+: tumors with the gsp oncogene, black dots. Low GNAS or high GNAS: gsp-negative tumors expressing respectively greater or fewer than 517 copies per copy of BGUS, × 1000. *: p < 0.05. ***: p < 0.001.
Ijms 22 07570 g003
Figure 4. Characterization of GNAS, AIP and SSTR2 expression in the “82 tumors” cohort according to the epigenetic disturbance of GNAS locus. A/B DMR ML: methylation level of A/B DMR. (A) pattern of A/B DMR methylation in normal human pituitary gland, gsp-positive somatotroph adenomas and gsp-negative somatotrophs adenomas. (B) SSTR2 expression (copies/copy × 1000 BGUS) in gsp-negative tumors as a function of A/B DMR methylation levels. (C) GNAS, (D) SSTR2, (E) AIP, mRNA expression (copies/copy × 1000 BGUS) in gsp-negative tumors according to the relaxation of GNAS imprinting. (F) Methylation level of A/B DMR in relaxed and unrelaxed gsp-negative tumors. *: p < 0.05; **: p < 0.01.
Ijms 22 07570 g004
Table 1. Characteristics of three groups of somatotroph tumors within cohort II.
Group 1
n = 16
Group 2
n = 18
Group 3
n = 14
GNAS mutational and imprinting statusgsp-positivegsp-negative,
unrelaxed
gsp-negative,
relaxed
GNAS expressionLow * (p = 0.02)High ** (p = 0.05)Low *
AIP expressionLow * (ns)High ** (p = 0.02)Low **
SSTR2 expressionLow * (ns)High ** (p = 0.007)Low **
* Versus expression in gsp-negative tumors, ** comparative expression between relaxed and unrelaxed gsp-negative tumors (group 2 and 3).
Publisher’s Note: MDPI stays neutral with regard to jurisdictional claims in published maps and institutional affiliations.

