
Comprehensive Genomic and Transcriptomic Analysis of Three Synchronous Primary Tumours and a Recurrence from a Head and Neck Cancer Patient

 , , ,
, , ,
Abstract
:1. Introduction
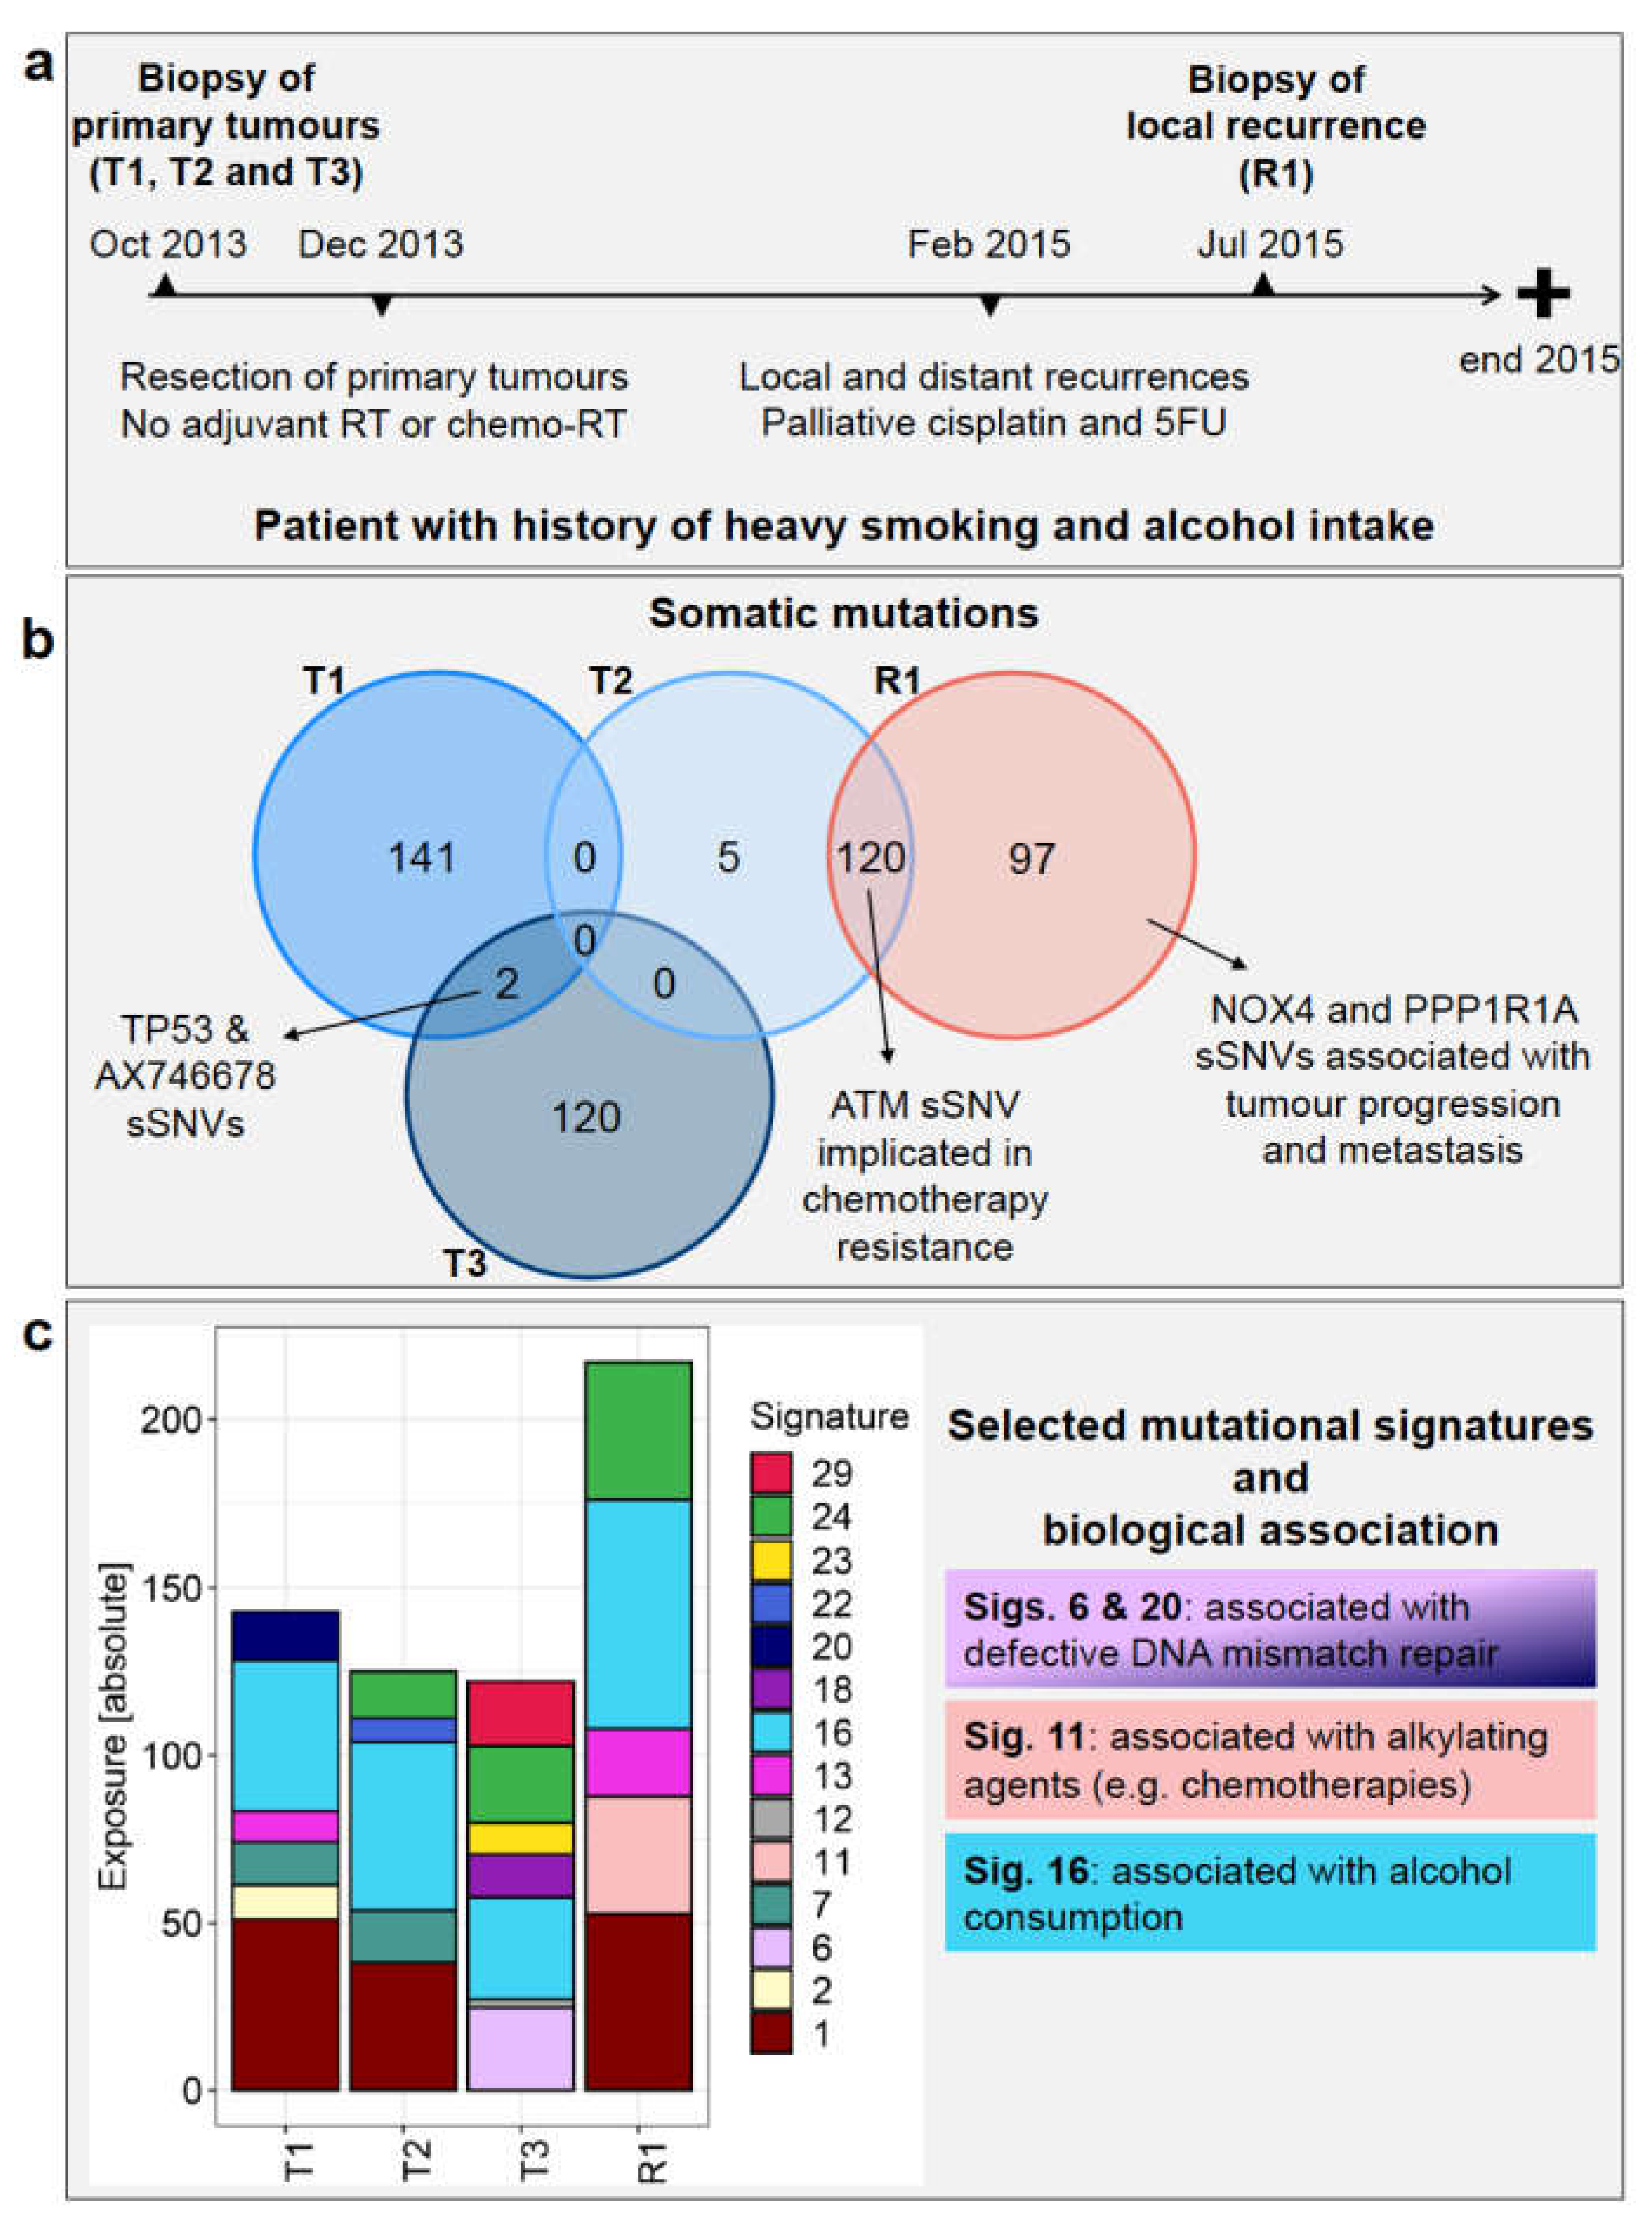
Case Description
2. Methods
2.1. Patient Samples
2.2. Next-Generation Sequencing Data
2.3. Bioinformatic Data Processing
2.4. Histology and Immunohistochemistry Assays
3. Results
3.1. Next-Generation Sequencing Read Number and Depth
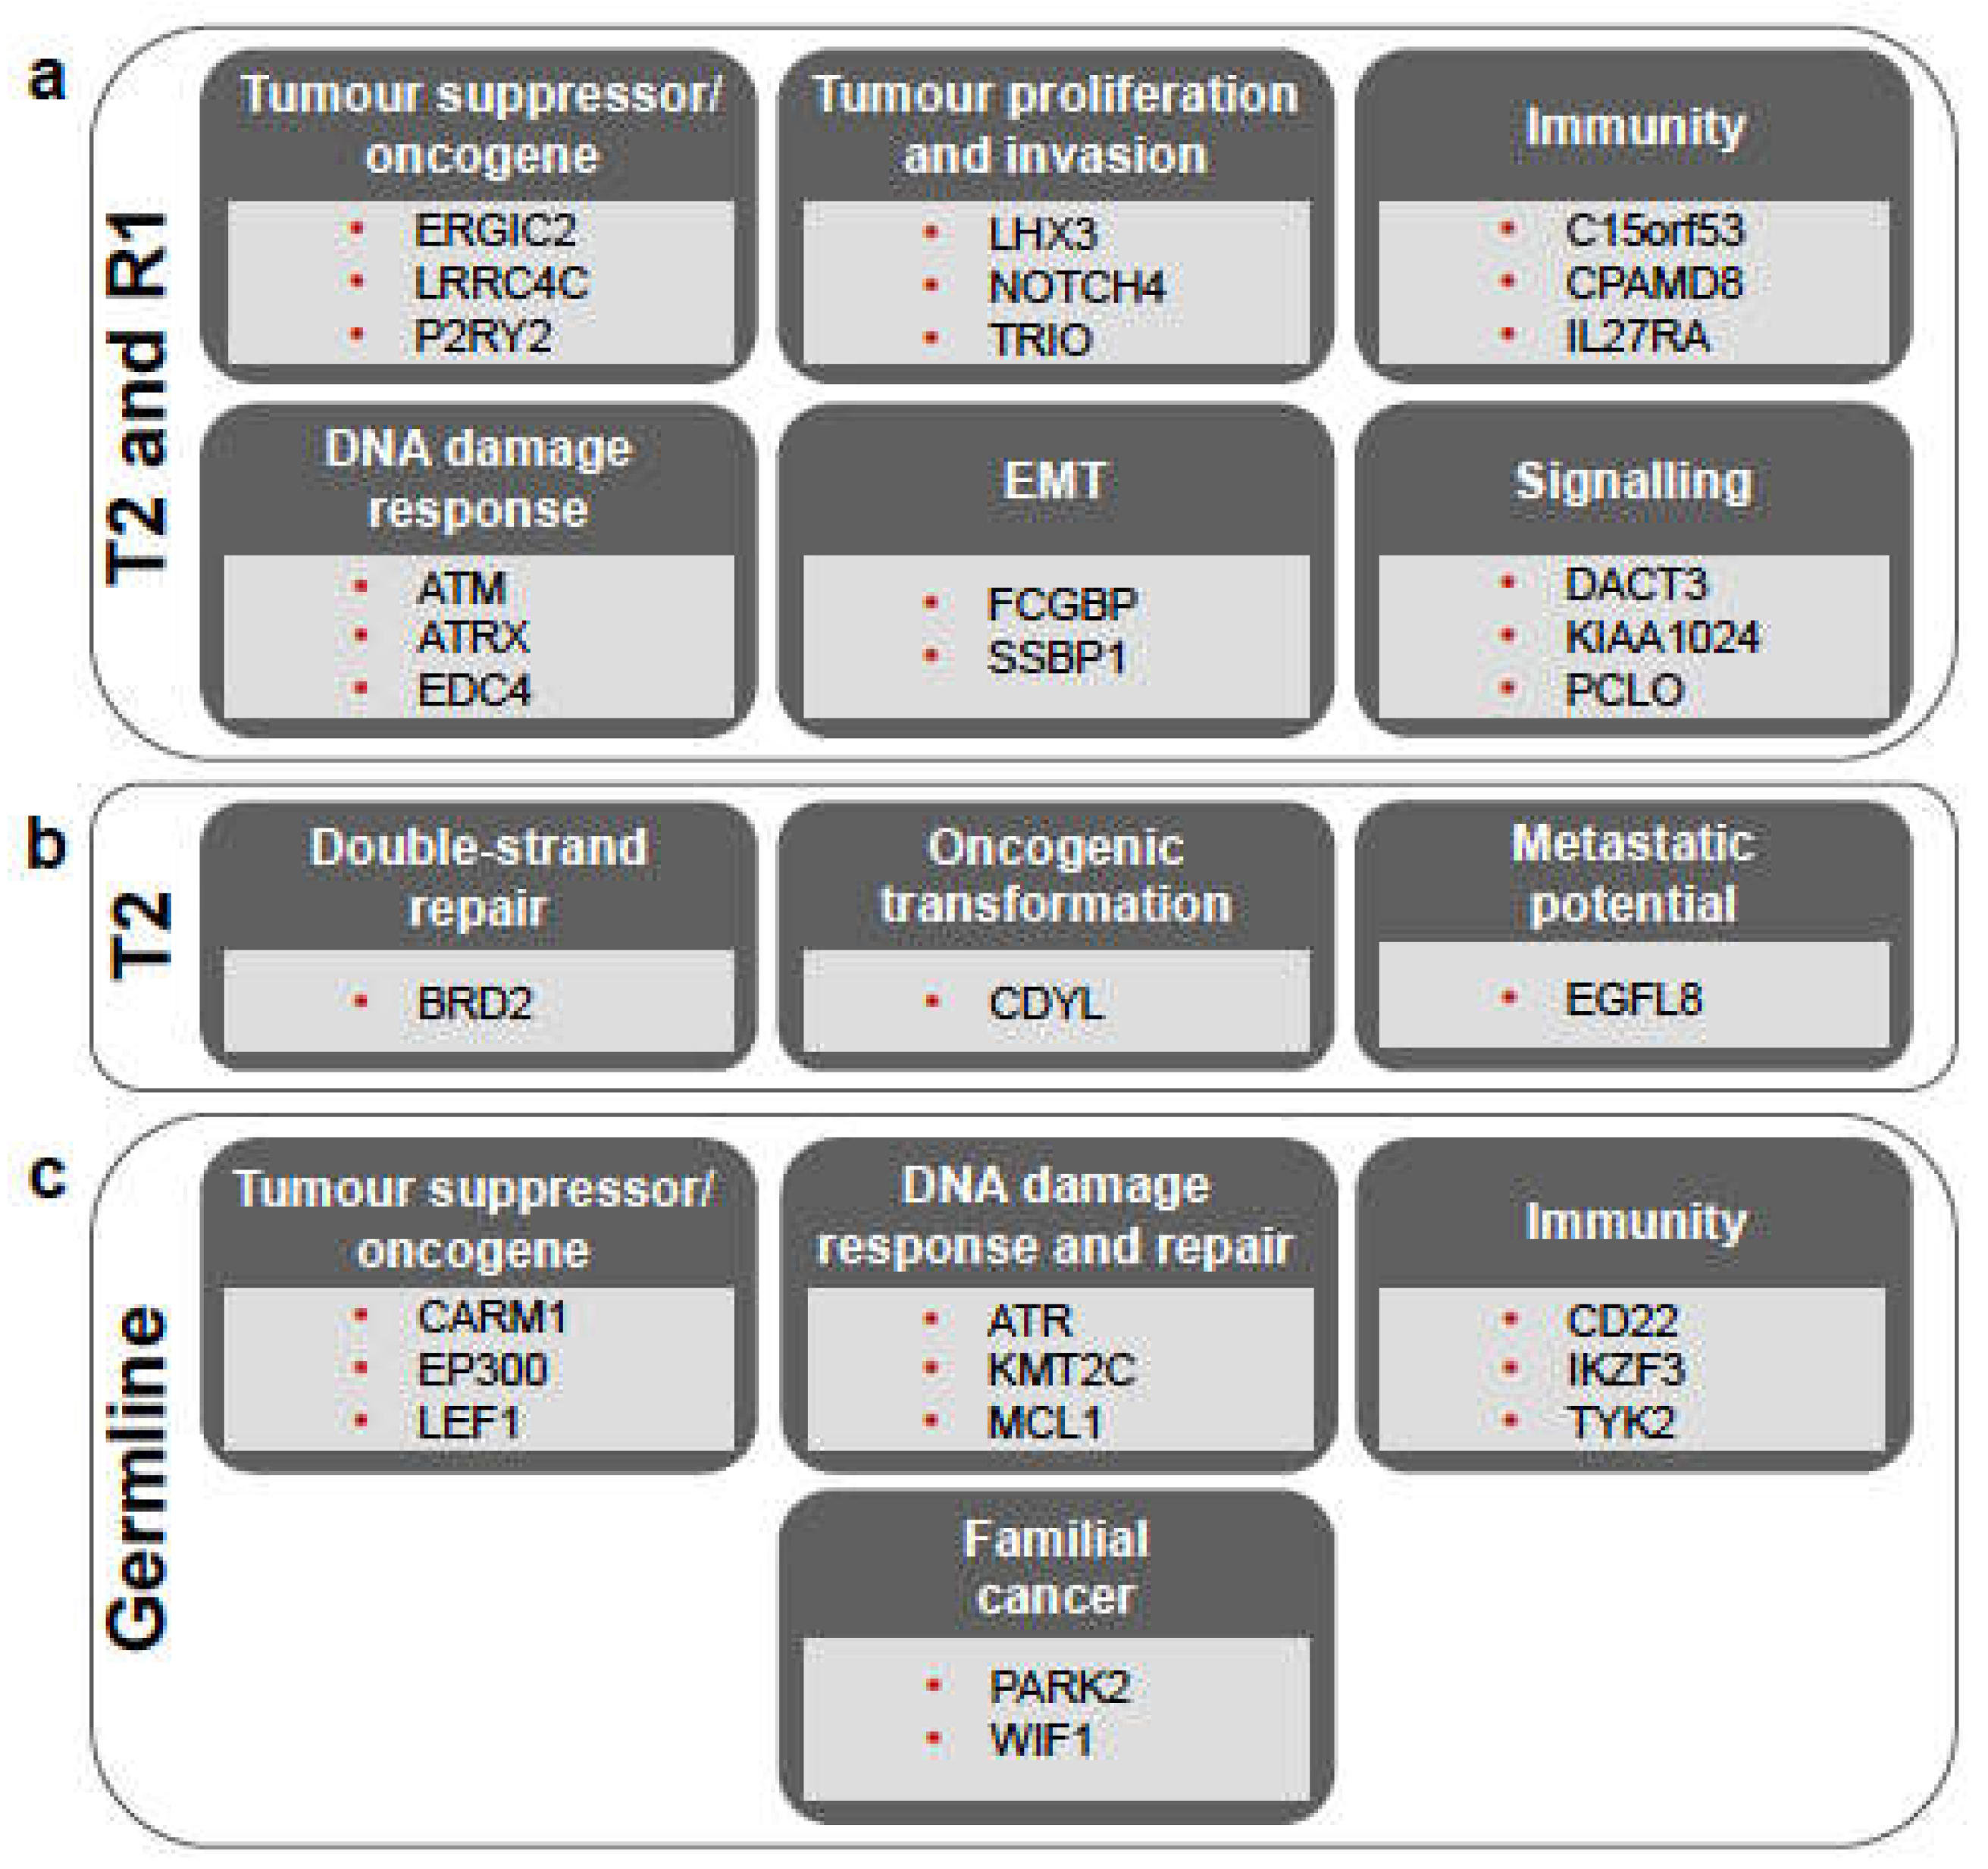
3.2. Somatic Mutations Reveal High Degree of Heterogeneity among Primary Tumours and the Origin of the Recurrence
3.3. Germline Variants Indicate Cancer Predisposition in the Patient
3.4. Mutational Signature Analysis Reflects Diverse Mechanisms Involved in Both Tumorigenesis and Patient History
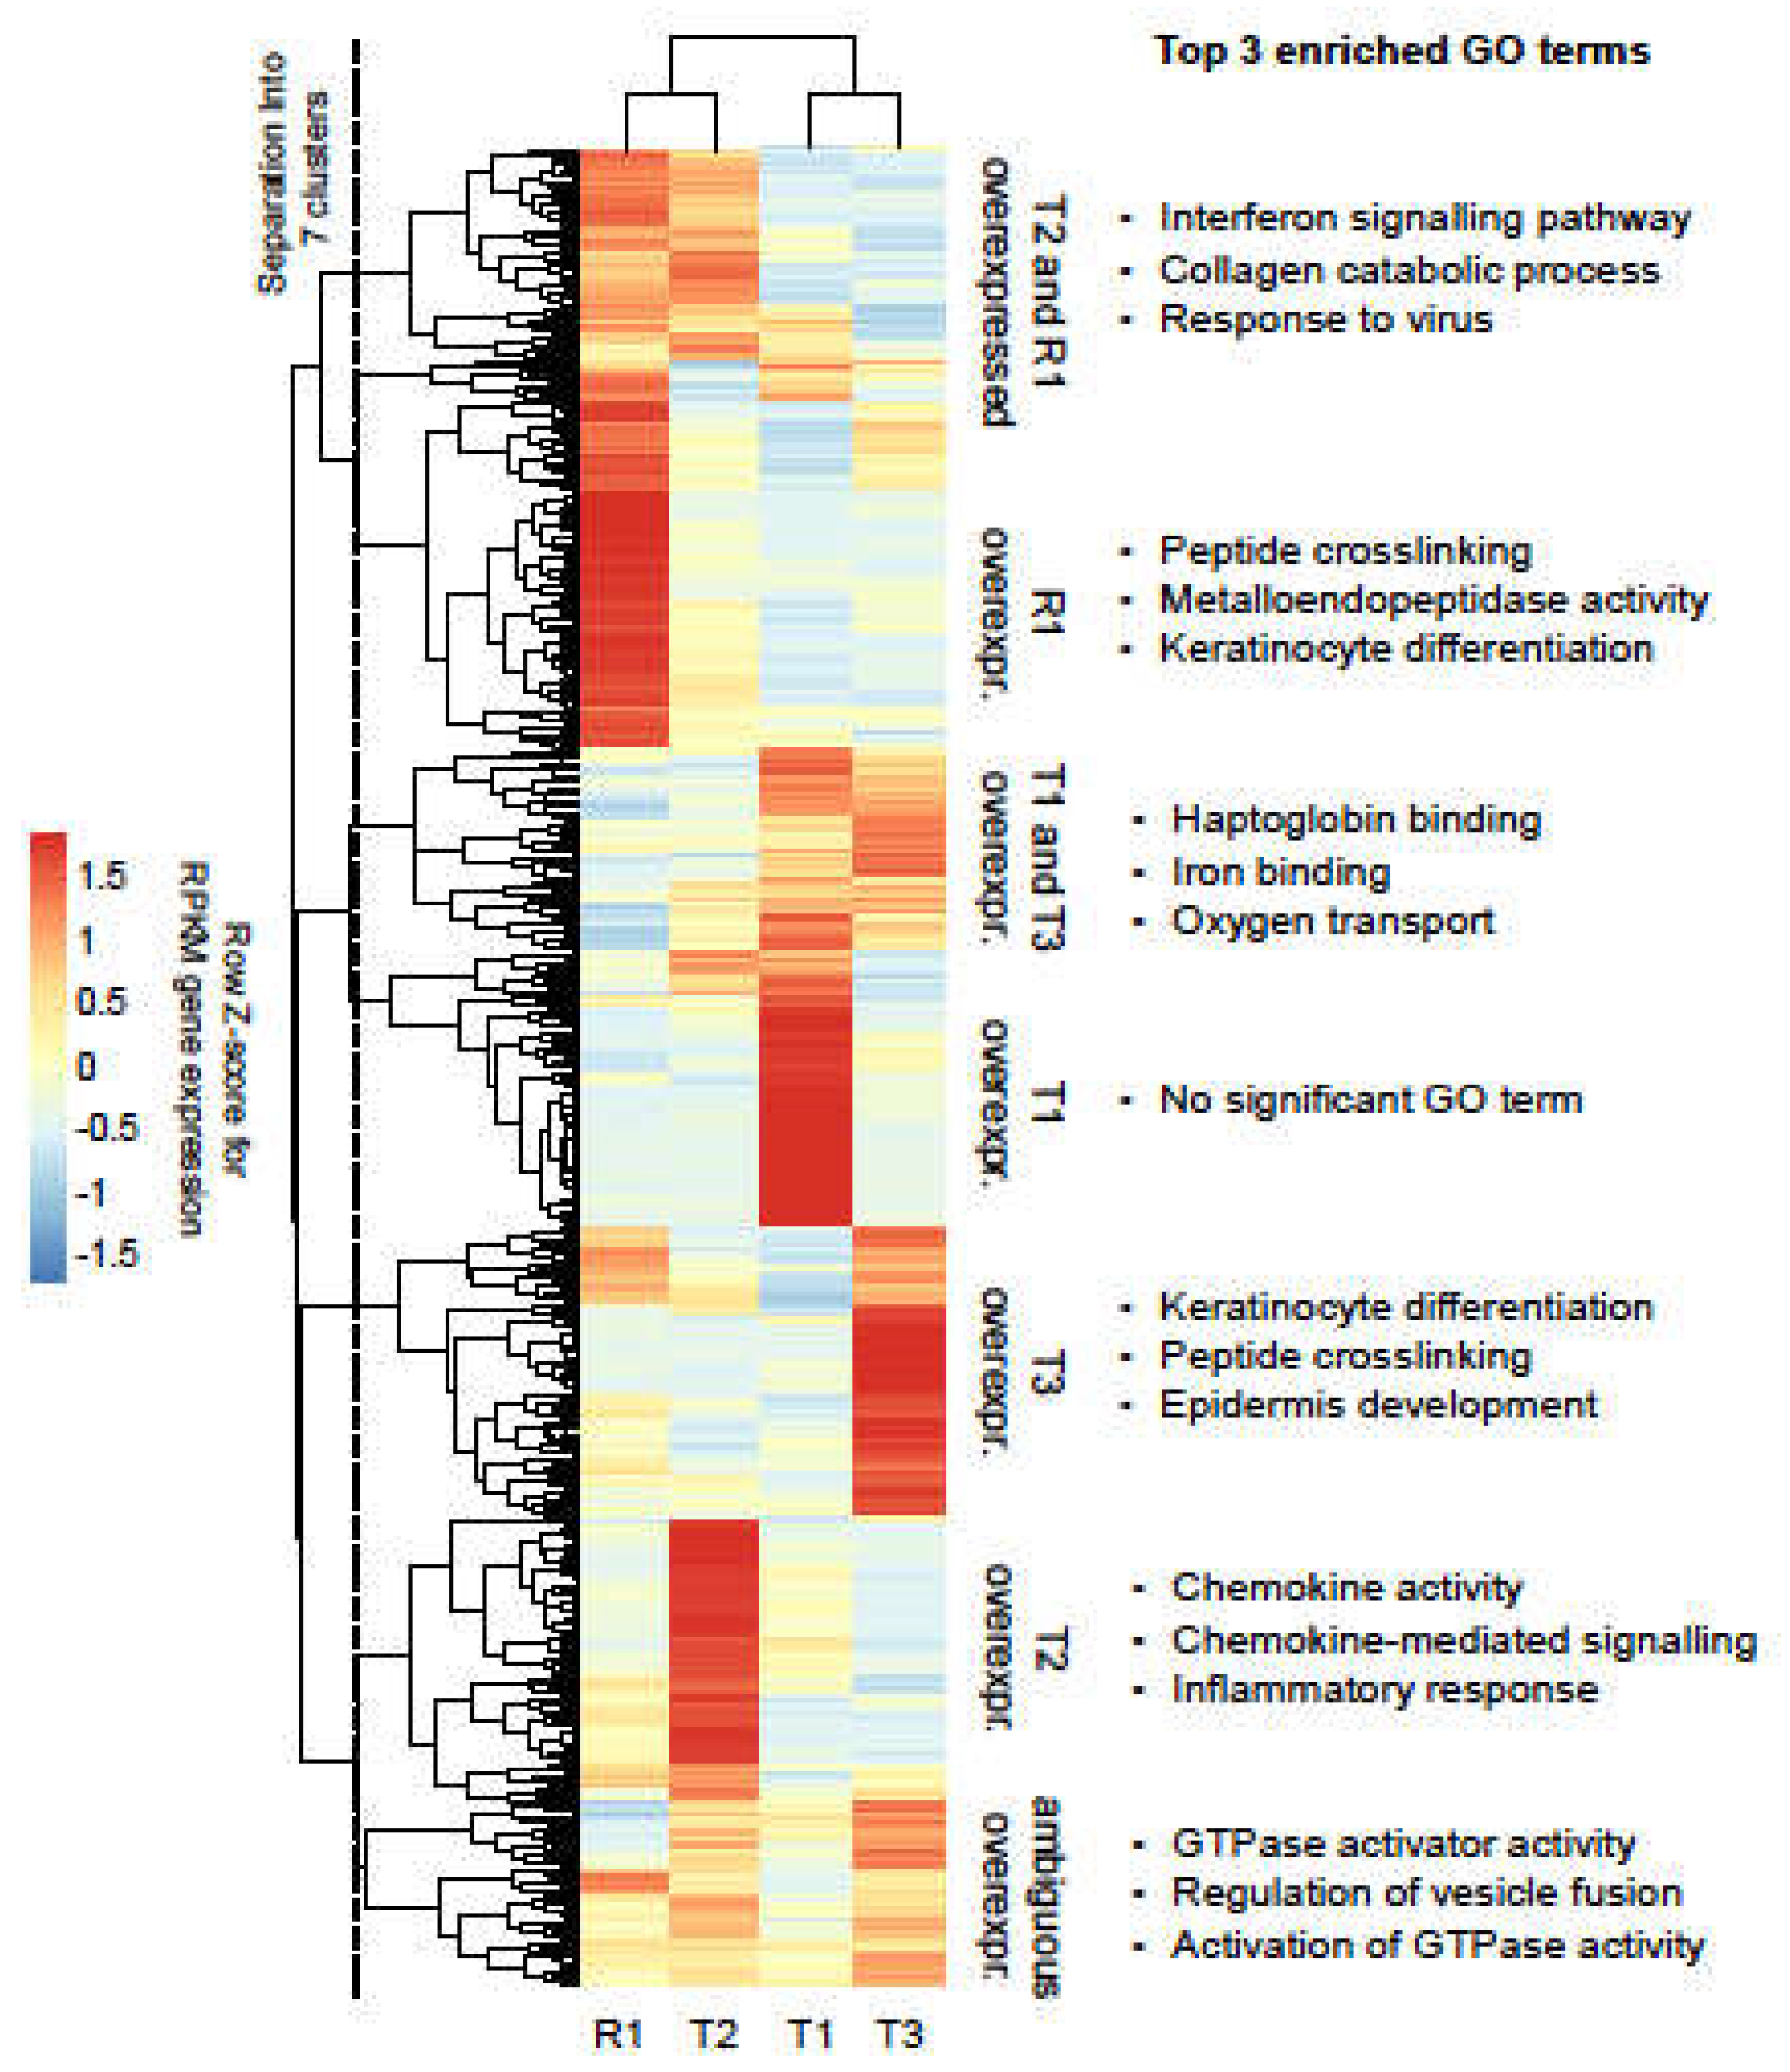
3.5. Heterogeneity across Tumour Samples Is Observed in Gene Expression Patterns
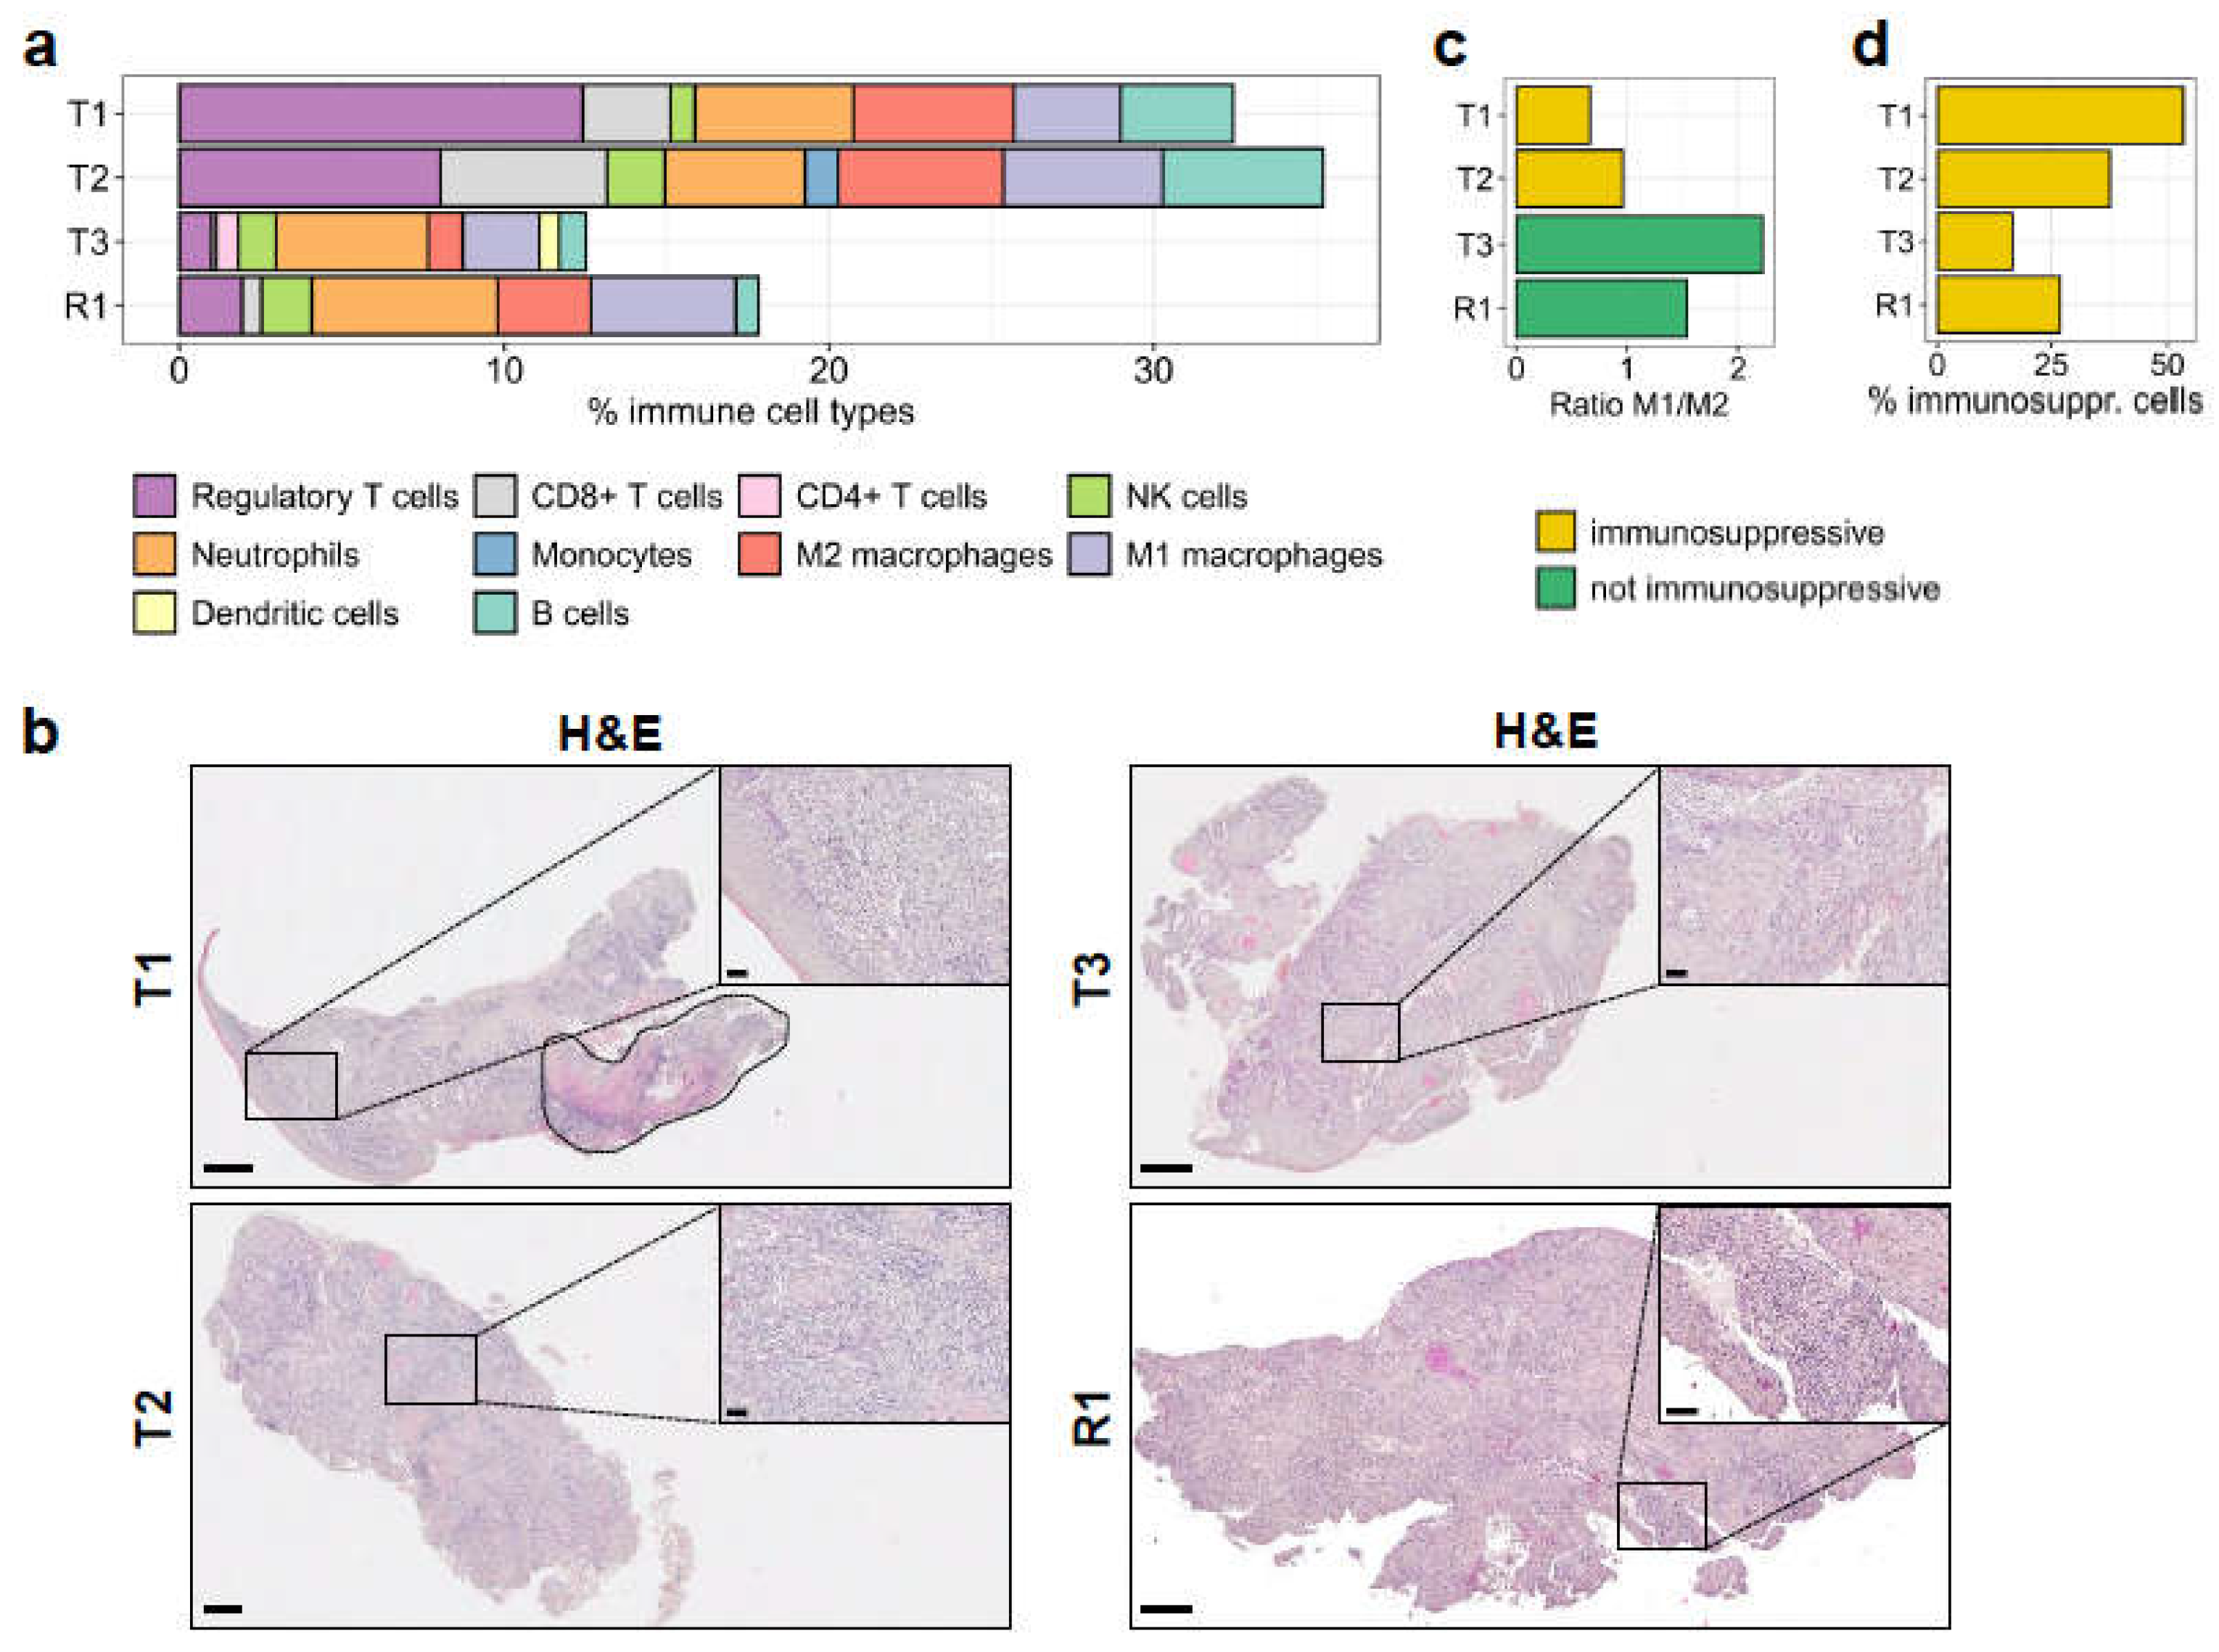
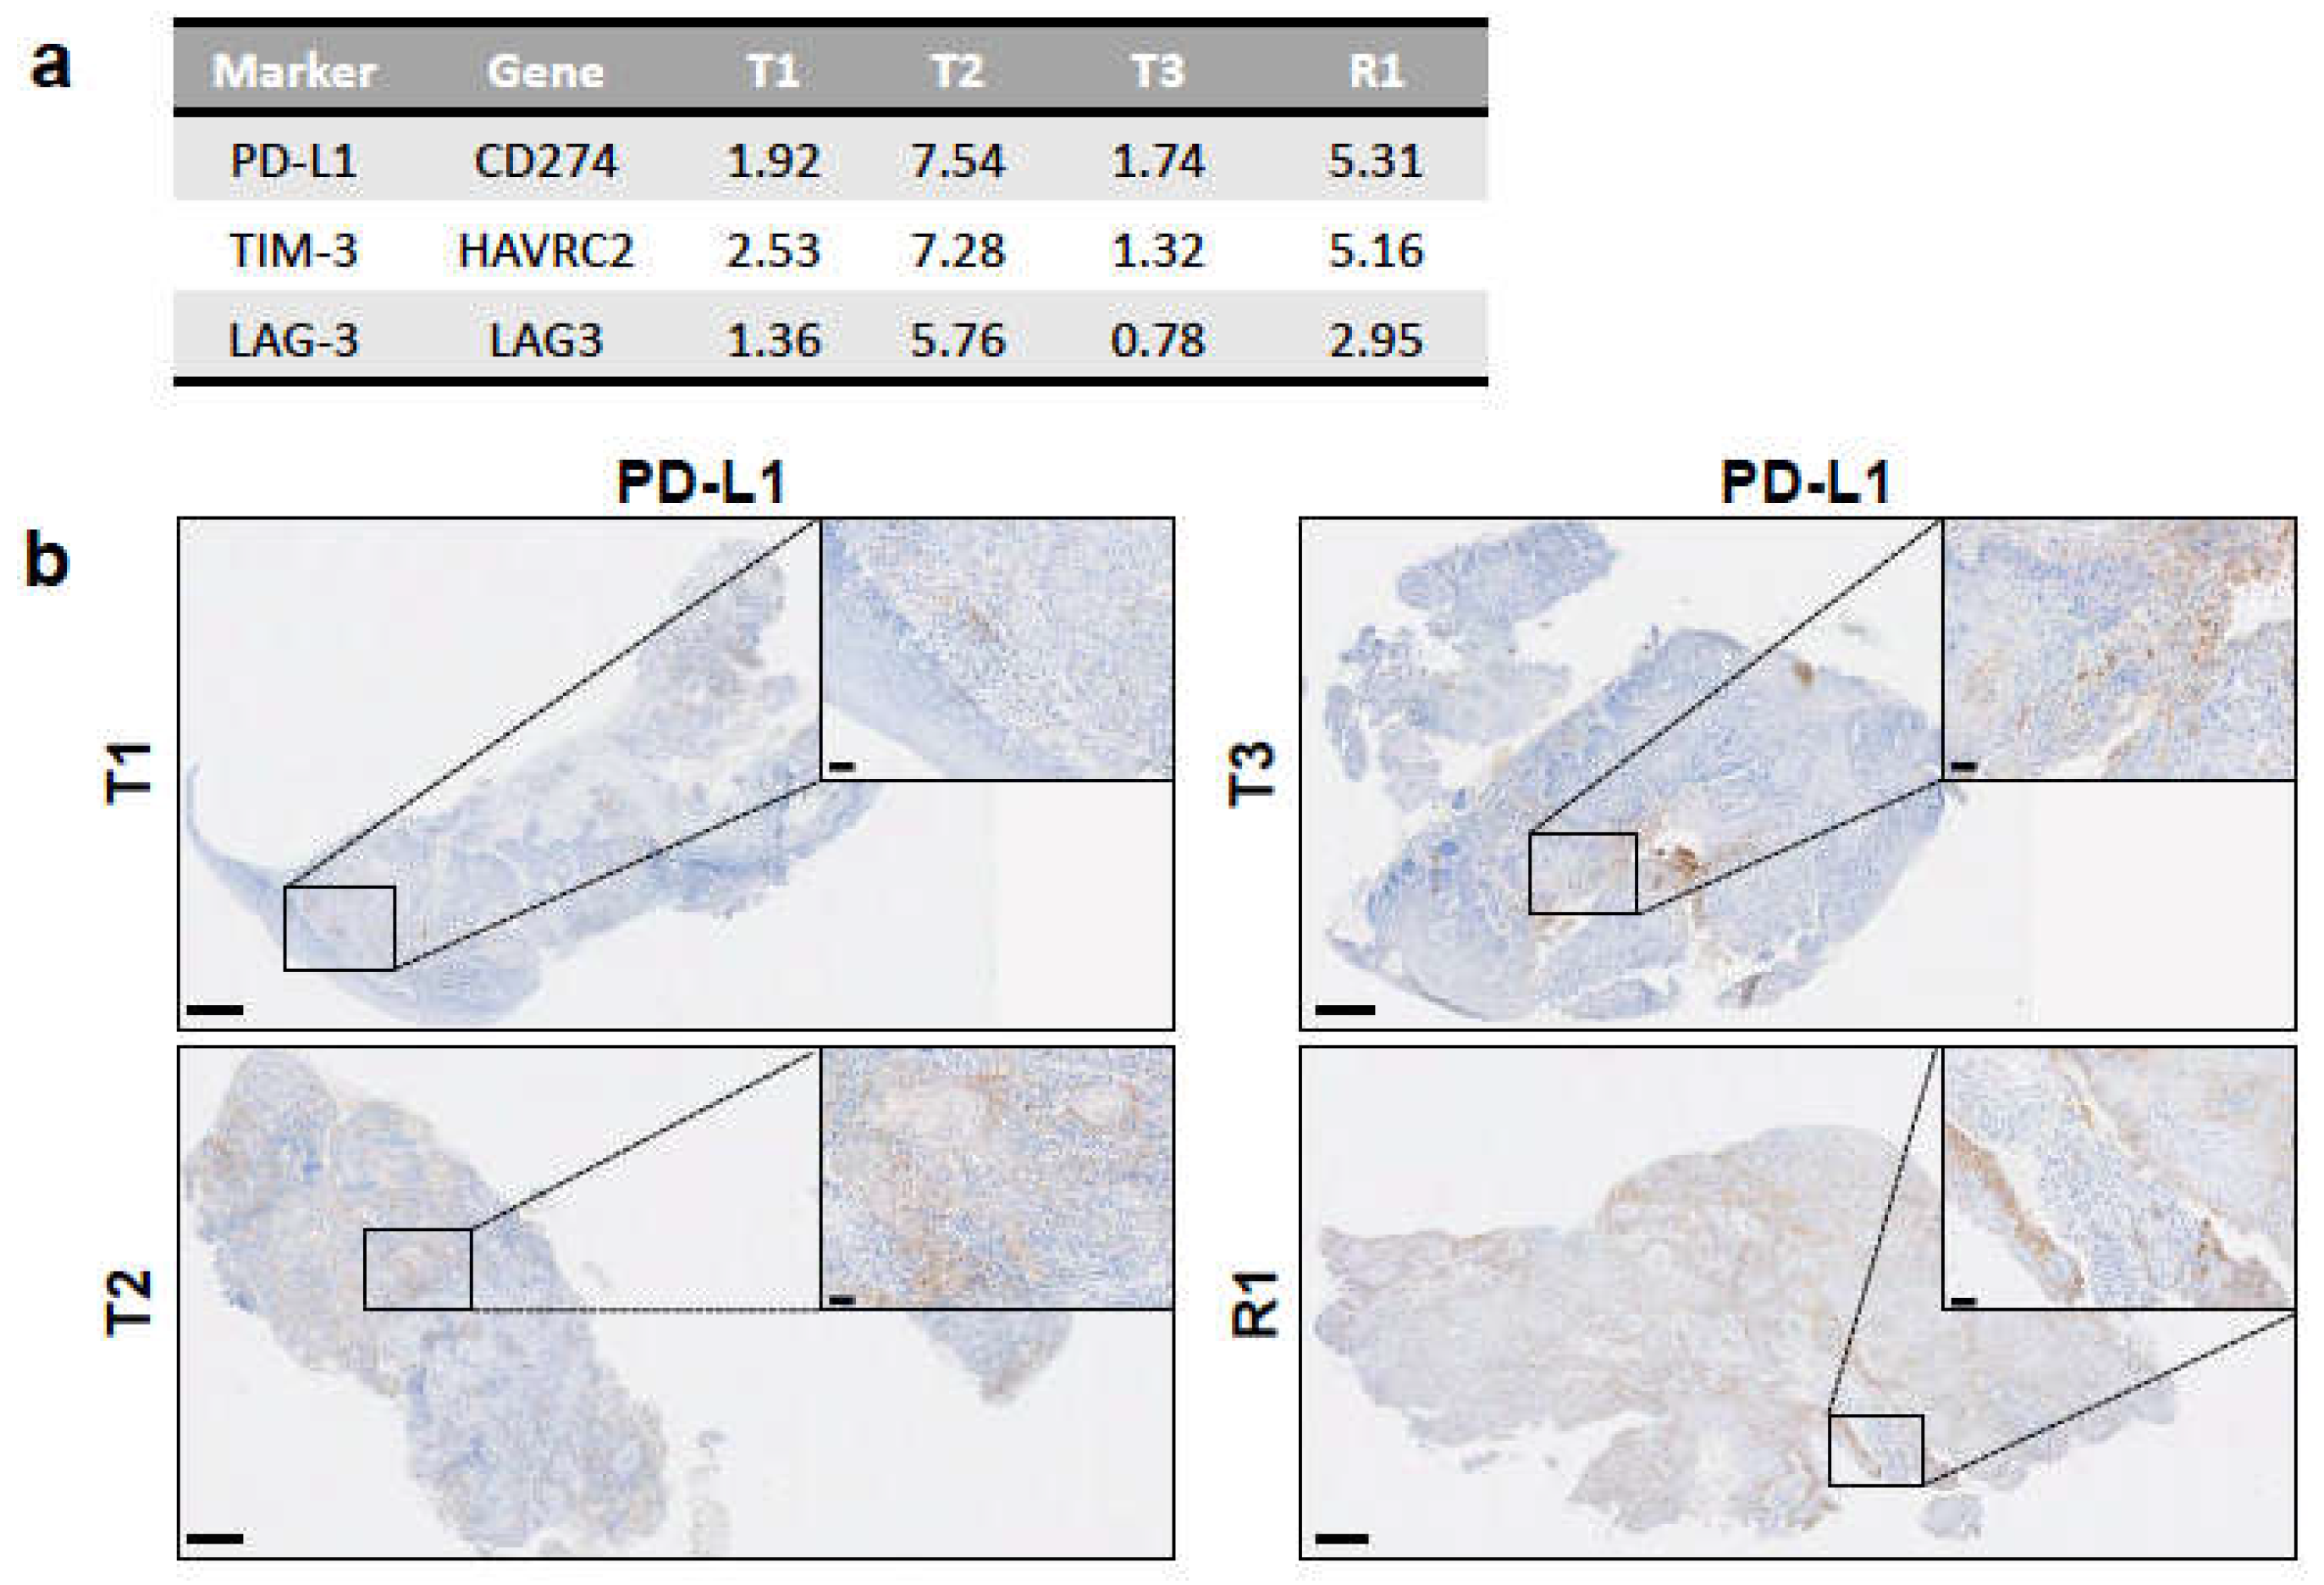
3.6. Immune Infiltration in the Tumours Correlates with an Immunosuppressive Environment
4. Discussion
Supplementary Materials
Author Contributions
Funding
Institutional Review Board Statement
Informed Consent Statement
Data Availability Statement
Acknowledgments
Conflicts of Interest
References
- Vokes, E.E.; Agrawal, N.; Seiwert, T.Y. HPV-Associated Head and Neck Cancer. J. Natl. Cancer Inst. 2015, 107, djv344. [Google Scholar] [CrossRef] [Green Version]
- Morris, L.G.; Sikora, A.G.; Hayes, R.B.; Patel, S.G.; Ganly, I. Anatomic sites at elevated risk of second primary cancer after an index head and neck cancer. Cancer Causes Control 2011, 22, 671–679. [Google Scholar] [CrossRef] [PubMed] [Green Version]
- Quer, M.; Diez, S.; León, X.; Orús, C.; López-Pousa, A.; Burgués, J. Second neoplasm in patients with head and neck cancer. Head Neck 1999, 21, 204–210. [Google Scholar] [CrossRef]
- Sturgis, E.M.; Miller, R.H. Second Primary Malignancies in the Head and Neck Cancer Patient. Ann. Otol. Rhinol. Laryngol. 1995, 104, 946–954. [Google Scholar] [CrossRef]
- Suk, R.; Mahale, P.; Sonawane, K.; Sikora, A.G.; Chhatwal, J.; Schmeler, K.M.; Sigel, K.; Cantor, S.B.; Chiao, E.Y.; Deshmukh, A.A. Trends in Risks for Second Primary Cancers Associated with Index Human Papillomavirus–Associated Cancers. JAMA Netw. Open 2018, 1, e181999. [Google Scholar] [CrossRef] [PubMed] [Green Version]
- Jain, K.S.; Sikora, A.G.; Baxi, S.S.; Morris, L.G. Synchronous cancers in patients with head and neck cancer: Risks in the era of human papillomavirus-associated oropharyngeal cancer. Cancer 2013, 119, 1832–1837. [Google Scholar] [CrossRef] [PubMed]
- Li, H.; Durbin, R. Fast and accurate short read alignment with Burrows-Wheeler transform. Bioinformatics 2009, 25, 1754–1760. [Google Scholar] [CrossRef] [PubMed] [Green Version]
- Sahin, U.; Derhovanessian, E.; Miller, M.; Kloke, B.-P.; Simon, P.; Löwer, M.; Bukur, V.; Tadmor, A.D.; Luxemburger, U.; Schrörs, B.; et al. Personalized RNA mutanome vaccines mobilize poly-specific therapeutic immunity against cancer. Nat. Cell Biol. 2017, 547, 222–226. [Google Scholar] [CrossRef]
- R Core Team. R: A Language and Environment for Statistical Computing; R Foundation for Statistical Computing: Vienna, Austria, 2018. [Google Scholar]
- Huebschmann, D.G.Z.; Schlesner, M. YAPSA: Yet Another Package for Signature Analysis; R Package Version 1.12.0; R Foundation for Statistical Computing: Vienna, Austria, 2019. [Google Scholar]
- Boeva, V.P.T.; Bleakley, K.; Chiche, P.; Cappo, J.; Schleiermacher, G.; Janoueix-Lerosey, I.; Delattre, O.; Barillot, E. Control-FREEC: A tool for assessing copy number and allelic content using next-generation sequencing data. Bioinformatics 2012, 28, 423–425. [Google Scholar] [CrossRef]
- Poplin, R.; Chang, P.-C.; Alexander, D.; Schwartz, S.; Colthurst, T.; Ku, A.; Newburger, D.; Dijamco, J.; Nguyen, N.-P.; Afshar, P.T.; et al. A universal SNP and small-indel variant caller using deep neural networks. Nat. Biotechnol. 2018, 36, 983–987. [Google Scholar] [CrossRef]
- Li, H. A statistical framework for SNP calling, mutation discovery, association mapping and population genetical parameter estimation from sequencing data. Bioinformatics 2011, 27, 2987–2993. [Google Scholar] [CrossRef] [Green Version]
- Cingolani, P.; Platts, A.; Wang, L.L.; Coon, M.; Nguyen, T.; Wang, L.; Land, S.J.; Lu, X.; Ruden, D.M. A program for annotating and predicting the effects of single nucleotide polymorphisms, SnpEff: SNPs in the genome of Drosophila melanogaster strain w1118; iso-2; iso-3. Fly 2012, 6, 80–92. [Google Scholar] [CrossRef] [PubMed] [Green Version]
- Wang, K.; Li, M.; Hakonarson, H. ANNOVAR: Functional annotation of genetic variants from high-throughput sequencing data. Nucleic Acids Res. 2010, 38, e164. [Google Scholar] [CrossRef] [PubMed]
- Chakravarty, D.; Gao, J.; Phillips, S.M.; Kundra, R.; Zhang, H.; Wang, J.; Rudolph, J.E.; Yaeger, R.; Soumerai, T.; Nissan, M.H.; et al. OncoKB: A Precision Oncology Knowledge Base. JCO Precis. Oncol. 2017, 1, 1–16. [Google Scholar] [CrossRef] [PubMed]
- Karczewski, K.J.; Francioli, L.C.; Tiao, G.; Cummings, B.B.; Alföldi, J.; Wang, Q.; Collins, R.L.; Laricchia, K.M.; Ganna, A.; Birnbaum, D.P.; et al. The mutational constraint spectrum quantified from variation in 141,456 humans. Nature 2020, 581, 434–443. [Google Scholar] [CrossRef] [PubMed]
- Dobin, A.; Davis, C.A.; Schlesinger, F.; Drenkow, J.; Zaleski, C.; Jha, S.; Batut, P.; Chaisson, M.; Gingeras, T. STAR: Ultrafast universal RNA-seq aligner. Bioinformatics 2012, 29, 15–21. [Google Scholar] [CrossRef] [PubMed]
- Mortazavi, A.; Williams, B.; McCue, K.; Schaeffer, L.; Wold, B.J. Mapping and quantifying mammalian transcriptomes by RNA-Seq. Nat. Methods 2008, 5, 621–628. [Google Scholar] [CrossRef] [PubMed]
- Huang, D.W.; Sherman, B.T.; Lempicki, R.A. Systematic and integrative analysis of large gene lists using DAVID bioinformatics resources. Nat. Protoc. 2009, 4, 44–57. [Google Scholar] [CrossRef] [PubMed]
- Huang, D.W.; Sherman, B.T.; Lempicki, R.A. Bioinformatics enrichment tools: Paths toward the comprehensive functional analysis of large gene lists. Nucleic Acids Res. 2009, 37, 1–13. [Google Scholar] [CrossRef] [Green Version]
- Finotello, F.; Mayer, C.; Plattner, C.; Laschober, G.; Rieder, D.; Hackl, H.; Krogsdam, A.; Loncova, Z.; Posch, W.; Wilflingseder, D.; et al. Molecular and pharmacological modulators of the tumor immune contexture revealed by deconvolution of RNA-seq data. Genome Med. 2019, 11, 34. [Google Scholar] [CrossRef] [Green Version]
- Hernández, G.; Ramírez, M.J.; Minguillón, J.; Quiles, P.; de Garibay, G.R.; Aza-Carmona, M.; Bogliolo, M.; Pujol, R.; Prados, R.; Fernández, J.; et al. Decapping protein EDC4 regulates DNA repair and phenocopies BRCA1. Nat. Commun. 2018, 9, 1–11. [Google Scholar] [CrossRef] [Green Version]
- Lin, X.-L.; Yang, L.; Fu, S.-W.; Lin, W.-F.; Gao, Y.-J.; Chen, H.-Y.; Ge, Z.-Z. Overexpression of NOX4 predicts poor prognosis and promotes tumor progression in human colorectal cancer. Oncotarget 2017, 8, 33586–33600. [Google Scholar] [CrossRef] [PubMed] [Green Version]
- Luo, W.; Xu, C.; Ayello, J.; Cruz, F.D.; Rosenblum, J.M.; Lessnick, S.L.; Cairo, M.S. Protein phosphatase 1 regulatory subunit 1A in ewing sarcoma tumorigenesis and metastasis. Oncogene 2017, 37, 798–809. [Google Scholar] [CrossRef]
- Diagouraga, B.; Clement, J.A.; Duret, L.; Kadlec, J.; de Massy, B.; Baudat, F. PRDM9 Methyltransferase Activity is Essential for Meiotic DNA Double-Strand Break Formation at its Binding Sites. Mol. Cell 2018, 69, 853–865. [Google Scholar] [CrossRef] [Green Version]
- Feng, Y.; Li, X.; Cassady, K.; Zou, Z.; Zhang, X. TET2 Function in Hematopoietic Malignancies, Immune Regulation, and DNA Repair. Front. Oncol. 2019, 9, 210. [Google Scholar] [CrossRef] [PubMed] [Green Version]
- Yang, J.; Yan, J.; Liu, B. Targeting VEGF/VEGFR to Modulate Antitumor Immunity. Front. Immunol. 2018, 9, 978. [Google Scholar] [CrossRef] [PubMed] [Green Version]
- Yamashita, M.; Hirahara, K.; Shinnakasu, R.; Hosokawa, H.; Norikane, S.; Kimura, M.Y.; Hasegawa, A.; Nakayama, T. Crucial Role of MLL for the Maintenance of Memory T Helper Type 2 Cell Responses. Immunity 2006, 24, 611–622. [Google Scholar] [CrossRef] [Green Version]
- Rébé, C.; Ghiringhelli, F. STAT3, a Master Regulator of Anti-Tumor Immune Response. Cancers 2019, 11, 1280. [Google Scholar] [CrossRef] [PubMed] [Green Version]
- Anderson, K.; Ryan, N.; Volpedo, G.; Varikuti, S.; Satoskar, A.R.; Oghumu, S. Immune Suppression Mediated by STAT4 Deficiency Promotes Lymphatic Metastasis in HNSCC. Front. Immunol. 2020, 10, 3095. [Google Scholar] [CrossRef] [PubMed] [Green Version]
- Watson, S.F.; Bellora, N.; Macias, S. ILF3 contributes to the establishment of the antiviral type I interferon program. Nucleic Acids Res. 2019, 48, 116–129. [Google Scholar] [CrossRef]
- Lin, J.; Zhu, Z.; Xiao, H.; Wakefield, M.R.; Ding, V.A.; Bai, Q.; Fang, Y. The role of IL-7 in Immunity and Cancer. Anticancer. Res. 2017, 37, 963–968. [Google Scholar] [CrossRef] [Green Version]
- Xu, Y.; Sun, Y.; Jiang, X.; Ayrapetov, M.K.; Moskwa, P.; Yang, S.; Weinstock, D.M.; Price, B.D. The p400 ATPase regulates nucleosome stability and chromatin ubiquitination during DNA repair. J. Cell Biol. 2010, 191, 31–43. [Google Scholar] [CrossRef] [Green Version]
- Zhao, H.; Jin, S.; Fan, F.; Fan, W.; Tong, T.; Zhan, Q. Activation of the transcription factor Oct-1 in response to DNA damage. Cancer Res. 2000, 60, 6276–6280. [Google Scholar] [PubMed]
- Xiong, D.; Wang, Y.; Kupert, E.; Simpson, C.; Pinney, S.M.; Gaba, C.R.; Mandal, D.; Schwartz, A.G.; Yang, P.; de Andrade, M.; et al. A Recurrent Mutation in PARK2 is Associated with Familial Lung Cancer. Am. J. Hum. Genet. 2015, 96, 301–308. [Google Scholar] [CrossRef] [PubMed] [Green Version]
- Wei, C.; Peng, B.; Han, Y.; Chen, W.V.; Rother, J.; Tomlinson, G.E.; Boland, C.R.; Chaussabel, M.; Frazier, M.L.; Amos, C.I. Mutations of HNRNPA0 and WIF1 predispose members of a large family to multiple cancers. Fam. Cancer 2015, 14, 297–306. [Google Scholar] [CrossRef] [PubMed] [Green Version]
- Alexandrov, L.B.; Abidin, S.N.-Z.; Wedge, D.C.; Aparicio, S.A.; Behjati, S.; Biankin, A.V.; Bignell, G.R.; Bolli, N.; Borg, A.; Børresen-Dale, A.-L.; et al. Signatures of mutational processes in human cancer. Nature 2018, 500, 415–421. [Google Scholar] [CrossRef] [PubMed] [Green Version]
- Tate, J.G.; Jubb, B.S.; Sondka, H.C.; Beare, Z.; Bindal, D.M.; Boutselakis, N.; Cole, H.; Creatore, C.G.; Dawson, C.; Fish, E.; et al. COSMIC: The Catalogue of Somatic Mutations in Cancer. Nucleic Acids Res. 2018, 47, D941–D947. [Google Scholar] [CrossRef] [PubMed] [Green Version]
- Li, X.; Wang, M.; Yang, M.; Dai, H.; Zhang, B.; Wang, W.; Chu, X.; Wang, X.; Zheng, H.; Niu, R.; et al. A mutational signature associated with alcohol consumption and prognostically significantly mutated driver genes in esophageal squamous cell carcinoma. Ann. Oncol. 2018, 29, 938–944. [Google Scholar] [CrossRef] [PubMed]
- Choi, M.; Kipps, T.; Kurzrock, R. ATM Mutations in Cancer: Therapeutic Implications. Mol. Cancer Ther. 2016, 15, 1781–1791. [Google Scholar] [CrossRef] [PubMed] [Green Version]
- Liu, Y.; Zhang, J.; Li, L.; Yin, G.; Zhang, J.; Zheng, S.; Cheung, H.; Wu, N.; Lu, N.; Mao, X.; et al. Genomic heterogeneity of multiple synchronous lung cancer. Nat. Commun. 2016, 7, 13200. [Google Scholar] [CrossRef] [PubMed]
- Wang, X.; Fang, H.; Cheng, Y.; Li, L.; Sun, X.; Fu, T.; Huang, P.; Zhang, A.; Feng, Z.; Li, C.; et al. The molecular landscape of synchronous colorectal cancer reveals genetic heterogeneity. Carcinogenesis 2018, 39, 708–718. [Google Scholar] [CrossRef] [Green Version]
- Bao, Y.; Wu, J.; Zhang, J.; Yu, Y. Diagnosis and treatment of synchronous multiple primary lung cancer—A case report. OncoTargets Ther. 2019, 12, 4281–4285. [Google Scholar] [CrossRef] [Green Version]
- Lord, C.J.; Ashworth, A. PARP inhibitors: Synthetic lethality in the clinic. Science 2017, 355, 1152–1158. [Google Scholar] [CrossRef]
- Gibney, G.T.; Weiner, L.M.; Atkins, M.B. Predictive biomarkers for checkpoint inhibitor-based immunotherapy. Lancet Oncol. 2016, 17, e542–e551. [Google Scholar] [CrossRef] [Green Version]
- Juneja, V.R.; McGuire, K.A.; Manguso, R.T.; LaFleur, M.W.; Collins, N.; Haining, W.N.; Freeman, G.J.; Sharpe, A.H. PD-L1 on tumor cells is sufficient for immune evasion in immunogenic tumors and inhibits CD8 T cell cytotoxicity. J. Exp. Med. 2017, 214, 895–904. [Google Scholar] [CrossRef] [PubMed]
- Mouw, K.W.; Goldberg, M.S.; Konstantinopoulos, P.A.; D’Andrea, A.D. DNA Damage and Repair Biomarkers of Immunotherapy Response. Cancer Discov. 2017, 7, 675–693. [Google Scholar] [CrossRef] [PubMed] [Green Version]
- Genard, G.; Lucas, S.; Michiels, C. Reprogramming of Tumor-Associated Macrophages with Anticancer Therapies: Radiotherapy versus Chemo- and Immunotherapies. Front. Immunol. 2017, 8, 828. [Google Scholar] [CrossRef] [PubMed] [Green Version]
- Wanderley, C.W.; Colon, D.F.; Luiz, J.P.M.; Oliveira, F.F.; Viacava, P.R.; Leite, C.A.; Pereira, J.; Silva, C.M.; Silva, C.R.; Silva, R.L.; et al. Paclitaxel reduces tumor growth by reprogramming tumor-associated macrophages to an M1- profile in a TLR4-dependent manner. Cancer Res. 2018, 78, 5891–5900. [Google Scholar] [CrossRef] [Green Version]
- Haffner, M.C.; Mosbruger, T.; Esopi, D.M.; Fedor, H.; Heaphy, C.M.; Walker, D.A.; Adejola, N.; Gürel, M.; Hicks, J.; Meeker, A.K.; et al. Tracking the clonal origin of lethal prostate cancer. J. Clin. Investig. 2013, 123, 4918–4922. [Google Scholar] [CrossRef] [Green Version]
- Brannon, A.R.; Sawyers, C.L. “N of 1” case reports in the era of whole-genome sequencing. J. Clin. Investig. 2013, 123, 4568–4570. [Google Scholar] [CrossRef] [Green Version]


| Sample | Type | All sSNVs (Non-Synonymous) | Purity | Tumour Area (%) | Tumour Nuclei (%) |
|---|---|---|---|---|---|
| Primary T1 | Biopsy | 143 (101) | 0.18 | 20 | 35 |
| Primary T2 | Biopsy | 125 (78) | 0.16 | 40 | 40 |
| Primary T3 | Biopsy | 122 (74) | 0.68 | 80 | 80 |
| Recurrence R1 | Biopsy | 217 (147) | ≤0.64 | 90 | 90 |
Publisher’s Note: MDPI stays neutral with regard to jurisdictional claims in published maps and institutional affiliations. |
© 2021 by the authors. Licensee MDPI, Basel, Switzerland. This article is an open access article distributed under the terms and conditions of the Creative Commons Attribution (CC BY) license (https://creativecommons.org/licenses/by/4.0/).
Share and Cite
Bresadola, L.; Weber, D.; Ritzel, C.; Löwer, M.; Bukur, V.; Akilli-Öztürk, Ö.; Becker, J.; Mehanna, H.; Schrörs, B.; Vascotto, F.; et al. Comprehensive Genomic and Transcriptomic Analysis of Three Synchronous Primary Tumours and a Recurrence from a Head and Neck Cancer Patient. Int. J. Mol. Sci. 2021, 22, 7583. https://0-doi-org.brum.beds.ac.uk/10.3390/ijms22147583
Bresadola L, Weber D, Ritzel C, Löwer M, Bukur V, Akilli-Öztürk Ö, Becker J, Mehanna H, Schrörs B, Vascotto F, et al. Comprehensive Genomic and Transcriptomic Analysis of Three Synchronous Primary Tumours and a Recurrence from a Head and Neck Cancer Patient. International Journal of Molecular Sciences. 2021; 22(14):7583. https://0-doi-org.brum.beds.ac.uk/10.3390/ijms22147583
Chicago/Turabian StyleBresadola, Luisa, David Weber, Christoph Ritzel, Martin Löwer, Valesca Bukur, Özlem Akilli-Öztürk, Julia Becker, Hisham Mehanna, Barbara Schrörs, Fulvia Vascotto, and et al. 2021. "Comprehensive Genomic and Transcriptomic Analysis of Three Synchronous Primary Tumours and a Recurrence from a Head and Neck Cancer Patient" International Journal of Molecular Sciences 22, no. 14: 7583. https://0-doi-org.brum.beds.ac.uk/10.3390/ijms22147583