Article

Expression of Low Level of VPS35-mCherry Fusion Protein Diminishes Vps35 Depletion Induced Neuron Terminal Differentiation Deficits and Neurodegenerative Pathology, and Prevents Neonatal Death

1
Department of Neurosciences, School of Medicine, Case Western Reserve University, Cleveland, OH 44106, USA
2
Department of Neuroscience and Regenerative Medicine, Medical College of Georgia, Augusta University, Augusta, GA 30912, USA
*
Author to whom correspondence should be addressed.
Int. J. Mol. Sci. 2021, 22(16), 8394; https://0-doi-org.brum.beds.ac.uk/10.3390/ijms22168394
Submission received: 27 May 2021 / Revised: 31 July 2021 / Accepted: 2 August 2021 / Published: 4 August 2021
(This article belongs to the Special Issue Gene Therapy for Neurodegenerative Disease)

Abstract

:
Vps35 (vacuolar protein sorting 35) is a key component of retromer that consists of Vps35, Vps26, and Vps29 trimers, and sortin nexin dimers. Dysfunctional Vps35/retromer is believed to be a risk factor for development of various neurodegenerative diseases. Vps35Neurod6 mice, which selectively knock out Vps35 in Neurod6-Cre+ pyramidal neurons, exhibit age-dependent impairments in terminal differentiation of dendrites and axons of cortical and hippocampal neurons, neuro-degenerative pathology (i.e., increases in P62 and Tdp43 (TAR DNA-binding protein 43) proteins, cell death, and reactive gliosis), and neonatal death. The relationships among these phenotypes and the underlying mechanisms remain largely unclear. Here, we provide evidence that expression of low level of VPS35-mCherry fusion protein in Vps35Neurod6 mice could diminish the phenotypes in an age-dependent manner. Specifically, we have generated a conditional transgenic mouse line, LSL-Vps35-mCherry, which expresses VPS35-mCherry fusion protein in a Cre-dependent manner. Crossing LSL-Vps35-mCherry with Vps35Neurod6 to obtain TgVPS35-mCherry, Vps35Neurod6 mice prevent the neonatal death and diminish the dendritic morphogenesis deficit and gliosis at the neonatal, but not the adult age. Further studies revealed that the Vps35-mCherry transgene expression was low, and the level of Vps35 mRNA comprised only ~5–7% of the Vps35 mRNA of control mice. Such low level of VPS35-mCherry could restore the amount of other retromer components (Vps26a and Vps29) at the neonatal age (P14). Importantly, the neurodegenerative pathology presented in the survived adult TgVps35-mCherry; Vps35Neurod6 mice. These results demonstrate the sufficiency of low level of VPS35-mCherry fusion protein to diminish the phenotypes in Vps35Neurod6 mice at the neonatal age, verifying a key role of neuronal Vps35 in stabilizing retromer complex proteins, and supporting the view for Vps35 as a potential therapeutic target for neurodegenerative diseases.

1. Introduction

Retromer complex, a key endosomal protein sorting machinery, recognizes specific membrane cargo proteins that are concentrated in discrete regions of the endosomal membranes, and retrieves cargo proteins to the trans-Golgi network or the plasma membrane [1,2,3]. These functions are achieved by two sub-protein complexes of the retromer: One for the cargo-selection, and the other for membrane deformation. The cargo recognition retromer sub-protein complex consists of the vacuolar protein sorting (Vps) subunits, Vps26, Vps29, and Vps35. The membrane deformation sub-complex consists of sortin nexin (SNX) dimers [4,5]. A growing list of retromer cargos has been identified, which includes cation independent mannose 6-phosphate receptors (CI-MRP) [6,7], the Wnt transport protein Wntless/MIG-14 [8,9], sortilin or sortilin-related receptor (SorL1 or SorLA) [10,11,12,13], amyloid precursor protein (APP) [14,15], BACE1 [16,17], TREM2 [18,19], RANK [20]. Interestingly, many of these cargos are involved in the pathogenesis of neurodegenerative diseases. For example, while SorLA is a risk gene for late onset AD, sortilin is implicated in frontotemporal dementia (FTD), an early onset dementia that is characterized by atrophy of the frontal and/or temporal lobes of the cortex [21,22]. Thus, retromer is implicated in regulation of the development of neurodegenerative disorders.
Indeed, Vps35, a key component of retromer cargo recognition sub-complex, has been reported as an active player in the pathogenesis of neurodegenerative diseases [2,23,24]. Several lines of evidence suggest that loss of the Vps35 function contributes to the development of neurodegenerative diseases. First, Vps35 is decreased in postmortem hippocampus of patients with AD [25]. Second, deficiency of Vps35 in mice induces AD-, PD-, and FTD-relevant pathologies [16,26,27]. For example, genetic reduction of Vps35 in mouse models increases the production of β-amyloid peptide (Aβ) (a key pathological factor of AD), synaptic dysfunction, impairs mitochondrial dynamics and function, and induces memory and cognitive deficits [16,26,28,29]. Third, the gain of function of Vps35 in a triple transgenic AD mouse model, 3xTg-AD, which harbors a human mutant PSEN1 (M146V) knock-in, and mutant APP (KM670/671NL) and MAPT (P301L) transgenes, can fully reduce the AD-relevant phenotypes [24,30]. Notice that in this study, AAV-Vps35 (the Vps35 expression is under the control of synpasin-1 promoter) was bilaterally injected into the cerebral ventricles of the newborns of 3xTg-AD mice, and the AD-relevant brain phenotypes in 12 months-old-mice are diminished [24]. Whereas, these observations support the view for loss of the Vps35 function to contribute to the AD development, and the increase of the neuronal Vps35 expression at the neonatal age could attenuate AD-relevant pathology in the aged 3xTg-AD mouse model, the details of Vps35 therapy (e.g., dose, critical time window, and key brain regions that AAV-Vps35 are expressed) and the underlying mechanisms of the Vps35 function remain elusive.
Vps35 is highly expressed in developing pyramidal neurons of mouse neocortex and hippocampus, and its expression level is peaked at the neonatal stage (P10–P15) [16,17]. Loss of Vps35 in developing pyramidal neurons results in dendritic morphogenesis and maturation defects and axonal spheroid formation in pyramidal neurons [17,27]. Mice that selectively deplete Vps35 gene in embryonic (by Neurod6-Cre), but not postnatal (by CamkII-Cre), pyramidal neurons display not only neuronal terminal differentiation deficits, but also neurodegenerative pathology, such as elevation of cortical neuronal death, accumulations of Tdp43 (TAR DNA-binding protein 43), P62/Sqstm1, and reactive glial pathology [27]. These studies suggest that Vps35 expression in mouse developing pyramidal neurons is required for their terminal differentiation as well as prevention of neurodegeneration, revealing a coupling between neuron terminal differentiation deficit with the neurodegeneration. However, the exact relationship among these deficits remains largely unclear.
Here, we provide evidence that expression of VPS35-mCherry fusion protein in Vps35Neurod6 mice prevents their neonatal death, and attenuates the dendritic morphogenesis deficit and gliosis, but does not increase in P62 and Tdp43, at the neonatal age. However, in the adult age, the neurodegenerative pathology, including dystrophic neurites and gliosis, occurred in Vps35Neurod6 mice expressing VPS35-mCherry fusion protein. Further examination showed that the Vps35-mCherry transcript expression was low (~5–7% as compared with that of control mice), and such a low level of VPS35-mCherry was able to restore the amount of other retromer components (Vps26a and Vps29) at the neonatal age (P14), but not the adult age. Therefore, the neurodegenerative pathology appeared in the survived young adult TgVps35-mCherry; Vps35Neurod6 mice. Together, these results suggest the sufficiency of low level of VPS35-mCherry fusion protein to diminish the deficit in neuronal terminal differentiation, cell death, and gliosis at the neonatal age, and thus to prevent neonatal death, demonstrating the neuronal Vps35 function in stabilizing retromer complex proteins in an age dependent manner, and supporting the view for Vps35 as a potential therapeutic target for neurodegenerative diseases.

2. Results

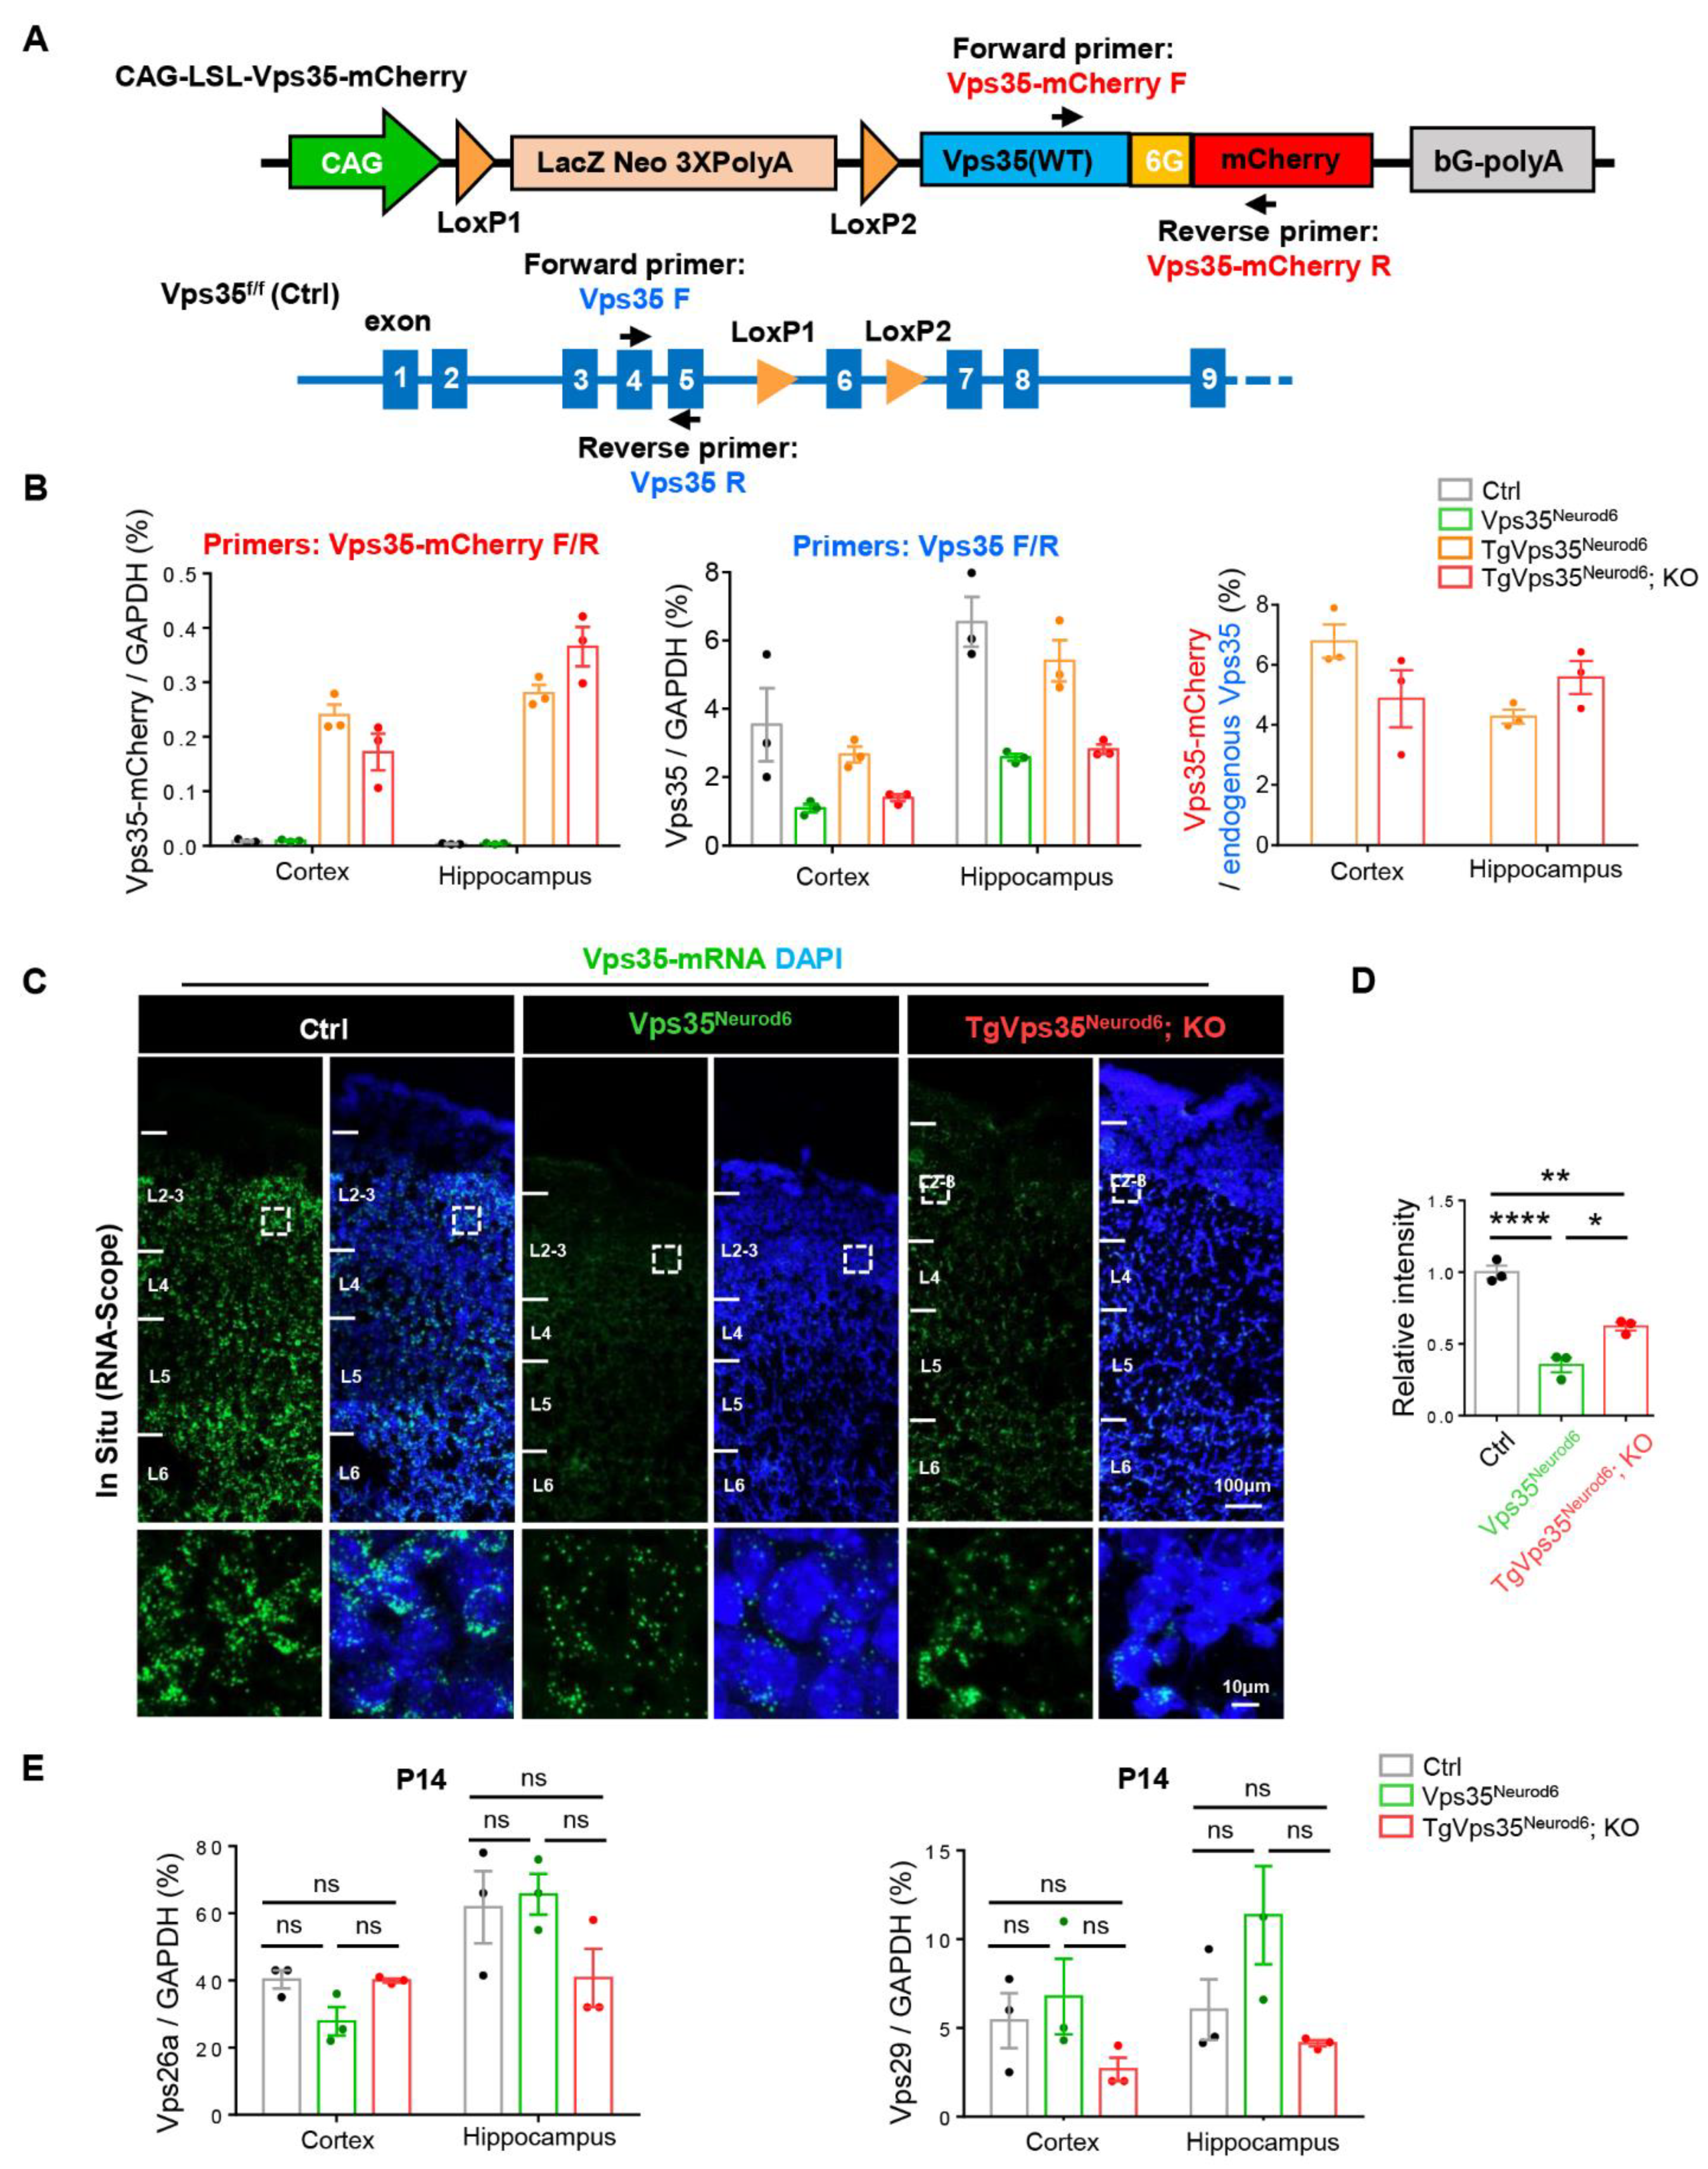
2.1. Generation of Conditional Transgenic Mice That Express VPS35-mCherry Fusion Protein in a Cre-Dependent Manner

To investigate the Vps35 function in suppression of the development of neurodegenerative diseases, we generated LSL-Vps35-mCherry mice, which express VPS35-mCherry fusion protein in a Cre-dependent manner, since there is an insertion of a loxp-flanked “stop” sequence between the CAG promoter and Vps35-mCherry transgene (Figure S1A). As expected, the Vps35-mCherry transgene was only detectable when Cre recombinase was co-expressed, but not in the absence of Cre, in HEK293 cells (Figure S1B,C), demonstrating its Cre-dependence. Then, we crossed the LSL-Vps35-mCherry mice with Neurod6-Cre mice to generate LSL-Vps35-mCherry; Neurod6-Cre mice (referred to as TgVps35Neurod6) to determine if the transgene is expressed in vivo in a Cre-dependent manner. Note that Neurod6-Cre expresses Cre largely in post-mitotic cortical and hippocampal pyramidal neurons of neocortex starting at ~E13.5 [31]. As shown in Figure S1, TgVps35Neurod6 mice had normal body weight and brain structure compared with the control mice (Figure S1F–H). Consistent with results in HEK293 cells, we only detected the expression of VPS35-mCherry protein in cortex and hippocampus, not in cerebellum where Cre is not expressed (Figure S1D,E). The immunostaining analysis showed VPS35-mCherry protein expression in TgVps35Neurod6 neocortex (layers II-III, layers IV-V) and hippocampus (CA1-3) (Figure S1I,J). The co-immunostaining analysis using antibodies against mCherry and Camk2a, Aldolase C and Parvalbumin (PV), markers for pyramidal neurons, astrocytes and interneurons, respectively, showed that VPS35-mCherry protein was co-distributed with Camk2a, but not Aldolase C+ astrocytes nor PV+ interneurons (Figure S1K,L). These results confirmed VPS35-mCherry protein’s specific expression in excitatory pyramidal neurons, demonstrating its Cre-dependence in vivo. Subcellularly, we found that the VPS35-mCherry protein was partially co-localized with Vps26a, GM130 (a marker for Golgi), and Rab7 (a marker for late endosomes) (Figure S1M,N), suggesting that this VPS35-mCherry fusion protein partially, not fully, mimics the endogenous Vps35 distribution pattern.

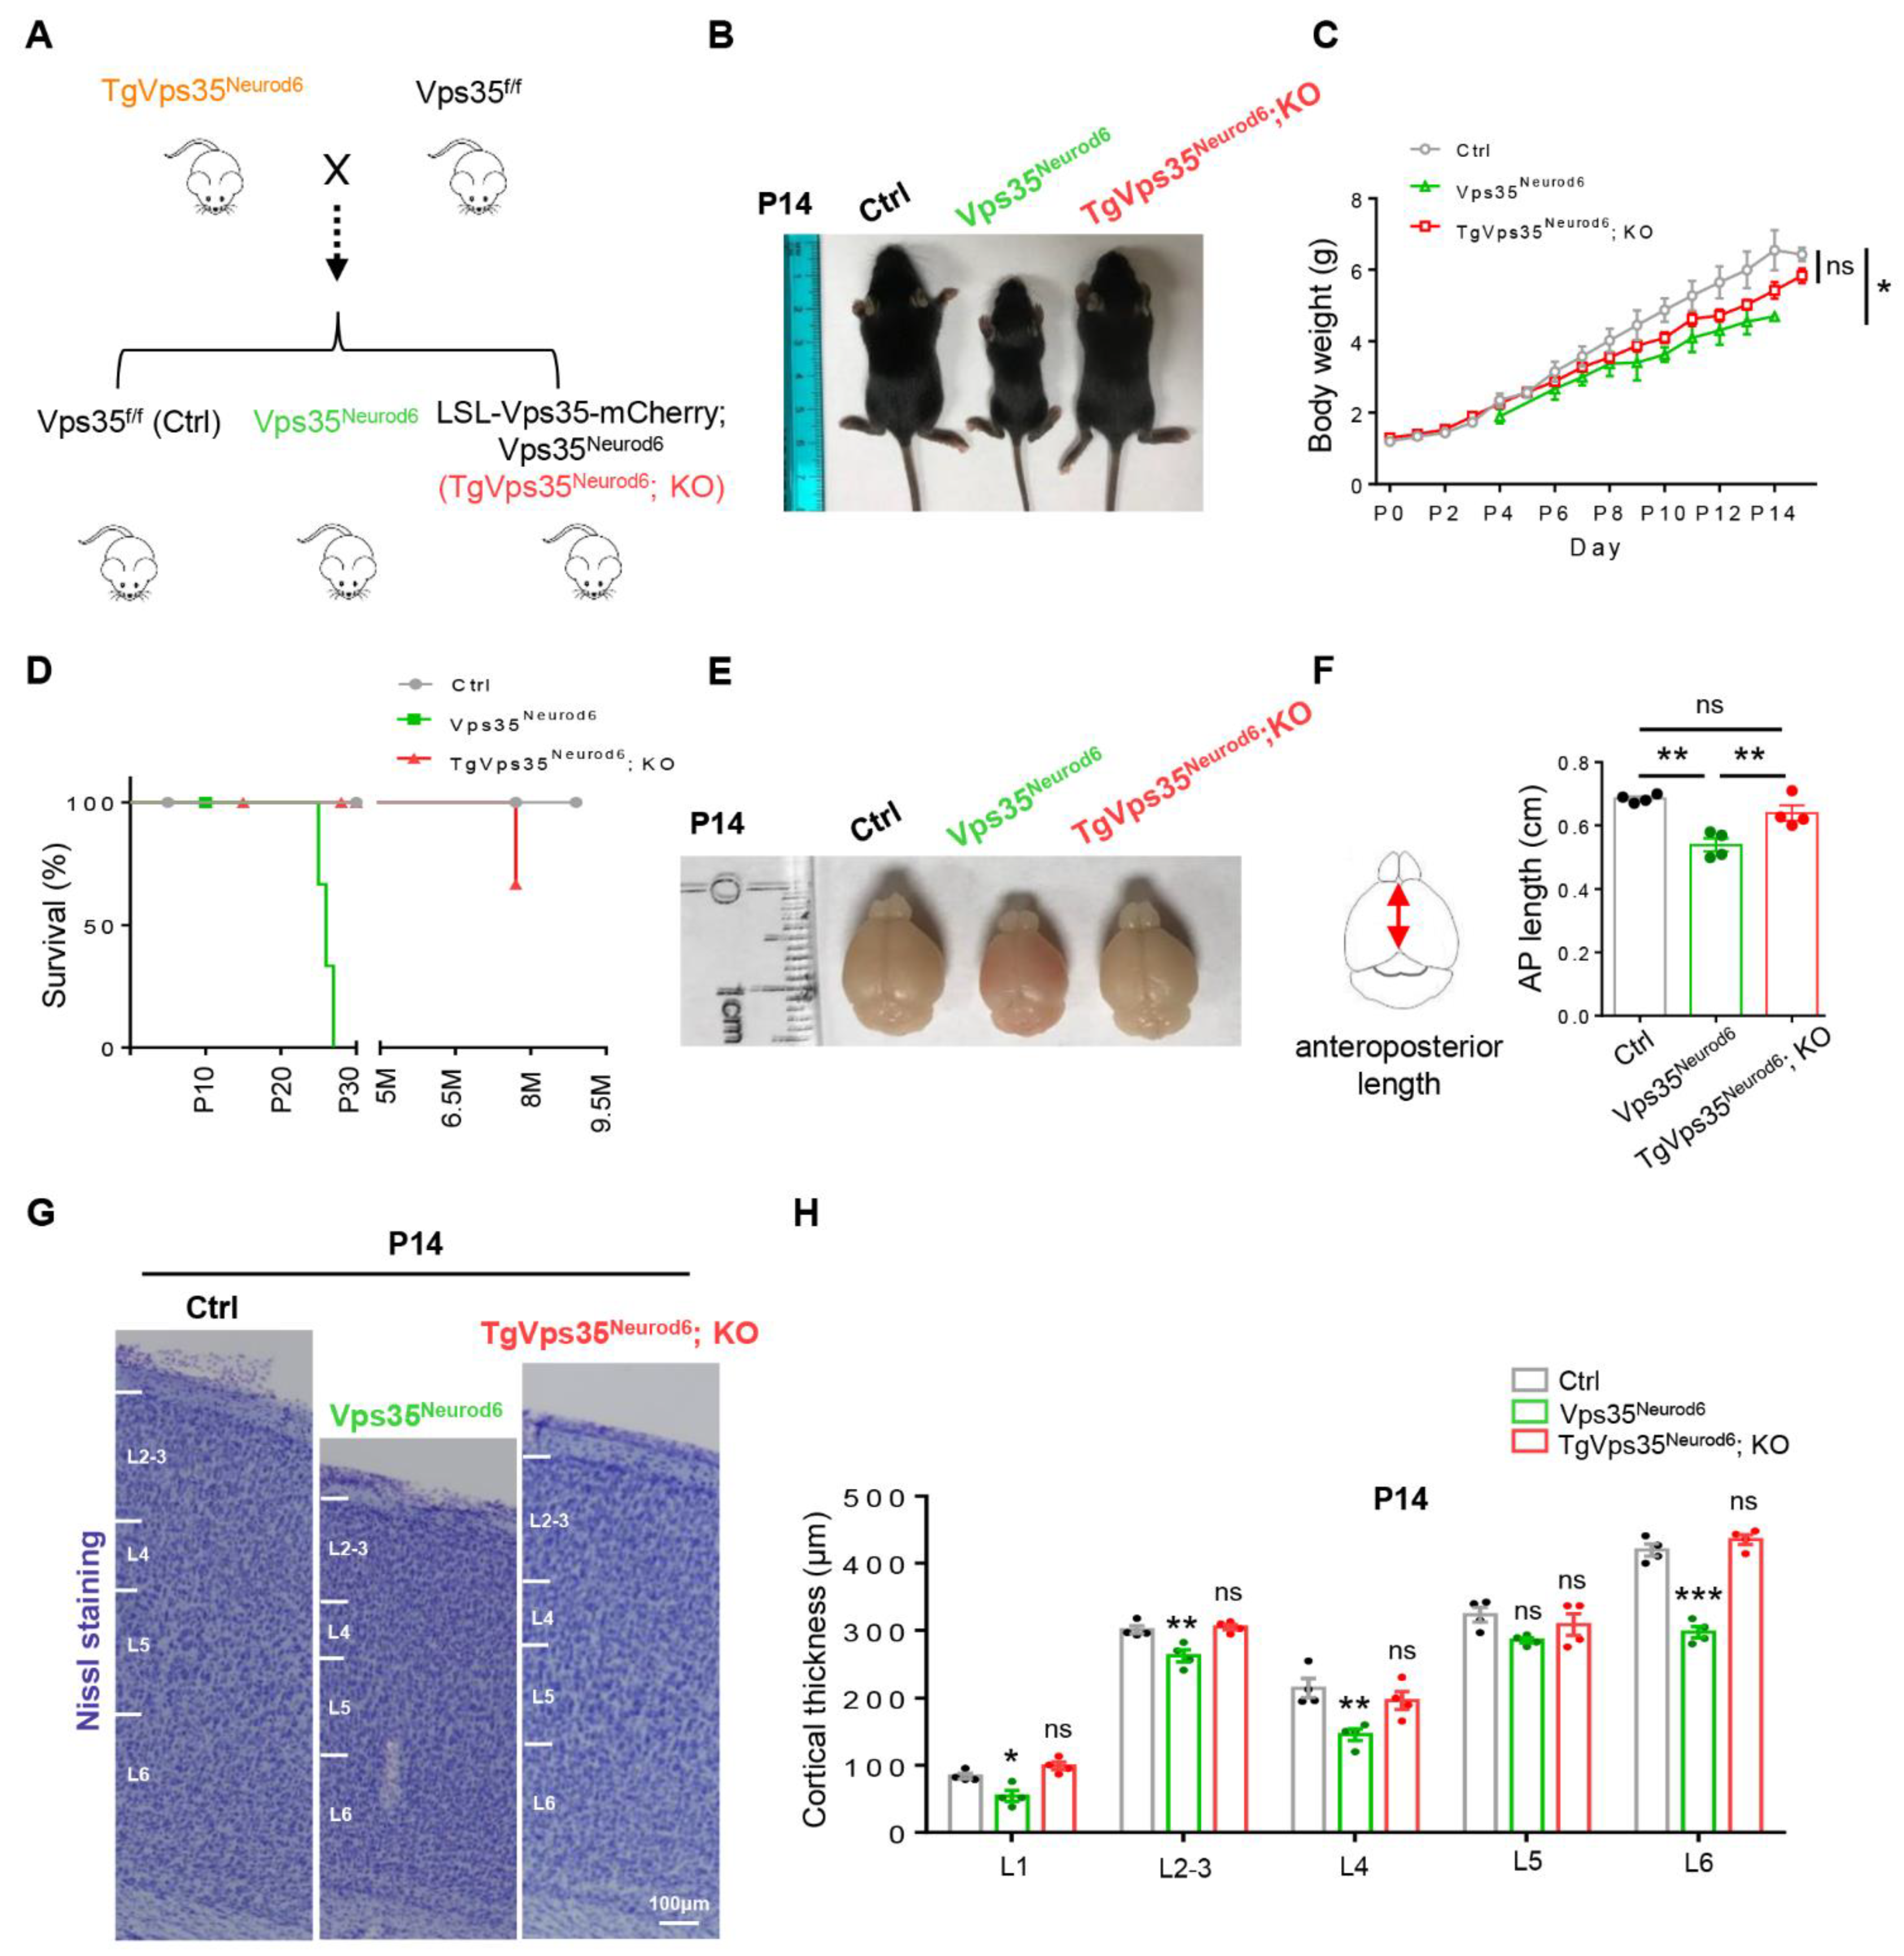
2.2. Preventing Vps35Neurod6 Mice from Neonatal Death by Expressing VPS35-mCherry Fusion Protein

Previous research showed that Vps35Neurod6 mice lagged in postnatal development including cessation of weight gain after 1 week and neonatal lethality before P27 for reasons that have not yet been determined [27]. We crossed the TgVps35Neurod6 mice with Vps35f/f mice to generate Vps35f/f (referred to as control), Vps35f/f; Neurod6 (referred to as Vps35Neurod6), and LSL-Vps35-mCherry; Vps35Neurod6 mice (referred to as TgVps35Neurod6; KO) (Figure 1A). The TgVps35Neurod6; KO mice had a comparable body weight to that of control mice at ages of postnatal day 7 to 14 (P7–P14) (Figure 1B,C). Remarkably, whereas Vps35Neurod6 mice had undergone neonatal death (all die before P28), TgVps35Neurod6; KO mice survived into adult ages, up to more than 8 months old (Figure 1D). Consistent with body weight, the brain size in TgVps35Neurod6; KO mice was comparable with that of control mice (Figure 1E,F). This view was further supported by the Nissl-staining analysis of brain sections, which showed comparable cortical thickness in TgVps35Neurod6; KO mice with that of control mice at P14 (Figure 1G,H).

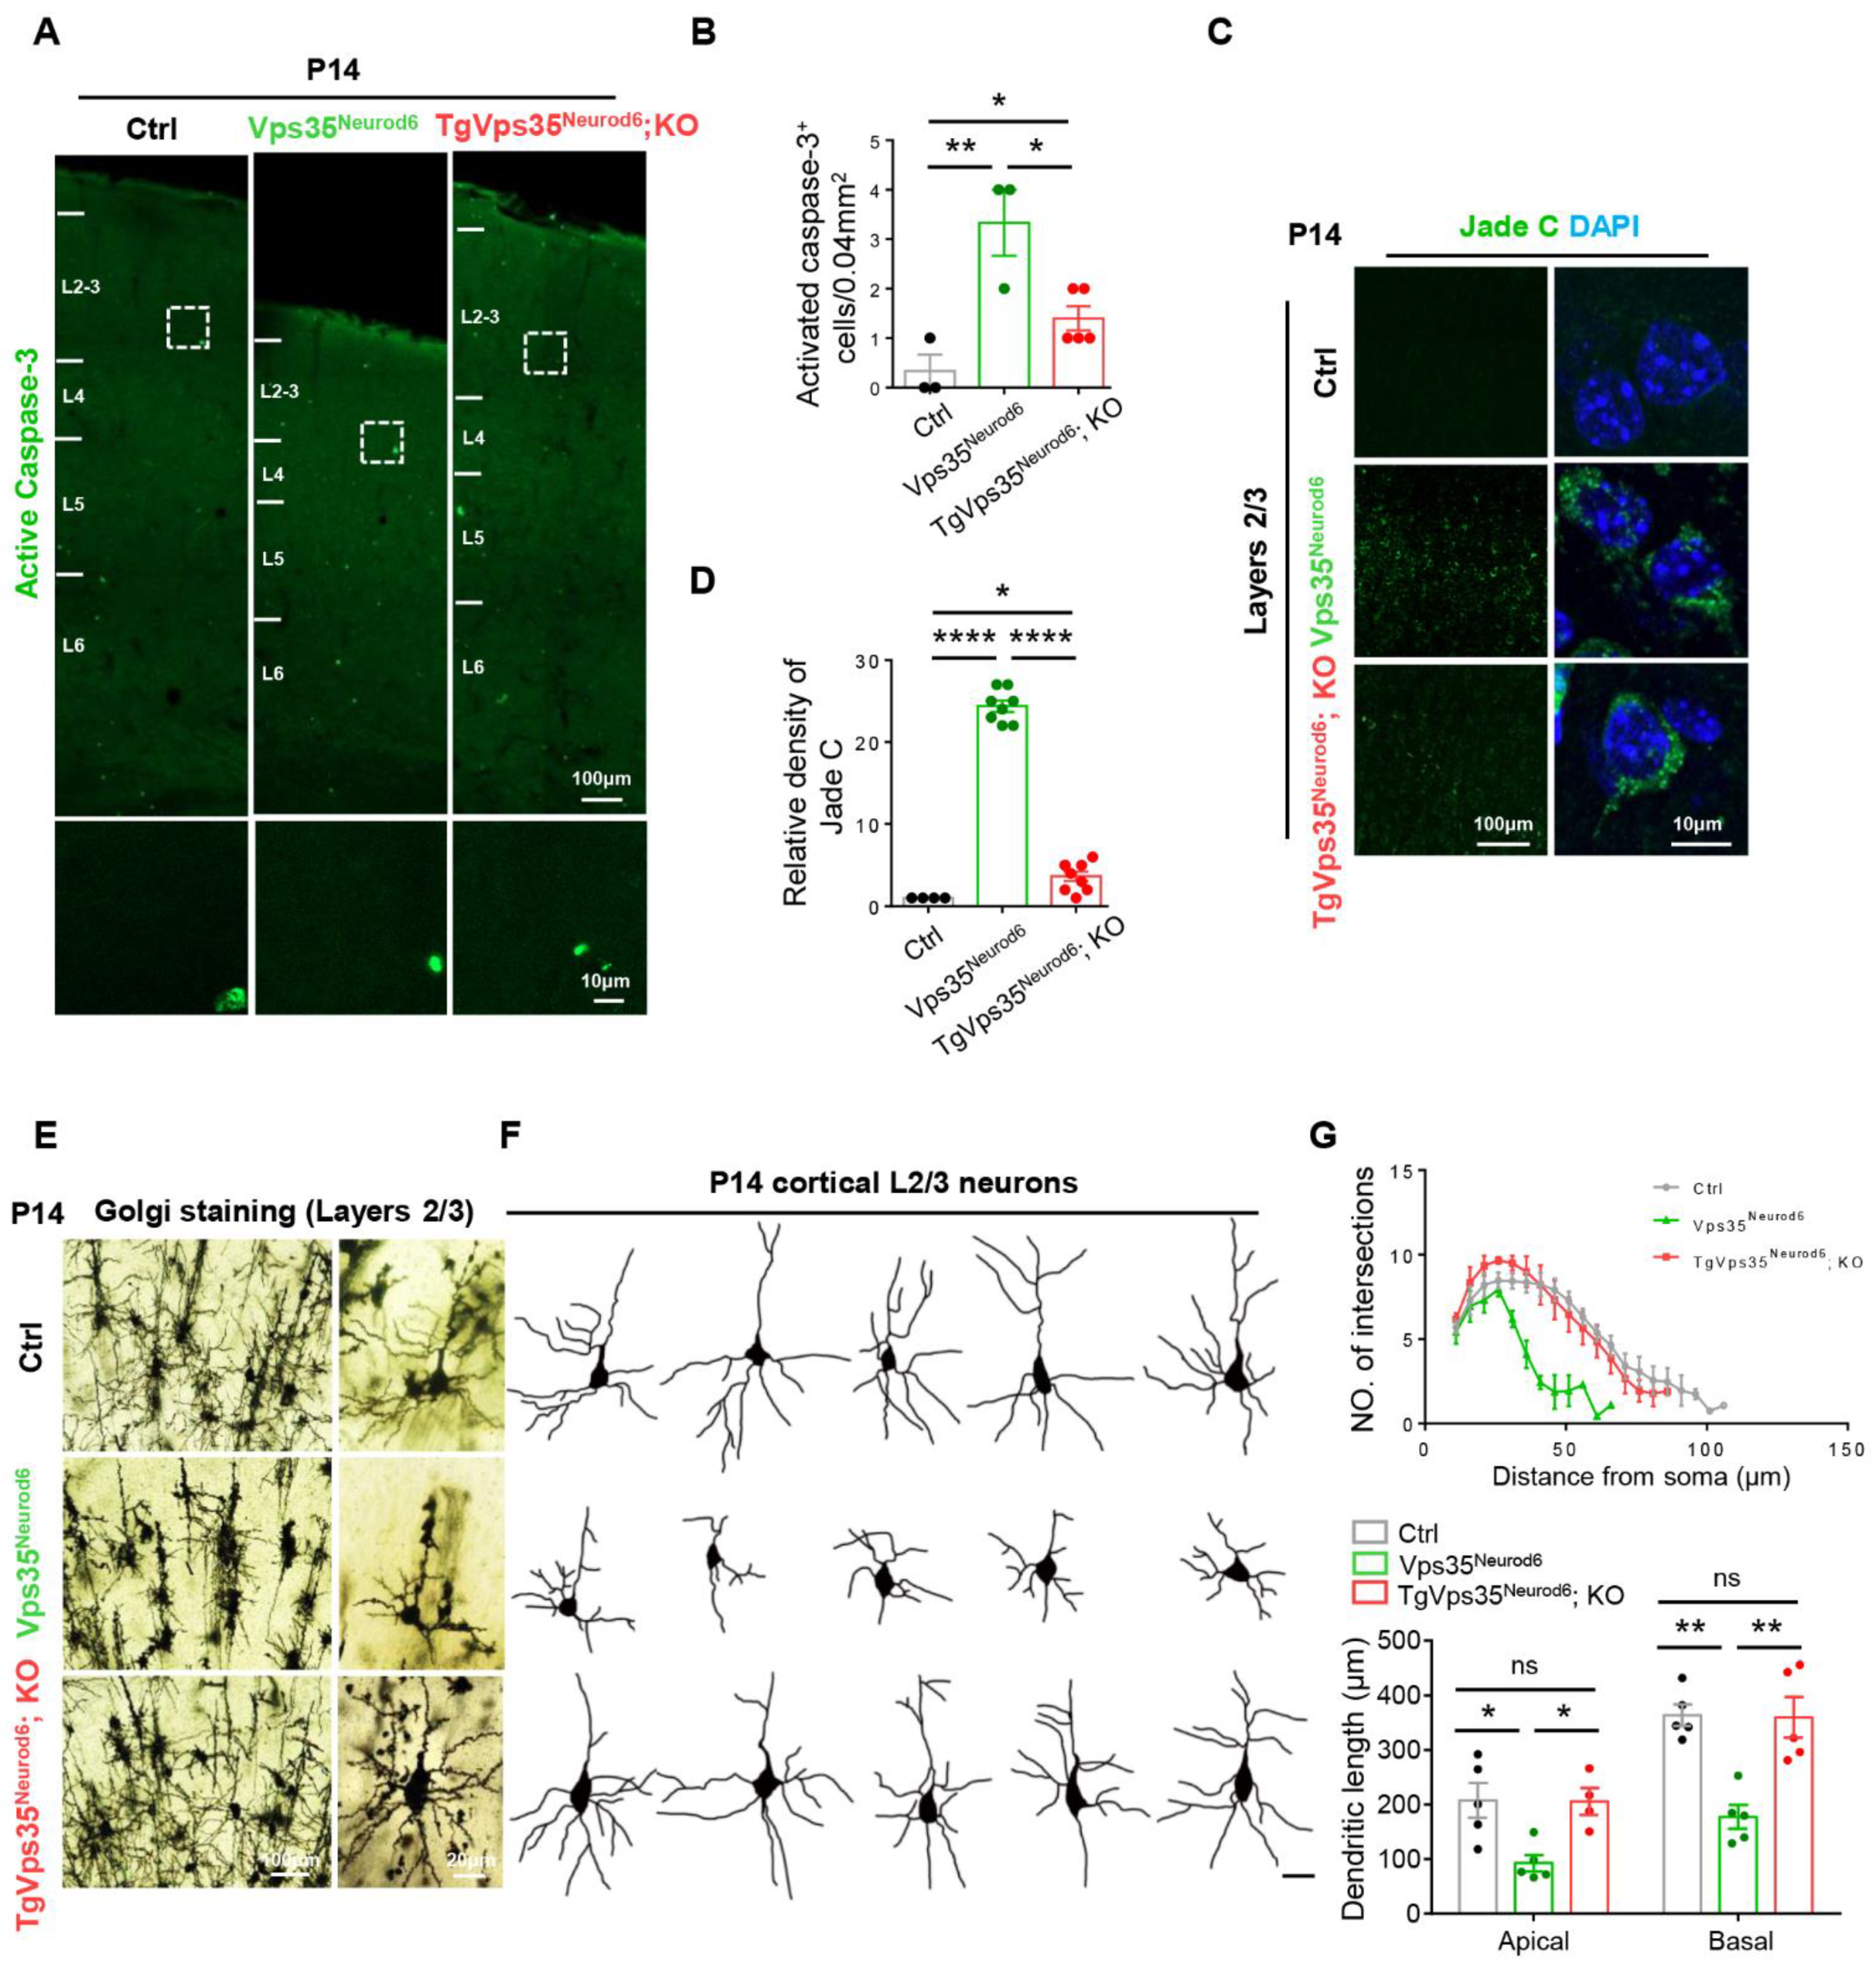
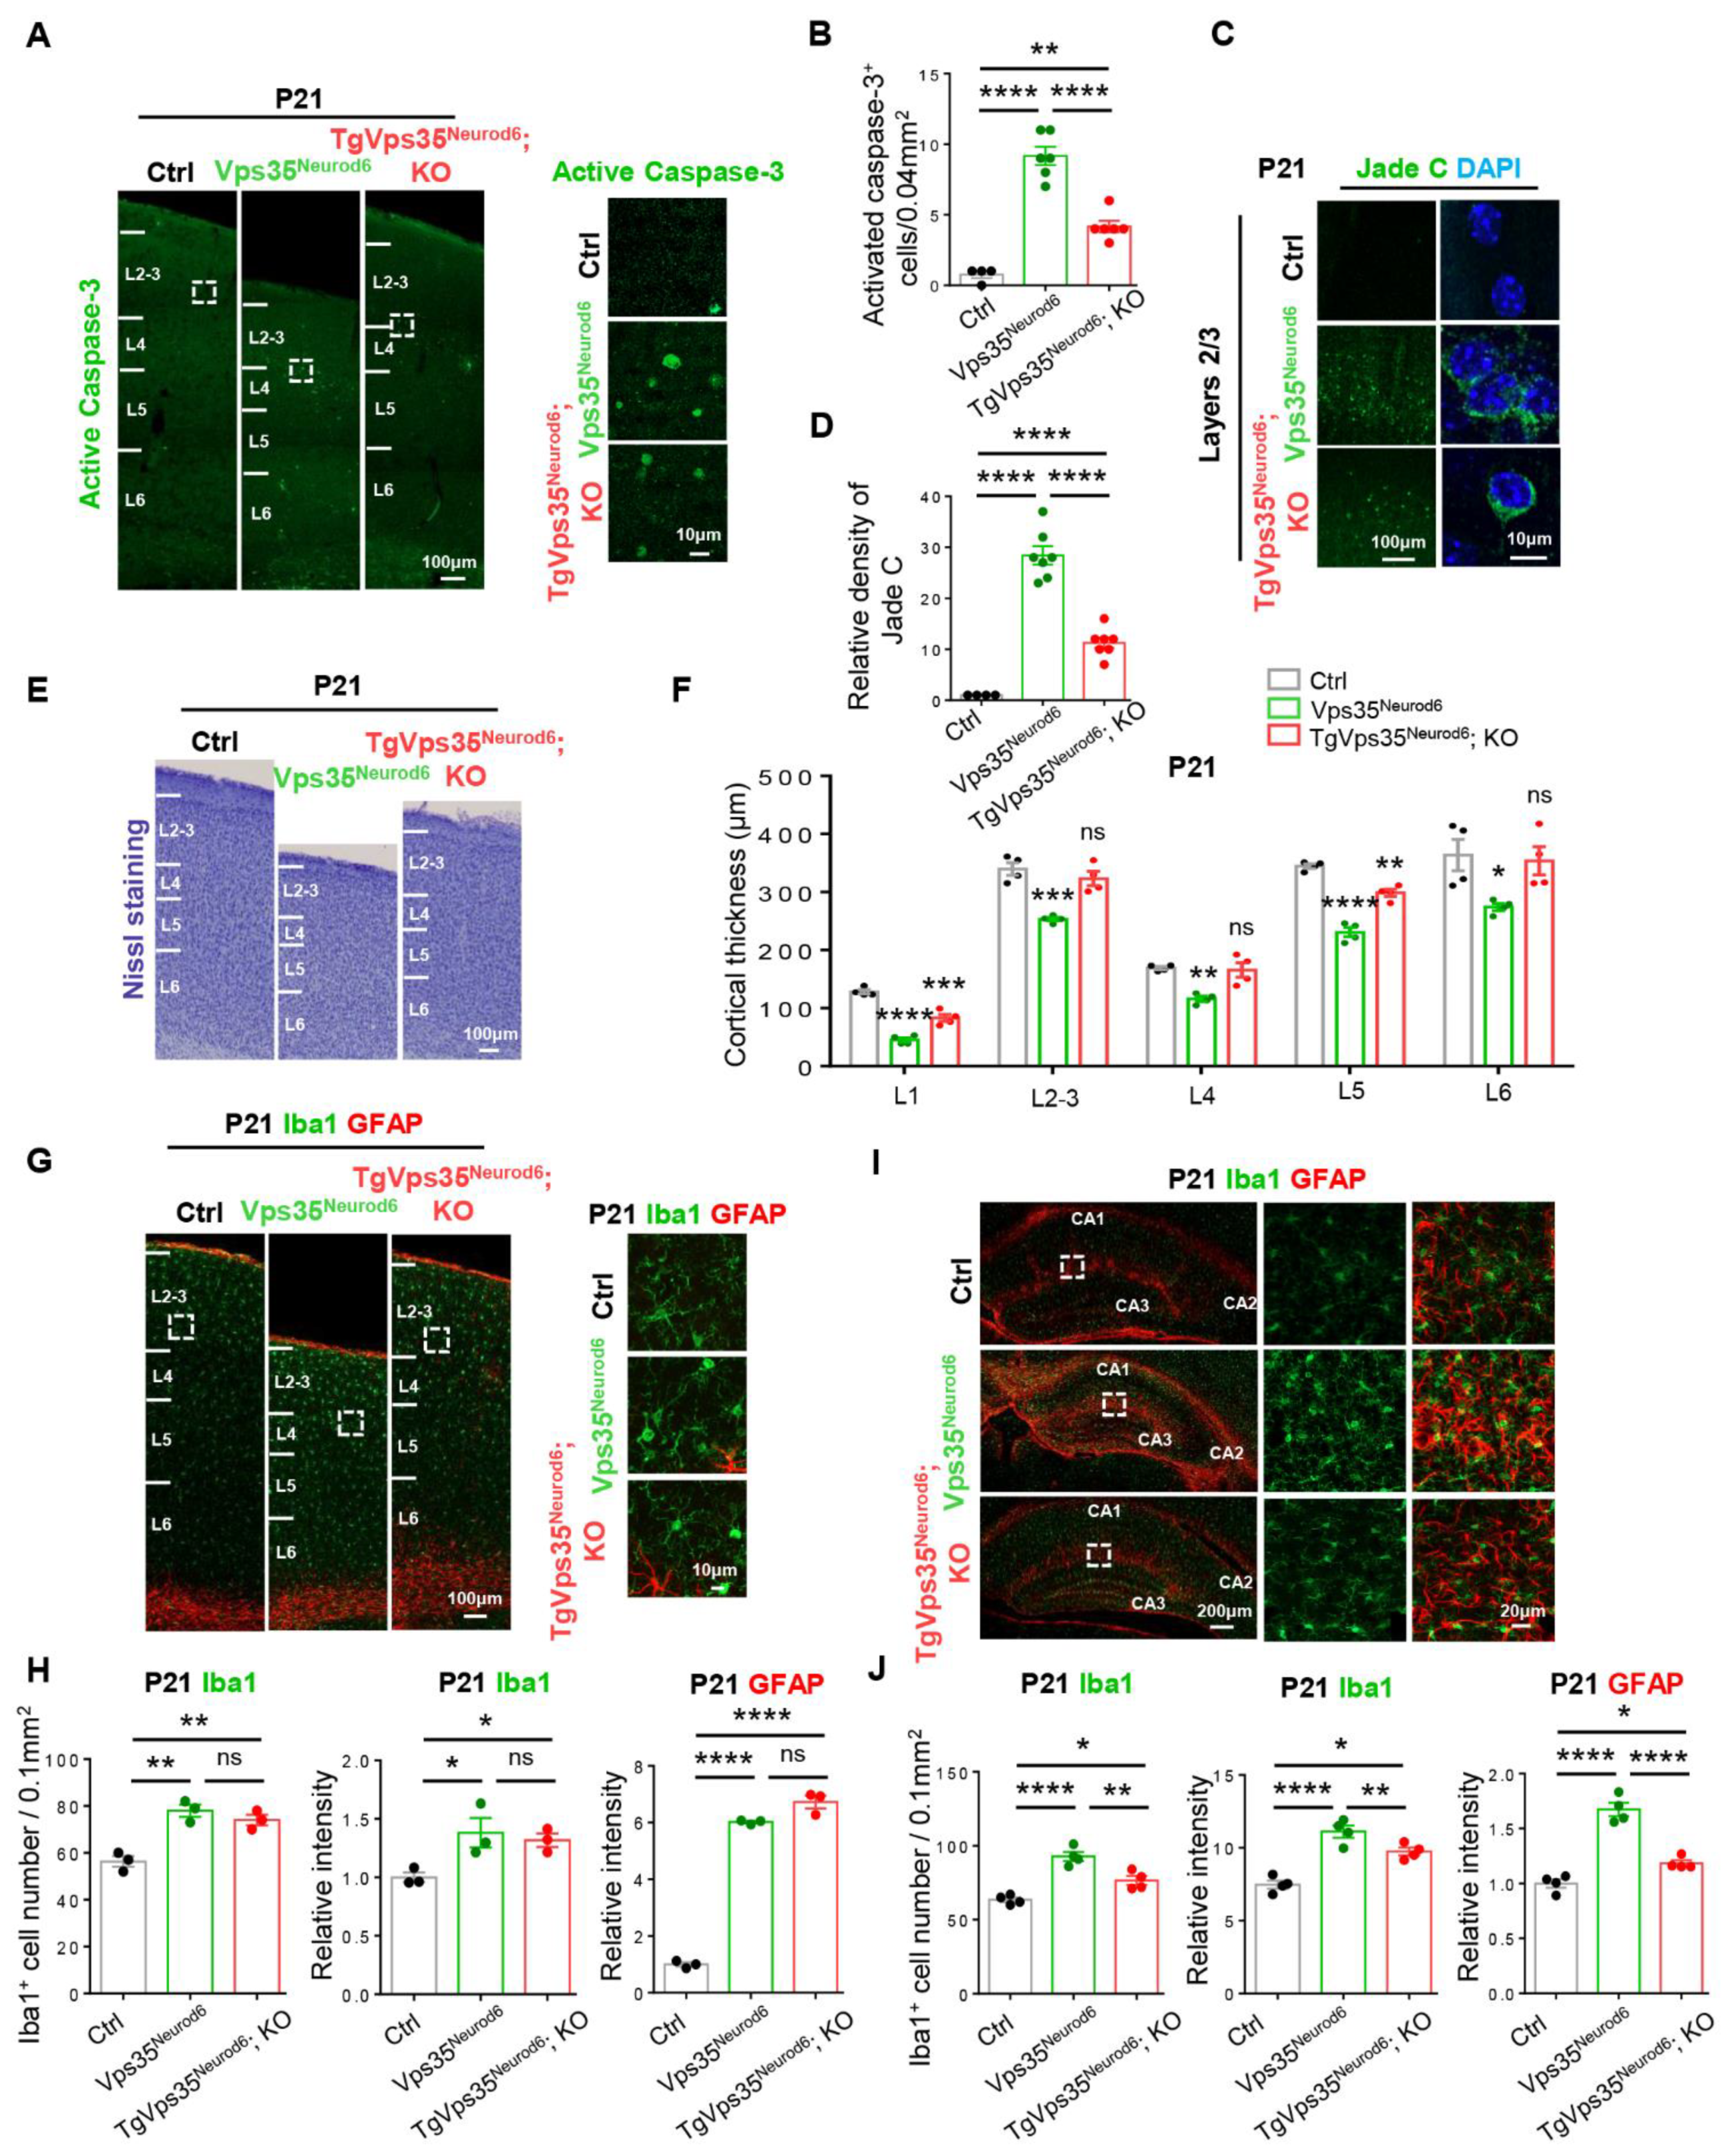
2.3. Decrease of Cell Death and Restoring of Terminal Differentiation of Neuronal Dendrites in Vps35Neurod6 Pups by Expressing VPS35-mCherry Fusion Protein

Accompanied with the reduced cortical thickness in Vps35Neurod6 mice was the increase of caspase-3+ cell death [27,32]. Therefore, we evaluated the effect of Vps35-mCherry transgene on the cell death by immunostaining analysis of the active caspase-3 positive apoptotic cells in control and mutant neocortex. As shown in Figure 2A,B, an increase in active caspase-3+ cell density was detected in P14 Vps35Neurod6 mice, in line with our previous report [27]. As expected, a significant reduction in caspase-3+ cell density was observed in TgVps35Neurod6; KO mice (Figure 2A,B), suggesting that the expression of VPS35-mCherry fusion protein could attenuate this phenotype. Furthermore, we examined neurodegeneration in TgVps35Neurod6; KO mice, and compared it with that in Vps35Neurod6 mice, by the use of Jade C staining in control, Vps35Neurod6 and TgVps35Neurod6; KO mice at P14 (Figure 2C). While Jade C positive signals were detected in both Vps35Neurod6 and TgVps35Neurod6; KO brains in L2-3 regions (Figure 2C,D), they were significantly lower in TgVps35Neurod6; KO cortex than that of Vps35Neurod6 mice (Figure 2C,D), suggesting a partial rescue of the neurodegeneration phenotype by the Vps35-mCherry transgene. Next, we evaluated the effect of VPS35-mCherry on dendritic maturation defect in Vps35Neurod6 mice, a deficit tightly coupled with the neurodegenerative phenotype [27]. Using Golgi staining analysis of P14 control, Vps35Neurod6 and TgVps35Neurod6; KO cortex to view neuronal dendritic morphologies, we observed disrupted dendritic morphologies, including reduced dendritic complexity and length, largely at layers 2–3 neurons in Vps35Neurod6 cortex (Figure 2E–G), consistent with the previous report [27]. Remarkably, this deficit was largely abolished in TgVps35Neurod6; KO mice (Figure 2E–G), suggesting a restoration of dendritic morphogenesis and maturation in Vps35Neurod6 mice by expressing VPS35-mCherry fusion protein.

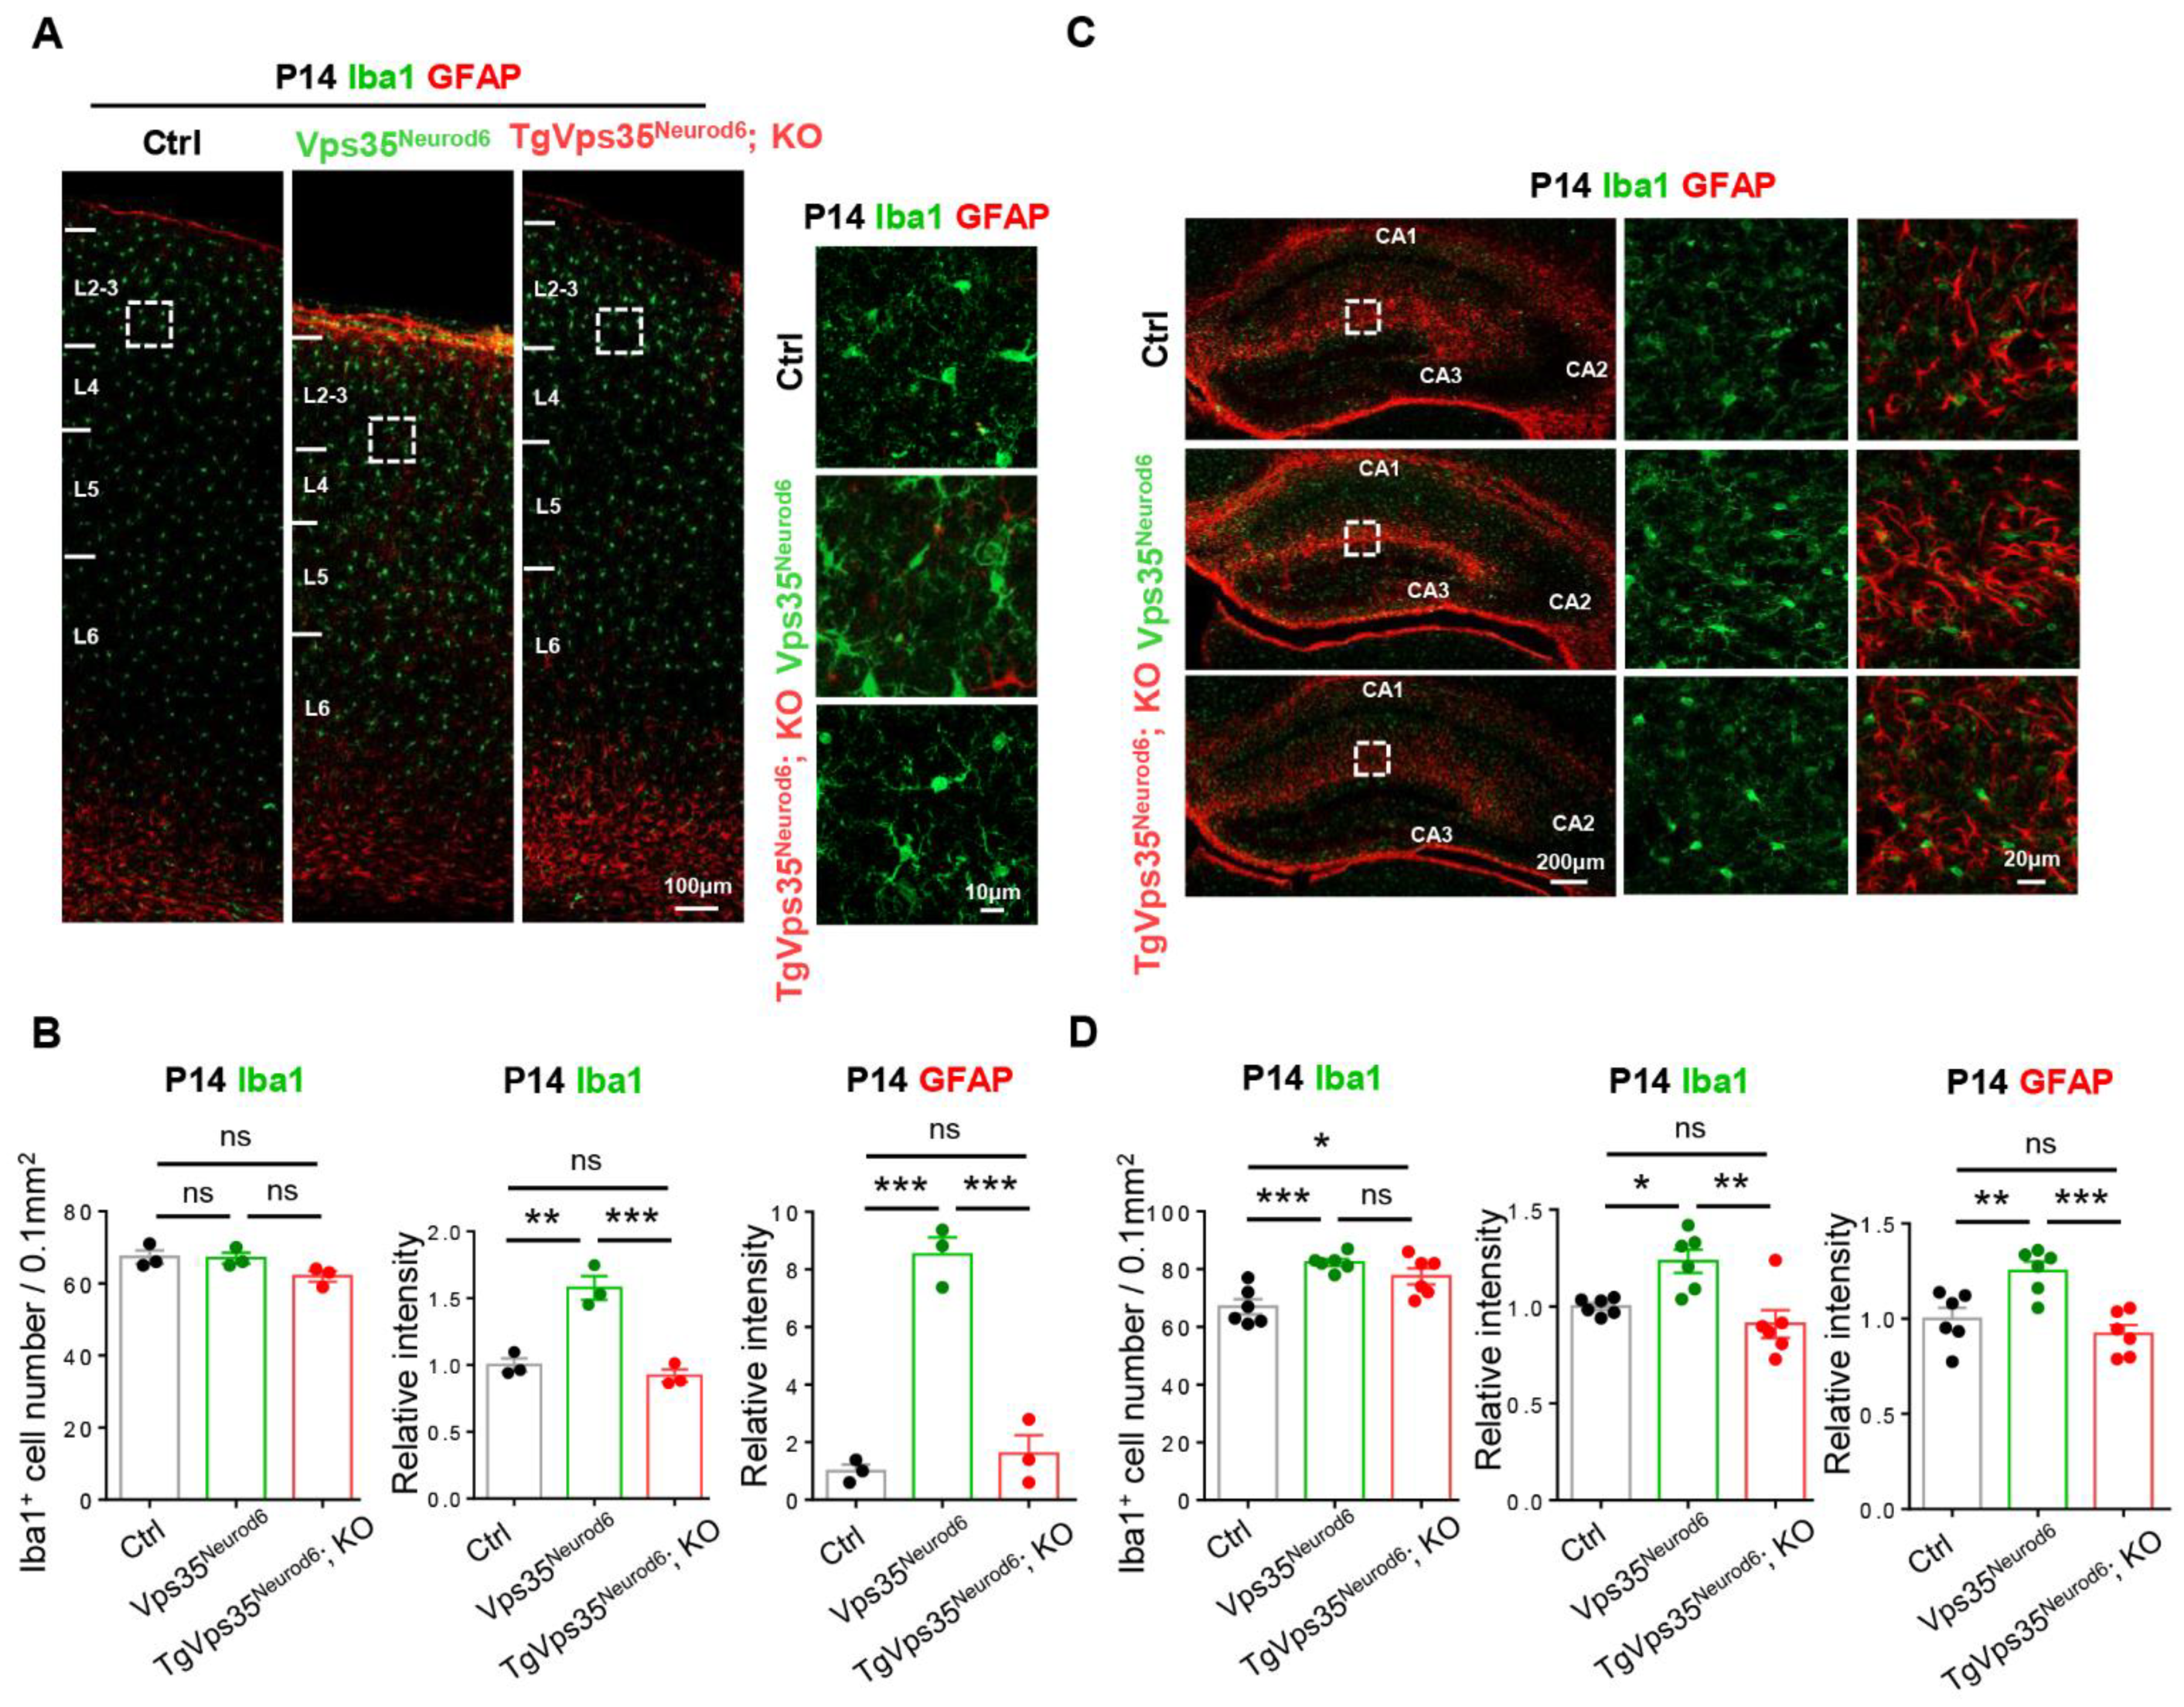
2.4. Attenuation of Gliosis in Vps35Neurod6 Pups by Expressing VPS35-mCherry Fusion Protein

The defective dendritic morphogenesis is often associated with glial activation, which was the case in Vps35Neurod6 mice [27]. Therefore, we further examined glial cell responses in TgVps35Neurod6; KO mice, compared with that of control and Vps35Neurod6 mice. As shown in Figure 3, the P14 Vps35Neurod6 neonatal cortex exhibited increases in Iba1+ microglial cell intensity per cell, as well as elevations of GFAP+ astrocytes. However, both the intensities of Iba1+ microglia and GFAP+ astrocytes were not increased in TgVps35Neurod6; KO cortex, which were at comparable levels as those in control mice (Figure 3A,B), suggesting that a complete inhibition of glial activation in TgVps35Neurod6; KO neonatal cortex, supporting the view for the association of glial responses with neurodegeneration. Similar to the results in the cortex, an increase of the intensity of Iba1+ microglia were detected in hippocampus of Vps35Neurod6 mice, which was not observed in the age- and gender matched Vps35Neurod6 mice expressing VPS35-mCherry fusion protein at P14 (Figure 3C,D).

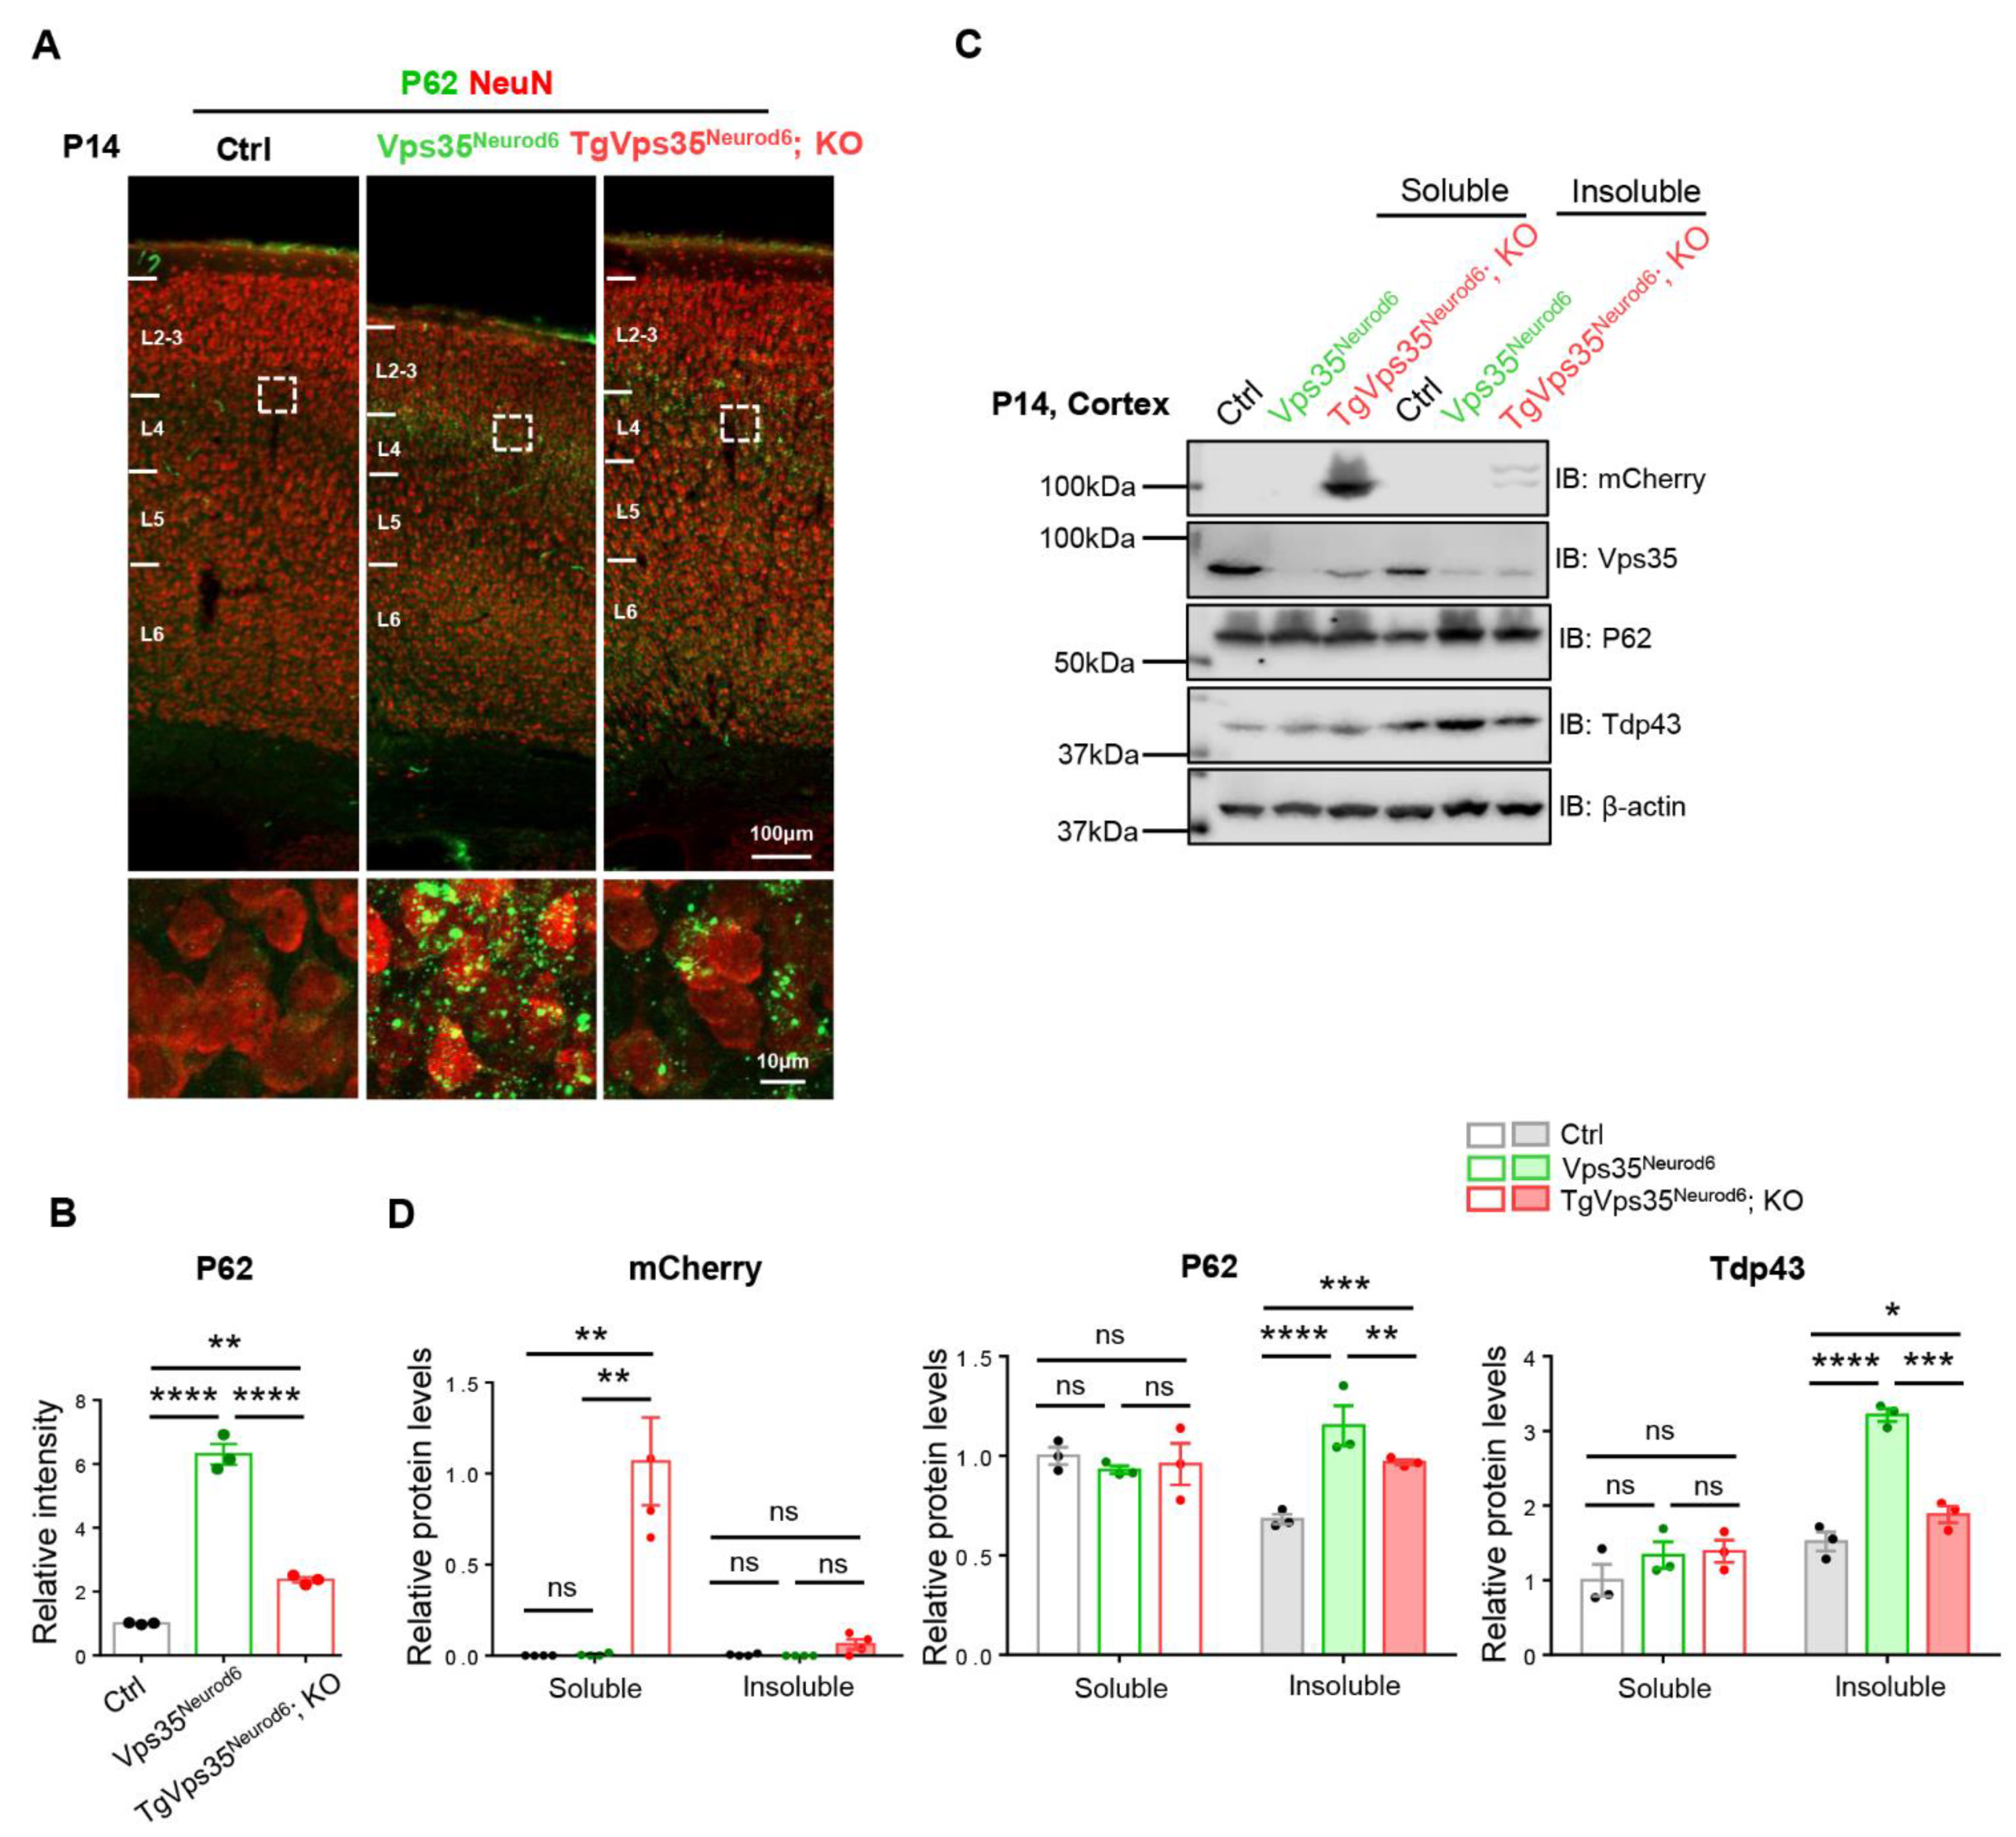
2.5. Partial Reduction of P62 and Tdp43 Proteins in TgVps35Neurod6; KO Pubs

In addition to the neuronal terminal differentiation deficits and gliosis in Vps35Neurod6 mice, we also detected increases of P62/sequestosome 1 (SQSTM1), one factor that targets specific cargoes for autophagy, and Tdp-43, a DNA-RNA binding protein, in Vps35Neurod6 cortical neurons (Figure 4) [33,34,35,36], both proteins often associated with the pathology of FTD [21,37]. To determine if expressing VPS35-mCherry fusion protein could reduce this brain pathology in Vps35Neurod6 mice, we performed both coimmunostaining and Western blot analyses. Immunostaining analysis showed a partial reduction of P62 in the neocortex L2-3 of TgVps35Neurod6; KO mice as compared with that in Vps35Neurod6 mice (Figure 4A,B). Western blot analysis showed higher protein levels of P62 and Tdp43 in insoluble fractions of homogenates of both Vps35Neurod6 and TgVps35Neurod6; KO cortex than those in control mice. However, both P62 and Tdp43 proteins were lower in TgVps35Neurod6; KO than those in Vps35Neurod6 mice (Figure 4C,D). These results suggested that the aggregates of FTD-associated proteins in TgVps35Neurod6; KO mice were partially reduced.

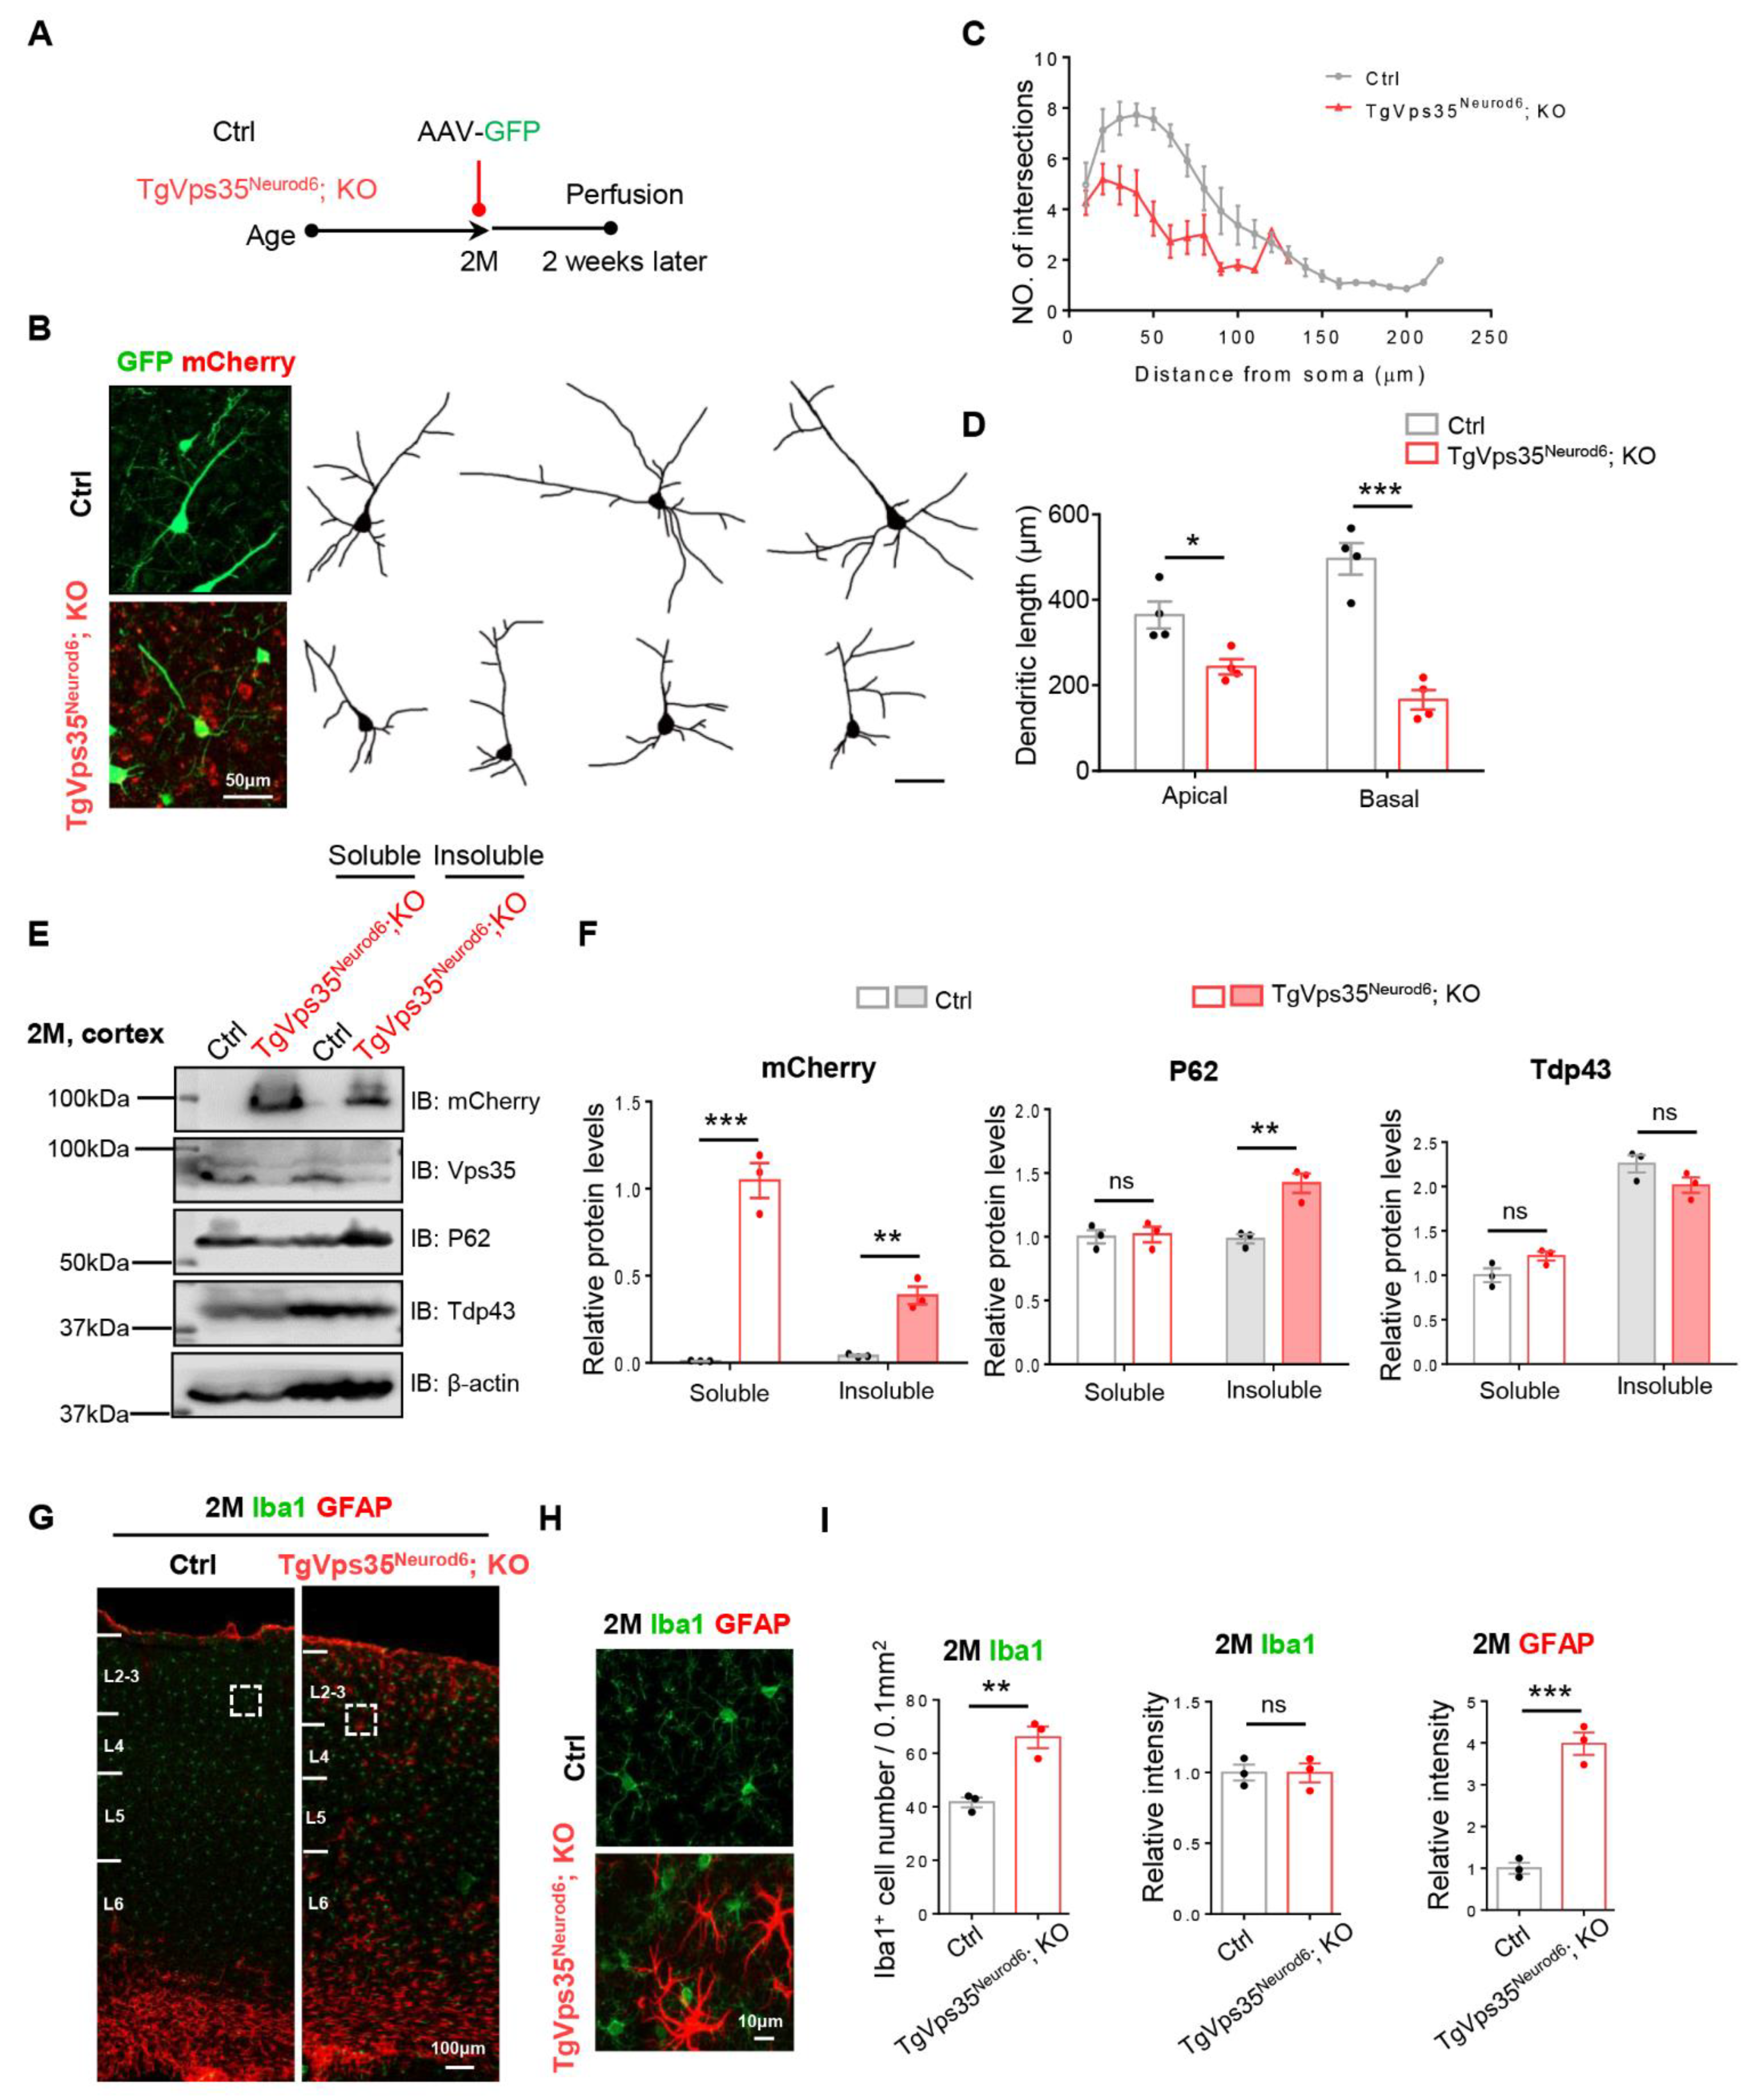
2.6. Neurodegenerative Pathology in Adult TgVps35Neurod6; KO Mice

Next, we examined phenotypes in different aged TgVps35Neurod6; KO mice. First, we examined the neuronal morphology in the survived TgVps35Neurod6; KO mice at age of 2-months-old (MO), compared with the age- and gender- matched control mice (Vps35f/f) (Figure 5A,B). We examined the neuronal morphology by stereotactic injection of AAV-Syn-EGFP to fluorescently label neurons of cortex in control and TgVps35Neurod6; KO mice (Figure 5A–D). The quantification analysis showed marked reductions in dendritic intersections and length in the mutant mice (Figure 5C,D), implicating the neurodegenerative phenotype. Then, we examined other neurodegeneration associated features, including increases in P62 and gliosis. Indeed, the P62 proteins were increased in insoluble fractions of homogenates of TgVps35Neurod6; KO neocortex (Figure 5E,F); and the GFAP+ astrocytes and Iba1+ microglia were also elevated in TgVps35Neurod6; KO neocortex (Figure 5G–I). Note that the level of Tdp43 was comparable with that of control mice (Figure 5E,F). Together, these results support the view for the existence of neurodegenerative pathology in adult TgVps35Neurod6; KO mice.
Second, we wondered whether these neuron morphological and degenerative phenotypes could be detected in neonatal ages (but after P14). To this end, we examined the dendritic morphology of neurons in hippocampus CA1 and entorhinal cortex of control (Neurod6 Cre), Vps35Neurod6 and TgVps35Neurod6; KO brains by stereotactic injection of AAV-Syn-mCherry to fluorescently label neuronal morphology (injected at P22 and examined at P29) (Figure S2A). As shown in Figure S2B, in hippocampus CA1, the mCherry labelled pyramidal neuron’s dendrites had a reduced dendritic branching as compared with that of control mice. However, a significant improvement was noted as compared with that in Vps35Neurod6 mice (Figure S2B). The Sholl analysis showed a lower number of dendritic intersections in TgVps35Neurod6; KO mice (Figure S2C). In addition, quantification of the apical and basal dendritic length indicated a reduction of dendritic process in TgVps35Neurod6; KO neurons, as compared with those in control mice (Figure S2C). In entorhinal cortex of TgVps35Neurod6; KO mice, a comparable dendritic complexity and length were detected as compared with those in control mice (Figure S2B,D). These deficits were similar, but not identical, to the phenotypes observed by Golgi staining analysis (Figure 2E), suggesting a partial rescue of the dendritic length and complexity at this neonatal age.
Third, we examined other phenotypes, including cell death, cortical thickness, and gliosis in control, Vps35Neurod6, and TgVps35Neurod6; KO mice at age of P21. The P21 TgVps35Neurod6; KO cortex showed more active caspase-3 positive apoptotic cells and Jade C+ signals than those of P14 TgVps35Neurod6; KO mice (Figure 6A–D). Accompanied with the increased cell death and neurodegeneration were a partial reduction of cortical thickness in TgVps35Neurod6; KO mice (Figure 6E,F), and appearance of the glial responses (Figure 6G,I), although these phenotypes had some improvement compared with those of Vps35Neurod6 mice (Figure 6G–J).
In aggregates, these results demonstrate an age-dependency of the VPS35-mCherry effect, revealing the neurodegenerative pathology (altered dendritic morphology, increased P62 and reactive gliosis) in the survived young adult TgVps35Neurod6; KO mice.

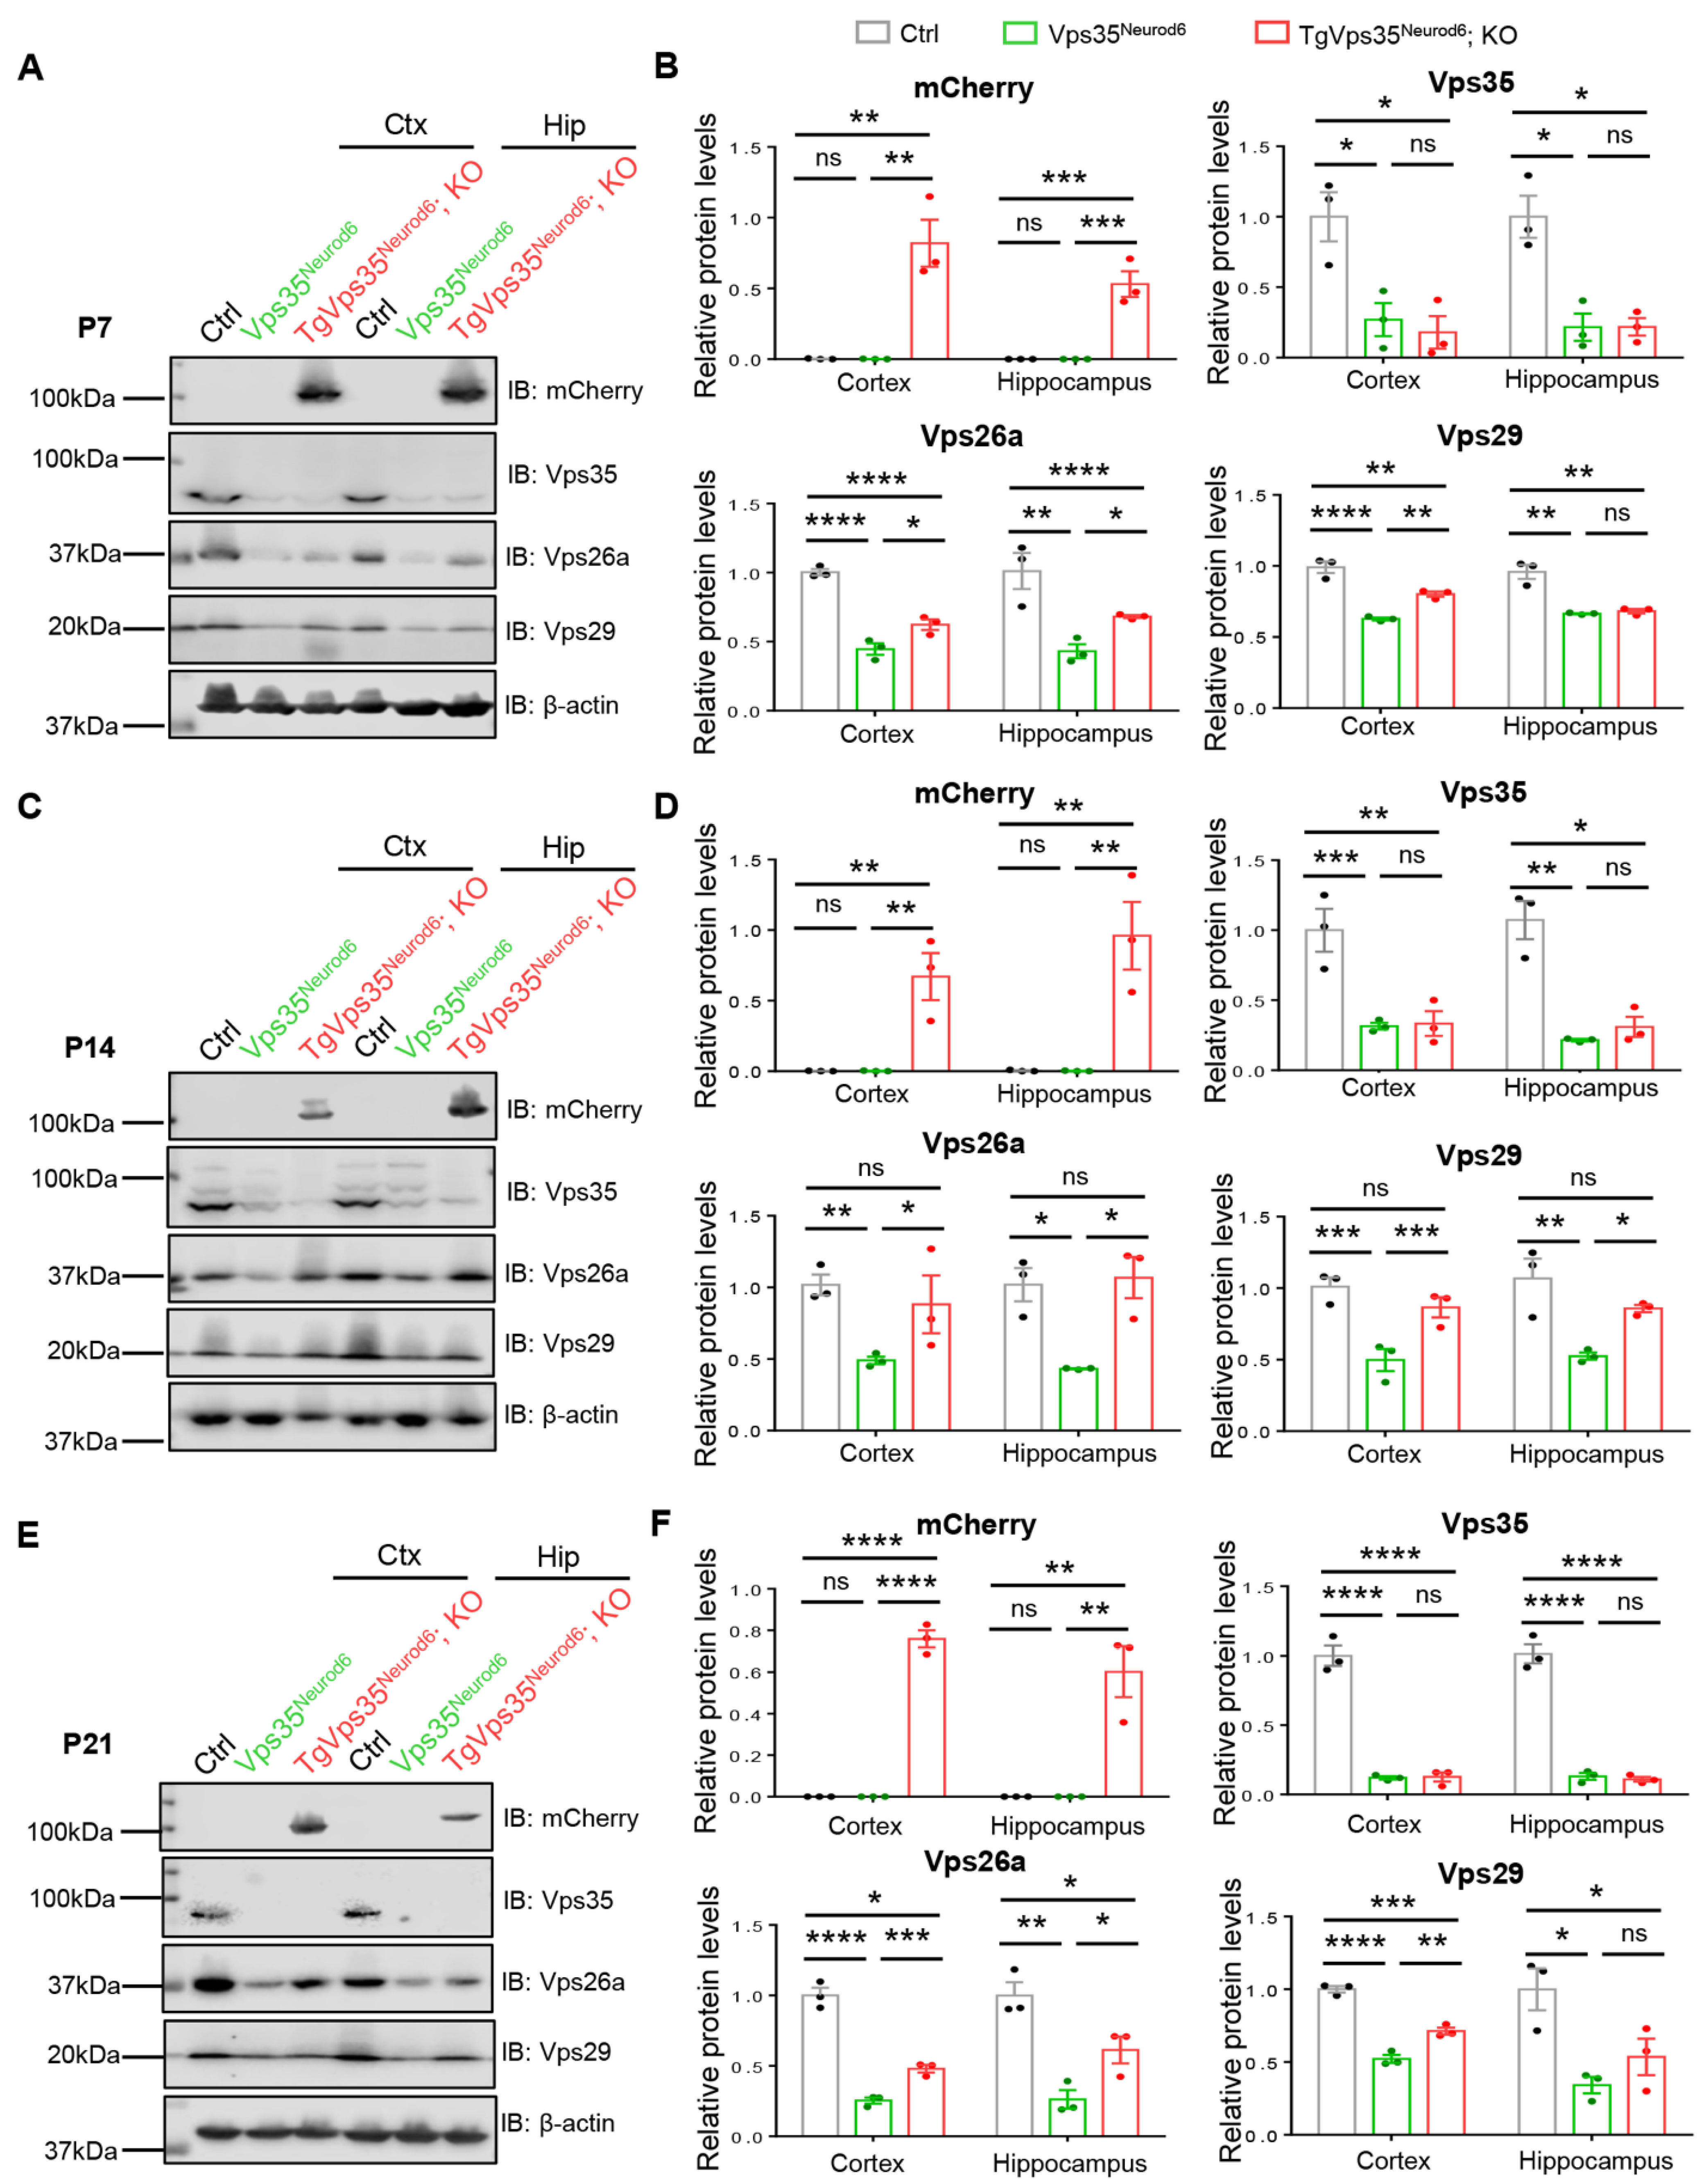
2.7. Age-Dependent Restoration of Retromer Complex in Vps35Neurod6 Mice Expressing VPS35-mCherry Fusion Protein

Vps35, a key component of retromer, interacts with Vps26a and Vps29 and is critical for the protein complex stability [4,38]. Therefore, we examined Vps26a and Vps29 levels in control, Vps35Neurod6, and TgVps35Neurod6; KO mice at various ages (P7, P14, and P21). As shown in Figure 7, Western blot analysis detected abundant Vps35, Vps26a, and Vps29 protein levels in control cortex, and they were largely reduced or undetectable in Vps35Neurod6 mice, in line with the view for the Vps35 function in stabilizing the complex. Interestingly, expressing the VPS35-mCherry fusion protein was capable of restoring Vps26a and Vps29 in P14 TgVps35Neurod6; KO brain (both cortex and hippocampus), at comparable levels with those of control mice (Figure 7C,D), suggesting a full rescue. However, at ages of P7 and P21, the levels of Vps26a and Vps29 were higher in TgVps35Neurod6; KO brain than those of Vps35Neurod6 mice, but remained lower as compared with those of control mice (Figure 7A,B,E,F), indicating a partial rescue. Notice that the VPS35-mCherry protein was detectable by antibody against mCherry, which showed a molecule weight of 110 kDa, but not by anti-Vps35 antibody (Figure 7), suggesting the lower sensitivity of the Vps35 antibody and/or the low level of VPS35-mCherry fusion protein expression. Together, these results suggest an age dependent restoration of the retromer complex protein in Vps35Neurod6 mice expressing VPS35-mCherry fusion protein, correlating with its age-dependent rescue effects on the neurodegenerative pathology.

2.8. Low Level of Vps35-mCherry’s Expression

Furthermore, we examined Vps35-mCherry’s mRNA levels in TgVps35Neurod6 and TgVps35Neurod6; KO mice by quantitative real-time RT-PCR (qRT-PCR) analysis. Primers for Vps35-mCherry and endogenous Vps35 were generated as indicated in Figure 8A. Using primers for Vps35-mCherry, Vps35-mCherry’s mRNAs were detected in neocortex and hippocampus of TgVps35Neurod6 and TgVps35Neurod6; KO mice, but not in control and Vps35Neurod6 mice, suggesting the specificity (Figure 8B). However, using primers for endogenous Vps35, the mRNA levels in both Vps35Neurod6 and TgVps35Neurod6; KO brains were lower than those in control and TgVps35Neurod6 mice. However, the Vps35 mRNA levels were slightly higher in TgVps35Neurod6; KO than in Vps35Neurod6 mice (Figure 8B). Further quantification analysis showed that the exogenous Vps35-mCherry’s mRNAs were at levels of about 4–6% over the total Vps35 mRNA (Figure 8B), suggesting a low level of Vps35-mCherry’s expression. To verify this view, we performed the RNA-scope analysis, a high resolution In Situ method. As shown in Figure 8C, the Vps35 signal was detected in the neocortex of control, Vps35Neurod6 and TgVps35Neurod6; KO mice. Consistent with the result of qRT-PCR, the signal was markedly reduced in Vps35Neurod6 mice, with a slight increase in TgVps35Neurod6; KO brain, as compared with that of Vps35Neurod6 mice (Figure 8C,D). Moreover, we examined Vps26a and Vps29 mRNA levels in control, Vps35Neurod6 and TgVps35Neurod6; KO neocortex and hippocampus. No significant change was observed between the control and Vps35Neurod6 mice, as well as the TgVps35Neurod6; KO mice at P14 (Figure 8E), suggesting the Vps35 effect on the protein stability of Vps26a and Vps29, but not their transcription. Together, these results suggest a low level of VPS35-mCherry expression, and such a low level of VPS35-mCherry fusion protein could diminish most of the deficits detected in P14 Vps35Neurod6 mice, a critical window for their survival.

3. Discussion

The retromer complex is a highly conserved multimeric protein complex and has been linked to cargo retrieval from endosomes to the trans-Golgi network [39,40,41]. Vps35/retromer dysfunction is involved in pathogenesis of multiple neurodegenerative diseases, including AD and PD, FTD, and ALS [16,26,27,42]. Although numerous studies have demonstrated that Vps35 is an active player and directly involved in development of neurodegenerative diseases, the underlying mechanisms remain largely unclear. In this study, we expressed Vps35 in pyramidal neuron by crossing LSL-Vps35-mCherry mice with Vps35Neurod6 mice, which develop terminal differentiation deficits and neuro-degenerative pathology. Expressing a low level of VPS35-mCherry fusion protein could prolong the life span of Vps35Neurod6 mice up to 8 months or longer, and partially rescued the bodyweight of Vps35Neurod6 mice. Further analysis showed that the neuronal dendritic differentiation deficits, cell death, and reactive glial responses in Vps35Neurod6 mice were largely diminished at neonatal age (P14), but not a young adult age. Finally, the protein and mRNA levels of Vps35-mCherry in TgVps35Neurod6; KO mice appeared to be as low as ~5–7% of the Vps35 mRNAs of control mice. Such a low level of expression of this fusion protein is sufficient to restore the levels of other retromer components (Vps26a and Vps29), attenuate the neurodegenerative deficits at the neonatal age (P14), prolong the life span, but not prevent the neurodegenerative pathology in older ages.
Genetically manipulated mouse models have proven to be valuable tools for our understanding of pathological mechanisms of human diseases. Here, we used a conditional transgenic mouse line, with a knock-in Cre-regulated expression of cDNA constructs with a loxp-stop-loxp cassette insertion between the CAG promoter and Vps35-mCherry cDNA. This system enables approaches for controlled expression of VPS35-mCherry constructs. The diminished brain pathology in Vps35Neurod6 mice was detected at the neonatal, not adult age, by expressing the VPS35-mCherry fusion protein. These observations suggest that the rescue by VPS35-mCherry fusion protein appears to be “transient” or age-dependent. The rescue by VPS35-mCherry may be also dose dependent. Notice that the expression of VPS35-mCherry transgene is regulated not only by CAG promoter, but also depends on Cre-recombinase. The Neuro6-promotor drive Cre expression may be peaked at P14, which results in higher activity of VPS35-mCherry and better rescue effect. In addition, the low level of Vps35-mCherry transgene expression may be due to the random insertion of the LSL-Vps35-mCherry transgene cassette.
It is noteworthy that there was a coupling of neuronal terminal differentiation deficit with the glial activation, but not with the P62/TDP43 levels (Figure 2, Figure 3 and Figure 4). Activation of glial cells are implicated in the pathogenesis of many neurodegenerative disorders [43,44,45]. Activation of glial cells, including microglia and astrocytes, in response to changes in neurons, such as neuron injury and increase of Aβ, may further contribute to the neuron/tissue damage. The accumulations of Tdp43 and P62/SQSTM1 are FTD-like neuropathology, and neurons with Tdp43 aggregates suggest a combination of loss of nuclear function and gain of toxic function. Our results that glial cell responses were nearly abolished, while the increased P62 and Tdp43 remained, in P14 TgVps35Neurod6; KO mice (Figure 4) suggest that the changes in P62 and Tdp43 may not be direct inducers for the glial responses. However, the observations of the tight association between defective dendritic maturation with the glial activation in these mutant mouse lines at age of P14 (Figure 2E–G and Figure 3) suggest that they may have interdependent effects under the influence of Vps35-loss in pyramidal neurons.
It is known that P62 accumulates with ubiquitin-containing aggregated [46,47]. Our results of a partial reduction of Tdp43 and P62 levels in TgVps35Neurod6; KO mice at neonatal and young adult ages (Figure 4 and Figure 6E–H) suggest that low doses of Vps35 expression may not be enough to remedy the accumulations of Tdp43 and P62 protein levels. In line with the levels of Tdp43 and P62 proteins, the cell death and Jade C+ neurodegeneration were also remained in P14 TgVps35Neurod6; KO mice (Figure 2A–D), suggesting an association of these pathological events. Additionally noteworthy is that the TgVps35Neurod6; KO mice can survive up to 8 months or more, whereas the Vps35Neurod6 mice undergo neonatal death before P27. While these results suggest an importance for mouse survival after passing the development of the neonatal critical time window, the exact reasons for neonatal death remain to be determined. Remarkably, the low level of VPS35-mCherry fusion protein expression in TgVps35Neurod6; KO mice was sufficient to prevent the neonatal death phenotype (Figure 1D). These results lead us to believe that the expression of low level of Vps35 might be a useful approach for the therapy of patients with neurodegenerative diseases who may have dysfunctional retromer. It is of interest to further investigate this view in future studies.

4. Materials and Methods

4.1. Animals

The LSL-Vps35-mCherry transgenic mice were generated by use of the pCCALL2 plasmid. The Vps35-mCherry sequence was cloned into the downstream of the Loxp-STOP-Loxp sites in pCCALL2 plasmid. The construct was linearized using ScaI/SfiI and electroporated into ES cells. Positive ES cell clones were injected into C57BL6/J blastocysts. Successful expression of Vps35-mCherry was verified by PCR, Western blot, and mCherry fluorescence. The Vps35 floxed (Vps35f/f) mice were generated, maintained, and genotyped as described previously [27,48]. The NeuroD6-Cre (also called Nex-Cre) mice were kindly provided by Klaus-Armin Nave [31]. The Vps35Neurod6 mice were generated by breeding Vps35f/f mice with Neurod6-Cre mice. The TgVps35Neurod6 mice were generated by crossing LSL-Vps35-mCherry with Neurod6-Cre mice. The TgVps35Neurod6; KO mice were generated by crossing LSL-Vps35-mCherry mice with Vps35Neurod6 mice. All phenotypic characterizations of Vps35Neurod6 mice, LSL-Vps35-mCherry mice, TgVps35Neurod6 mice, TgVps35Neurod6; KO mice and their control mice were in C57BL/6 background for >6 generations.
All the mouse lines were confirmed by genotyping analysis with PCR. Genotyping of mouse lines was performed by PCR of tail prep DNAs. The following primer pairs were used: Vps35 flox- 5’ AACCAGCTCCCAACAAAATG 3’ and 5’ GCTTGGTCCCACTCACATTT 3’ to amplify a 180-bp in WT allele and a 220-bp in floxed allele; Neurod6-Cre- 5’ GAGTCC TGGAATCAGTCTTTTTC 3’ and 5’ CCGCATAACCAGTGAAACAG 3’ to amplify a 550-bp in Cre allele; LSL-Vps35-mCherry- 5’ ACACATTGGAGCACTTGCGCTCAAGACG 3’ and 5’ CTGCCCTTCGCCTGGGACATCCTGT 3’ to amplify a 315-bp in mCherry allele.
All the mice were maintained on a 12-h light-dark cycle with ad libitum access to water and food. Male mice were used for all the studies. All the experiments with animals were performed with the approval of the Institutional Animal Care and Use Committee of Case Western Reserve University (CWRU) according to the National Institute of Health (NIH) guidelines (protocol no. 2017-0121, approved on 11 May 2020).

4.2. Antibodies for Immunostaining and Western Blotting

The following antibodies were used: Rabbit polyclonal anti-Vps35 antibody was generated against the murine Vps35 C-terminal sequence as described previously [16] (diluted 1:1000); rat monoclonal anti-mCherry (diluted 1:500; Thermo Fisher Scientific, Waltham, MA, USA; M11217); mouse monoclonal anti-β-Actin (diluted 1:1000; Cell Signaling, Danvers, MA, USA; 3700S); mouse monoclonal anti-NeuN (diluted 1:1000; EMD Millipore, Billerica, MA, USA; MAB377); mouse monoclonal anti-Camk2a (diluted 1:300; Cell Signaling, Danvers, MA, USA; 50049); goat polyclonal anti-Aldolase C (diluted 1:200; Santa Cruz, Dallas, TX, USA; sc-12065); rat monoclonal anti-PV (diluted 1:500; abcam, Cambridge, MA, USA; ab27853); rabbit polyclonal anti-Vps26a (diluted 1:500; abcam, Cambridge, MA, USA, 23892); mouse monoclonal anti-GM130 (diluted 1:500; BD, San Jose, CA, USA, 610822); mouse monoclonal anti-Rab7 (diluted 1:500; abcam, Cambridge, MA, USA, ab50533); goat polyclonal Iba1 (diluted 1:500; abcam, Cambridge, MA, USA, ab5076); rabbit monoclonal anti-GFAP (diluted 1:200; Cell Signaling, Danvers, MA, USA; 12389); rabbit polyclonal anti-cleaved caspase-3 (diluted 1:300; Cell Signaling, Danvers, MA, USA; 9661); mouse monoclonal anti-P62 (diluted 1:500; abcam, Cambridge, MA, USA; ab56416); rabbit polyclonal anti-TDP43 (C-terminal) (diluted 1:500; Proteintech, Chicago, IL, USA; 12892–1-AP); mouse monoclonal anti-Vps29 (diluted 1:200; Santa Cruz, Dallas, TX, USA; sc-398874).

4.3. Nissl and Golgi Staining

For Nissl staining, sections of mouse brains were incubated in 0.1% cresyl violet solution for 5–10 min, then quickly washed in distilled water and dehydrated in increasing ethanol concentrations (70%, 80%, 90%, and 100% ethanol for 2–3 min step by step). The sections were cleared with xylene for 2–5 min, mounted with DPX Mountant (Sigma-Aldrich, St Louis, MO, USA; 44581) for histology and dried in fume hood. The cortical thickness was measured in Nissl-stained sections using the ImageJ software. Golgi staining was performed using the FD Rapid GolgiStain Kit (FD NeuroTechnologies, Columbia, MD, USA) as described previously [49]. For the neuronal morphometric analysis, pyramidal neurons were randomly selected from somatosensory cortical layer II/III. Images were acquired using a BZX microscope at 10× or 40× magnification, and the total dendritic length and Sholl analysis were calculated by Neuron J (ImageJ v1.8.0, NIH).

4.4. Adeno-Associated Virus (AAV) Injection

For cortex injection, the surgical procedure was performed as described previously with a slight modification [50]. Briefly, mice were anesthetized with Ketamine/Xylazine (HENRY SCHEIN, Melville, NY, USA; #056344) and the head was fixed in a stereotaxic device. After antiseptic treatment, the skull was exposed and cleaned using 1% H2O2. Then, holes were drilled into the skull and viruses (pAAV-hSyn-EGFP Addgene, Boston, MA, USA; #50465) were bilaterally injected into the cortex. After injection, mice were daily cared for 5 days. Two weeks later, mice were anesthetized and perfused and the brains were dissociated for immunofluorescence analysis.
For hippocampus CA1 and entorhinal cortex injection, the surgical procedure was performed as described previously [51]. After anesthetization and fixation as well as treatment of the mice with 1% H2O2 as described above, stereotactic surgery was performed to deliver a volume of 1 μL (1 × 10¹²) of pAAV-synP-FLEX-splitTVA-EGFP-B19G (Addgene, Boston, MA, USA; #52473) [52] into the right side of the CA1 or entorhinal cortex.Then, the rabies virus RbV-EnvA-ΔRgp-MCh (1 μL, 0.5 × 10¹²) was delivered into the same locations 6 or 7 days later. The motorized stereotaxic injector (Stoelting, Kiel, WI, USA; 53311) was used to infuse the virus into the hippocampus at a rate of 0.1 μL/min.

4.5. Tissue Processing and Immunofluorescence

Mice with indicated genotypes were anesthetized and perfused transcardially with 4% paraformaldehyde (PFA; pH 7.4). The brains were dissociated and postfixed overnight, then mounted in agarose prior to vibratome sectioning. In addition, 35–50 µm free-floating vibratome sections of the brains were collected in PBS, then blocked and permeabilized with a blocking solution containing 10% BSA and 0.5% Triton X-100 in PBS for 1 h at room temperature and incubated with primary antibodies in a blocking solution overnight at 4 °C. The brain sections were then washed with a PBS buffer and incubated with the appropriate secondary antibodies at 1:1000 (Thermo Fisher Scientific, Waltham, MA, USA; Alexa Fluor conjugates) for 2 h at room temperature. Brain sections were washed and incubated with DAPI (Thermo Fisher Scientific, Waltham, MA, USA) to reveal the cell nuclei. After washed with PBS, mouse the brain sections were mounted for confocal imaging with the Zeiss LSM 800 system. Images were also taken with the BZX fluorescence microscope.

4.6. Western Blotting

Tissues were dissected and homogenized in a lysis buffer (20 mM Tris-HCl (pH 7.4), 150 mM NaCl, 1% NP-40, 0.5% Triton X-100, 1 mM phenylmethylsulfonyl fluoride (PMSF), 1 mM EDTA, 5 mM sodium fluoride, and 2 mM sodium orthovanadate, and supplemented with a protease inhibitor cocktail (Roche, Indianapolis, IN, USA)). After a 20 min of incubation on ice, frozen and thawed twice, and ultracentrifuged at 100,000× g, 4 °C for 30 min, we got the supernatant as the soluble fraction. Then, the Triton-insoluble pellets were sonicated with 2× volume per original sample weight in urea-lysis buffer (7 M urea, 2 M thiourea, 4% CHAPS, and 30 mM Tris, pH 7.5, and a protease inhibitor cocktail (Roche)) and centrifuged at 100,000× g for 30 min at 22 °C, and we got the supernatants as the insoluble fraction [27]. The protein concentration was measured by the BCA assay (Pierce Biotechnology, Rockford, IL, USA) and the supernatants were mixed with a loading buffer. Then, for Western blot analysis, based on the protein molecular weight, we used 8% or 10% SDS-PAGE gels to separate the proteins and transferred them onto Nitrocellulose Blotting Membranes. After blocking with 5% low fat dried milk (in 1x TBST) for 1 h at room temperature, antigen specific primary antibodies were diluted to incubate the membrane overnight at 4 °C, then species-specific horseradish-peroxidase-conjugated secondary antibodies (1:5000, Thermo Fisher Scientific, Waltham, MA, USA) and ECL kit (Pierce Biotechnology, Rockford, IL, USA) were used for visualizing the target proteins. For quantitative analysis, the Image J software were used to analyze the protein bands, which were normalized to the loading control (β-actin).

4.7. Jade C Staining

Jade C staining was performed as described previously [27]. Fluoro-Jade C is a polyanionic fluorescein derivative that can sensitively and selectively bind to degenerative neurons [53]. Brain sections were mounted on gelatin-coated slides and subjected to Jade C staining according to the manufacturer’s protocol (Fluoro-Jade C, Millipore, Billerica, MA, USA). Then, sections were imaged with the Zeiss LSM 800 system v2.3 lite.

4.8. Quantitative Real-Time RT-PCR (qRT-PCR)

Total RNA was extracted from the cortex and hippocampus using a TRIzol reagent (Life Technologies, Waltham, MA, USA) as previously described [54]. Then, purified RNA (5 µg) was used for cDNA synthesis with the GoScript Reverse Transcription System (Promega, Madison, WI). The cDNA products were subjected for subsequent qPCR using SYBR green (QIAGEN, Germantown, MD, USA) in the CFX96 real-time system (Bio-Rad, Hercules, CA, USA). The primers used were as follows:
  • Vps35-mCherry, forward: 5′ AGAGTCTGAGGGGCCAATCT 3′,
  • reverse: 5′ CCTTGAAGCGCATGAACTCC 3′;
  • Vps35, forward: 5′ TTGGTAGAAATGTGCCGTGGTGT 3′,
  • reverse: 5′ CATCCGCACCCAGAGCTTATTCA 3′;
  • Vps26a, forward: 5′ CTCGTGCTTGTTGATGAGGAGG 3′,
  • reverse: 5′ CGCTGGTGAAAGTTCGTCCTCT 3′;
  • Vps29, forward: 5′ TGCACCAAGGAGAGCTACGACT 3′,
  • reverse: 5′ ACTTGGTGTCCGTGGATCAGAC 3′;
  • GAPDH, forward: 5′ AAG GTC ATC CCA GAG CTG AA 3′,
  • reverse: 5′ CTG CTT CAC CAC CTT CTT GA 3′.
Each sample was repeated at least 3 times, and the mRNA level was normalized to GAPDH using the 2△△Ct method.

4.9. RNA Scope

The RNA scope was performed in the mouse brain using the RNAscope® Multiplex Fluorescent Detection Kit (Noble Park North, Australia; PN323110). The Vps35 probe and hybrid oven were purchased from the ACDbio company, and all the procedures were performed according to the manufacturer’s protocol. Briefly, the mice were deeply anesthetized and perfused with 4% paraformaldehyde (PFA; pH 7.4). Next, the brains were dissected and post-fixed with 4% PFA for 3 h and dehydrated with 30% sucrose in PBS. Then, the brains were cryo-sectioned into 10 µm sections using a freezing microtome (Leica, Buffalo Grove, IL, USA). Subsequent processing followed the RNAscope® Multiplex Fluorescent Reagent Kit v2 User Manual. Finally, sections were imaged with the Zeiss LSM 800 system.

Supplementary Materials

Author Contributions

Conceptualization, Y.Z. and W.-C.X.; methodology, Y.Z. and F.T.; software, Y.Z. and D.L.; validation, Y.Z.; formal analysis, Y.Z. and D.L.; investigation, Y.Z. and D.L.; data curation, Y.Z. and D.L.; writing—original draft preparation, Y.Z.; writing—review and editing, Y.Z. and W.-C.X.; visualization, Y.Z. and D.L.; supervision, Y.Z. and W.-C.X.; project administration, W.-C.X.; funding acquisition, W.-C.X. All authors have read and agreed to the published version of the manuscript.

Funding

This work was supported in part by funding of NIH (AG045781).

Institutional Review Board Statement

The study was approved by the Institutional Animal Care and Use Committee of Case Western Reserve University (protocol no. 2017-0121, approved on 11 May 2020).

Informed Consent Statement

Not applicable.

Data Availability Statement

The data presented in this study are available in Supplementary Materials.

Acknowledgments

We thank the Xiong lab members who provided advice and suggestions for this project.

Conflicts of Interest

The authors have declared that no conflict of interest exists.

References

  1. Seaman, M.N. The retromer complex—Endosomal protein recycling and beyond. J. Cell Sci. 2012, 125, 4693–4702. [Google Scholar] [CrossRef] [Green Version]
  2. Chamberland, J.P.; Ritter, B. Retromer revisited: Evolving roles for retromer in endosomal sorting. J. Cell Biol. 2017, 216, 3433–3436. [Google Scholar] [CrossRef]
  3. Burd, C.; Cullen, P.J. Retromer: A master conductor of endosome sorting. Cold Spring Harb. Perspect. Biol. 2014, 6, a016774. [Google Scholar] [CrossRef]
  4. Kim, E.; Lee, Y.; Lee, H.J.; Kim, J.S.; Song, B.S.; Huh, J.W.; Lee, S.R.; Kim, S.U.; Kim, S.H.; Hong, Y.; et al. Implication of mouse Vps26b-Vps29-Vps35 retromer complex in sortilin trafficking. Biochem. Biophys. Res. Commun. 2010, 403, 167–171. [Google Scholar] [CrossRef]
  5. Bugarcic, A.; Zhe, Y.; Kerr, M.C.; Griffin, J.; Collins, B.M.; Teasdale, R.D. Vps26A and Vps26B subunits define distinct retromer complexes. Traffic 2011, 12, 1759–1773. [Google Scholar] [CrossRef]
  6. Seaman, M.N. Cargo-selective endosomal sorting for retrieval to the Golgi requires retromer. J. Cell Biol. 2004, 165, 111–122. [Google Scholar] [CrossRef]
  7. Arighi, C.N.; Hartnell, L.M.; Aguilar, R.C.; Haft, C.R.; Bonifacino, J.S. Role of the mammalian retromer in sorting of the cation-independent mannose 6-phosphate receptor. J. Cell Biol. 2004, 165, 123–133. [Google Scholar] [CrossRef] [PubMed] [Green Version]
  8. Belenkaya, T.Y.; Wu, Y.; Tang, X.; Zhou, B.; Cheng, L.; Sharma, Y.V.; Yan, D.; Selva, E.M.; Lin, X. The retromer complex influences Wnt secretion by recycling wntless from endosomes to the trans-Golgi network. Dev. Cell 2008, 14, 120–131. [Google Scholar] [CrossRef] [PubMed] [Green Version]
  9. Eaton, S. Retromer retrieves wntless. Dev. Cell 2008, 14, 4–6. [Google Scholar] [CrossRef] [Green Version]
  10. Canuel, M.; Lefrancois, S.; Zeng, J.; Morales, C.R. AP-1 and retromer play opposite roles in the trafficking of sortilin between the Golgi apparatus and the lysosomes. Biochem. Biophys. Res. Commun. 2008, 366, 724–730. [Google Scholar] [CrossRef] [PubMed]
  11. Okada, H.; Zhang, W.; Peterhoff, C.; Hwang, J.C.; Nixon, R.A.; Ryu, S.H.; Kim, T.W. Proteomic identification of sorting nexin 6 as a negative regulator of BACE1-mediated APP processing. FASEB J. Off. Publ. Fed. Am. Soc. Exp. Biol. 2010, 24, 2783–2794. [Google Scholar] [CrossRef] [Green Version]
  12. Muhammad, A.; Flores, I.; Zhang, H.; Yu, R.; Staniszewski, A.; Planel, E.; Herman, M.; Ho, L.; Kreber, R.; Honig, L.S.; et al. Retromer deficiency observed in Alzheimer’s disease causes hippocampal dysfunction, neurodegeneration, and Abeta accumulation. Proc. Natl. Acad. Sci. USA 2008, 105, 7327–7332. [Google Scholar] [CrossRef] [Green Version]
  13. Hermey, G. The Vps10p-domain receptor family. Cell. Mol. Life Sci. CMLS 2009, 66, 2677–2689. [Google Scholar] [CrossRef] [PubMed]
  14. Vieira, S.I.; Rebelo, S.; Esselmann, H.; Wiltfang, J.; Lah, J.; Lane, R.; Small, S.A.; Gandy, S.; Silva, E.F.C.; Silva, O.A.B.C. Retrieval of the Alzheimer’s amyloid precursor protein from the endosome to the TGN is S655 phosphorylation state-dependent and retromer-mediated. Mol. Neurodegener. 2010, 5, 40. [Google Scholar] [CrossRef] [Green Version]
  15. Mecozzi, V.J.; Berman, D.E.; Simoes, S.; Vetanovetz, C.; Awal, M.R.; Patel, V.M.; Schneider, R.T.; Petsko, G.A.; Ringe, D.; Small, S.A. Pharmacological chaperones stabilize retromer to limit APP processing. Nat. Chem. Biol. 2014, 10, 443–449. [Google Scholar] [CrossRef] [PubMed]
  16. Wen, L.; Tang, F.L.; Hong, Y.; Luo, S.W.; Wang, C.L.; He, W.; Shen, C.; Jung, J.U.; Xiong, F.; Lee, D.H.; et al. VPS35 haploinsufficiency increases Alzheimer’s disease neuropathology. J. Cell Biol. 2011, 195, 765–779. [Google Scholar] [CrossRef] [PubMed] [Green Version]
  17. Wang, C.L.; Tang, F.L.; Peng, Y.; Shen, C.Y.; Mei, L.; Xiong, W.C. VPS35 regulates developing mouse hippocampal neuronal morphogenesis by promoting retrograde trafficking of BACE1. Biol. Open 2012, 1, 1248–1257. [Google Scholar] [CrossRef] [Green Version]
  18. Yeh, F.L.; Hansen, D.V.; Sheng, M. TREM2, Microglia, and Neurodegenerative Diseases. Trends Mol. Med. 2017, 23, 512–533. [Google Scholar] [CrossRef]
  19. Yin, J.; Liu, X.; He, Q.; Zhou, L.; Yuan, Z.; Zhao, S. Vps35-dependent recycling of Trem2 regulates microglial function. Traffic 2016, 17, 1286–1296. [Google Scholar] [CrossRef]
  20. Xia, W.F.; Tang, F.L.; Xiong, L.; Xiong, S.; Jung, J.U.; Lee, D.H.; Li, X.S.; Feng, X.; Mei, L.; Xiong, W.C. Vps35 loss promotes hyperresorptive osteoclastogenesis and osteoporosis via sustained RANKL signaling. J. Cell Biol. 2013, 200, 821–837. [Google Scholar] [CrossRef] [Green Version]
  21. Rademakers, R.; Neumann, M.; Mackenzie, I.R. Advances in understanding the molecular basis of frontotemporal dementia. Nat. Rev. Neurol. 2012, 8, 423–434. [Google Scholar] [CrossRef] [PubMed] [Green Version]
  22. Vernay, A.; Sellal, F.; Rene, F. Evaluating Behavior in Mouse Models of the Behavioral Variant of Frontotemporal Dementia: Which Test for Which Symptom? Neuro Degener. Dis. 2016, 16, 127–139. [Google Scholar] [CrossRef] [PubMed]
  23. Seaman, M.N. Recycle your receptors with retromer. Trends Cell Biol. 2005, 15, 68–75. [Google Scholar] [CrossRef]
  24. Li, J.G.; Chiu, J.; Pratico, D. Full recovery of the Alzheimer’s disease phenotype by gain of function of vacuolar protein sorting 35. Mol. Psychiatry 2020, 25, 2630–2640. [Google Scholar] [CrossRef]
  25. Small, S.A.; Kent, K.; Pierce, A.; Leung, C.; Kang, M.S.; Okada, H.; Honig, L.; Vonsattel, J.P.; Kim, T.W. Model-guided microarray implicates the retromer complex in Alzheimer’s disease. Ann. Neurol. 2005, 58, 909–919. [Google Scholar] [CrossRef]
  26. Tang, F.L.; Erion, J.R.; Tian, Y.; Liu, W.; Yin, D.M.; Ye, J.; Tang, B.; Mei, L.; Xiong, W.C. VPS35 in Dopamine Neurons Is Required for Endosome-to-Golgi Retrieval of Lamp2a, a Receptor of Chaperone-Mediated Autophagy That Is Critical for alpha-Synuclein Degradation and Prevention of Pathogenesis of Parkinson’s Disease. J. Neurosci. 2015, 35, 10613–10628. [Google Scholar] [CrossRef] [PubMed]
  27. Tang, F.L.; Zhao, L.; Zhao, Y.; Sun, D.; Zhu, X.J.; Mei, L.; Xiong, W.C. Coupling of terminal differentiation deficit with neurodegenerative pathology in Vps35-deficient pyramidal neurons. Cell Death Differ. 2020, 27, 2099–2116. [Google Scholar] [CrossRef] [PubMed]
  28. Tang, F.L.; Liu, W.; Hu, J.X.; Erion, J.R.; Ye, J.; Mei, L.; Xiong, W.C. VPS35 Deficiency or Mutation Causes Dopaminergic Neuronal Loss by Impairing Mitochondrial Fusion and Function. Cell Rep. 2015, 12, 1631–1643. [Google Scholar] [CrossRef] [Green Version]
  29. Wang, S.; Bellen, H.J. The retromer complex in development and disease. Development 2015, 142, 2392–2396. [Google Scholar] [CrossRef] [Green Version]
  30. Oddo, S.; Caccamo, A.; Shepherd, J.D.; Murphy, M.P.; Golde, T.E.; Kayed, R.; Metherate, R.; Mattson, M.P.; Akbari, Y.; LaFerla, F.M. Triple-Transgenic Model of Alzheimer’s Disease with Plaques and Tangles. Neuron 2003, 39, 409–421. [Google Scholar] [CrossRef] [Green Version]
  31. Goebbels, S.; Bormuth, I.; Bode, U.; Hermanson, O.; Schwab, M.H.; Nave, K.A. Genetic targeting of principal neurons in neocortex and hippocampus of NEX-Cre mice. Genesis 2006, 44, 611–621. [Google Scholar] [CrossRef]
  32. Su, J.H.; Nichol, K.E.; Sitch, T.; Sheu, P.; Chubb, C.; Miller, B.L.; Tomaselli, K.J.; Kim, R.C.; Cotman, C.W. DNA damage and activated caspase-3 expression in neurons and astrocytes: Evidence for apoptosis in frontotemporal dementia. Exp. Neurol. 2000, 163, 9–19. [Google Scholar] [CrossRef]
  33. Kasu, Y.; Alemu, A.S.; Lamari, A.A.; Loew, B.N.; Browera, A. The N Termini of TAR DNA-Binding Protein 43 (TDP43) C-Terminal Fragments Influence Degradation, Aggregation Propensity, and Morphology. Mol. Cell. Biol. 2018, 38, e00243-18. [Google Scholar] [CrossRef] [Green Version]
  34. Schwenk, B.M.; Hartmann, H.; Serdaroglu, A.; Schludi, M.H.; Hornburg, D.; Meissner, F.; Orozco, D.; Colombo, A.; Tahirovic, S.; Michaelsen, M.; et al. TDP-43 loss of function inhibits endosomal trafficking and alters trophic signaling in neurons. EMBO J. 2016, 35, 2350–2370. [Google Scholar] [CrossRef] [PubMed]
  35. Pankiv, S.; Clausen, T.H.; Lamark, T.; Brech, A.; Bruun, J.A.; Outzen, H.; Overvatn, A.; Bjorkoy, G.; Johansen, T. p62/SQSTM1 binds directly to Atg8/LC3 to facilitate degradation of ubiquitinated protein aggregates by autophagy. J. Biol. Chem. 2007, 282, 24131–24145. [Google Scholar] [CrossRef] [PubMed] [Green Version]
  36. Rusten, T.E.; Stenmark, H. p62, an autophagy hero or culprit? Nat. Cell Biol. 2010, 12, 207–209. [Google Scholar] [CrossRef]
  37. Roberson, E.D. Mouse models of frontotemporal dementia. Ann. Neurol. 2012, 72, 837–849. [Google Scholar] [CrossRef] [PubMed]
  38. Fuse, A.; Furuya, N.; Kakuta, S.; Inose, A.; Sato, M.; Koike, M.; Saiki, S.; Hattori, N. VPS29-VPS35 intermediate of retromer is stable and may be involved in the retromer complex assembly process. FEBS Lett. 2015, 589, 1430–1436. [Google Scholar] [CrossRef] [PubMed] [Green Version]
  39. Chu, J.; Pratico, D. The retromer complex system in a transgenic mouse model of AD: Influence of age. Neurobiol. Aging 2017, 52, 32–38. [Google Scholar] [CrossRef] [PubMed]
  40. Berman, D.E.; Ringe, D.; Petsko, G.A.; Small, S.A. The use of pharmacological retromer chaperones in Alzheimer’s disease and other endosomal-related disorders. Neurotherapeutics 2015, 12, 12–18. [Google Scholar] [CrossRef] [Green Version]
  41. Young, J.E.; Fong, L.K.; Frankowski, H.; Petsko, G.A.; Small, S.A.; Goldstein, L.S.B. Stabilizing the Retromer Complex in a Human Stem Cell Model of Alzheimer’s Disease Reduces TAU Phosphorylation Independently of Amyloid Precursor Protein. Stem Cell Rep. 2018, 10, 1046–1058. [Google Scholar] [CrossRef] [Green Version]
  42. Muzio, L.; Sirtori, R.; Gornati, D.; Eleuteri, S.; Fossaghi, A.; Brancaccio, D.; Manzoni, L.; Ottoboni, L.; Feo, L.; Quattrini, A.; et al. Retromer stabilization results in neuroprotection in a model of Amyotrophic Lateral Sclerosis. Nat. Commun. 2020, 11, 3848. [Google Scholar] [CrossRef]
  43. Amor, S.; Peferoen, L.A.; Vogel, D.Y.; Breur, M.; van der Valk, P.; Baker, D.; van Noort, J.M. Inflammation in neurodegenerative diseases—An update. Immunology 2014, 142, 151–166. [Google Scholar] [CrossRef]
  44. Clayton, K.A.; Van Enoo, A.A.; Ikezu, T. Alzheimer’s Disease: The Role of Microglia in Brain Homeostasis and Proteopathy. Front. Neurosci. 2017, 11, 680. [Google Scholar] [CrossRef] [PubMed]
  45. Gonzalez-Reyes, R.E.; Nava-Mesa, M.O.; Vargas-Sanchez, K.; Ariza-Salamanca, D.; Mora-Munoz, L. Involvement of Astrocytes in Alzheimer’s Disease from a Neuroinflammatory and Oxidative Stress Perspective. Front. Mol. Neurosci. 2017, 10, 427. [Google Scholar] [CrossRef] [Green Version]
  46. Gotzl, J.K.; Lang, C.M.; Haass, C.; Capell, A. Impaired protein degradation in FTLD and related disorders. Ageing Res. Rev. 2016, 32, 122–139. [Google Scholar] [CrossRef] [PubMed]
  47. Sanchez-Martin, P.; Komatsu, M. p62/SQSTM1—Steering the cell through health and disease. J. Cell Sci. 2018, 131, jcs222836. [Google Scholar] [CrossRef] [PubMed] [Green Version]
  48. Appel, J.R.; Ye, S.; Tang, F.; Sun, D.; Zhang, H.; Mei, L.; Xiong, W.C. Increased Microglial Activity, Impaired Adult Hippocampal Neurogenesis, and Depressive-like Behavior in Microglial VPS35-Depleted Mice. J. Neurosci. 2018, 38, 5949–5968. [Google Scholar] [CrossRef]
  49. Tian, Y.; Tang, F.L.; Sun, X.; Wen, L.; Mei, L.; Tang, B.S.; Xiong, W.C. VPS35-deficiency results in an impaired AMPA receptor trafficking and decreased dendritic spine maturation. Mol. Brain 2015, 8, 70. [Google Scholar] [CrossRef] [Green Version]
  50. Sun, D.; Sun, X.D.; Zhao, L.; Lee, D.H.; Hu, J.X.; Tang, F.L.; Pan, J.X.; Mei, L.; Zhu, X.J.; Xiong, W.C. Neogenin, a regulator of adult hippocampal neurogenesis, prevents depressive-like behavior. Cell Death Dis. 2018, 9, 8. [Google Scholar] [CrossRef] [Green Version]
  51. Vivar, C.; Potter, M.C.; Choi, J.; Lee, J.Y.; Stringer, T.P.; Callaway, E.M.; Gage, F.H.; Suh, H.; van Praag, H. Monosynaptic inputs to new neurons in the dentate gyrus. Nat. Commun. 2012, 3, 1107. [Google Scholar] [CrossRef] [PubMed] [Green Version]
  52. Kohara, K.; Pignatelli, M.; Rivest, A.J.; Jung, H.Y.; Kitamura, T.; Suh, J.; Frank, D.; Kajikawa, K.; Mise, N.; Obata, Y.; et al. Cell type-specific genetic and optogenetic tools reveal hippocampal CA2 circuits. Nat. Neurosci. 2014, 17, 269–279. [Google Scholar] [CrossRef] [PubMed] [Green Version]
  53. Ehara, A.; Ueda, S. Application of Fluoro-Jade C in acute and chronic neurodegeneration models: Utilities and staining differences. Acta Histochem. Cytochem. 2009, 42, 171–179. [Google Scholar] [CrossRef] [PubMed] [Green Version]
  54. Liu, W.; Tang, F.L.; Erion, J.; Xiao, H.; Ye, J.; Xiong, W.C. Vps35 haploinsufficiency results in degenerative-like deficit in mouse retinal g anglion neurons and impairment of optic nerve injury-induced gliosis. Mol. Brain 2014, 7, 10. [Google Scholar] [CrossRef] [Green Version]
Figure 1. Generation of TgVps35Neurod6; KO mice. (A) TgVps35Neurod6 mice were crossed with Vps35f/f mice to generate TgVps35Neurod6; KO mice. (B) TgVps35Neurod6; KO mice appeared indistinguishable from control littermates at P14. (C,D) Body weight and Kaplan-Meier survival curves of TgVps35Neurod6; KO mice, Vps35Neurod6 mice and littermate controls. (E) Representative images showing the brain size of control, Vps35Neurod6 and TgVps35Neurod6; KO mice at P14. (F) Quantification of the brain size (n = 4 mice per group; one-way ANOVA with Tukey’s multiple-comparison test). (G) Representative Nissl staining of control, Vps35Neurod6 and TgVps35Neurod6; KO mice at P14. (H) Quantification analysis of Nissl staining that revealed a comparable cortical thickness of TgVps35Neurod6; KO mice compared with those of control mice (n = 4 animals per genotype; one-way ANOVA with Tukey’s multiple-comparison test). Scale bars as indicated in each panel. Individual data points were shown as dots with group mean ± S.E.M; * p < 0.05; ** p < 0.01; *** p < 0.001; n.s.: Not significant.
Ijms 22 08394 g001
Figure 2. Vps35-mCherry expression rescues cell death and terminal differentiation deficits of Vps35Neurod6 pups. (A) Representative images of active caspase-3 immunostaining analysis of neocortex at P14. (B) Quantification analysis of active caspase-3+ cells (n = 3 animals per genotype; one-way ANOVA with Tukey’s multiple-comparison test). (C) Representative images of Jade C staining. (D) Quantification analysis of Jade C+ cells (n = 4–8 views from three animals per genotype; one-way ANOVA with Tukey’s multiple-comparison test). (E) Representative images of a Golgi staining pyramidal neuron from the L2-3 projection neurons. (F) Tracing of representative L2-3 pyramidal neurons and assessed by Sholl analysis. (G) Quantification of dendritic complexity as well as apical and basal dendrites length (n = 5 neurons from three animals per genotype; one-way ANOVA with Tukey’s multiple-comparison test). Scale bars as indicated in each panel. Individual data points were shown as dots with group mean ± S.E.M; * p < 0.05; ** p < 0.01; **** p < 0.0001; n.s.: Not significant.
Ijms 22 08394 g002
Figure 3. Vps35-mCherry expression rescues glial activation of Vps35Neurod6 pups at P14. (A,C) Representative images of immunostaining analysis using indicated antibodies in P14 neocortical and hippocampal sections from mice with labelled genotype. Higher-magnification images of the boxed regions were shown in offside panels. (B,D) Quantification of immunofluorescence from A,C. (For A,B: n = 3 animals per genotype; for C,D: n= 6 views from three animals per genotype; one-way ANOVA with Tukey’s multiple-comparison test). Scale bars as indicated in each panel. Individual data points were shown as dots with group mean ± S.E.M; * p < 0.05; ** p < 0.01; *** p < 0.001; n.s.: Not significant.
Ijms 22 08394 g003
Figure 4. Partial recovery of FTD (frontotemporal dementia)-like neuropathology in Vps35Neurod6 neocortex. (A) Representative images of co-immunostaining analysis with antibodies against P62 (green) and NeuN (red) of P14 cortical sections. (B) Quantification analysis of immunofluorescence of from A (n = 3 animals per genotype; one-way ANOVA with Tukey’s multiple-comparison test). (C) Western blot analyses of soluble (by 1% TritonX-100) and insoluble fractions (by 7 M Urea, 2 M Thiourea, 4% CHAPS) of homogenates of P14 control, Vps35Neurod6 and TgVps35Neurod6; KO mice using indicated antibodies. (D) Quantification analysis of relative protein expression levels from C (n = 3 animals per genotype; one-way ANOVA with Tukey’s multiple-comparison test). Scale bars as indicated in each panel. Individual data points were shown as dots with group mean ± S.E.M; * p < 0.05; ** p < 0.01; *** p < 0.001; **** p < 0.0001; n.s.: Not significant.
Ijms 22 08394 g004
Figure 5. Terminal differentiation deficits, FTD (frontotemporal dementia)-like neuropathology, and increased GFAP+ reactive astrocytes and Iba1+ microglia in TgVps35Neurod6; KO cortex. (A) Time graph illustrating the process of AAV-Syn-GFP injection in control (Vps35f/f) and TgVps35Neurod6; KO mice. (B) Representative images and tracing of single neuron labelled with GFP from L2-3 of control and TgVps35Neurod6; KO mice. (C,D) Quantification shows decreased dendritic complexity by Sholl analysis and a reduction of apical and basal dendrites length (n = 4 neurons from three mice per genotype; two-tailed unpaired t-test). (E,F) Western blot analyses and quantification analysis of relative protein expression levels from E (n = 3 animals per genotype; two-tailed unpaired t-test). (G,H) Representative images of immunostaining analysis using indicated antibodies in 2-months-old neocortical sections from mice with labelled genotype. Higher-magnification images of the boxed regions were shown in offside panels. (I) Quantification of immunofluorescence from G,H. (n = 3 animals per genotype; two-tailed unpaired t-test). Scale bars as indicated in each panel. Individual data points were shown as dots with group mean ± S.E.M; * p < 0.05; ** p < 0.01; *** p < 0.001; n.s.: Not significant.
Ijms 22 08394 g005
Figure 6. Cell death and glial activation in TgVps35Neurod6; KO mice at P21. (A) Representative images of active caspase-3 immunostaining analysis of neocortex at P21. (B) Quantification analysis of active caspase-3+ cells (n = 4–6 views from three animals per genotype; one-way ANOVA with Tukey’s multiple-comparison test). (C) Representative images of Jade C staining at P21. (D) Quantification analysis of Jade C+ cells (n = 4–7 views from three animals per genotype; one-way ANOVA with Tukey’s multiple-comparison test). (E) Representative Nissl staining of control, Vps35Neurod6 and TgVps35Neurod6; KO mice at P21. (F) Quantification analysis of Nissl staining that revealed a reduced cortical thickness of TgVps35Neurod6; KO mice compared with those of control mice (n = 4 animals per genotype; one-way ANOVA with Tukey’s multiple-comparison test). (G,I) Representative images of immunostaining analysis using indicated antibodies in P21 neocortical and hippocampal sections from mice with labelled genotype. Higher-magnification images of the boxed regions were shown in offside panels. (H,J) Quantification of immunofluorescence from G,I. (For G,H, n = 3 animals per genotype; for I, J, n = 4 animals per genotype; one-way ANOVA with Tukey’s multiple-comparison test). Scale bars as indicated in each panel. Individual data points were shown as dots with group mean ± S.E.M; * p < 0.05; ** p < 0.01; *** p < 0.001; **** p < 0.0001; n.s.: Not significant.
Ijms 22 08394 g006
Figure 7. Vps35-mCherry expression modulates retromer complex. (A,C,E) Western blot analyses of homogenates of control, Vps35Neurod6 and TgVps35Neurod6; KO brains at different ages using the indicated antibodies. (B,D,F) Quantification analysis of relative protein expression levels from A, C, and E (n = 3 animals per genotype; one-way ANOVA with Tukey’s multiple-comparison test). Individual data points were shown as dots with group mean ± S.E.M; * p < 0.05; ** p < 0.01; *** p < 0.001; **** p < 0.0001; n.s.: Not significant.
Ijms 22 08394 g007
Figure 8. Low level of Vps35-mCherry’s expression. (A) Schematic graph illustrating the primers design for real-time RT-PCR (qRT-PCR) analysis. (B) Quantification of Vps35-mCherry and Vps35 mRNA expression in control, Vps35Neurod6, TgVps35Neurod6 and TgVps35Neurod6; KO brains (n = 3 animals per genotype). (C) Representative images of RNA scope analysis of Vps35 mRNAs (green) in control, Vps35Neurod6 and TgVps35Neurod6; KO cortex. The nuclei were stained with DAPI (blue). (D) Quantification analysis of data in (C) (n = 3 animals per genotype; one-way ANOVA with Tukey’s multiple-comparison test). (E) Quantification of Vps26a and Vps29’s mRNA levels (n = 3 animals per genotype; one-way ANOVA with Tukey’s multiple-comparison test). Scale bars as indicated in each panel. Individual data points were shown as dots with group mean ± S.E.M; * p < 0.05; ** p < 0.01; **** p < 0.0001; n.s.: Not significant.
Ijms 22 08394 g008
Publisher’s Note: MDPI stays neutral with regard to jurisdictional claims in published maps and institutional affiliations.

