
Rosmarinic Acid Increases Macrophage Cholesterol Efflux through Regulation of ABCA1 and ABCG1 in Different Mechanisms

 , and
, and 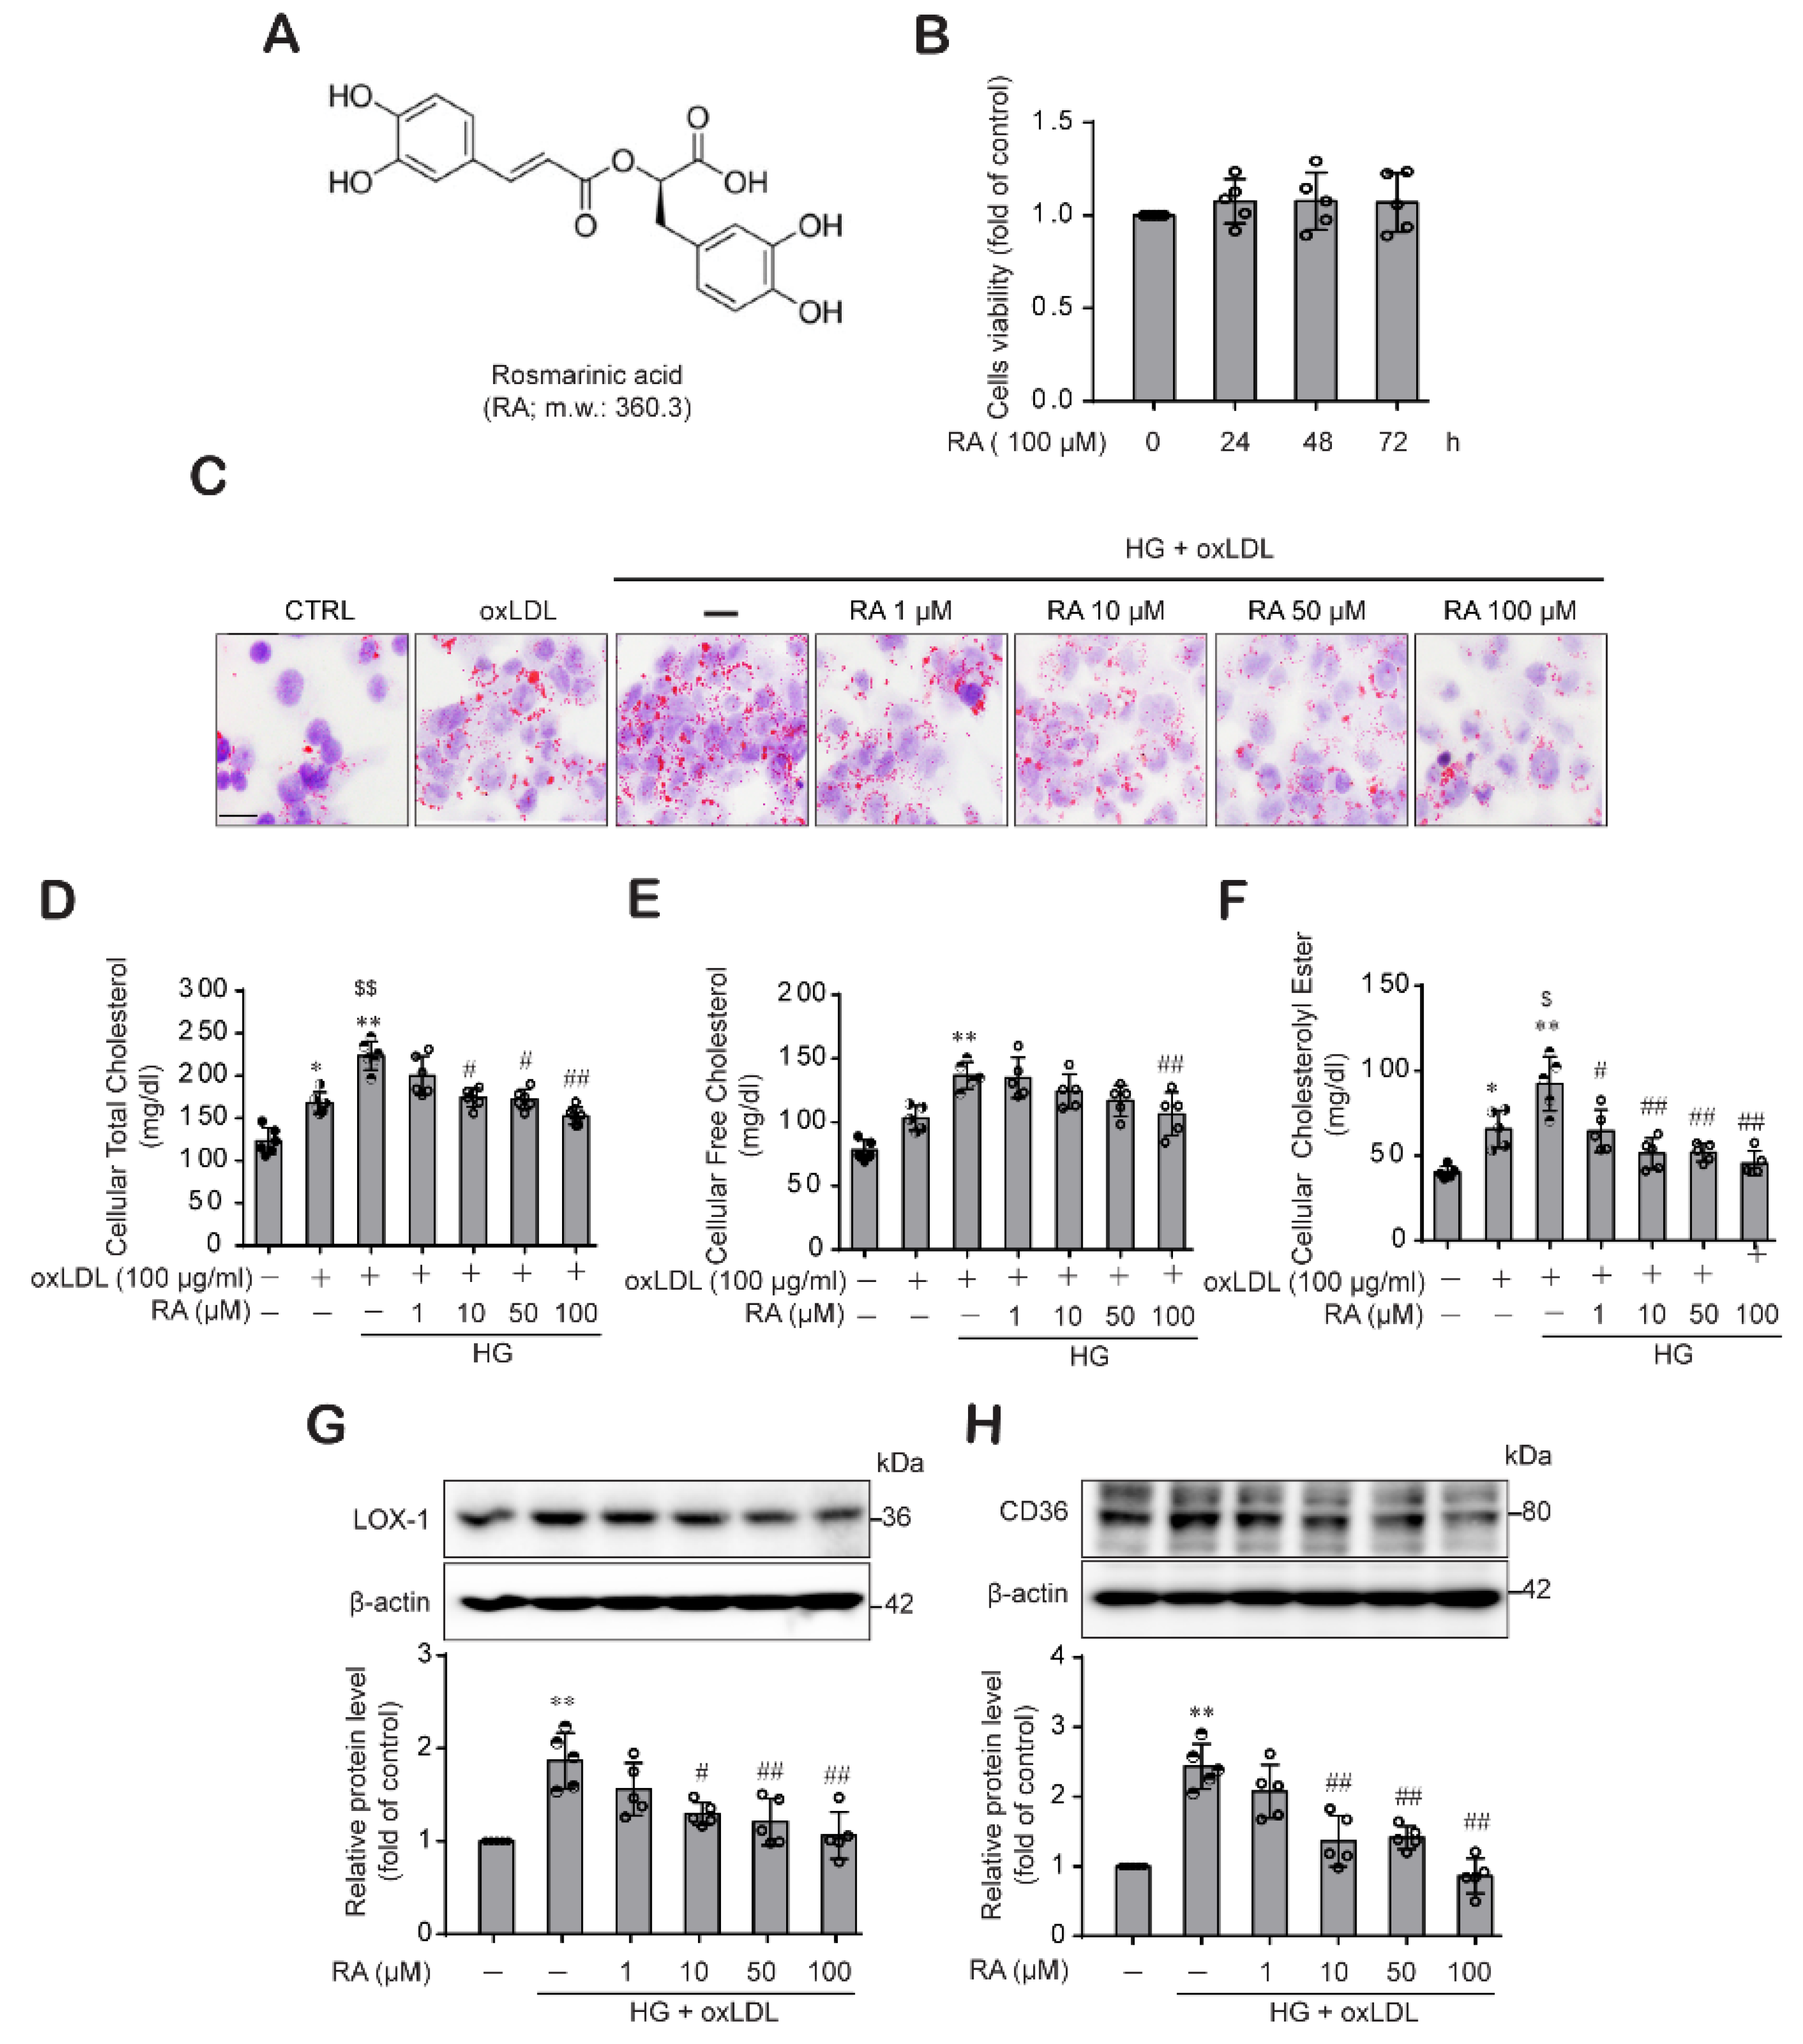
Abstract
:1. Introduction
2. Results
2.1. RA Reduced oxLDL-Induced Lipid and Cholesterol Contents under High Glucose (HG) Conditions in Macrophage
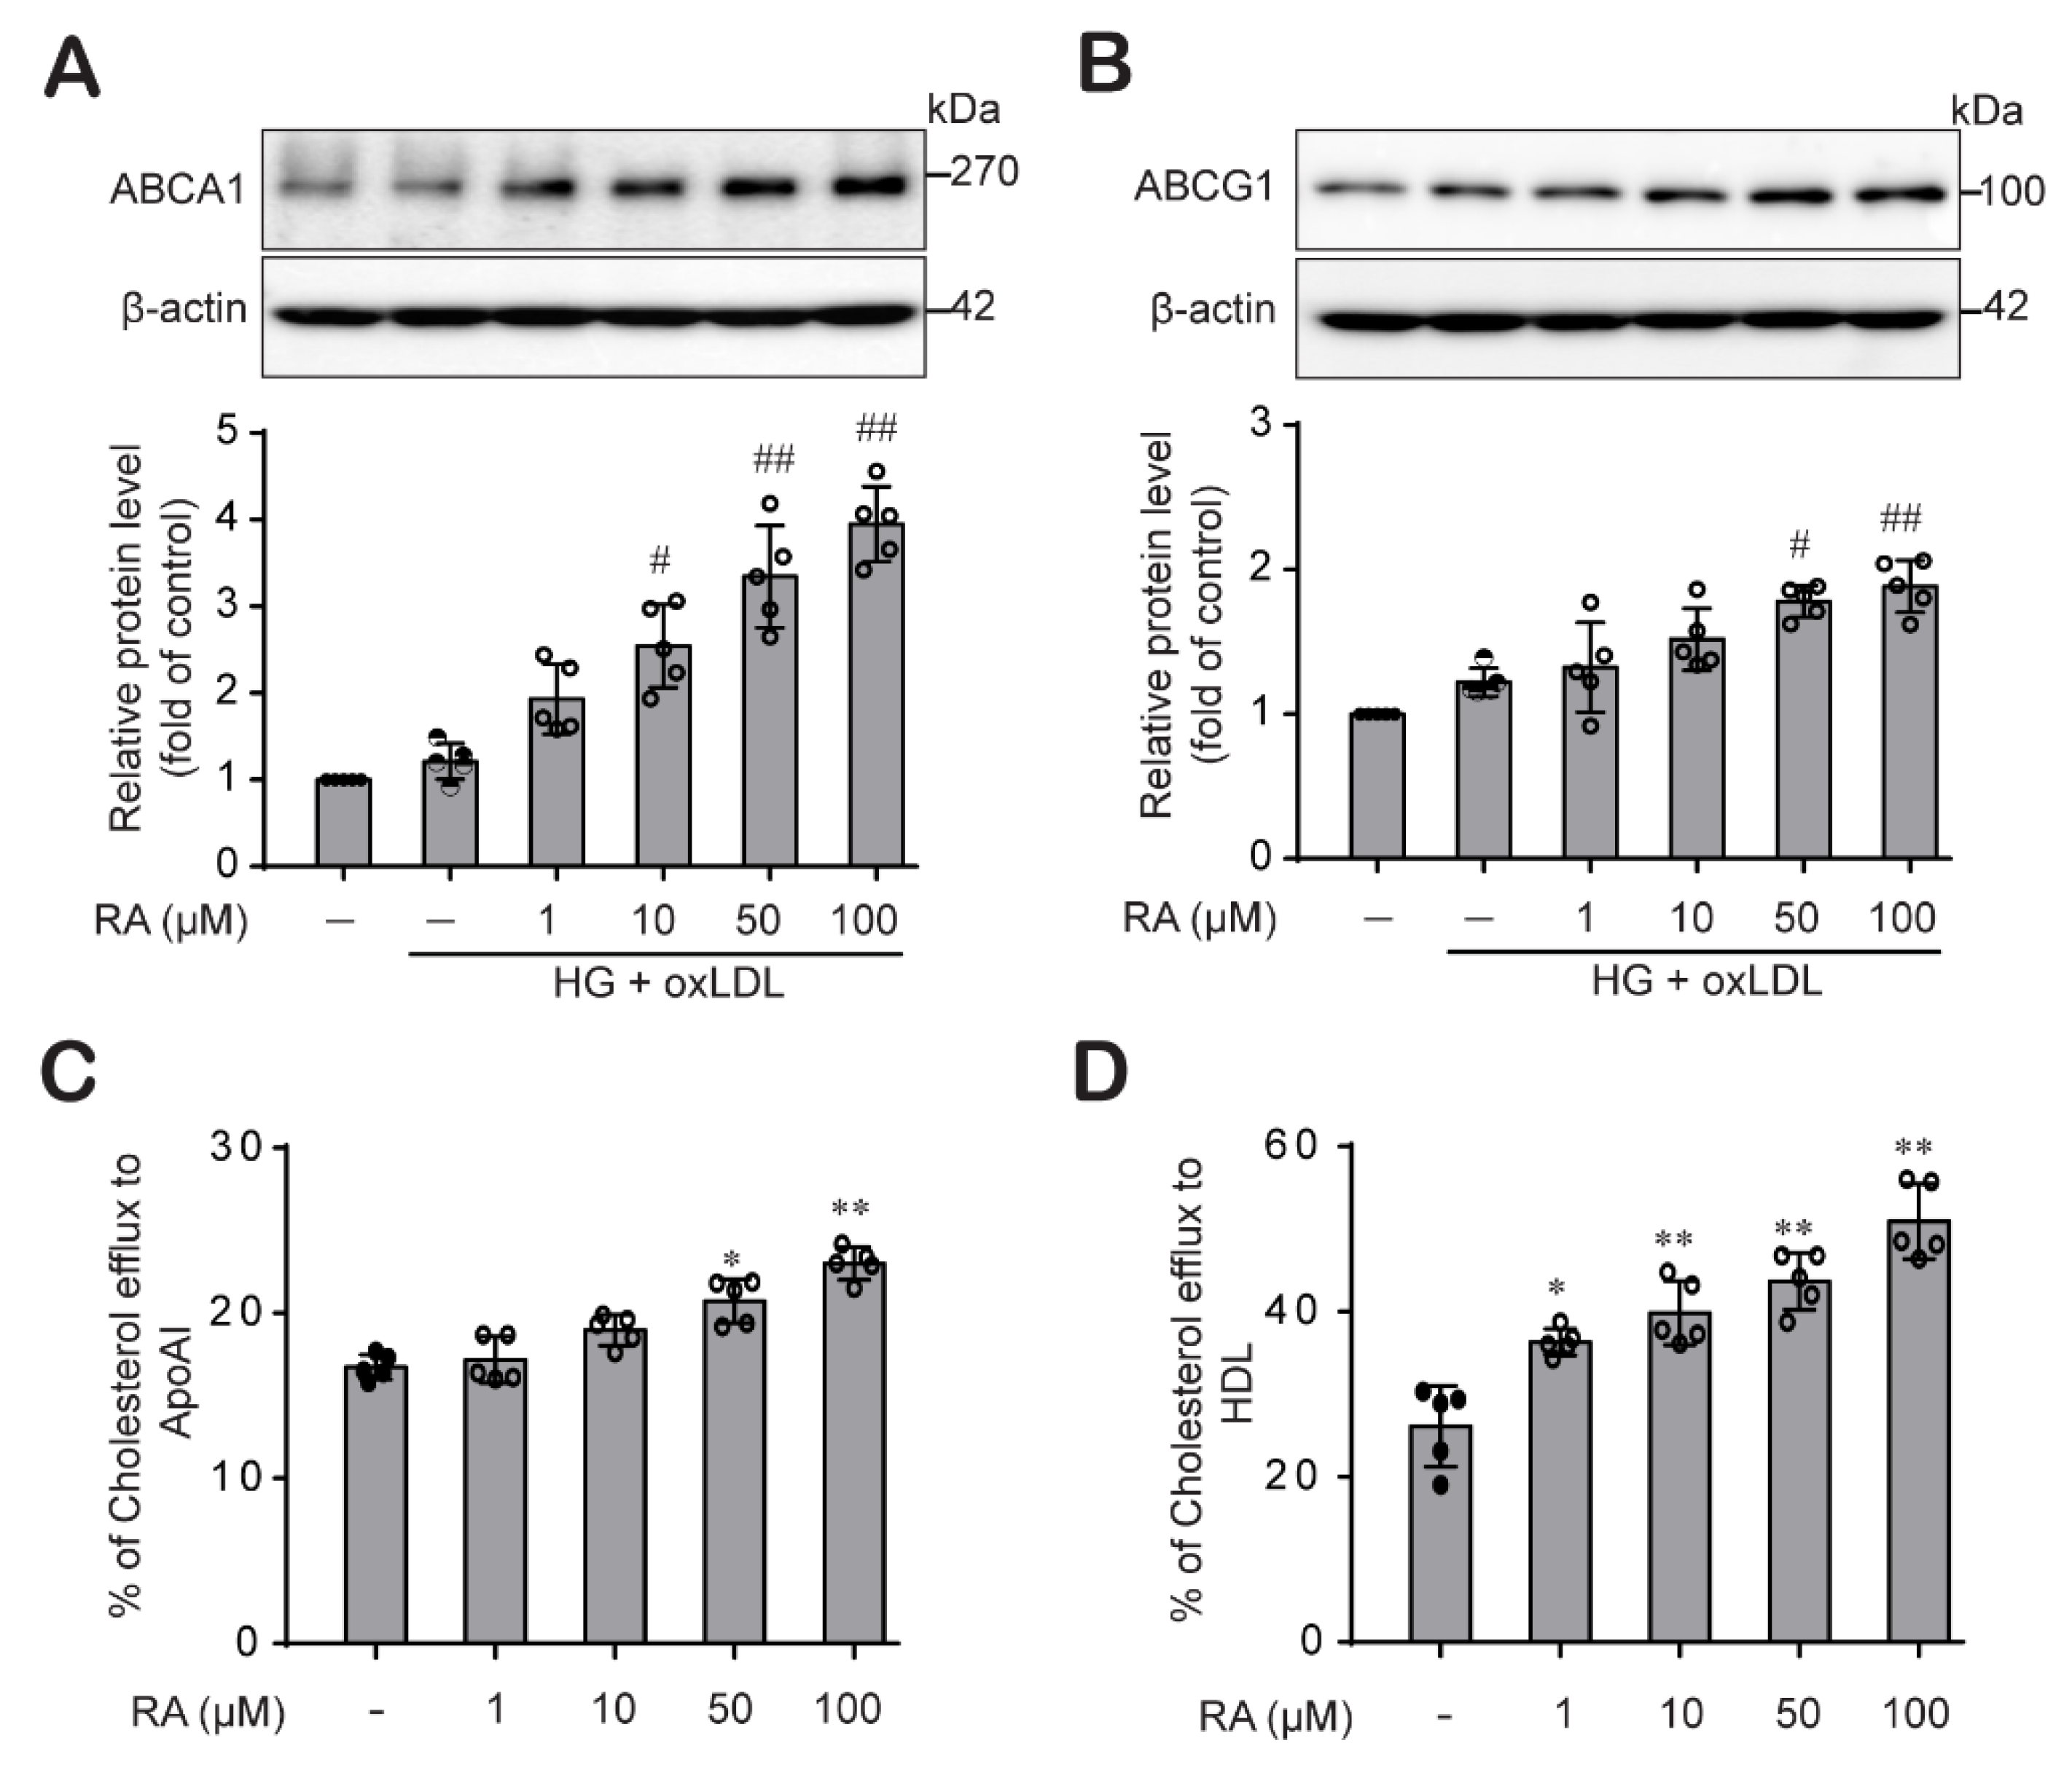
2.2. RA Increases Cholesterol Efflux by Upregulating ABCA1 and ABCG1
2.3. RA Mediated ABCA1 and ABCG1 Expression through the Activation STAT3 Signaling in THP-1 Macrophages
2.4. RA Induced ABCA1 and ABCG1 Expression through Differential Regulation of the MAPK Pathways in THP-1 Macrophages
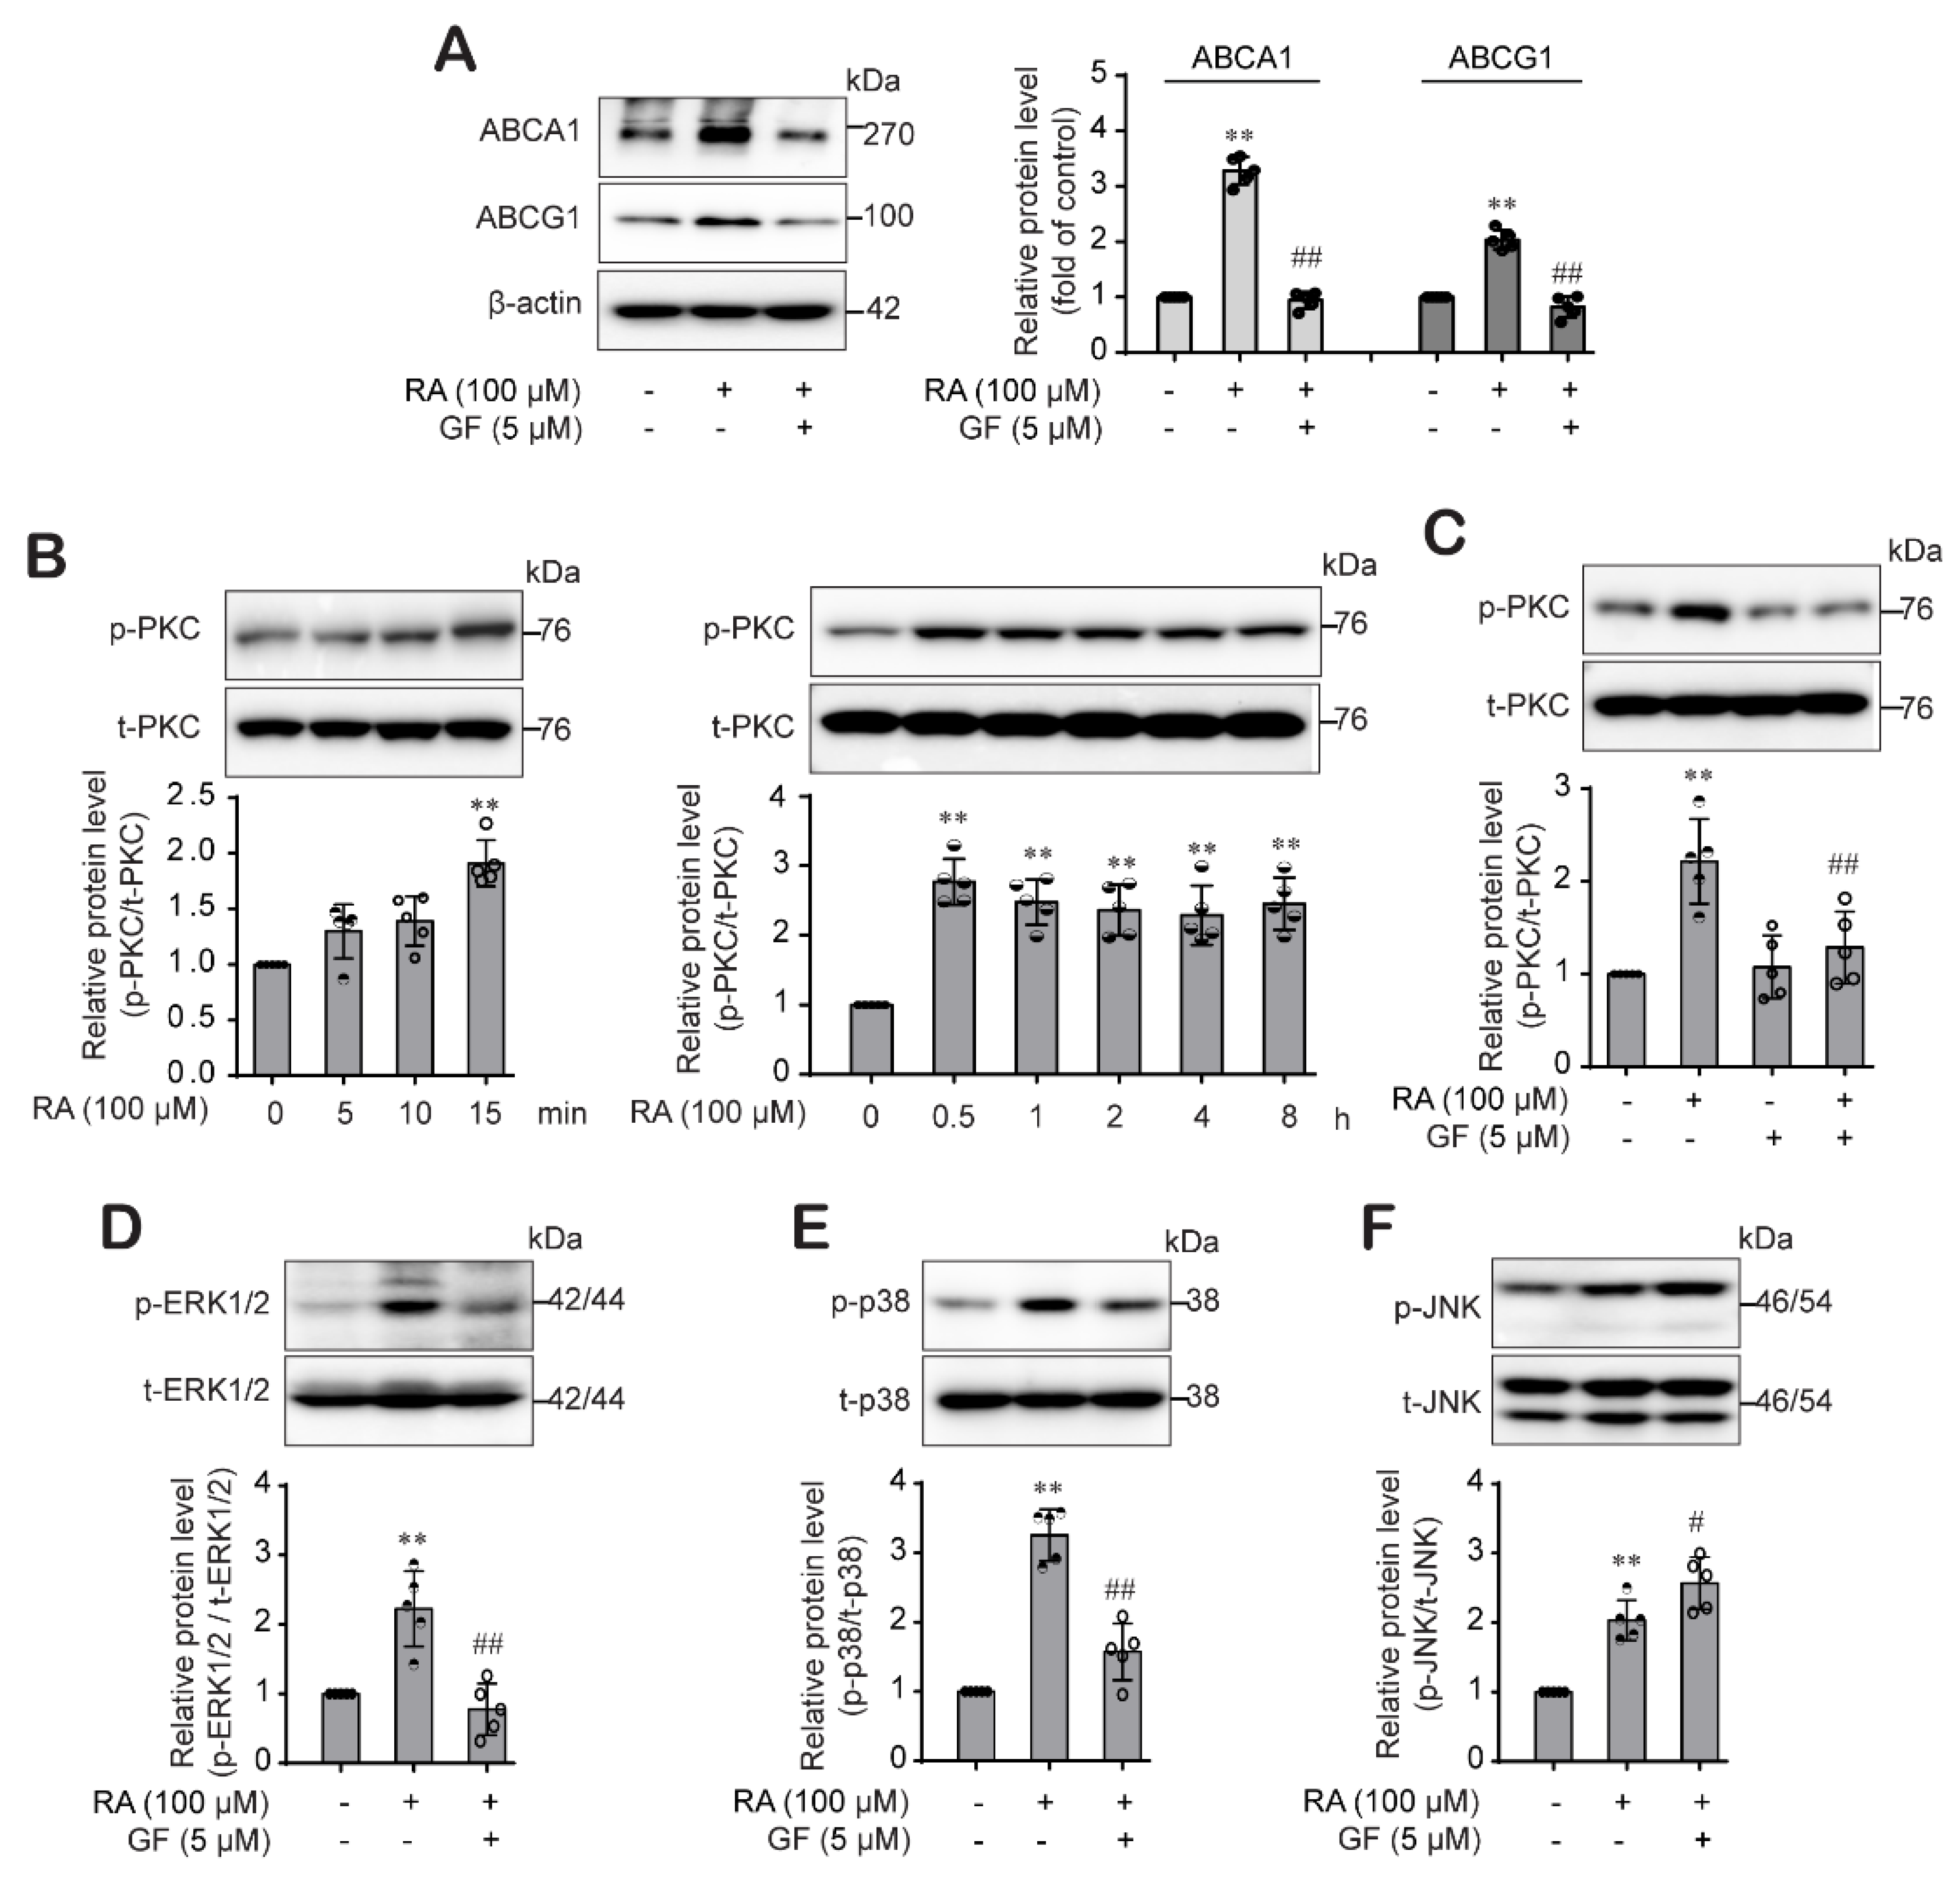
2.5. RA-Activated PKC Pathway Was Involved in the ABCA1 and ABCG1 Expression through Differential Regulation of p38 and ERK1/2 Pathway
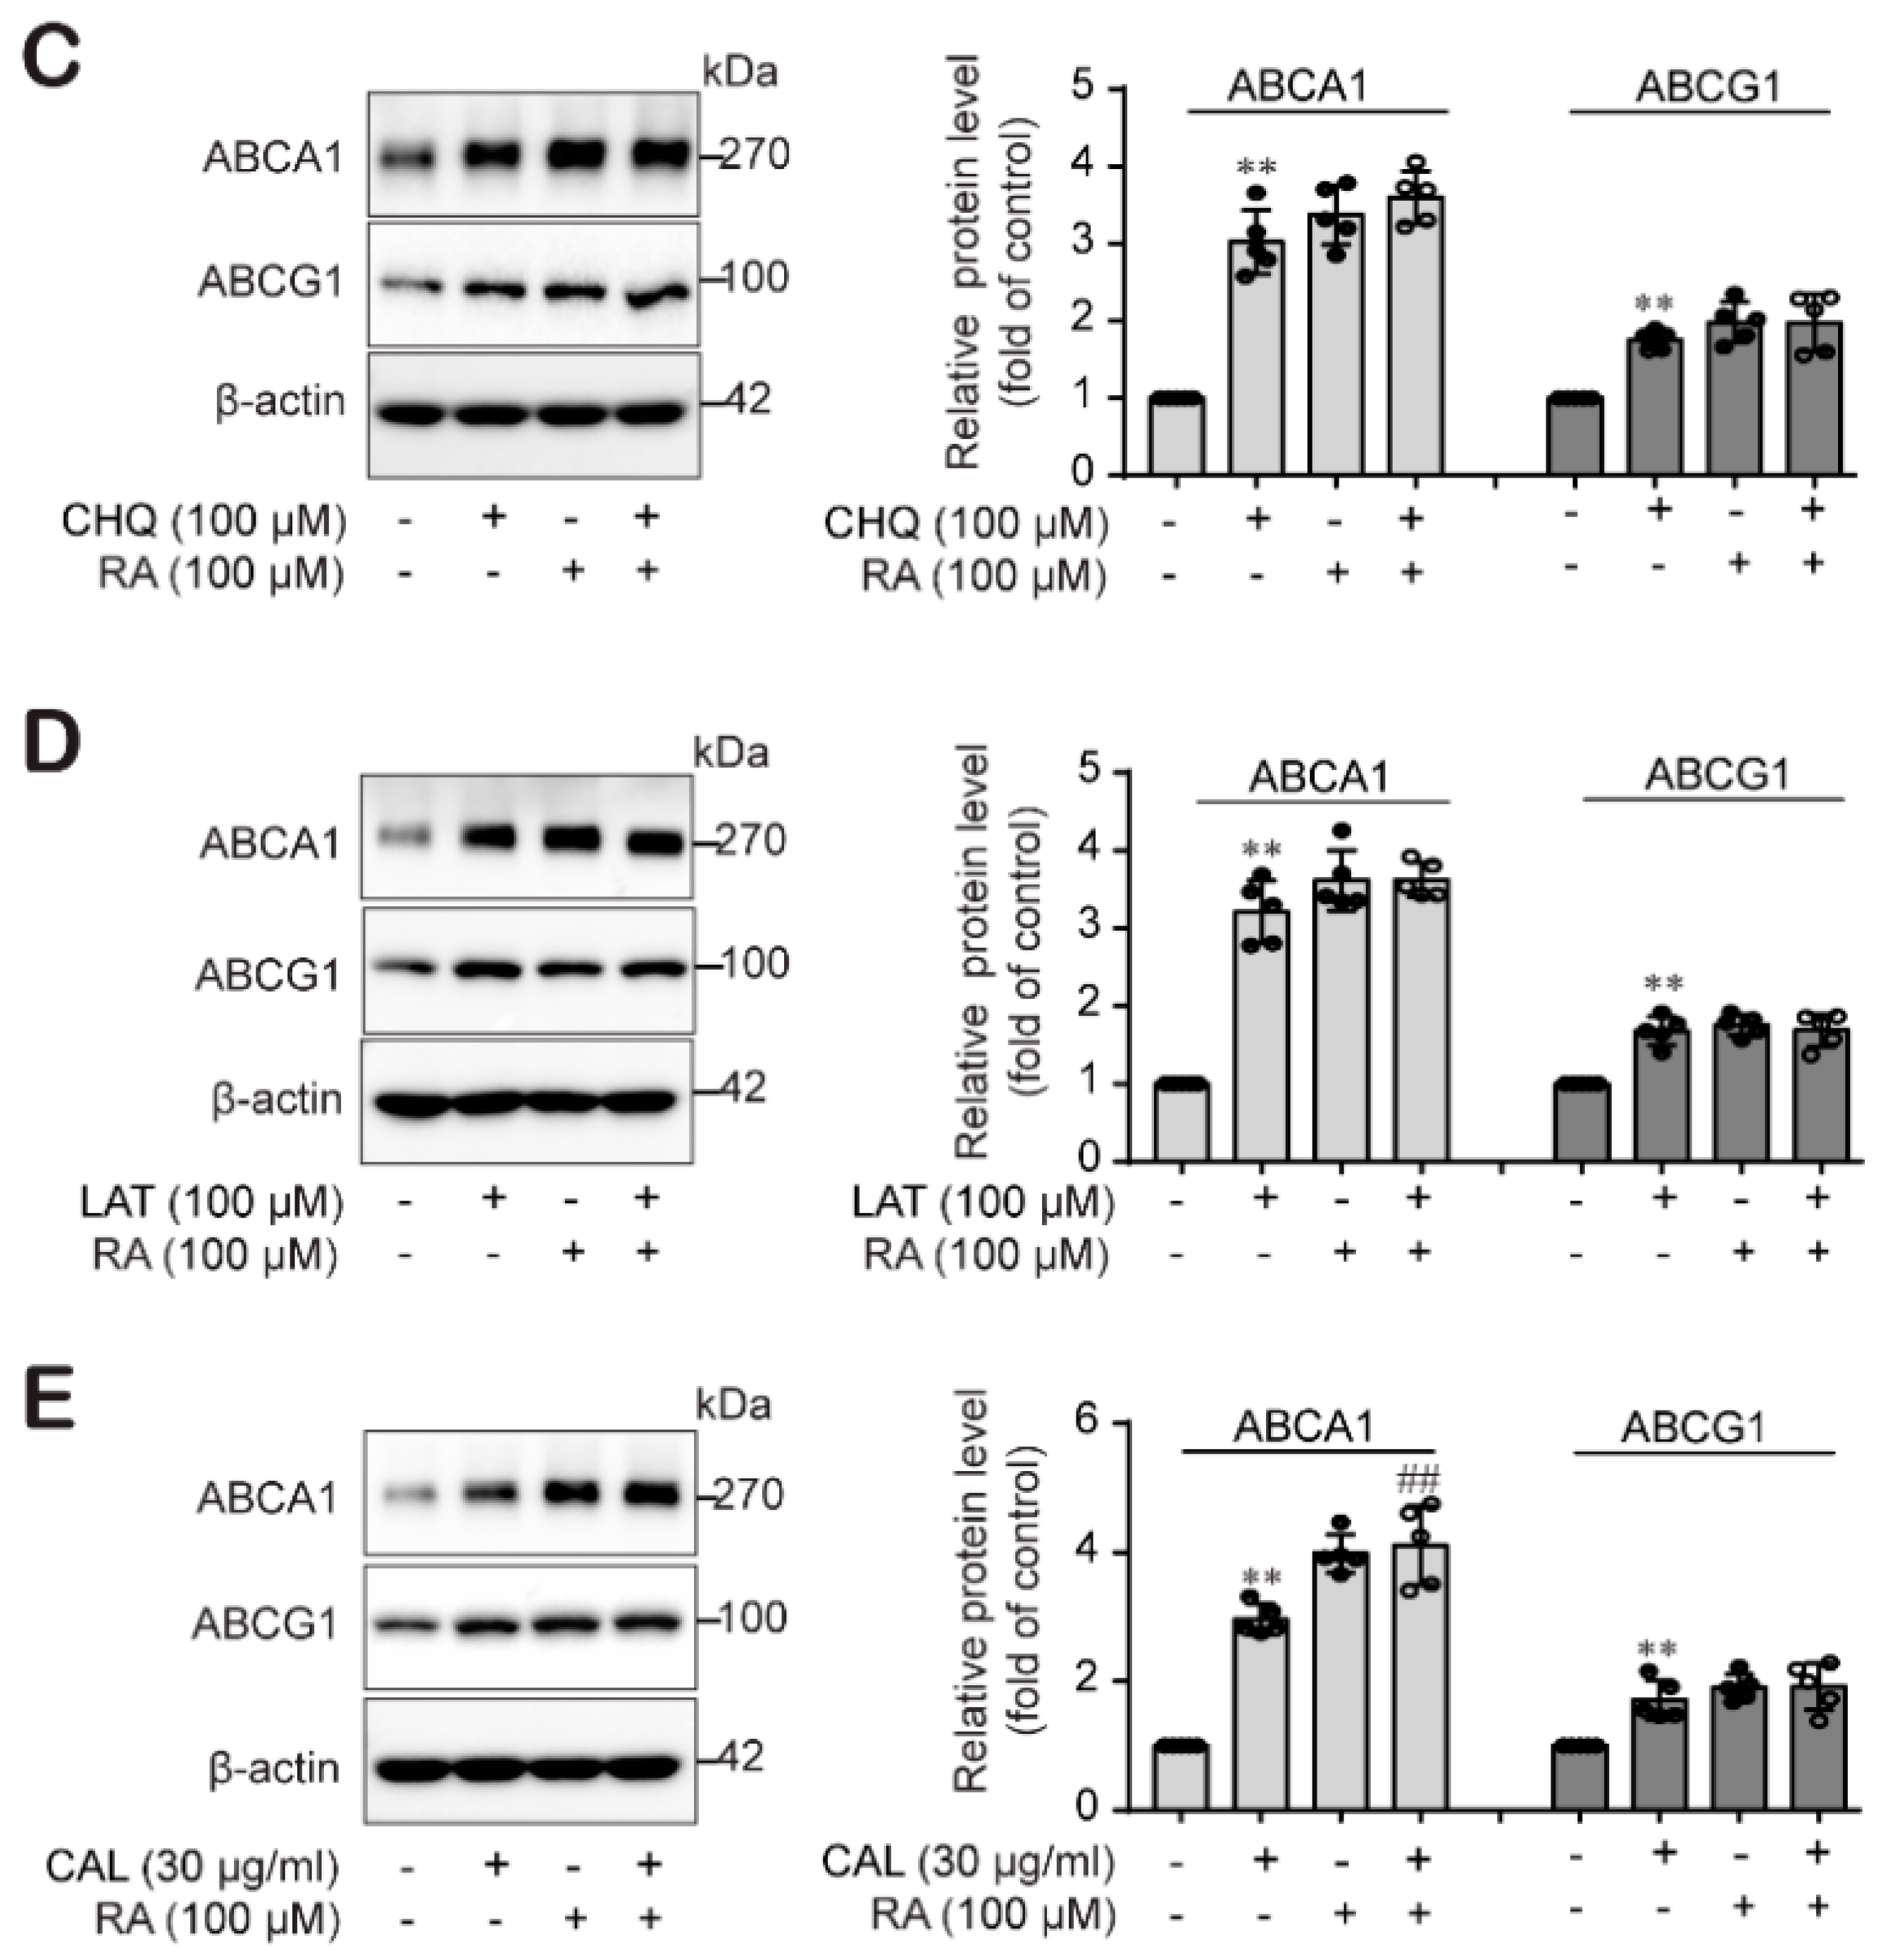
2.6. RA Stabilized ABCA1 Primarily Rather Than ABCG1 Protein Levels by Impairing Protein Degradation in THP-1 Macrophages
3. Discussion
4. Materials and Methods
4.1. Materials
4.2. Preparation of Oxidized Low-Density Lipoprotein (oxLDL) and Cell Treatment
4.3. Cell Culture and Treatment
4.4. Cell Viability Assay
4.5. ORO Staining
4.6. Intracellular Lipid Measurement
4.7. Cholesterol Efflux Assay
4.8. Protein Extraction and Western Blotting
4.9. Data and Statistical Analyses
5. Conclusions
Author Contributions
Funding
Institutional Review Board Statement
Informed Consent Statement
Data Availability Statement
Conflicts of Interest
References
- Katakami, N. Mechanism of development of atherosclerosis and cardiovascular disease in diabetes mellitus. J. Atheroscler. Thromb. 2018, 25, 27–39. [Google Scholar] [CrossRef] [Green Version]
- Rajendran, P.; Rengarajan, T.; Thangavel, J.; Yutaka, N.; Dhanapal, S.; Gautam, S.; Ikuo, N. The vascular endothelium and human diseases. Int. J. Biol. Sci. 2013, 9, 1057–1069. [Google Scholar] [CrossRef] [Green Version]
- Sitia, S.; Tomasoni, L.; Atzeni, F.; Ambrozio, G.; Cordiano, C.; Catapano, A.; Petricone, S.; Tramontana, F.; Naccarato, P.; Camici, P.; et al. From endothelial dysfunction to atherosclerosis. Autoimmun. Rev. 2010, 9, 830–834. [Google Scholar] [CrossRef]
- Tziomalos, K.; Athyros, V.G.; Karagiannis, A.; Mikhailidis, D.P. Endothelial dysfunction in metabolic syndrome: Prevalence, pathogenesis and management. Nutr. Metab. Cardiovasc. Dis. 2010, 20, 140–146. [Google Scholar] [CrossRef]
- Fenyo, I.M.; Gafencu, A.V. The involvement of the monocytes/macrophages in chronic inflammation associated with atherosclerosis. Immunobiology 2013, 218, 1376–1384. [Google Scholar] [CrossRef]
- Ramachandran, S.; Vinitha, A.; Kartha, C.C. Cyclophilin A enhances macrophage differentiation and lipid uptake in high glucose conditions: A cellular mechanism for accelerated macro vascular disease in diabetes mellitus. Cardiovasc. Diabetol. 2016, 15, 152. [Google Scholar] [CrossRef] [Green Version]
- Chistiakov, D.A.; Bobryshev, Y.V.; Orekhov, A.N. Macrophage-mediated cholesterol handling in atherosclerosis. J. Cell. Mol. Med. 2016, 20, 17–28. [Google Scholar] [CrossRef] [Green Version]
- Chistiakov, D.A.; Melnichenko, A.A.; Myasoedova, V.A.; Grechko, A.V.; Orekhov, A.N. Mechanisms of foam cell formation in atherosclerosis. J. Mol. Med. 2017, 95, 1153–1165. [Google Scholar] [CrossRef] [PubMed]
- Di Pietro, N.; Formoso, G.; Pandolfi, A. Physiology and pathophysiology of oxLDL uptake by vascular wall cells in atherosclerosis. Vascul. Pharmacol. 2016, 84, 1–7. [Google Scholar] [CrossRef] [PubMed]
- Duan, J.; Xiang, D.; Luo, H.; Wang, G.; Ye, Y.; Yu, C.; Li, X. Tetramethylpyrazine suppresses lipid accumulation in macrophages via upregulation of the ATP-binding cassette transporters and downregulation of scavenger receptors. Oncol. Rep. 2017, 38, 2267–2276. [Google Scholar] [CrossRef] [PubMed] [Green Version]
- Tashiro, Y.; Sato, K.; Watanabe, T.; Nohtomi, K.; Terasaki, M.; Nagashima, M.; Hirano, T.A. glucagon-like peptide-1 analog liraglutide suppresses macrophage foam cell formation and atherosclerosis. Peptides 2014, 54, 19–26. [Google Scholar] [CrossRef] [PubMed]
- Wu, Y.R.; Shi, X.Y.; Ma, C.Y.; Zhang, Y.; Xu, R.X.; Li, J.J. Liraglutide improves lipid metabolism by enhancing cholesterol efflux associated with ABCA1 and ERK1/2 pathway. Cardiovasc. Diabetol. 2019, 18, 146. [Google Scholar] [CrossRef]
- Chen, S.J.; Tsui, P.F.; Chuang, Y.P.; Chiang, D.M.L.; Chen, L.W.; Liu, S.T.; Lin, F.Y.; Huang, S.M.; Lin, S.H.; Wu, W.L.; et al. Carvedilol ameliorates experimental atherosclerosis by regulating cholesterol efflux and exosome functions. Int. J. Mol. Sci. 2019, 20, 5202. [Google Scholar] [CrossRef] [Green Version]
- Wang, X.; Collins, H.L.; Ranalletta, M.; Fuki, I.V.; Billheimer, J.T.; Rothblat, G.H.; Tall, A.R.; Rader, D.J. Macrophage ABCA1 and ABCG1, but not SR-BI, promote macrophage reverse cholesterol transport in vivo. J. Clin. Investig. 2007, 117, 2216–2224. [Google Scholar] [CrossRef] [PubMed] [Green Version]
- Jiang, T.; Ren, K.; Chen, Q.; Li, H.; Yao, R.; Hu, H.; Lv, Y.C.; Zhao, G.J. Leonurine Prevents Atherosclerosis Via Promoting the Expression of ABCA1 and ABCG1 in a PPARγ/Lxrα Signaling Pathway-Dependent Manner. Cell. Physiol. Biochem. 2017, 43, 1703–1717. [Google Scholar] [CrossRef]
- Yvan-Charvet, L.; Ranalletta, M.; Wang, N.; Han, S.; Terasaka, N.; Li, R.; Welch, C.; Tall, A.R. Combined deficiency of ABCA1 and ABCG1 promotes foam cell accumulation and accelerates atherosclerosis in mice. J. Clin. Investig. 2007, 117, 3900–3908. [Google Scholar] [CrossRef] [PubMed] [Green Version]
- Van Eck, M.; Singaraja, R.R.; Ye, D.; Hildebrand, R.B.; James, E.R.; Hayden, M.R.; Van Berkel, T.J.C. Macrophage ATP-binding cassette transporter A1 overexpression inhibits atherosclerotic lesion progression in low-density lipoprotein receptor knockout mice. Arterioscler. Thromb. Vasc. Biol. 2006, 26, 929–934. [Google Scholar] [CrossRef] [Green Version]
- Westerterp, M.; Murphy, A.J.; Wang, M.; Pagler, T.A.; Vengrenyuk, Y.; Kappus, M.S.; Gorman, D.J.; Nagareddy, P.R.; Zhu, Z.; Abramowicz, S.; et al. Deficiency of ATP-binding cassette transporters a1 and g1 in macrophages increases inflammation and accelerates atherosclerosis in mice. Circ. Res. 2013, 112, 1456–1465. [Google Scholar] [CrossRef]
- Singaraja, R.R.; Fievet, C.; Castro, G.; James, R.; Hennuyer, N.; Clee, S.M.; Bissada, N.; Choy, J.C.; Fruchart, J.C.; McManus, B.M.; et al. Increased ABCA1 activity protects against atherosclerosis. J. Clin. Investig. 2002, 110, 35–42. [Google Scholar] [CrossRef]
- Khera, A.V.; Cuchel, M.; de la Llera-Moya, M.; Rodrigues, A.; Burke, M.F.; Jafri, K.; French, B.C.; Phillips, J.A.; Mucksavage, M.L.; Wilensky, R.L.; et al. Cholesterol Efflux Capacity, High-Density Lipoprotein Function, and Atherosclerosis. N. Engl. J. Med. 2011, 364, 127–135. [Google Scholar] [CrossRef] [Green Version]
- Khera, A.V.; Demler, O.V.; Adelman, S.J.; Collins, H.L.; Glynn, R.J.; Ridker, P.M.; Rader, D.J.; Mora, S. Cholesterol Efflux Capacity, High-Density Lipoprotein Particle Number, and Incident Cardiovascular Events: An Analysis from the JUPITER Trial. Circulation 2017, 135, 2494–2504. [Google Scholar] [CrossRef] [PubMed]
- Shea, S.; Stein, J.H.; Jorgensen, N.W.; McClelland, R.L.; Tascau, L.; Shrager, S.; Heinecke, J.W.; Yvan-Charvet, L.; Tall, A.R. Cholesterol Mass Efflux Capacity, Incident Cardiovascular Disease, and Progression of Carotid Plaque: The Multi-Ethnic Study of Atherosclerosis. Arterioscler. Thromb. Vasc. Biol. 2019, 39, 89–96. [Google Scholar] [CrossRef] [Green Version]
- Ozasa, H.; Ayaori, M.; Iizuka, M.; Terao, Y.; Uto-Kondo, H.; Yakushiji, E.; Takiguchi, S.; Nakaya, K.; Hisada, T.; Uehara, Y.; et al. Pioglitazone enhances cholesterol efflux from macrophages by increasing ABCA1/ABCG1 expressions via PPARγ/LXRα pathway: Findings from in vitro and ex vivo studies. Atherosclerosis 2011, 219, 141–150. [Google Scholar] [CrossRef]
- Chen, K.; Zhao, Z.; Wang, G.; Zou, J.; Yu, X.; Zhang, D.; Zeng, G.; Tang, C. Interleukin-5 promotes ATP-binding cassette transporter A1 expression through miR-211/JAK2/STAT3 pathways in THP-1-dervied macrophages. Acta Biochim. Biophys. Sin. (Shanghai) 2020, 52, 832–841. [Google Scholar] [CrossRef] [PubMed]
- Zhang, Y.; Ge, C.; Wang, L.; Liu, X.; Chen, Y.; Li, M.; Zhang, M. Induction of DKK1 by ox-LDL negatively regulates intracellular lipid accumulation in macrophages. FEBS Lett. 2015, 589, 52–58. [Google Scholar] [CrossRef] [Green Version]
- Kim, G.D.; Park, Y.S.; Jin, Y.H.; Park, C.S. Production and applications of rosmarinic acid and structurally related compounds. Appl. Microbiol. Biotechnol. 2015, 99, 2083–2092. [Google Scholar] [CrossRef] [PubMed]
- Karthik, D.; Viswanathan, P.; Anuradha, C.V. Administration of rosmarinic acid reduces cardiopathology and blood pressure through inhibition of p22phox NADPH oxidase in fructose-fed hypertensive rats. J. Cardiovasc. Pharmacol. 2011, 58, 514–521. [Google Scholar] [CrossRef]
- Sotnikova, R.; Okruhlicova, L.; Vlkovicova, J.; Navarova, J.; Gajdacova, B.; Pivackova, L.; Fialova, S.; Krenek, P. Rosmarinic acid administration attenuates diabetes-induced vascular dysfunction of the rat aorta. J. Pharm. Pharmacol. 2013, 65, 713–723. [Google Scholar] [CrossRef]
- Nyandwi, J.B.; Ko, Y.S.; Jin, H.; Yun, S.P.; Park, S.W.; Kim, H.J. Rosmarinic acid inhibits oxLDL-induced inflammasome activation under high-glucose conditions through downregulating the p38-FOXO1-TXNIP pathway. Biochem. Pharmacol. 2020, 182, 114246. [Google Scholar] [CrossRef]
- Li, L.; Sawamura, T.; Renier, G. Glucose Enhances Human Macrophage LOX-1 Expression: Role for LOX-1 in Glucose-Induced Macrophage Foam Cell Formation. Circ. Res. 2004, 94, 892–901. [Google Scholar] [CrossRef]
- Fu, H.; Tang, Y.Y.; Ouyang, X.P.; Tang, S.L.; Su, H.; Li, X.; Huang, L.P.; He, M.; Lv, Y.C.; He, P.P.; et al. Interleukin-27 inhibits foam cell formation by promoting macrophage ABCA1 expression through JAK2/STAT3 pathway. Biochem. Biophys. Res. Commun. 2014, 452, 881–887. [Google Scholar] [CrossRef]
- Wang, L.; Palme, V.; Rotter, S.; Schilcher, N.; Cukaj, M.; Wang, D.; Ladurner, A.; Heiss, E.H.; Stangl, H.; Dirsch, V.M.; et al. Piperine inhibits ABCA1 degradation and promotes cholesterol efflux from THP-1-derived macrophages. Mol. Nutr. Food Res. 2017, 61, 1–10. [Google Scholar] [CrossRef]
- Patel, D.C.; Albrecht, C.; Pavitt, D.; Paul, V.; Pourreyron, C.; Newman, S.P.; Godsland, I.F.; Valabhji, J.; Johnston, D.G. Type 2 diabetes is associated with reduced ATP-binding cassette transporter A1 gene expression, protein and function. PLoS ONE 2011, 6, e22142. [Google Scholar] [CrossRef] [PubMed] [Green Version]
- Wan, Z.; Fan, Y.; Liu, X.; Zue, J.; Han, Z.; Zhu, C.; Wang, Z. NLRP3 inflammasome promotes diabetes-induced endothelial inflammation and atherosclerosis. Diabetes Metab. Syndr. Obes. Targets Ther. 2019, 12, 1931–1942. [Google Scholar] [CrossRef] [PubMed] [Green Version]
- Yu, X.H.; Fu, Y.C.; Zhang, D.W.; Yin, K.; Tang, C.K. Foam cells in atherosclerosis. Clin. Chim. Acta 2013, 424, 245–252. [Google Scholar] [CrossRef] [PubMed] [Green Version]
- Ouimet, M.; Barrett, T.J.; Fisher, E.A. HDL and reverse cholesterol transport: Basic mechanisms and their roles in vascular health and disease. Circ. Res. 2019, 124, 1505–1518. [Google Scholar] [CrossRef] [PubMed]
- Jeong, S.J.; Lee, M.N.; Oh, G.T. The Role of Macrophage Lipophagy in Reverse Cholesterol Transport. Endocrinol. Metab. 2017, 32, 41–46. [Google Scholar] [CrossRef] [PubMed]
- Liang, C.P.; Han, S.; Okamoto, H.; Carnemolla, R.; Tabas, I.; Accili, D.; Tall, A.R. Increased CD36 protein as a response to defective insulin signaling in macrophages. J. Clin. Investig. 2004, 113, 764–773. [Google Scholar] [CrossRef] [Green Version]
- Cavelier, C.; Lorenzi, I.; Rohrer, L.; von Eckardstein, A. Lipid efflux by the ATP-binding cassette transporters ABCA1 and ABCG1. Biochim. Biophys. Acta Mol. Cell Biol. Lipids 2006, 1761, 655–666. [Google Scholar] [CrossRef]
- Frambach, S.J.C.M.; de Haas, R.; Smeitink, J.A.M.; Rongen, G.A.; Russel, F.G.M.; Schirris, T.J.J. Brothers in arms: ABCA1-and ABCG1-mediated cholesterol efflux as promising targets in cardiovascular disease treatments. Pharmacol. Rev. 2020, 72, 152–190. [Google Scholar] [CrossRef]
- Demina, E.P.; Miroshnikova, V.V.; Schwarzman, A.L. Role of the ABC transporters A1 and G1, key reverse cholesterol transport proteins, in atherosclerosis. Mol. Biol. 2016, 50, 193–199. [Google Scholar] [CrossRef]
- Khera, A.V.; Rader, D.J. Future therapeutic directions in reverse cholesterol transport. Curr. Atheroscler. Rep. 2010, 12, 73–81. [Google Scholar] [CrossRef] [Green Version]
- Tall, A.R. Cholesterol efflux pathways and other potential mechanisms involved in the athero-protective effect of high density lipoproteins. J. Intern. Med. 2008, 263, 256–273. [Google Scholar] [CrossRef]
- Chang, Y.C.; Lee, T.S.; Chiang, A.N. Quercetin enhances ABCA1 expression and cholesterol efflux through a p38-dependent pathway in macrophages. J. Lipid Res. 2012, 53, 1840–1850. [Google Scholar] [CrossRef] [PubMed] [Green Version]
- Zhao, Z.W.; Zhang, M.; Chen, L.Y.; Gong, D.; Xia, X.D.; Yu, X.H.; Wang, S.Q.; Ou, X.; Dai, X.Y.; Zheng, X.L.; et al. Heat shock protein 70 accelerates atherosclerosis by downregulating the expression of ABCA1 and ABCG1 through the JNK/Elk-1 pathway. Biochim. Biophys. Acta Mol. Cell Biol. Lipids 2018, 1863, 806–822. [Google Scholar] [CrossRef]
- Liu, Z.; Wang, J.; Huang, E.; Gao, S.; Li, H.; Lu, J.; Tian, K.; Little, P.J.; Shen, X.; Xu, S.; et al. Tanshinone IIA suppresses cholesterol accumulation in human macrophages: Role of heme oxygenase-1 Oil Red O staining. J. Lipid Res. 2014, 55, 201–213. [Google Scholar] [CrossRef] [PubMed] [Green Version]
- Huwait, E.A.; Singh, N.N.; Michael, D.R.; Davies, T.S.; Moss, J.W.E.; Ramji, D.P. Protein Kinase C Is Involved in the Induction of ATP-Binding Cassette Transporter A1 Expression by Liver X Receptor/Retinoid X Receptor Agonist in Human Macrophages. J. Cell. Biochem. 2015, 116, 2032–2038. [Google Scholar] [CrossRef] [PubMed]
- Nagelin, M.H.; Srinivasan, S.; Lee, J.; Nadler, J.L.; Hedrick, C.C. 12/15-Lipoxygenase Activity Increases the Degradation of Macrophage ATP-Binding Cassette Transporter G1. Arterioscler. Thromb. Vasc. Biol. 2008, 28, 1811–1819. [Google Scholar] [CrossRef] [Green Version]
- Nagelin, M.H.; Srinivasan, S.; Nadler, J.L.; Hedrick, C.C. Murine 12/15-lipoxygenase regulates ATP-binding cassette transporter G1 protein degradation through p38- and JNK2-dependent pathways. J. Biol. Chem. 2009, 284, 31303–31314. [Google Scholar] [CrossRef] [Green Version]
- Gelissen, I.C.; Cartland, S.; Brown, A.J.; Sandoval, C.; Kim, M.; Dinnes, D.L.; Lee, Y.; Hsieh, V.; Gaus, K.; Kritharides, L.; et al. Expression and stability of two isoforms of ABCG1 in human vascular cells. Atherosclerosis 2010, 208, 75–82. [Google Scholar] [CrossRef]
- Watanabe, T.; Kioka, N.; Ueda, K.; Matsuo, M. Phosphorylation by protein kinase C stabilizes ABCG1 and increases cholesterol efflux. J. Biochem. 2019, 166, 309–315. [Google Scholar] [CrossRef]
- Gelissen, I.C.; Sharpe, L.J.; Sandoval, C.; Rao, G.; Kockx, M.; Kritharides, L.; Jessup, W.; Brown, A.J. Protein kinase A modulates the activity of a major human isoform of ABCG1. J. Lipid Res. 2012, 53, 2133–2140. [Google Scholar] [CrossRef] [PubMed] [Green Version]
- Aziz, M.H.; Manoharan, H.T.; Church, D.R.; Dreckschmidt, N.E.; Zhong, W.; Oberley, T.D.; Wilding, G.; Verma, A.K. Protein kinase Cepsilon interacts with signal transducers and activators of transcription 3 (Stat3), phosphorylates Stat3Ser727, and regulates its constitutive activation in prostate cancer. Cancer Res. 2007, 67, 8828–8838. [Google Scholar] [CrossRef] [Green Version]
- Jain, N.; Zhang, T.; Kee, W.H.; Li, W.; Cao, X. Protein kinase Cδ associates with and phosphorylates Stat3 in an interleukin-6-dependent manner. J. Biol. Chem. 1999, 274, 24392–24400. [Google Scholar] [CrossRef] [Green Version]
- Xuan, Y.T.; Guo, Y.; Zhu, Y.; Wang, O.; Rokosh, G.; Messing, R.O.; Bolli, R. Role of the protein kinase C-ε-Raf-1-MEK-1/2-p44/42 MAPK signaling cascade in the activation of signal transducers and activators of transcription 1 and 3 and induction of cyclooxygenase-2 after ischemic preconditioning. Circulation 2005, 112, 1971–1978. [Google Scholar] [CrossRef]
- Moore, K.J.; Tabas, I. Macrophages in the pathogenesis of atherosclerosis. Cell 2011, 145, 341–355. [Google Scholar] [CrossRef] [PubMed] [Green Version]
- Barrett, T.J. Macrophages in Atherosclerosis Regression. Arterioscler. Thromb. Vasc. Biol. 2020, 40, 20–33. [Google Scholar] [CrossRef] [PubMed]
- Ko, Y.S.; Jin, H.; Park, S.W.; Kim, H.J. Salvianolic acid B protects against oxLDL-induced endothelial dysfunction under high-glucose conditions by downregulating ROCK1-mediated mitophagy and apoptosis. Biochem. Pharmacol. 2020, 174, 113815. [Google Scholar] [CrossRef] [PubMed]


Publisher’s Note: MDPI stays neutral with regard to jurisdictional claims in published maps and institutional affiliations. |
© 2021 by the authors. Licensee MDPI, Basel, Switzerland. This article is an open access article distributed under the terms and conditions of the Creative Commons Attribution (CC BY) license (https://creativecommons.org/licenses/by/4.0/).
Share and Cite
Nyandwi, J.-B.; Ko, Y.S.; Jin, H.; Yun, S.P.; Park, S.W.; Kim, H.J. Rosmarinic Acid Increases Macrophage Cholesterol Efflux through Regulation of ABCA1 and ABCG1 in Different Mechanisms. Int. J. Mol. Sci. 2021, 22, 8791. https://0-doi-org.brum.beds.ac.uk/10.3390/ijms22168791
Nyandwi J-B, Ko YS, Jin H, Yun SP, Park SW, Kim HJ. Rosmarinic Acid Increases Macrophage Cholesterol Efflux through Regulation of ABCA1 and ABCG1 in Different Mechanisms. International Journal of Molecular Sciences. 2021; 22(16):8791. https://0-doi-org.brum.beds.ac.uk/10.3390/ijms22168791
Chicago/Turabian StyleNyandwi, Jean-Baptiste, Young Shin Ko, Hana Jin, Seung Pil Yun, Sang Won Park, and Hye Jung Kim. 2021. "Rosmarinic Acid Increases Macrophage Cholesterol Efflux through Regulation of ABCA1 and ABCG1 in Different Mechanisms" International Journal of Molecular Sciences 22, no. 16: 8791. https://0-doi-org.brum.beds.ac.uk/10.3390/ijms22168791