
Activation of Dendritic Cells in Tonsils Is Associated with CD8 T Cell Responses following Vaccination with Live Attenuated Classical Swine Fever Virus

 , , and
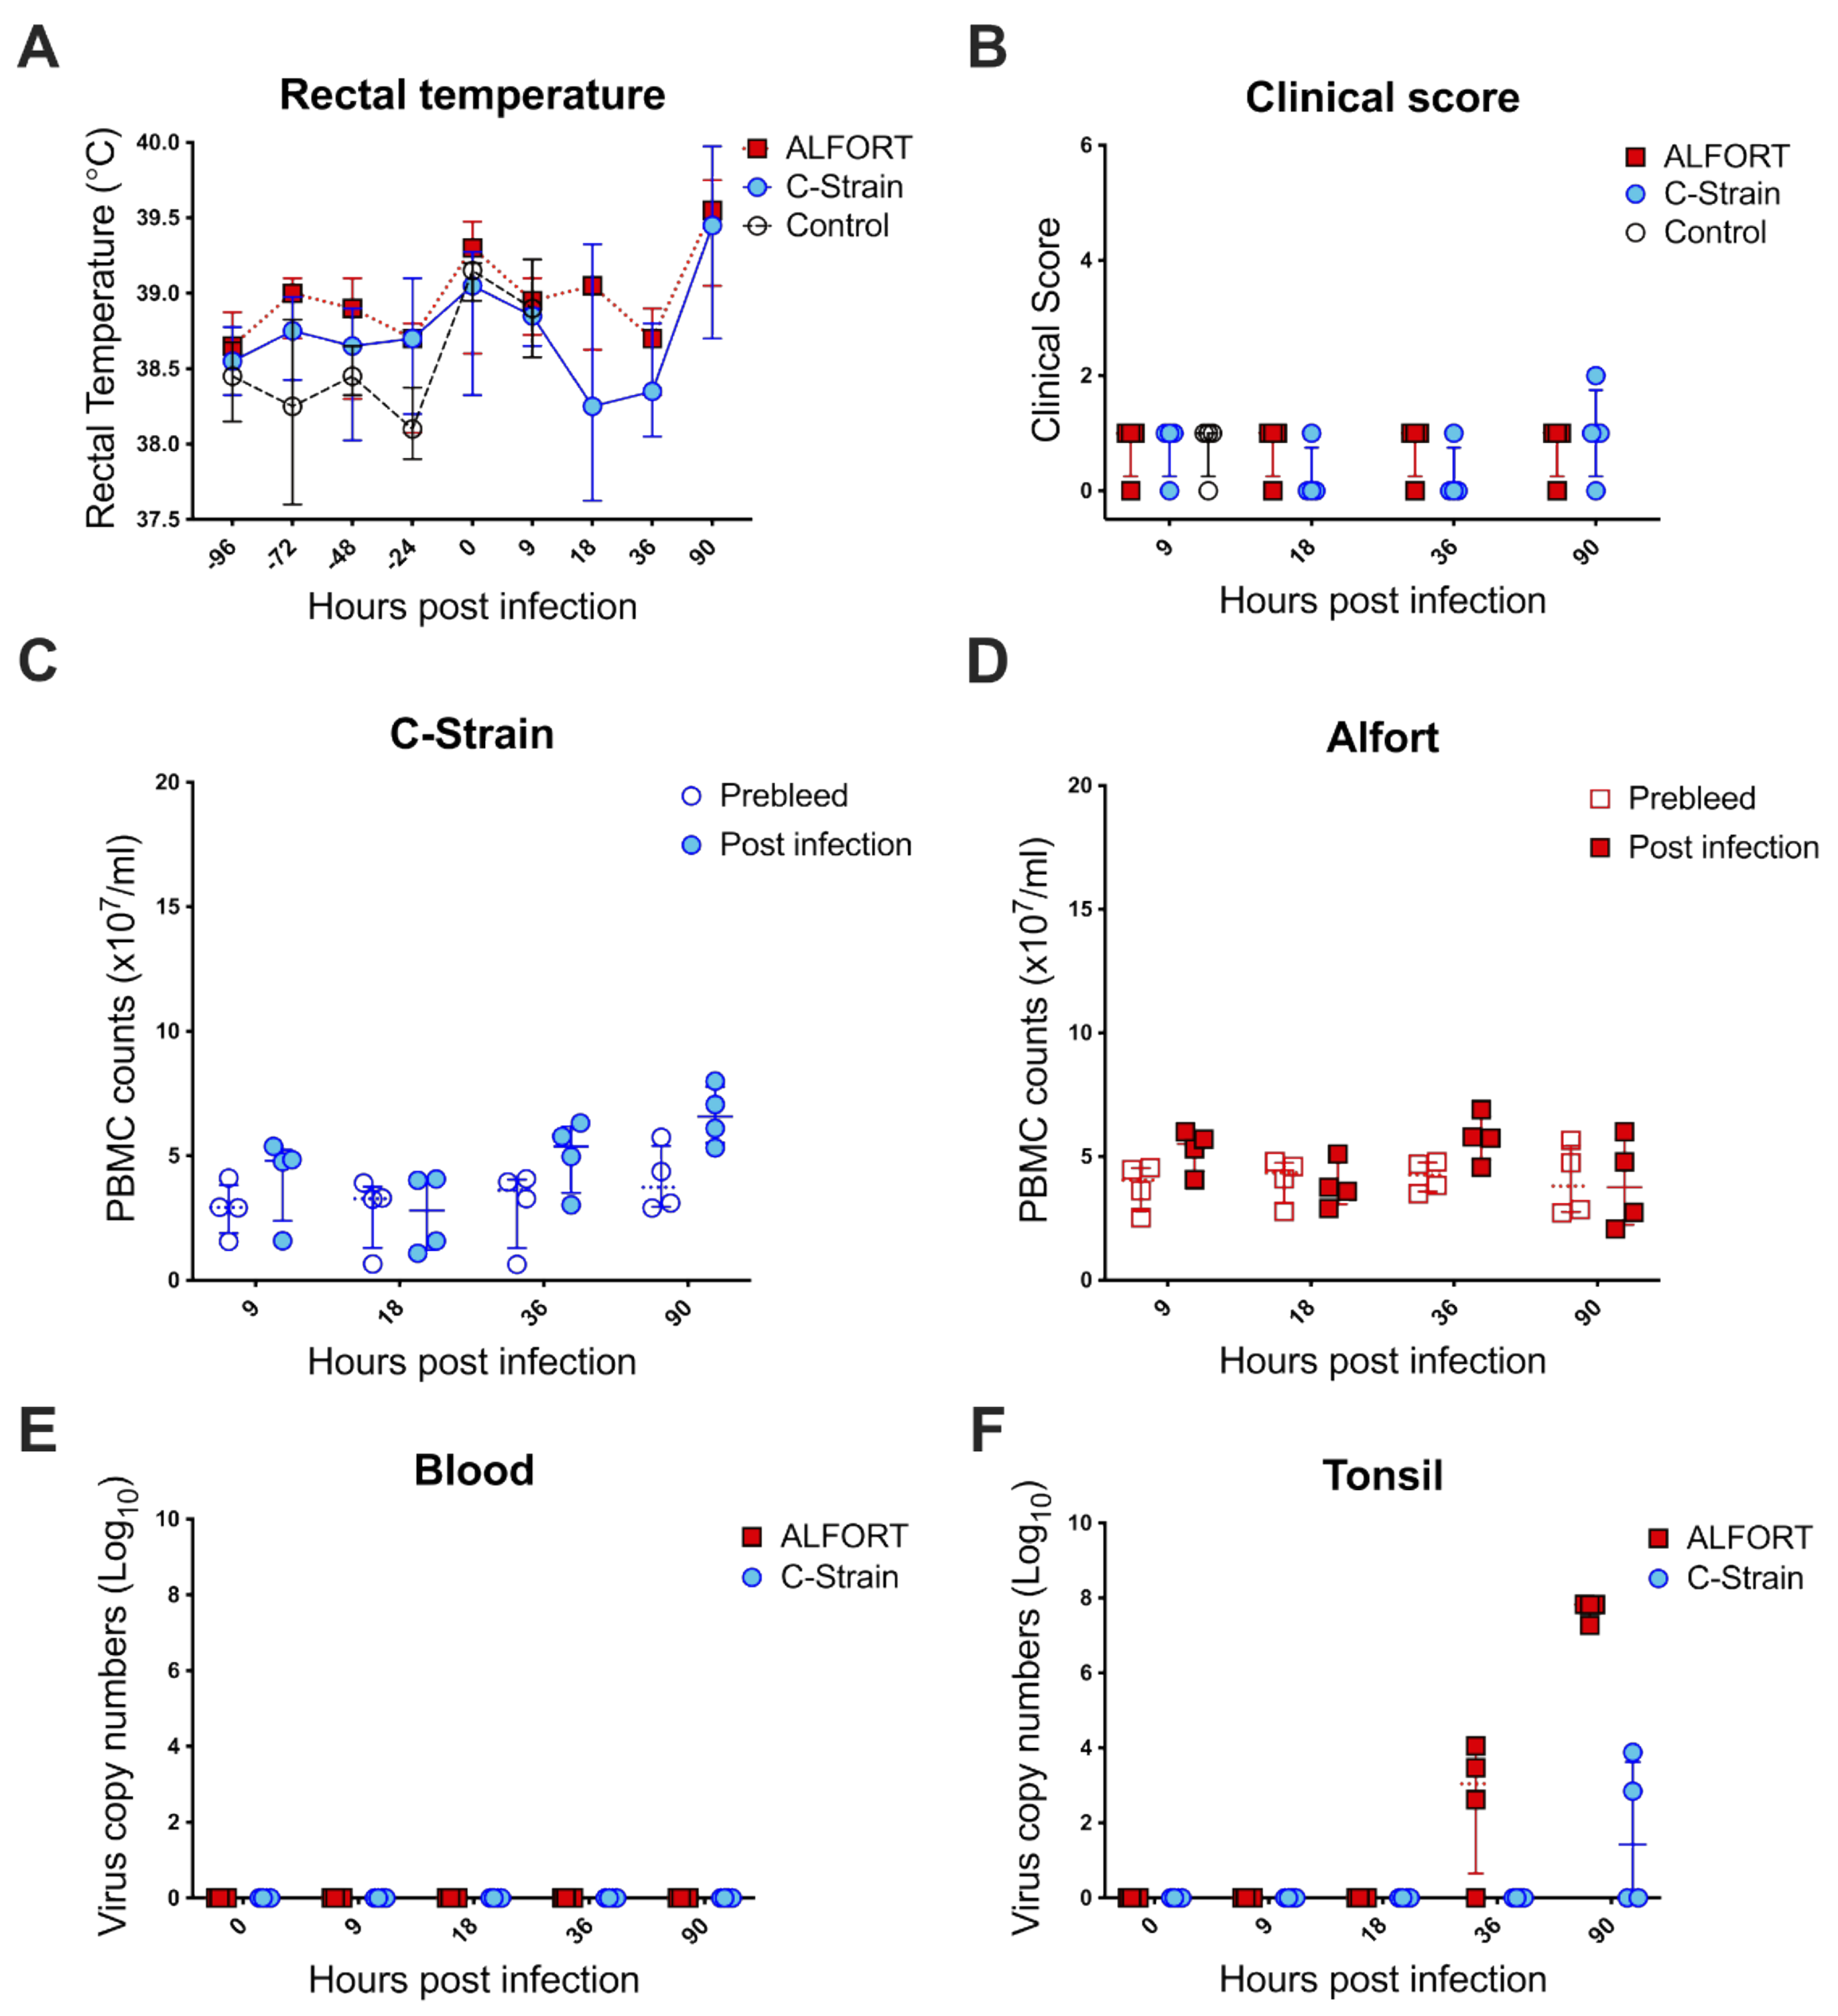
Abstract
:1. Introduction
2. Results
2.1. CSFV Infection Is Restricted to Tonsils during the Early Time Points
2.2. CSFV Infection Leads to Changes in the Myeloid Cell Compartment and the C-Strain Alters the DC Composition
2.3. Effect of CSFV Infection upon MHC-II Expression on Myeloid Cells
2.4. CSFV Has a Strong Tropism for the Newly Arising CD14+CD163+ Cells
2.5. Detection of CSFV-Specific T Cell Responses in Tonsils of Inoculated Animals
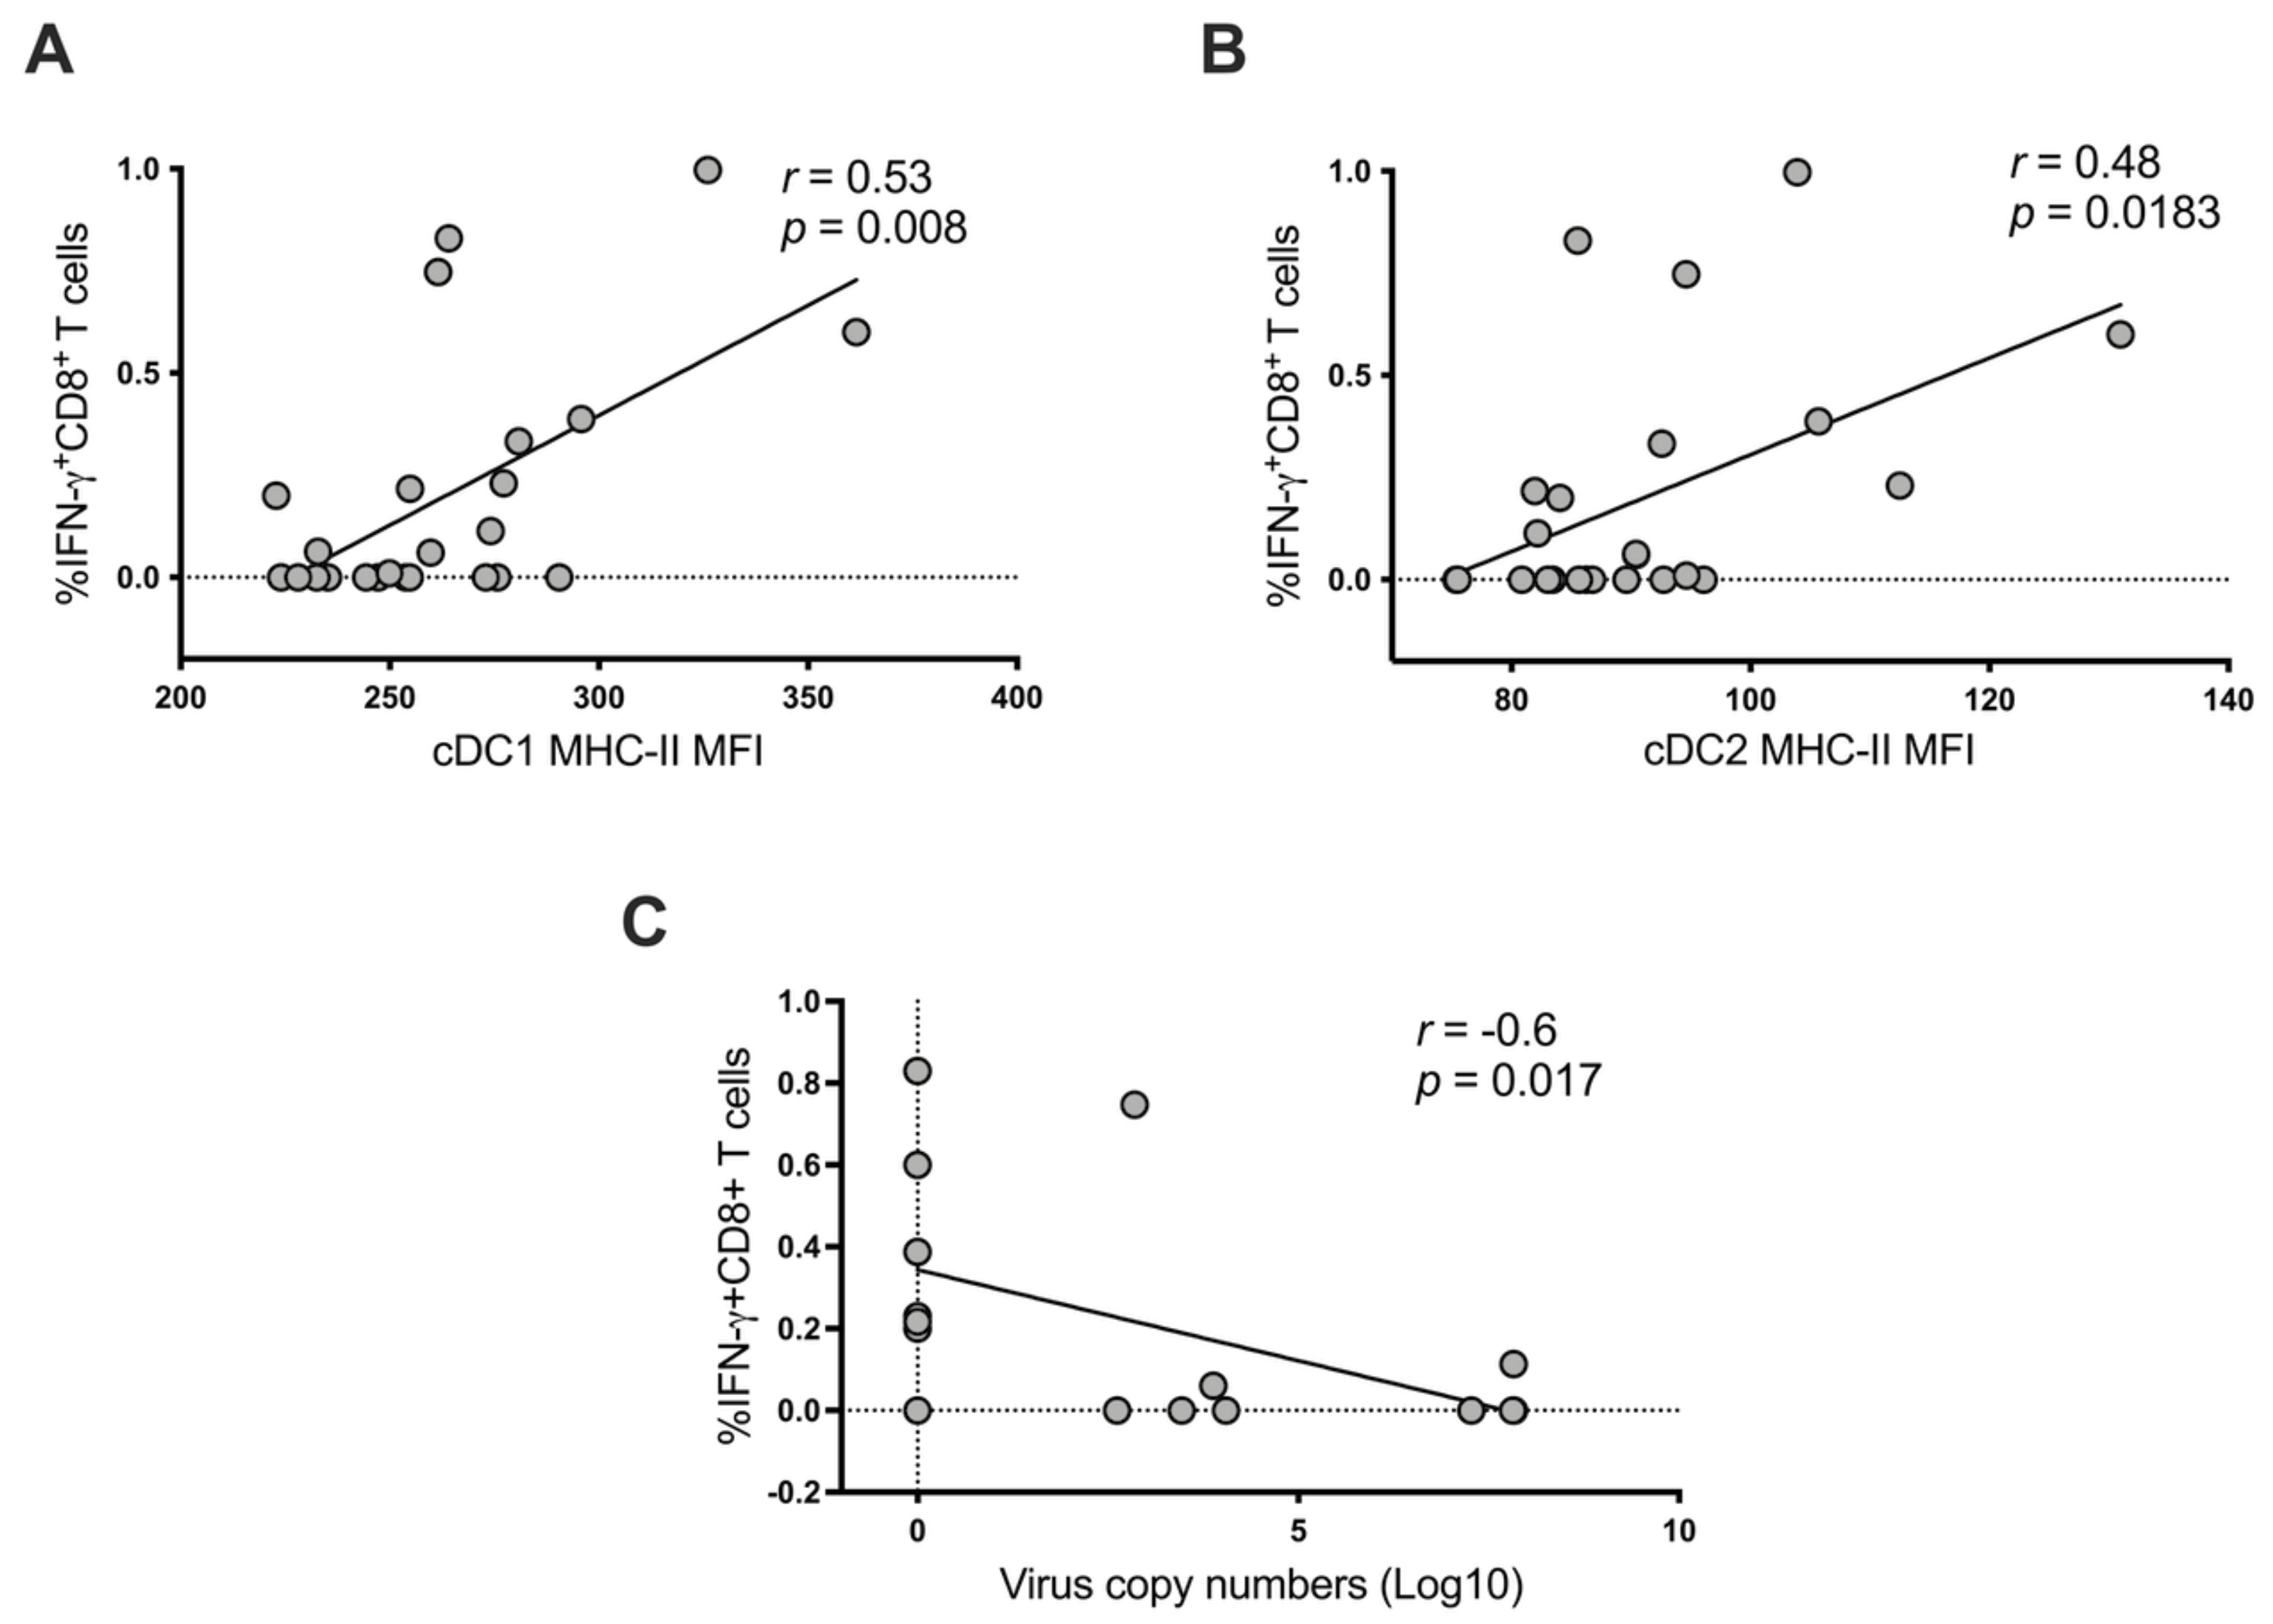
2.6. Correlation between DC Modulation and CSFV-Specific IFN-γ+ CD8+ T Cell Responses with Viral Load in the Porcine Palatine Tonsil
3. Discussion
4. Materials and Methods
4.1. Animals, Viruses and Study Design
4.2. Clinical Monitoring of Pigs
4.3. Assessment of Peripheral Blood Mononuclear Cell Counts
4.4. Detection of CSFV in Blood and Tonsils
4.5. Enrichment of Tonsillar Myeloid Cells by Negative Selection Using Lymphocyte-Specific Antibodies
4.6. Assessment of Myeloid Cell Frequency and Virus Infection
4.7. Evaluation of T Cell Responses
4.8. Statistical Analysis
Supplementary Materials
Author Contributions
Funding
Institutional Review Board Statement
Data Availability Statement
Acknowledgments
Conflicts of Interest
References
- Blome, S.; Staubach, C.; Henke, J.; Carlson, J.; Beer, M. Classical swine fever—An updated review. Viruses 2017, 9, 86. [Google Scholar] [CrossRef] [PubMed] [Green Version]
- Moennig, V. Introduction to classical swine fever: Virus, disease and control policy. Vet. Microbiol. 2000, 73, 93–102. [Google Scholar] [CrossRef]
- OIE. Chapter 15.2: Infection with Classical Swine Fever Virus. In Terrestrial Animal Health Code; OIE: Paris, France, 2019; pp. 1–14. [Google Scholar]
- Elber, A.R.; Stegeman, A.; Moser, H.; Ekker, H.M.; Smak, J.A.; Pluimers, F.H. The classical swine fever epidemic 1997–1998 in The Netherlands: Descriptive epidemiology. Prev. Vet. Med. 1999, 42, 157–184. [Google Scholar] [CrossRef]
- Stegeman, A.; Elbers, A.; de Smit, H.; Moser, H.; Smak, J.; Pluimers, F. The 1997–1998 epidemic of classical swine fever in the Netherlands. Vet. Microbiol. 2000, 73, 183–196. [Google Scholar] [CrossRef]
- Ganges, L.; Crooke, H.R.; Bohórquez, J.A.; Postel, A.; Sakoda, Y.; Becher, P.; Ruggli, N. Classical swine fever virus: The past, present and future. Virus Res. 2020, 289, 198151. [Google Scholar] [CrossRef] [PubMed]
- Graham, S.P.; Everett, H.E.; Haines, F.J.; Johns, H.L.; Sosan, O.A.; Salguero, F.J.; Clifford, D.J.; Steinbach, F.; Drew, T.W.; Crooke, H.R. Challenge of pigs with classical swine fever viruses after C-strain vaccination reveals remarkably rapid protection and insights into early immunity. PLoS ONE 2012, 7, e29310. [Google Scholar] [CrossRef] [Green Version]
- Kaden, V.; Lange, B. Oral immunisation against classical swine fever (CSF): Onset and duration of immunity. Vet. Microbiol. 2001, 82, 301–310. [Google Scholar] [CrossRef]
- Liess, B. Pathogenesis and epidemiology of hog cholera. Ann. Rech. Vet. 1987, 18, 139–145. [Google Scholar] [PubMed]
- Ressang, A.A. Studies on the pathogenesis of hog cholera. II. Virus distribution in tissue and the morphology of the immune response. Zentralbl. Vet. B 1973, 20, 272–288. [Google Scholar] [CrossRef]
- Summerfield, A.; Hofmann, M.A.; McCullough, K.C. Low density blood granulocytic cells induced during classical swine fever are targets for virus infection. Vet. Immunol. Immunopathol. 1998, 63, 289–301. [Google Scholar] [CrossRef]
- Knoetig, S.M.; Summerfield, A.; Spagnuolo-Weaver, M.; McCullough, K.C. Immunopathogenesis of classical swine fever: Role of monocytic cells. Immunology 1999, 97, 359–366. [Google Scholar] [CrossRef]
- Gomez-Villamandos, J.C.; Ruiz-Villamor, E.; Bautista, M.J.; Sanchez, C.P.; Sanchez-Cordon, P.J.; Salguero, F.J.; Jover, A. Morphological and immunohistochemical changes in splenic macrophages of pigs infected with classical swine fever. J. Comp. Pathol. 2001, 125, 98–109. [Google Scholar] [CrossRef]
- Sánchez-Cordón, P.J.; Romanini, S.; Salguero, F.J.; Núñez, A.; Bautista, M.J.; Jover, A.; Gómez-Villamos, J.C. Apoptosis of thymocytes related to cytokine expression in experimental classical swine fever. J. Comp. Pathol. 2002, 127, 239–248. [Google Scholar] [CrossRef] [PubMed]
- Jamin, A.; Gorin, S.; Cariolet, R.; Le Potier, M.-F.F.; Kuntz-Simon, G. Classical swine fever virus induces activation of plasmacytoid and conventional dendritic cells in tonsil, blood, and spleen of infected pigs. Vet. Res. 2008, 39, 7. [Google Scholar] [CrossRef] [Green Version]
- Gomez-Villamandos, J.C.; Salguero, F.J.; Ruiz-Villamor, E.; Sánchez-Cordón, P.J.; Bautista, M.J.; Sierra, M.A. Classical Swine Fever: Pathology of bone marrow. Vet. Pathol. 2003, 40, 157–163. [Google Scholar] [CrossRef]
- Summerfield, A.; Knötig, S.M.; McCullough, K.C. Lymphocyte apoptosis during classical swine fever: Implication of activation-induced cell death. J. Virol. 1998, 72, 1853–1861. [Google Scholar] [CrossRef] [Green Version]
- Koenig, P.; Hoffmann, B.; Depner, K.R.; Reimann, I.; Teifke, J.P.; Beer, M. Detection of classical swine fever vaccine virus in blood and tissue samples of pigs vaccinated either with a conventional C-strain vaccine or a modified live marker vaccine. Vet. Microbiol. 2007, 120, 343–351. [Google Scholar] [CrossRef]
- Belák, K.; Koenen, F.; Vanderhallen, H.; Mittelholzer, C.; Feliziani, F.; De Mia, G.M.; Belák, S. Comparative studies on the pathogenicity and tissue distribution of three virulence variants of classical swine fever virus, two field isolates and one vaccine strain, with special regard to immunohistochemical investigations. Acta Vet. Scand. 2008, 50, 34. [Google Scholar] [CrossRef] [PubMed] [Green Version]
- Tignon, M.; Kulcsár, G.; Haegeman, A.; Barna, T.; Fábián, K.; Lévai, R.; Van der Stede, Y.; Farsang, A.; Vrancken, R.; Belák, K.; et al. Classical swine fever: Comparison of oronasal immunisation with CP7E2alf marker and C-strain vaccines in domestic pigs. Vet. Microbiol. 2010, 142, 59–68. [Google Scholar] [CrossRef] [Green Version]
- Graham, S.P.; Haines, F.J.; Johns, H.L.; Sosan, O.; La Rocca, S.A.; Lamp, B.; Rumenapf, T.; Everett, H.E.; Crooke, H.R.; Rümenapf, T. Characterisation of vaccine-induced, broadly cross-reactive IFN-gamma secreting T cell responses that correlate with rapid protection against classical swine fever virus. Vaccine 2012, 30, 2742–2748. [Google Scholar] [CrossRef] [PubMed]
- Franzoni, G.; Kurkure, N.V.; Edgar, D.S.; Everett, H.E.; Gerner, W.; Bodman-Smith, K.B.; Crooke, H.R.; Graham, S.P. Assessment of the Phenotype and Functionality of Porcine CD8 T Cell Responses following Vaccination with Live Attenuated Classical Swine Fever Virus (CSFV) and Virulent CSFV Challenge. Clin. Vaccine Immunol. 2013, 20, 1604–1616. [Google Scholar] [CrossRef] [PubMed] [Green Version]
- Summerfield, A.; Ruggli, N. Immune Responses Against Classical Swine Fever Virus: Between Ignorance and Lunacy. Front. Vet. Sci. 2015, 2, 10. [Google Scholar] [CrossRef] [Green Version]
- Balmelli, C.; Vincent, I.E.; Rau, H.; Guzylack-Piriou, L.; McCullough, K.; Summerfield, A. Fc gamma RII-dependent sensitisation of natural interferon-producing cells for viral infection and interferon-alpha responses. Eur. J. Immunol. 2005, 35, 2406–2415. [Google Scholar] [CrossRef] [PubMed]
- Summerfield, A.; Alves, M.; Ruggli, N.; de Bruin, M.G.M.; McCullough, K.C. High IFN-alpha responses associated with depletion of lymphocytes and natural IFN-producing cells during classical swine fever. J. Interferon Cytokine Res. 2006, 26, 248–255. [Google Scholar] [CrossRef]
- Ruggli, N.; Summerfield, A.; Fiebach, A.R.; Guzylack-Piriou, L.; Bauhofer, O.; Lamm, C.G.; Waltersperger, S.; Matsuno, K.; Liu, L.; Gerber, M.; et al. Classical swine fever virus can remain virulent after specific elimination of the interferon regulatory factor 3-degrading function of Npro. J. Virol. 2009, 83, 817–829. [Google Scholar] [CrossRef] [PubMed] [Green Version]
- Chen, L.-J.; Dong, X.-Y.; Shen, H.-Y.; Zhao, M.-Q.; Ju, C.-M.; Yi, L.; Zhang, X.-T.; Kang, Y.-M.; Chen, J.-D. Classical swine fever virus suppresses maturation and modulates functions of monocyte-derived dendritic cells without activating nuclear factor kappa B. Res. Vet. Sci. 2012, 93, 529–537. [Google Scholar] [CrossRef] [PubMed]
- Soldevila, F.; Edwards, J.C.; Graham, S.P.; Stevens, L.M.; Crudgington, B.; Crooke, H.R.; Werling, D.; Steinbach, F. Characterization of the myeloid cell populations’ resident in the porcine palatine tonsil. Front. Immunol. 2018, 9, 1–16. [Google Scholar] [CrossRef]
- Núñez, A.; Sánchez-Cordón, P.J.; Pedrera, M.; Gómez-Villamandos, J.C.; Carrasco, L. Pulmonary intravascular macrophages regulate the pathogenetic mechanisms of pulmonary lesions during acute courses of classical swine fever. Transbound. Emerg. Dis. 2018, 65, 1885–1897. [Google Scholar] [CrossRef]
- Lin, Z.; Liang, W.; Kang, K.; Li, H.; Cao, Z.; Zhang, Y. Classical swine fever virus and p7 protein induce secretion of IL-1β in macrophages. J. Gen. Virol. 2014, 95, 2693–2699. [Google Scholar] [CrossRef] [Green Version]
- Gerner, W.; Käser, T.; Saalmüller, A. Porcine T lymphocytes and NK cells—An update. Dev. Comp. Immunol. 2009, 33, 310–320. [Google Scholar] [CrossRef]
- Donahue, B.C.; Petrowski, H.M.; Melkonian, K.; Ward, G.B.; Mayr, G.A.; Metwally, S. Analysis of clinical samples for early detection of classical swine fever during infection with low, moderate, and highly virulent strains in relation to the onset of clinical signs. J. Virol. Methods 2012, 179, 108–115. [Google Scholar] [CrossRef]
- McCullough, K.C.; Ruggli, N.; Summerfield, A. Dendritic cell—At the front-line of pathogen attack. Vet. Immunol. Immunopathol. 2009, 128, 7–15. [Google Scholar] [CrossRef] [PubMed]
- Fiebach, A.R.; Guzylack-Piriou, L.; Python, S.; Summerfield, A.; Ruggli, N. Classical swine fever virus N(pro) limits type I interferon induction in plasmacytoid dendritic cells by interacting with interferon regulatory factor 7. J. Virol. 2011, 85, 8002–8011. [Google Scholar] [CrossRef] [Green Version]
- Python, S.; Gerber, M.; Suter, R.; Ruggli, N.; Summerfield, A. Efficient sensing of infected cells in absence of virus particles by plasmacytoid dendritic cells is blocked by the viral ribonuclease Erns. PLoS Pathog. 2013, 9, e1003412. [Google Scholar] [CrossRef] [PubMed]
- Högger, P.; Dreier, J.; Droste, A.; Buck, F.; Sorg, C. Identification of the integral membrane protein RM3/1 on human monocytes as a glucocorticoid-inducible member of the scavenger receptor cysteine-rich family (CD163). J. Immunol. 1998, 161, 1883–1890. [Google Scholar]
- Chamorro, S.; Revilla, C.; Álvarez, B.; Alonso, F.; Ezquerra, Á.; Domínguez, J. Phenotypic and functional heterogeneity of porcine blood monocytes and its relation with maturation. Immunology 2005, 114, 63–71. [Google Scholar] [CrossRef]
- Chamorro, S.; Revilla, C.; Gómez, N.; Alvarez, B.; Alonso, F.; Ezquerra, A.; Domínguez, J. In vitro differentiation of porcine blood CD163- and CD163+ monocytes into functional dendritic cells. Immunobiology 2004, 209, 57–65. [Google Scholar] [CrossRef]
- Burkard, C.; Lillico, S.G.; Reid, E.; Jackson, B.; Mileham, A.J.; Ait-Ali, T.; Whitelaw, C.B.A.; Archibald, A.L. Precision engineering for PRRSV resistance in pigs: Macrophages from genome edited pigs lacking CD163 SRCR5 domain are fully resistant to both PRRSV genotypes while maintaining biological function. PLoS Pathog. 2017, 13, e1006206. [Google Scholar] [CrossRef]
- Villani, A.-C.; Satija, R.; Reynolds, G.; Sarkizova, S.; Shekhar, K.; Fletcher, J.; Griesbeck, M.; Butler, A.; Zheng, S.; Lazo, S.; et al. Single-cell RNA-seq reveals new types of human blood dendritic cells, monocytes, and progenitors. Science 2017, 356. [Google Scholar] [CrossRef] [PubMed] [Green Version]
- Bourdely, P.; Anselmi, G.; Vaivode, K.; Ramos, R.N.; Missolo-Koussou, Y.; Hidalgo, S.; Tosselo, J.; Nuñez, N.; Richer, W.; Vincent-Salomon, A.; et al. Transcriptional and Functional Analysis of CD1c(+) Human Dendritic Cells Identifies a CD163(+) Subset Priming CD8(+)CD103(+) T Cells. Immunity 2020, 53, 335–352.e8. [Google Scholar] [CrossRef]
- Núñez, A.; Gómez-Villamandos, J.C.; Sánchez-Cordón, P.J.; Fernández de Marco, M.; Pedrera, M.; Salguero, F.J.; Carrasco, L. Expression of proinflammatory cytokines by hepatic macrophages in acute classical swine fever. J. Comp. Pathol. 2005, 133, 23–32. [Google Scholar] [CrossRef]
- Carrasco, L.; Ruiz-Villamor, E.; Gomez-Villamandos, J.C.; Salguero, F.J.; Bautista, M.J.; Macia, M.; Quezada, M.; Jover, A. Classical swine fever: Morphological and morphometrical study of pulmonary intravascular macrophages. J. Comp. Pathol. 2001, 125, 1–7. [Google Scholar] [CrossRef] [PubMed]
- Sánchez-Cordón, P.J.; Núñez, A.; Salguero, F.J.; Pedrera, M.; Fernández de Marco, M.; Gómez-Villamandos, J.C. Lymphocyte apoptosis and thrombocytopenia in spleen during classical swine fever: Role of macrophages and cytokines. Vet. Pathol. 2005, 42, 477–488. [Google Scholar] [CrossRef]
- Auray, G.; Talker, S.C.; Keller, I.; Python, S.; Gerber, M.; Liniger, M.; Ganges, L.; Bruggmann, R.; Ruggli, N.; Summerfield, A. High-Resolution Profiling of Innate Immune Responses by Porcine Dendritic Cell Subsets in vitro and in vivo. Front. Immunol. 2020, 11, 1429. [Google Scholar] [CrossRef]
- Merad, M.; Sathe, P.; Helft, J.; Miller, J.; Mortha, A. The Dendritic Cell Lineage: Ontogeny and Function of Dendritic Cells and Their Subsets in the Steady State and the Inflamed Setting. Annu. Rev. Immunol. 2013, 31, 563–604. [Google Scholar] [CrossRef] [PubMed] [Green Version]
- Schlitzer, A.; Ginhoux, F. Organization of the mouse and human DC network. Curr. Opin. Immunol. 2014, 26, 90–99. [Google Scholar] [CrossRef]
- McCarthy, R.R.; Everett, H.E.; Graham, S.P.; Steinbach, F.; Crooke, H.R. Head Start Immunity: Characterizing the Early Protection of C Strain Vaccine Against Subsequent Classical Swine Fever Virus Infection. Front. Immunol. 2019, 10, 1584. [Google Scholar] [CrossRef] [Green Version]
- Norbury, C.C.; Malide, D.; Gibbs, J.S.; Bennink, J.R.; Yewdell, J.W. Visualizing priming of virus-specific CD8+ T cells by infected dendritic cells in vivo. Nat. Immunol. 2002, 3, 265–271. [Google Scholar] [CrossRef]
- Everett, H.; Salguero, F.J.; Graham, S.P.; Haines, F.; Johns, H.; Clifford, D.; Nunez, A.; La Rocca, S.A.; Parchariyanon, S.; Steinbach, F.; et al. Characterisation of experimental infections of domestic pigs with genotype 2.1 and 3.3 isolates of classical swine fever virus. Vet. Microbiol. 2010, 142, 26–33. [Google Scholar] [CrossRef] [Green Version]
- Hoffmann, B.; Beer, M.; Schelp, C.; Schirrmeier, H.; Depner, K. Validation of a real-time RT-PCR assay for sensitive and specific detection of classical swine fever. J. Virol. Methods 2005, 130, 36–44. [Google Scholar] [CrossRef] [PubMed]


Publisher’s Note: MDPI stays neutral with regard to jurisdictional claims in published maps and institutional affiliations. |
© 2021 by the authors. Licensee MDPI, Basel, Switzerland. This article is an open access article distributed under the terms and conditions of the Creative Commons Attribution (CC BY) license (https://creativecommons.org/licenses/by/4.0/).
Share and Cite
Soldevila, F.; Edwards, J.C.; Graham, S.P.; Crooke, H.R.; Werling, D.; Steinbach, F. Activation of Dendritic Cells in Tonsils Is Associated with CD8 T Cell Responses following Vaccination with Live Attenuated Classical Swine Fever Virus. Int. J. Mol. Sci. 2021, 22, 8795. https://0-doi-org.brum.beds.ac.uk/10.3390/ijms22168795
Soldevila F, Edwards JC, Graham SP, Crooke HR, Werling D, Steinbach F. Activation of Dendritic Cells in Tonsils Is Associated with CD8 T Cell Responses following Vaccination with Live Attenuated Classical Swine Fever Virus. International Journal of Molecular Sciences. 2021; 22(16):8795. https://0-doi-org.brum.beds.ac.uk/10.3390/ijms22168795
Chicago/Turabian StyleSoldevila, Ferran, Jane C. Edwards, Simon P. Graham, Helen R. Crooke, Dirk Werling, and Falko Steinbach. 2021. "Activation of Dendritic Cells in Tonsils Is Associated with CD8 T Cell Responses following Vaccination with Live Attenuated Classical Swine Fever Virus" International Journal of Molecular Sciences 22, no. 16: 8795. https://0-doi-org.brum.beds.ac.uk/10.3390/ijms22168795