
NMNAT1 Is a Survival Factor in Actinomycin D-Induced Osteosarcoma Cell Death

 , and
, and 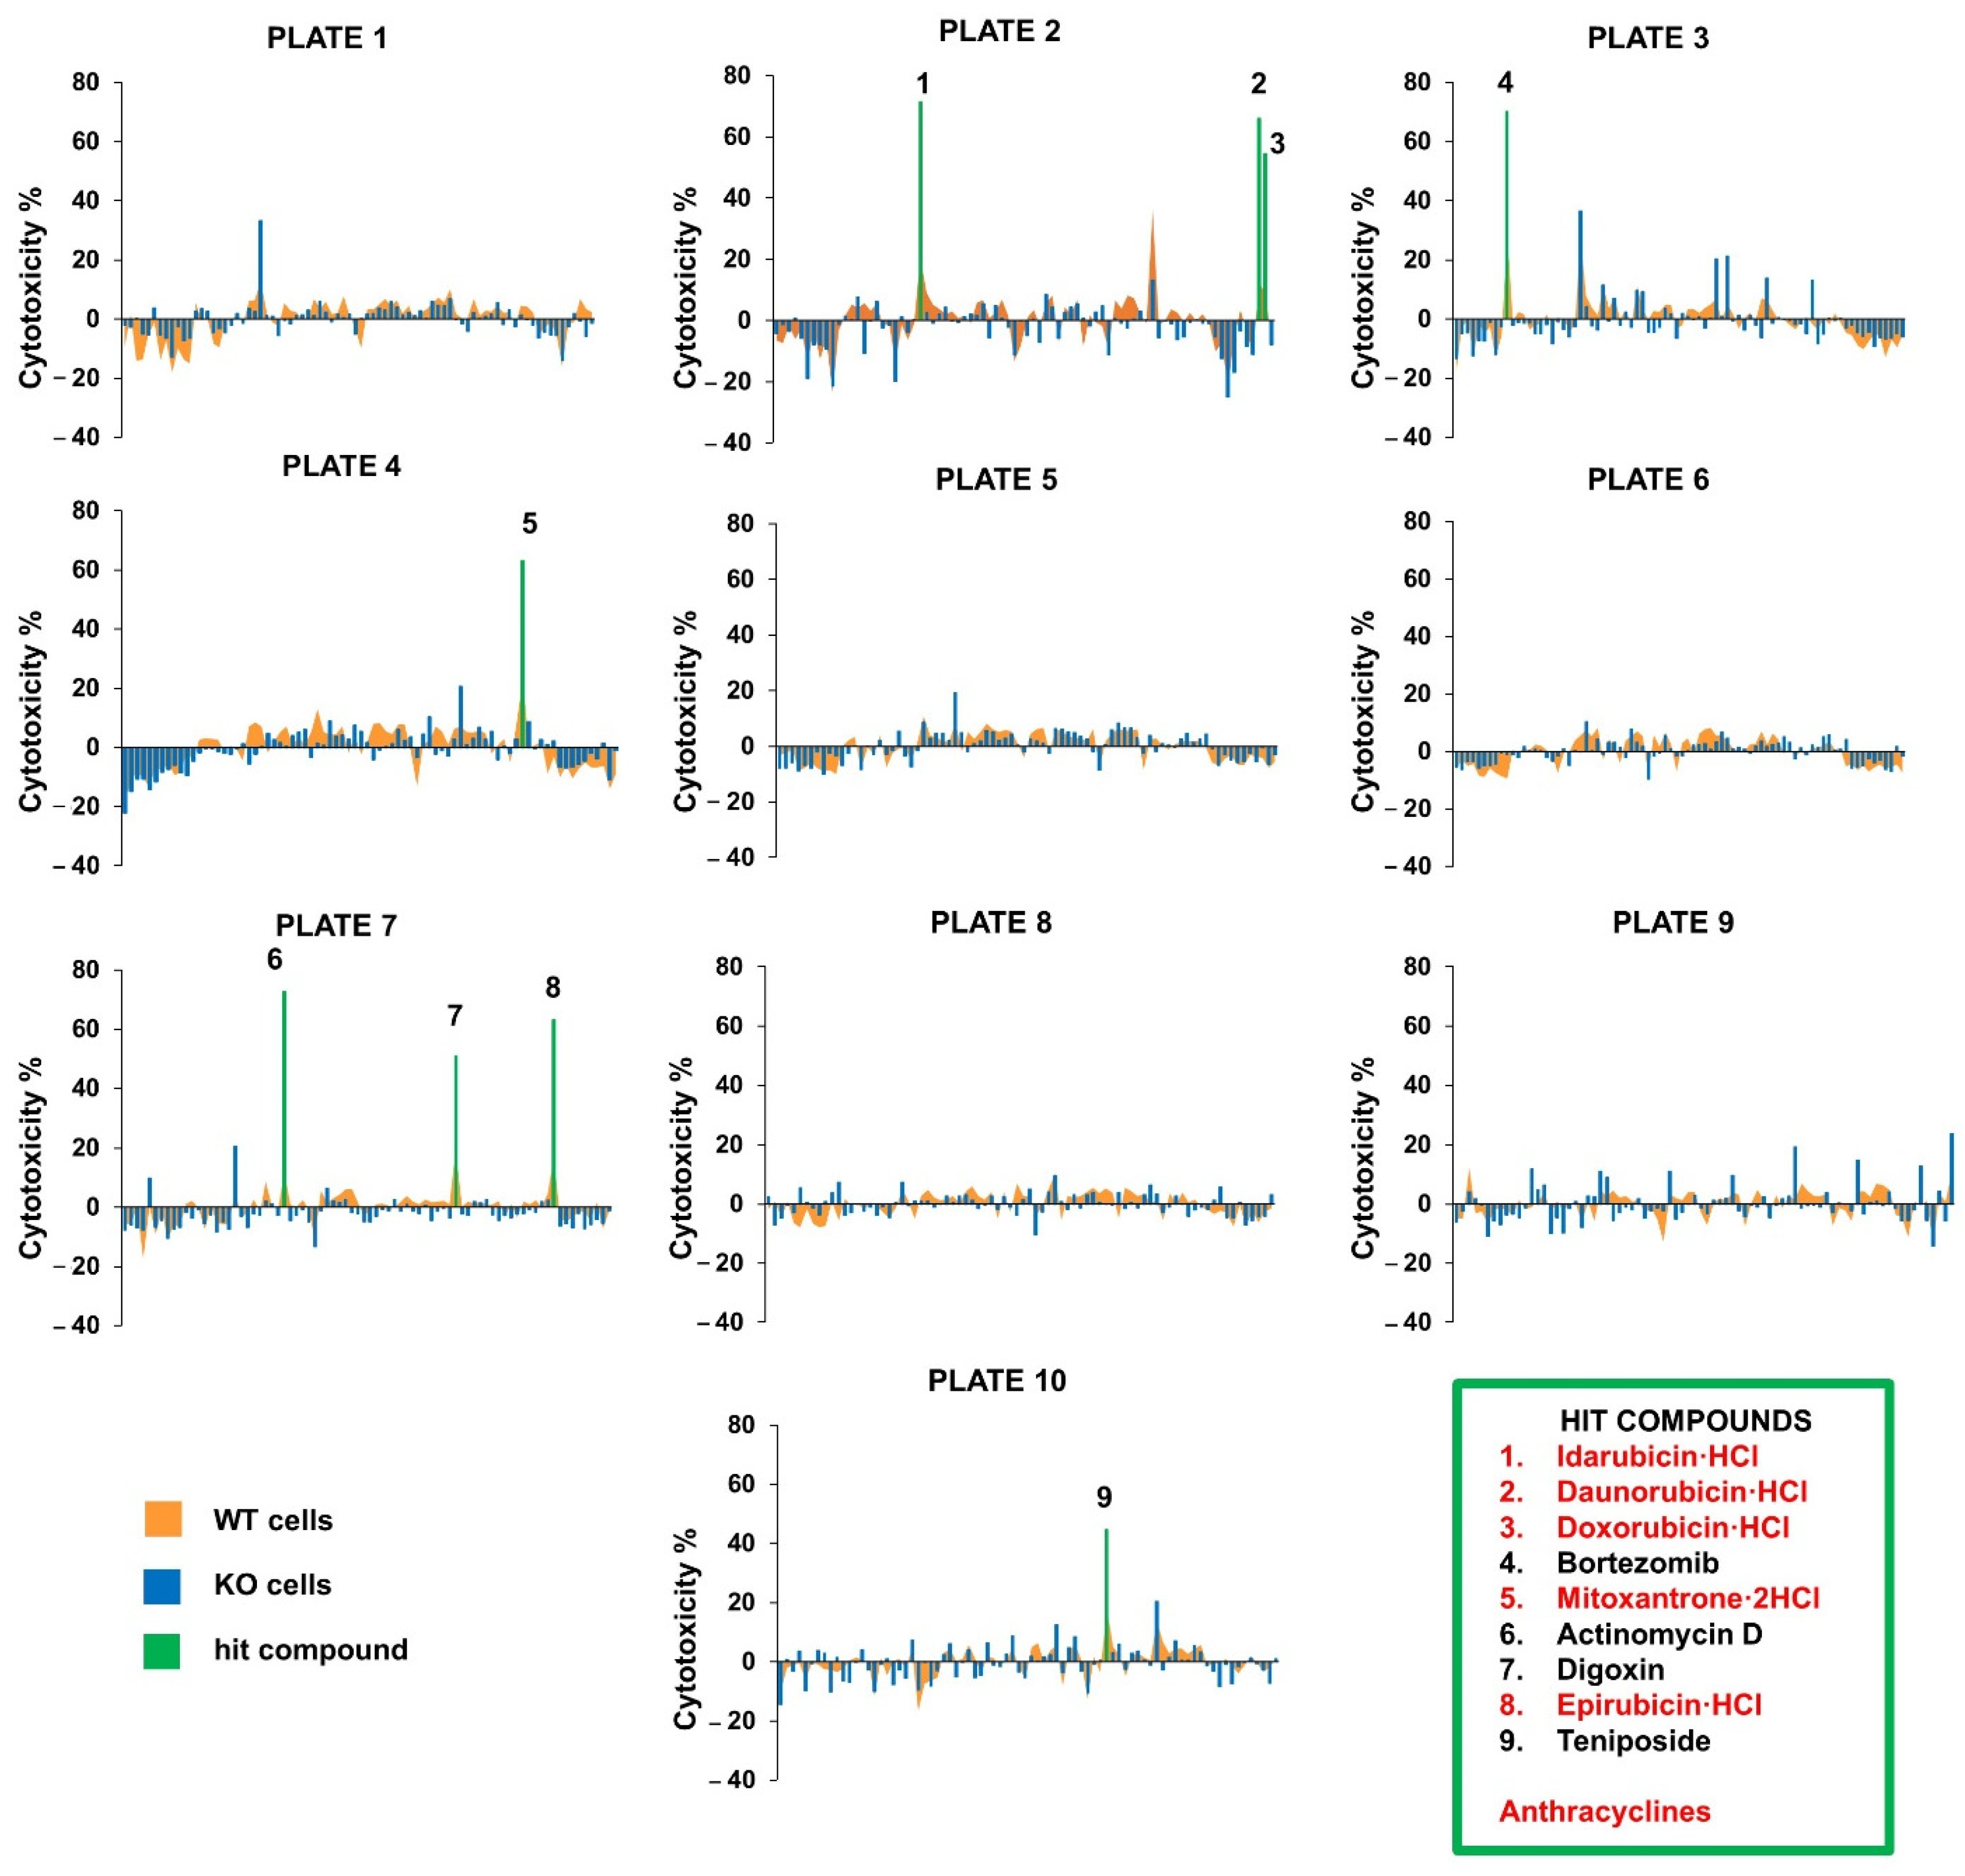
Abstract
:1. Introduction
2. Results
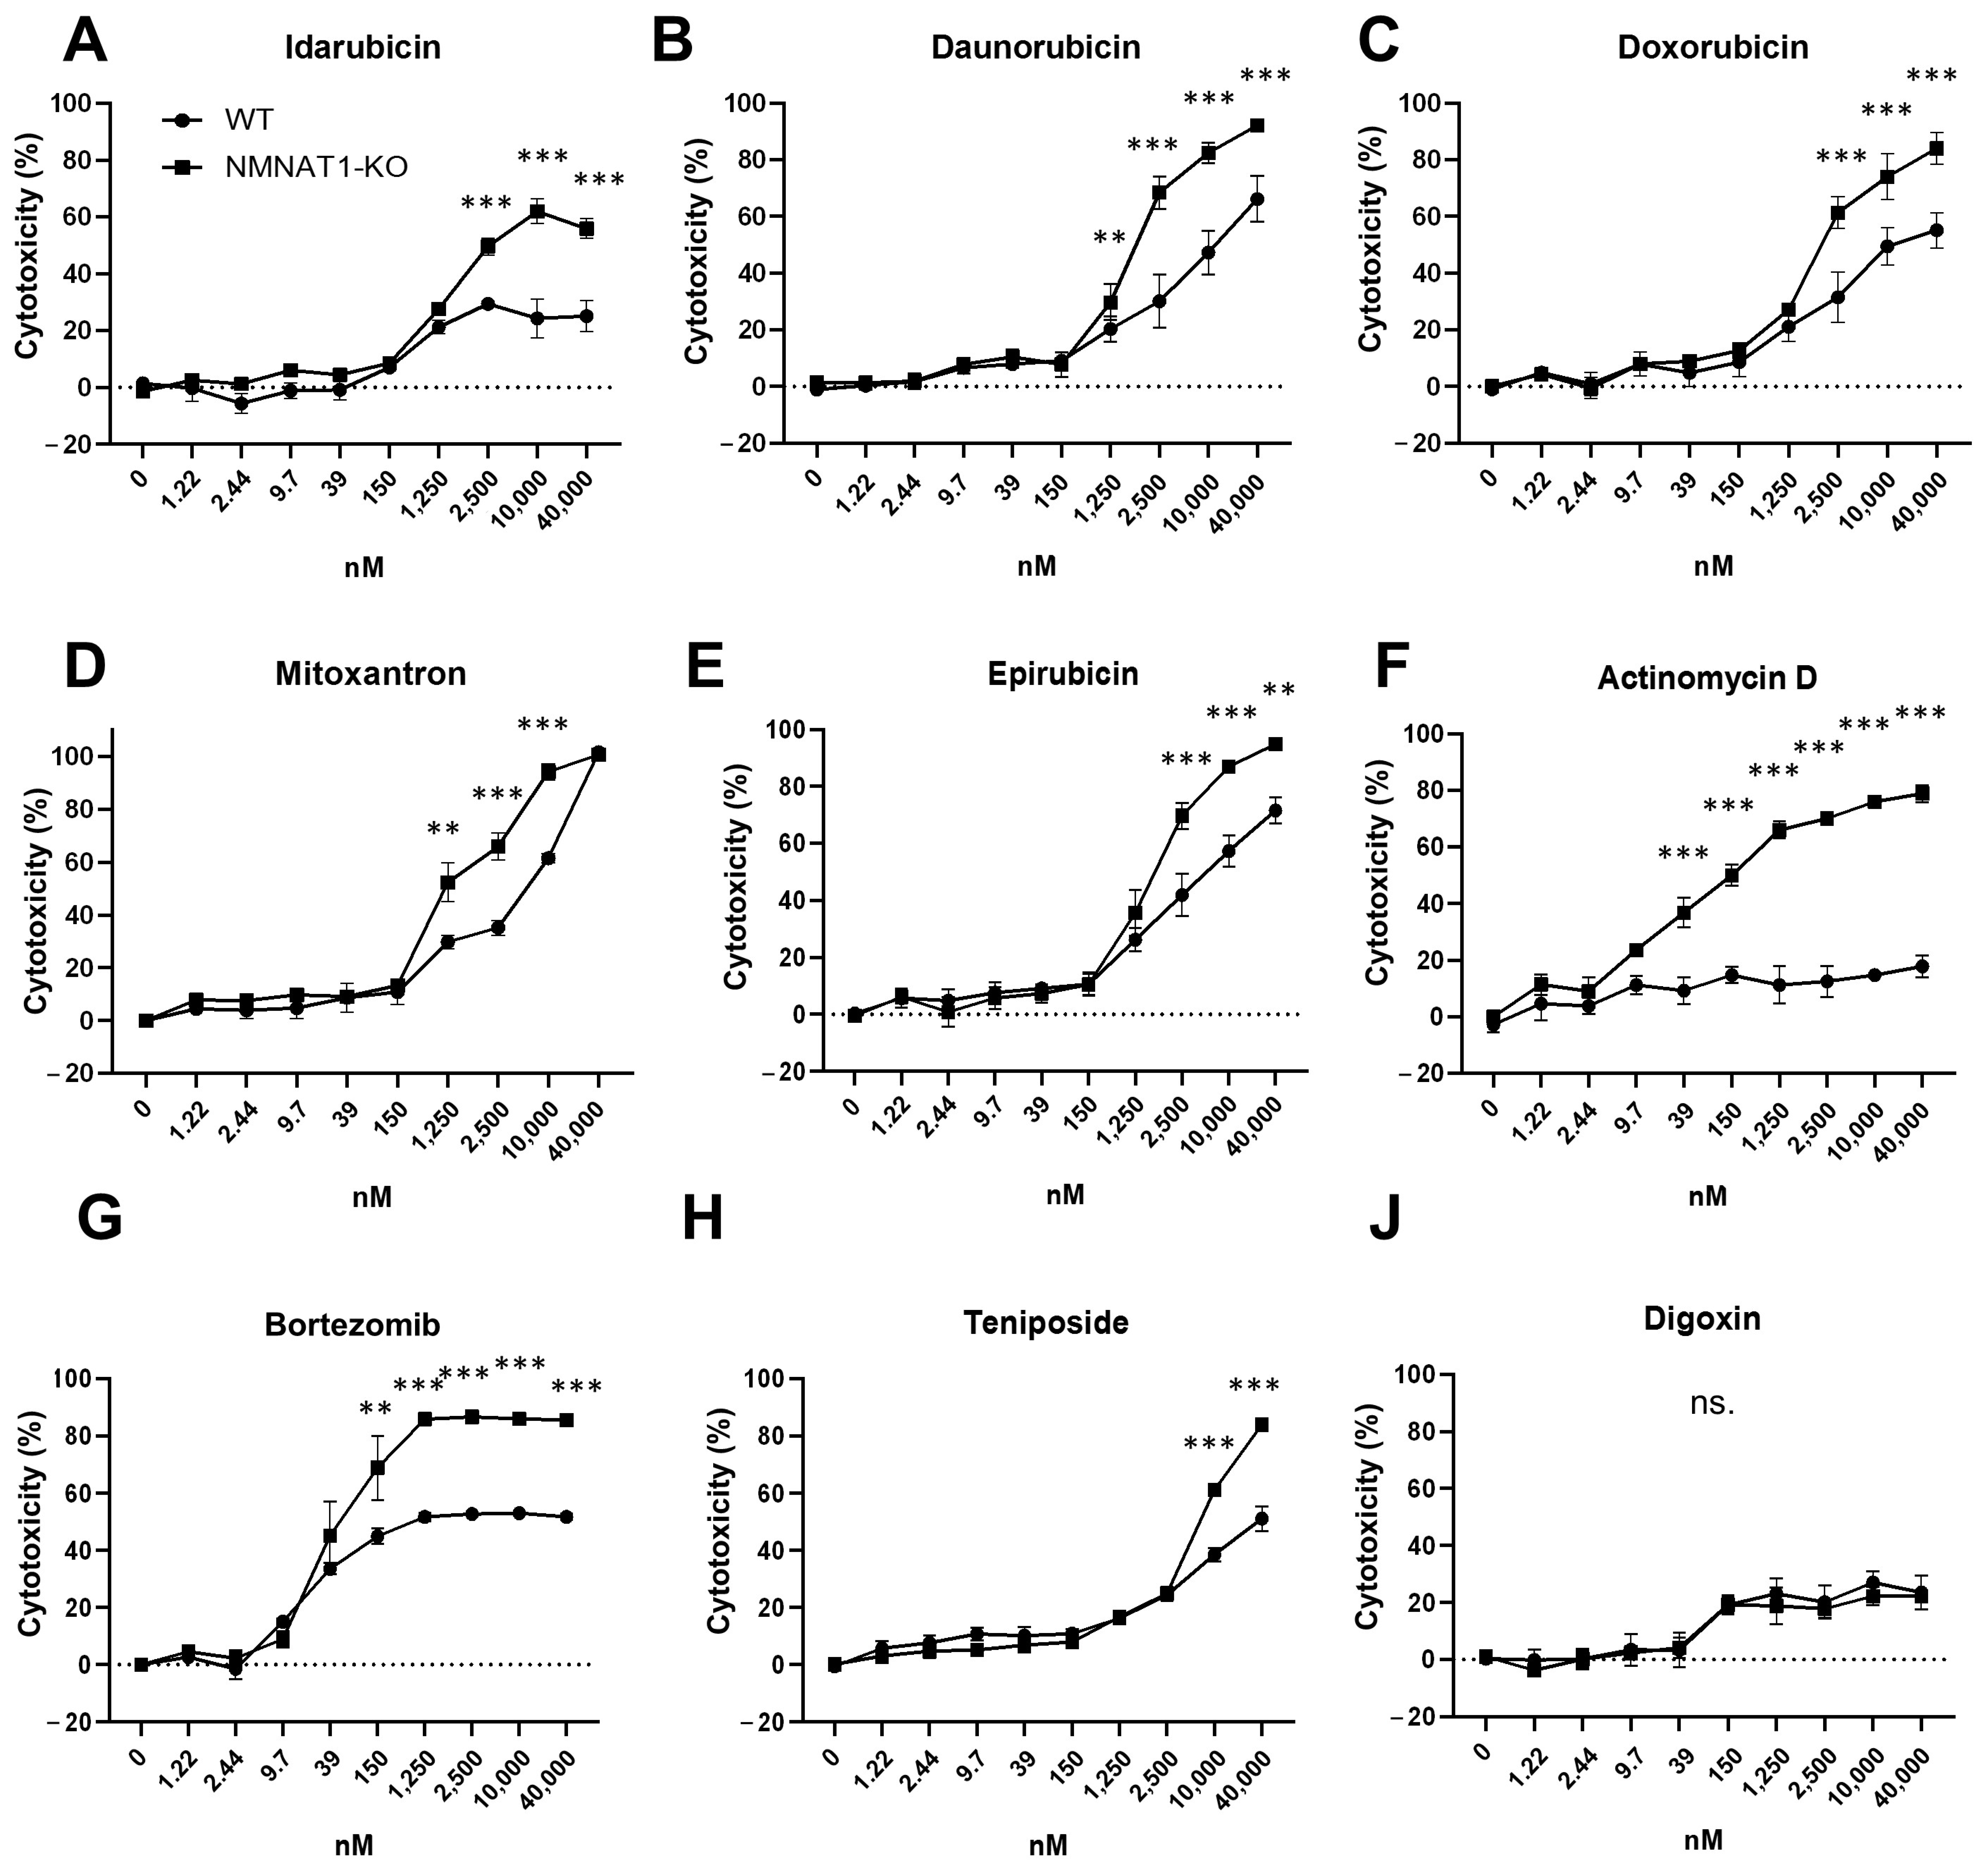
2.1. Actinomycin D Has Synergistic Cytotoxic Effects with the NMNAT1 Knockout (KO) Phenotype
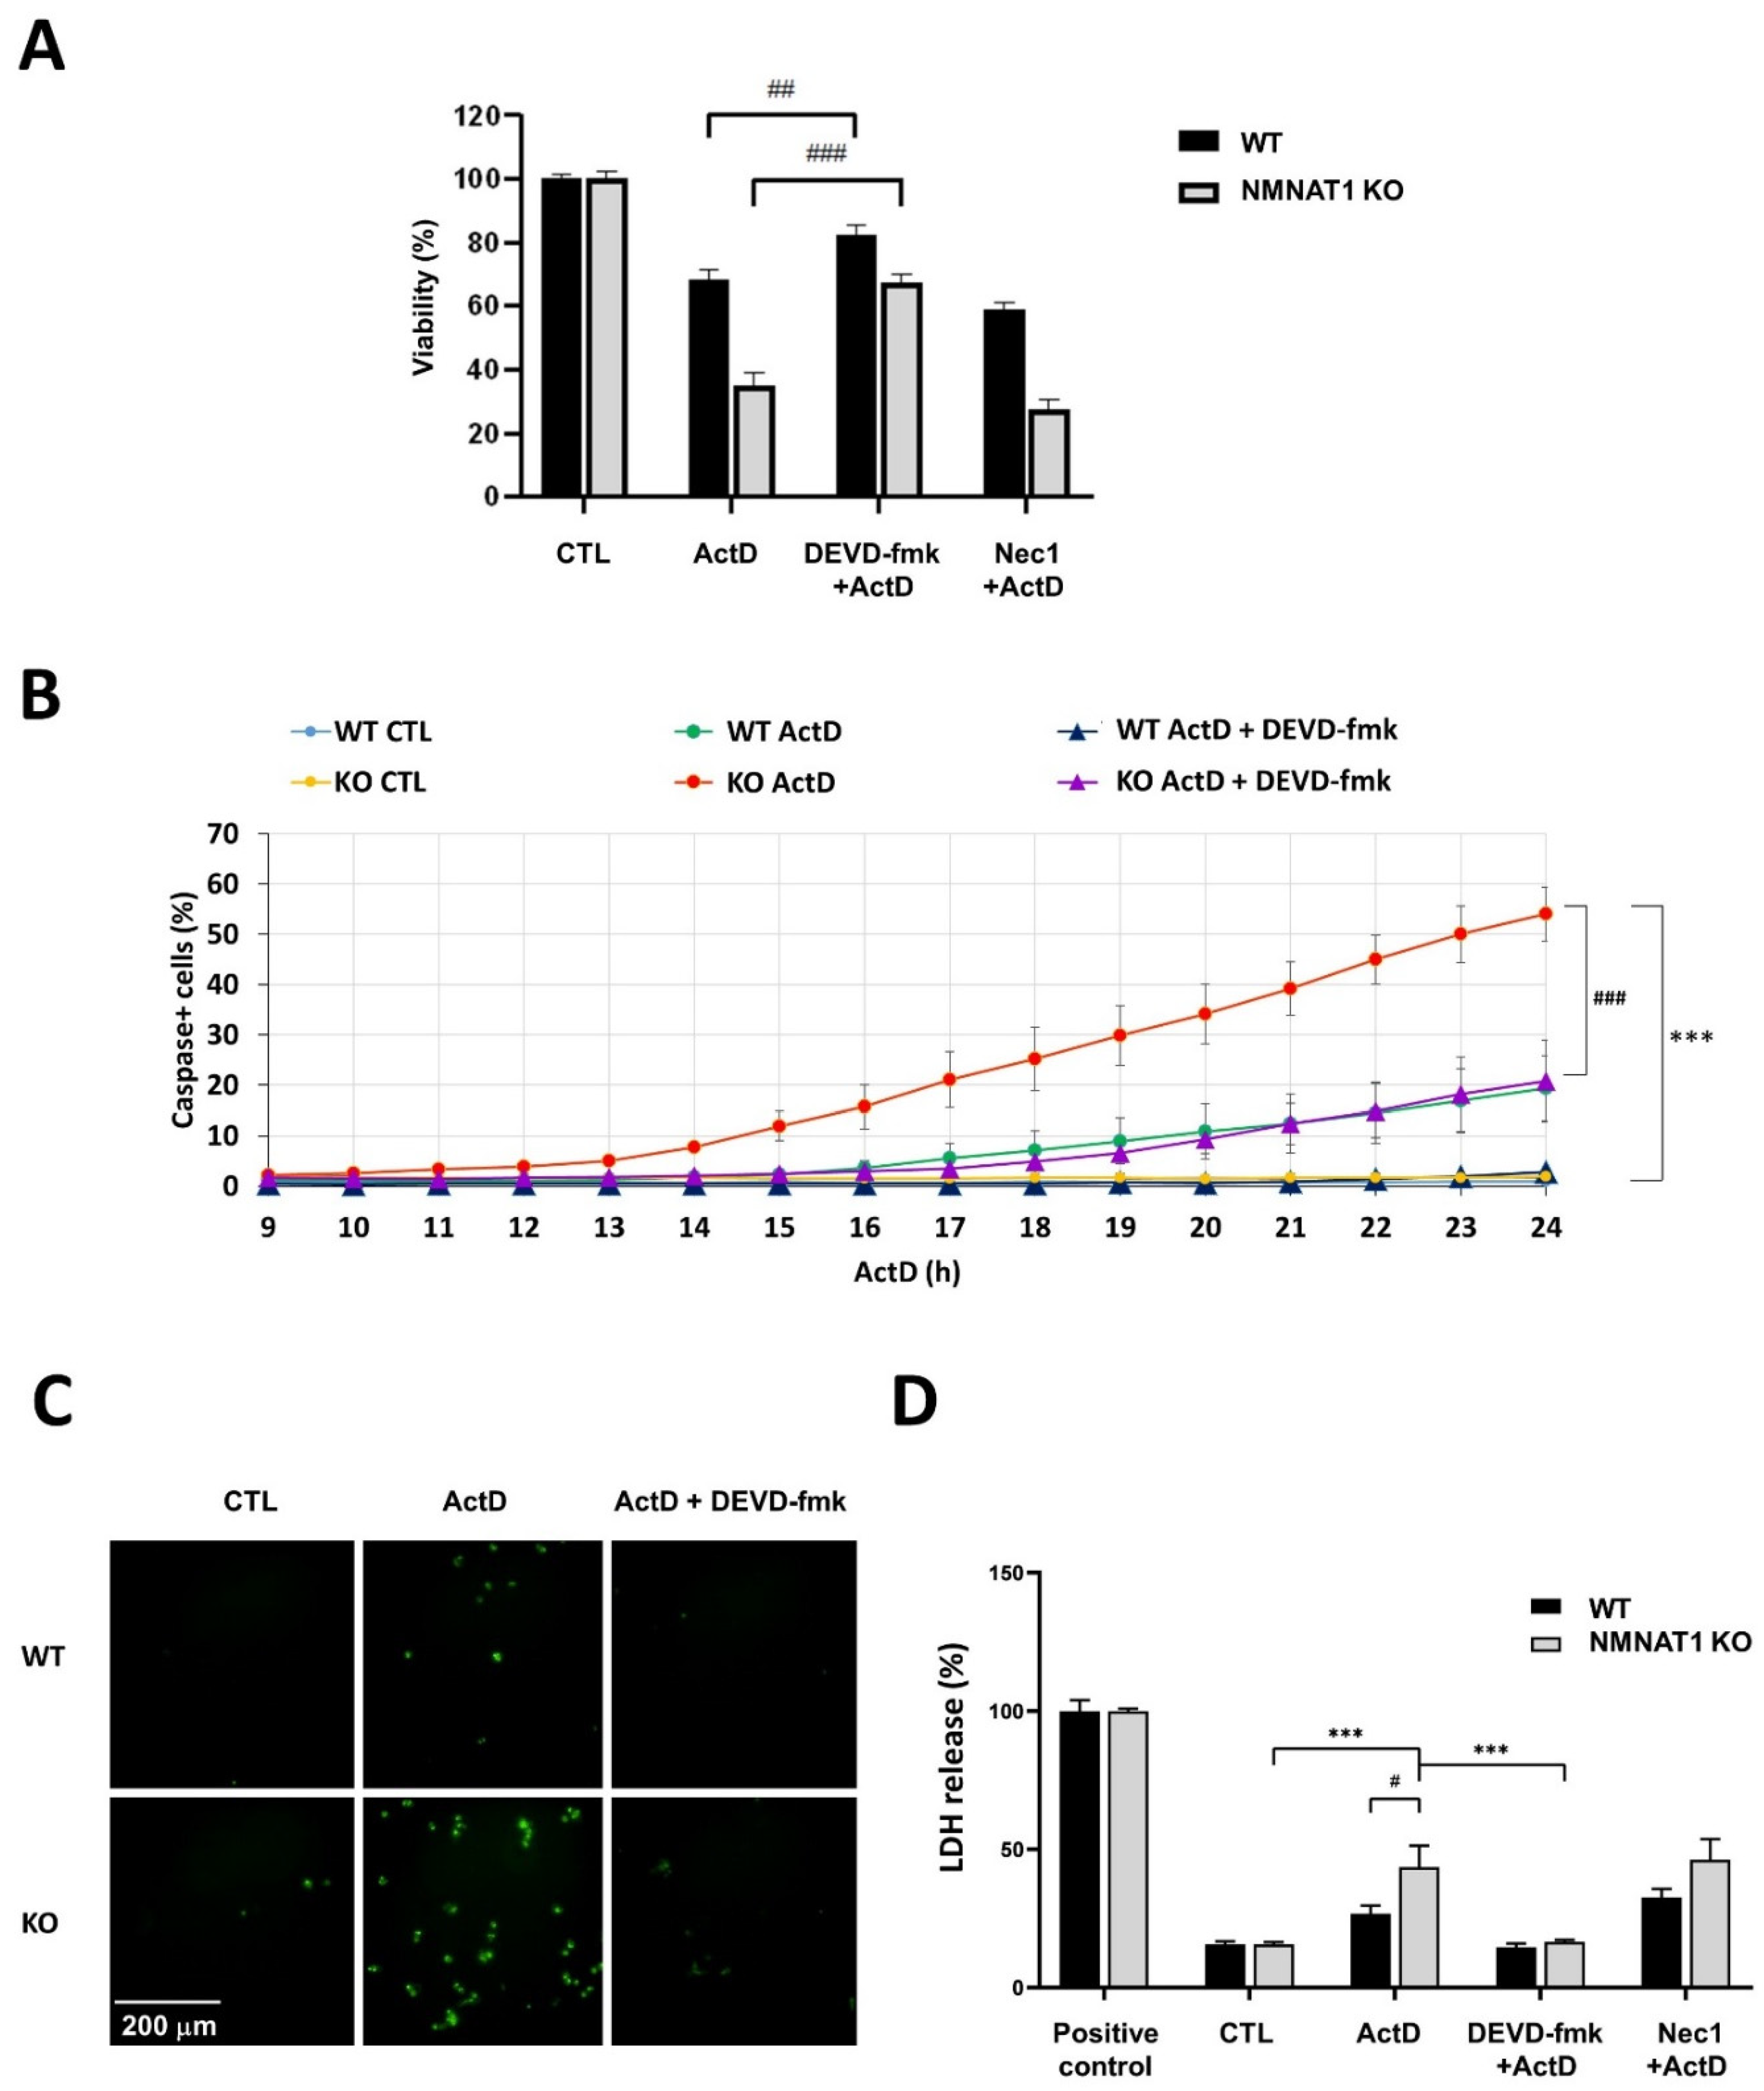
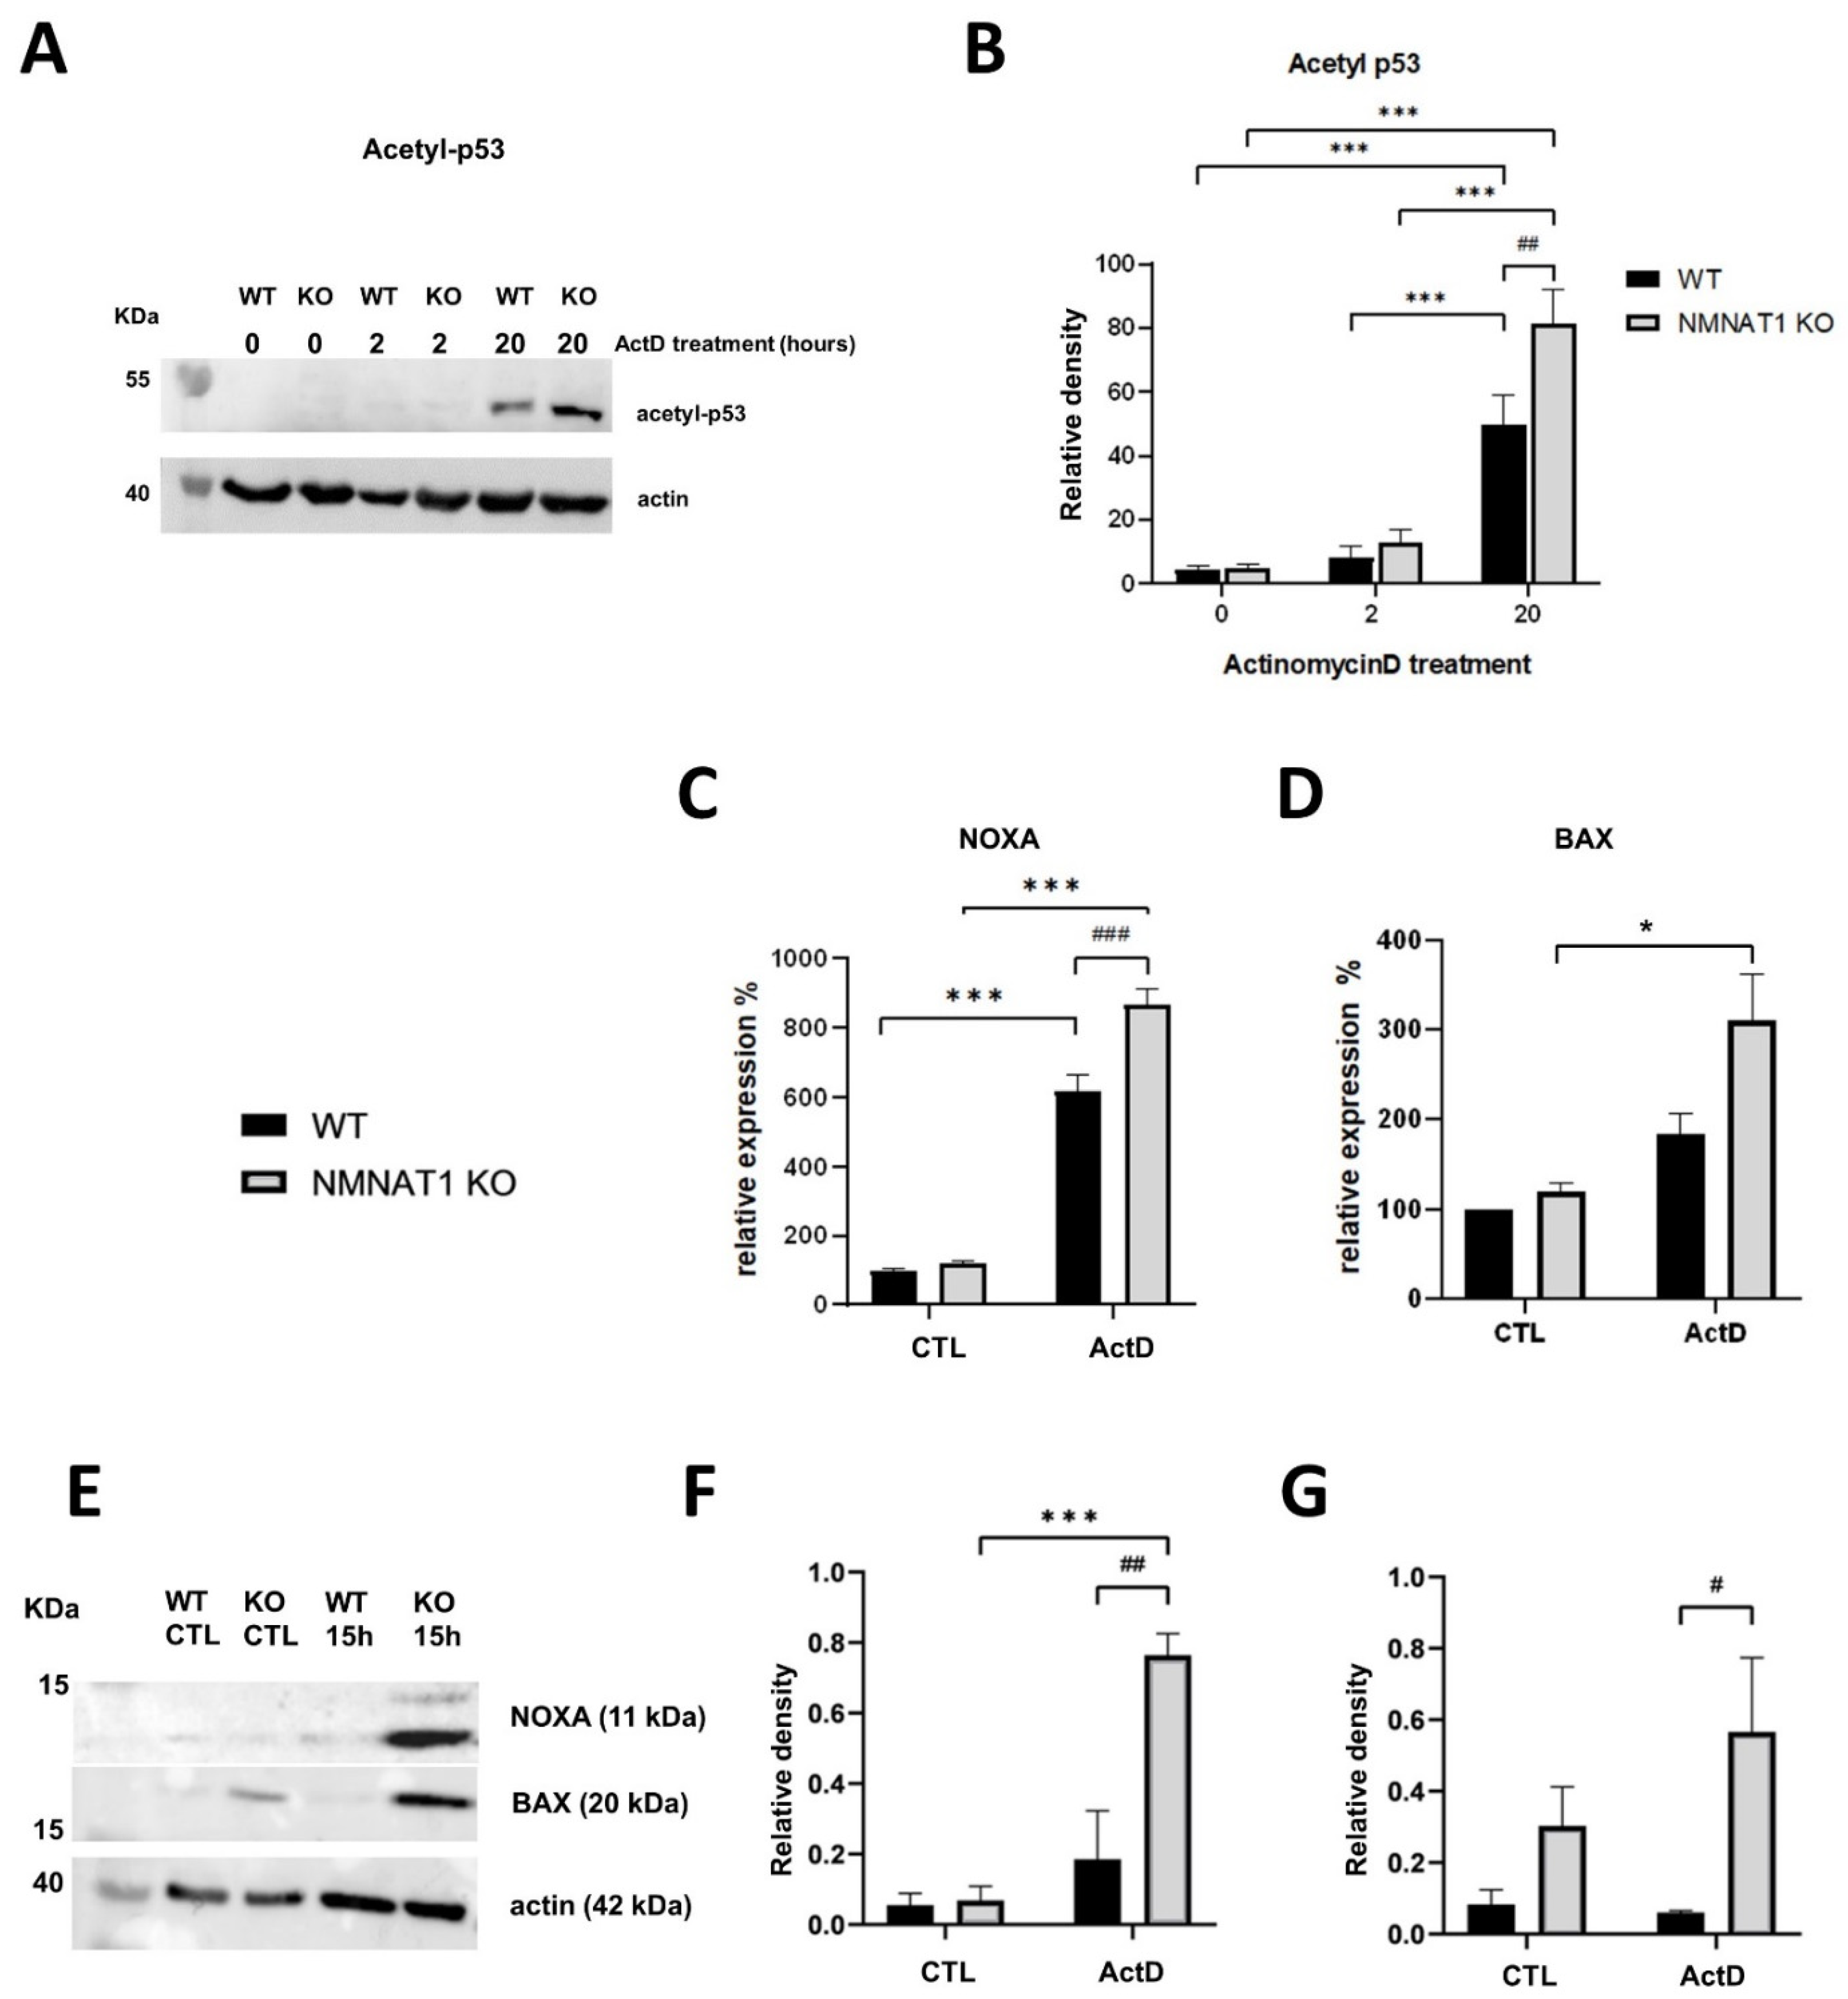
2.2. Characterization of ActD Induced Cell Death
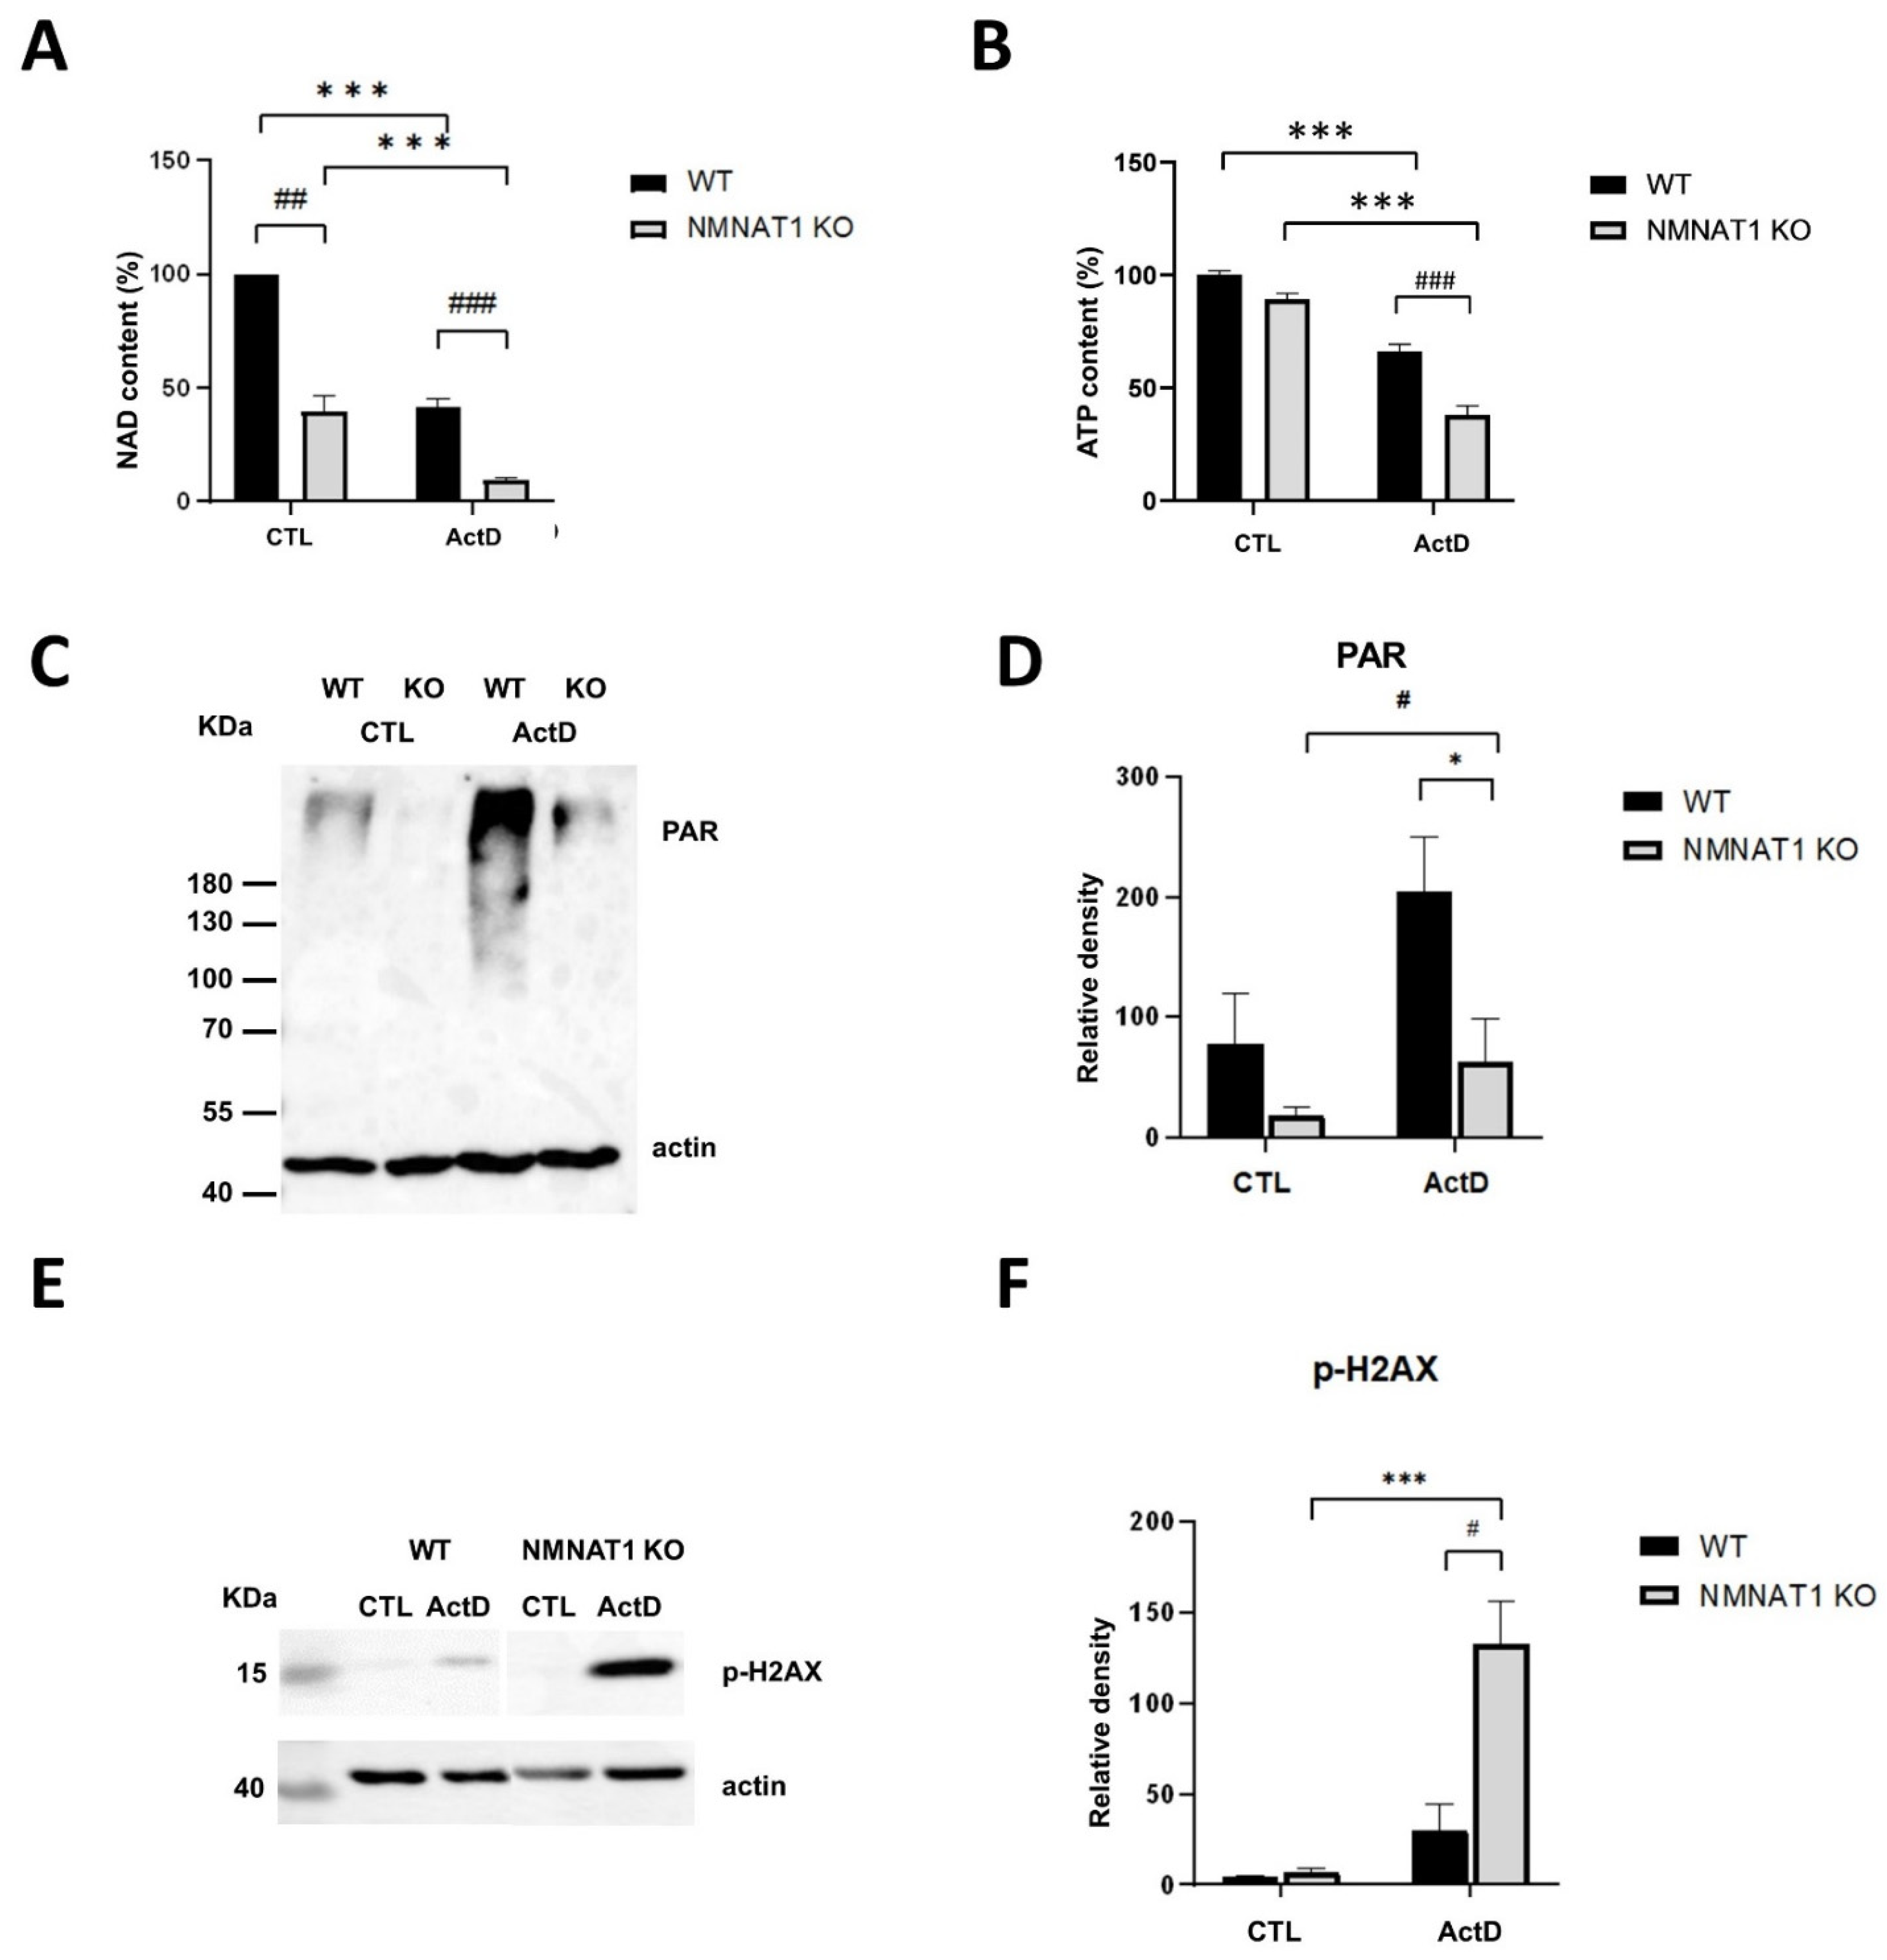
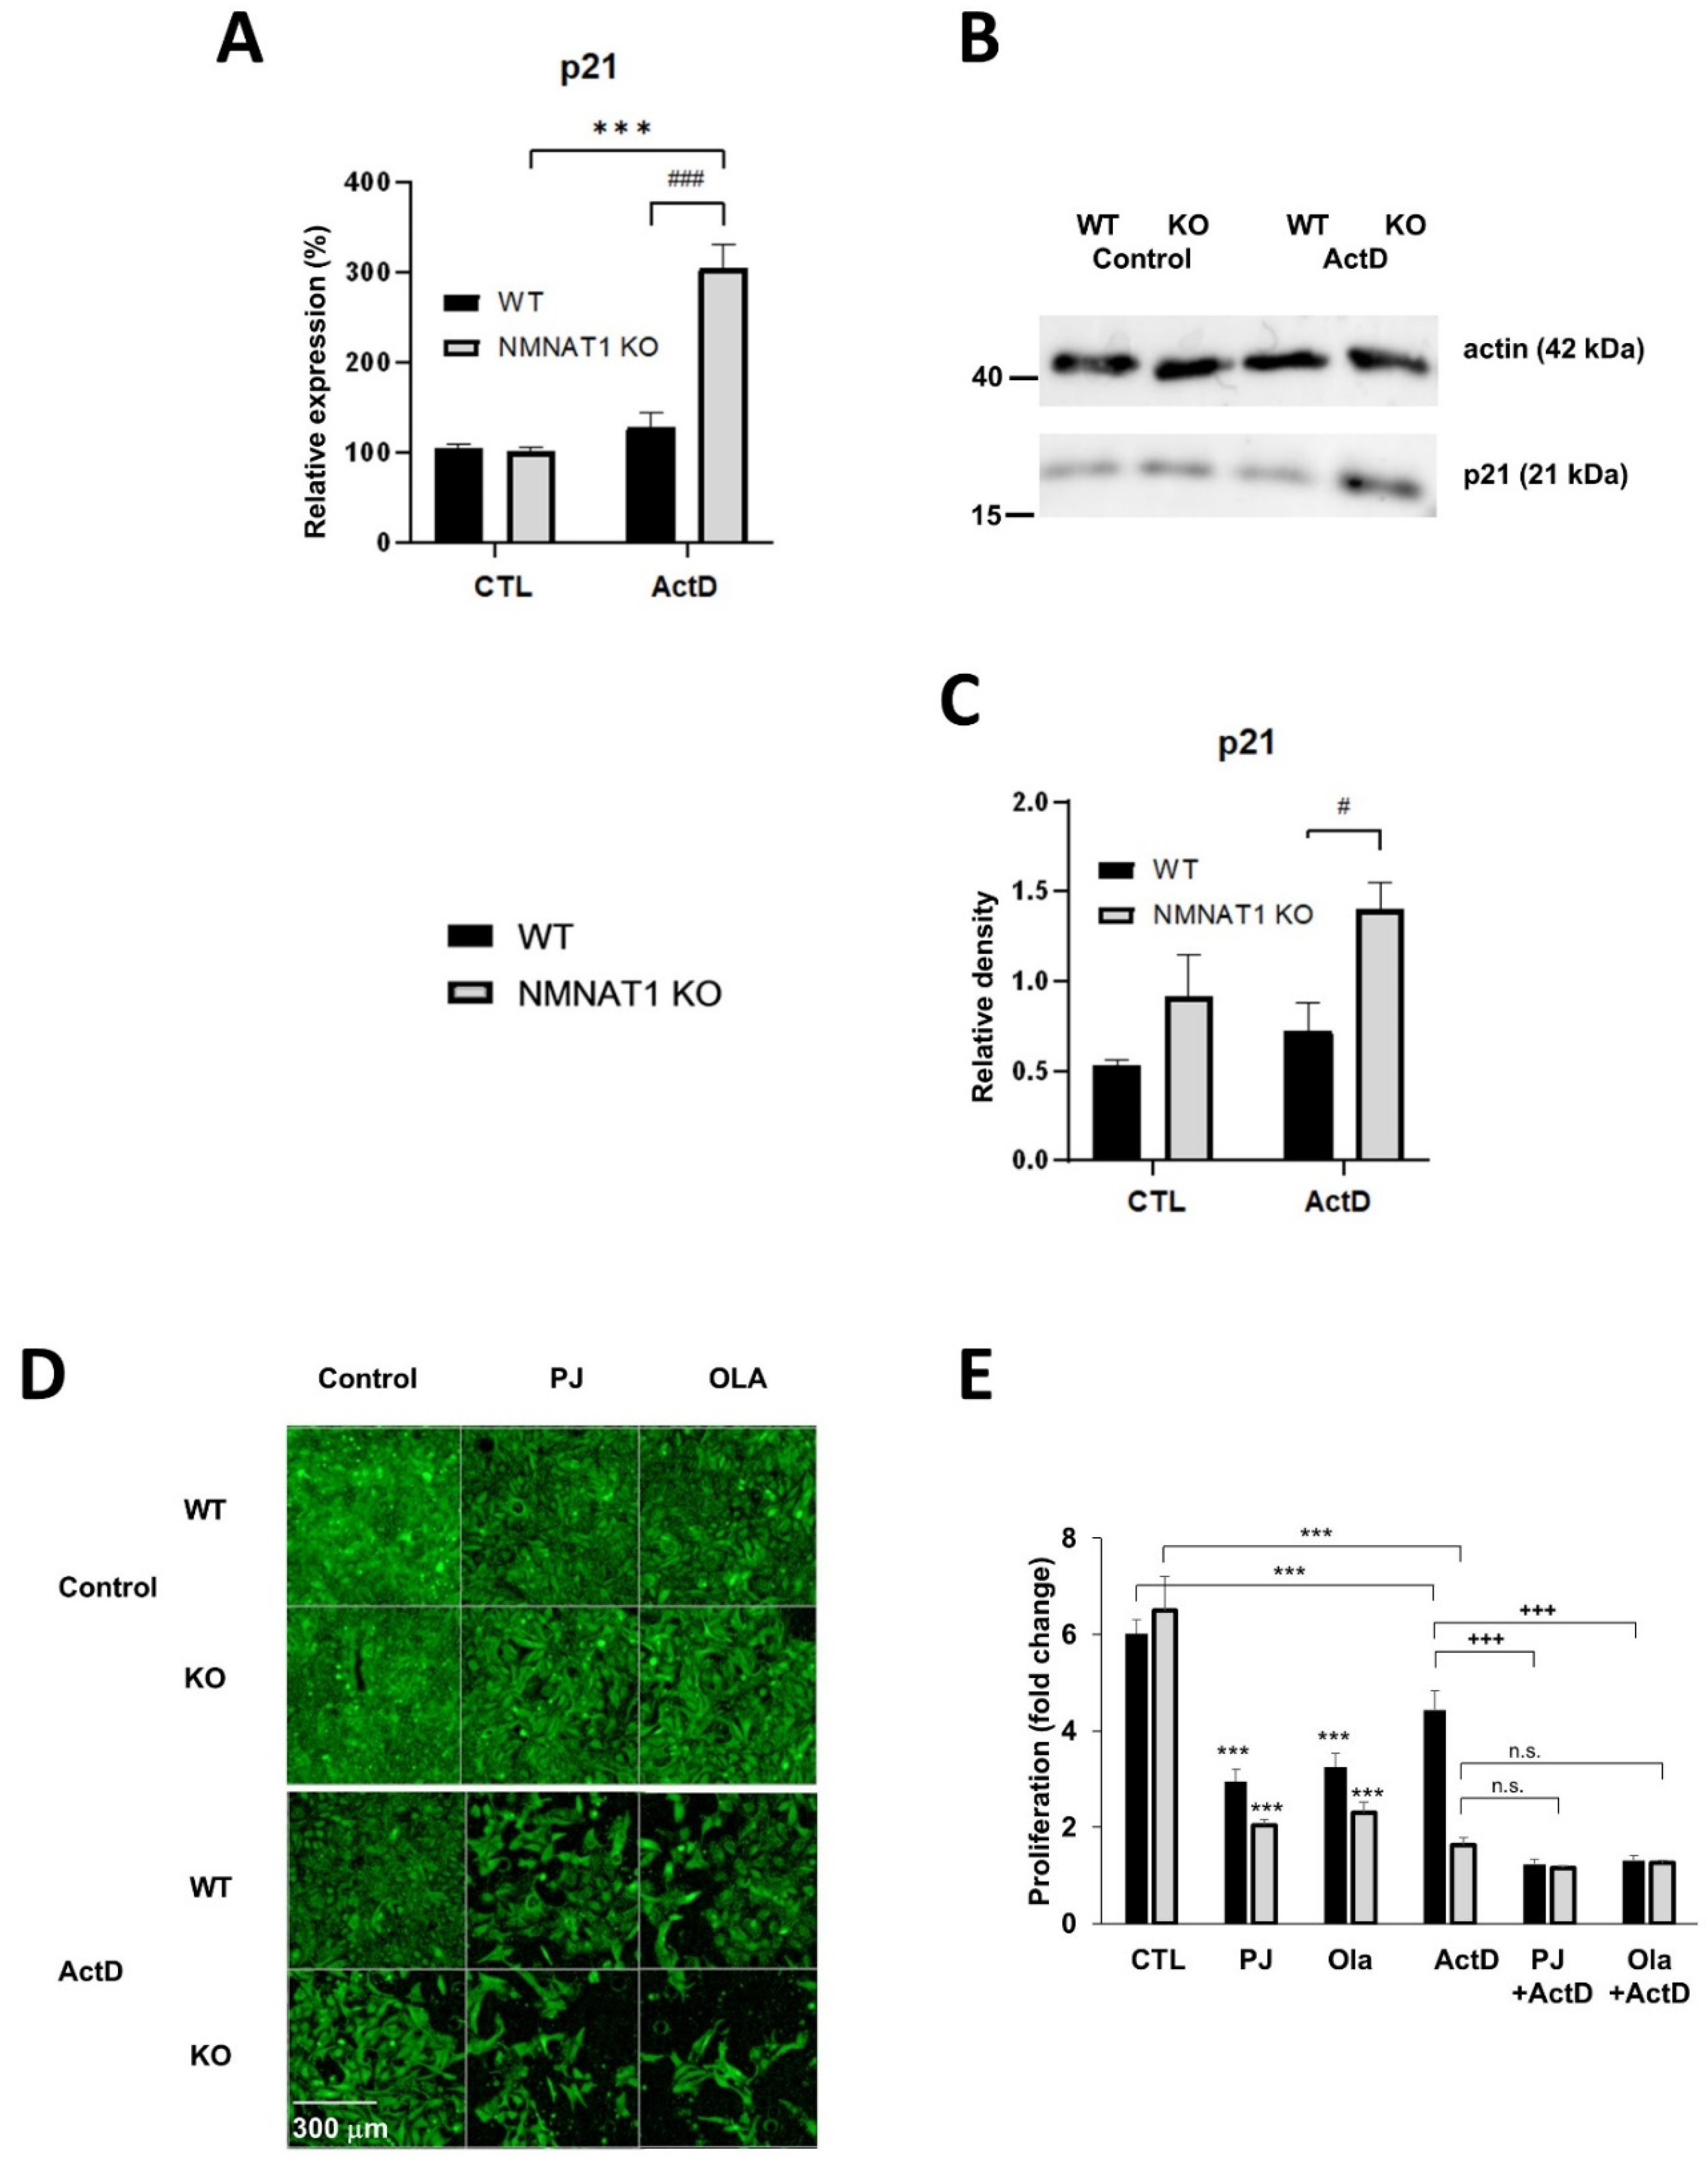
2.3. The Relationship between Low Nuclear NAD+ and Cell Death
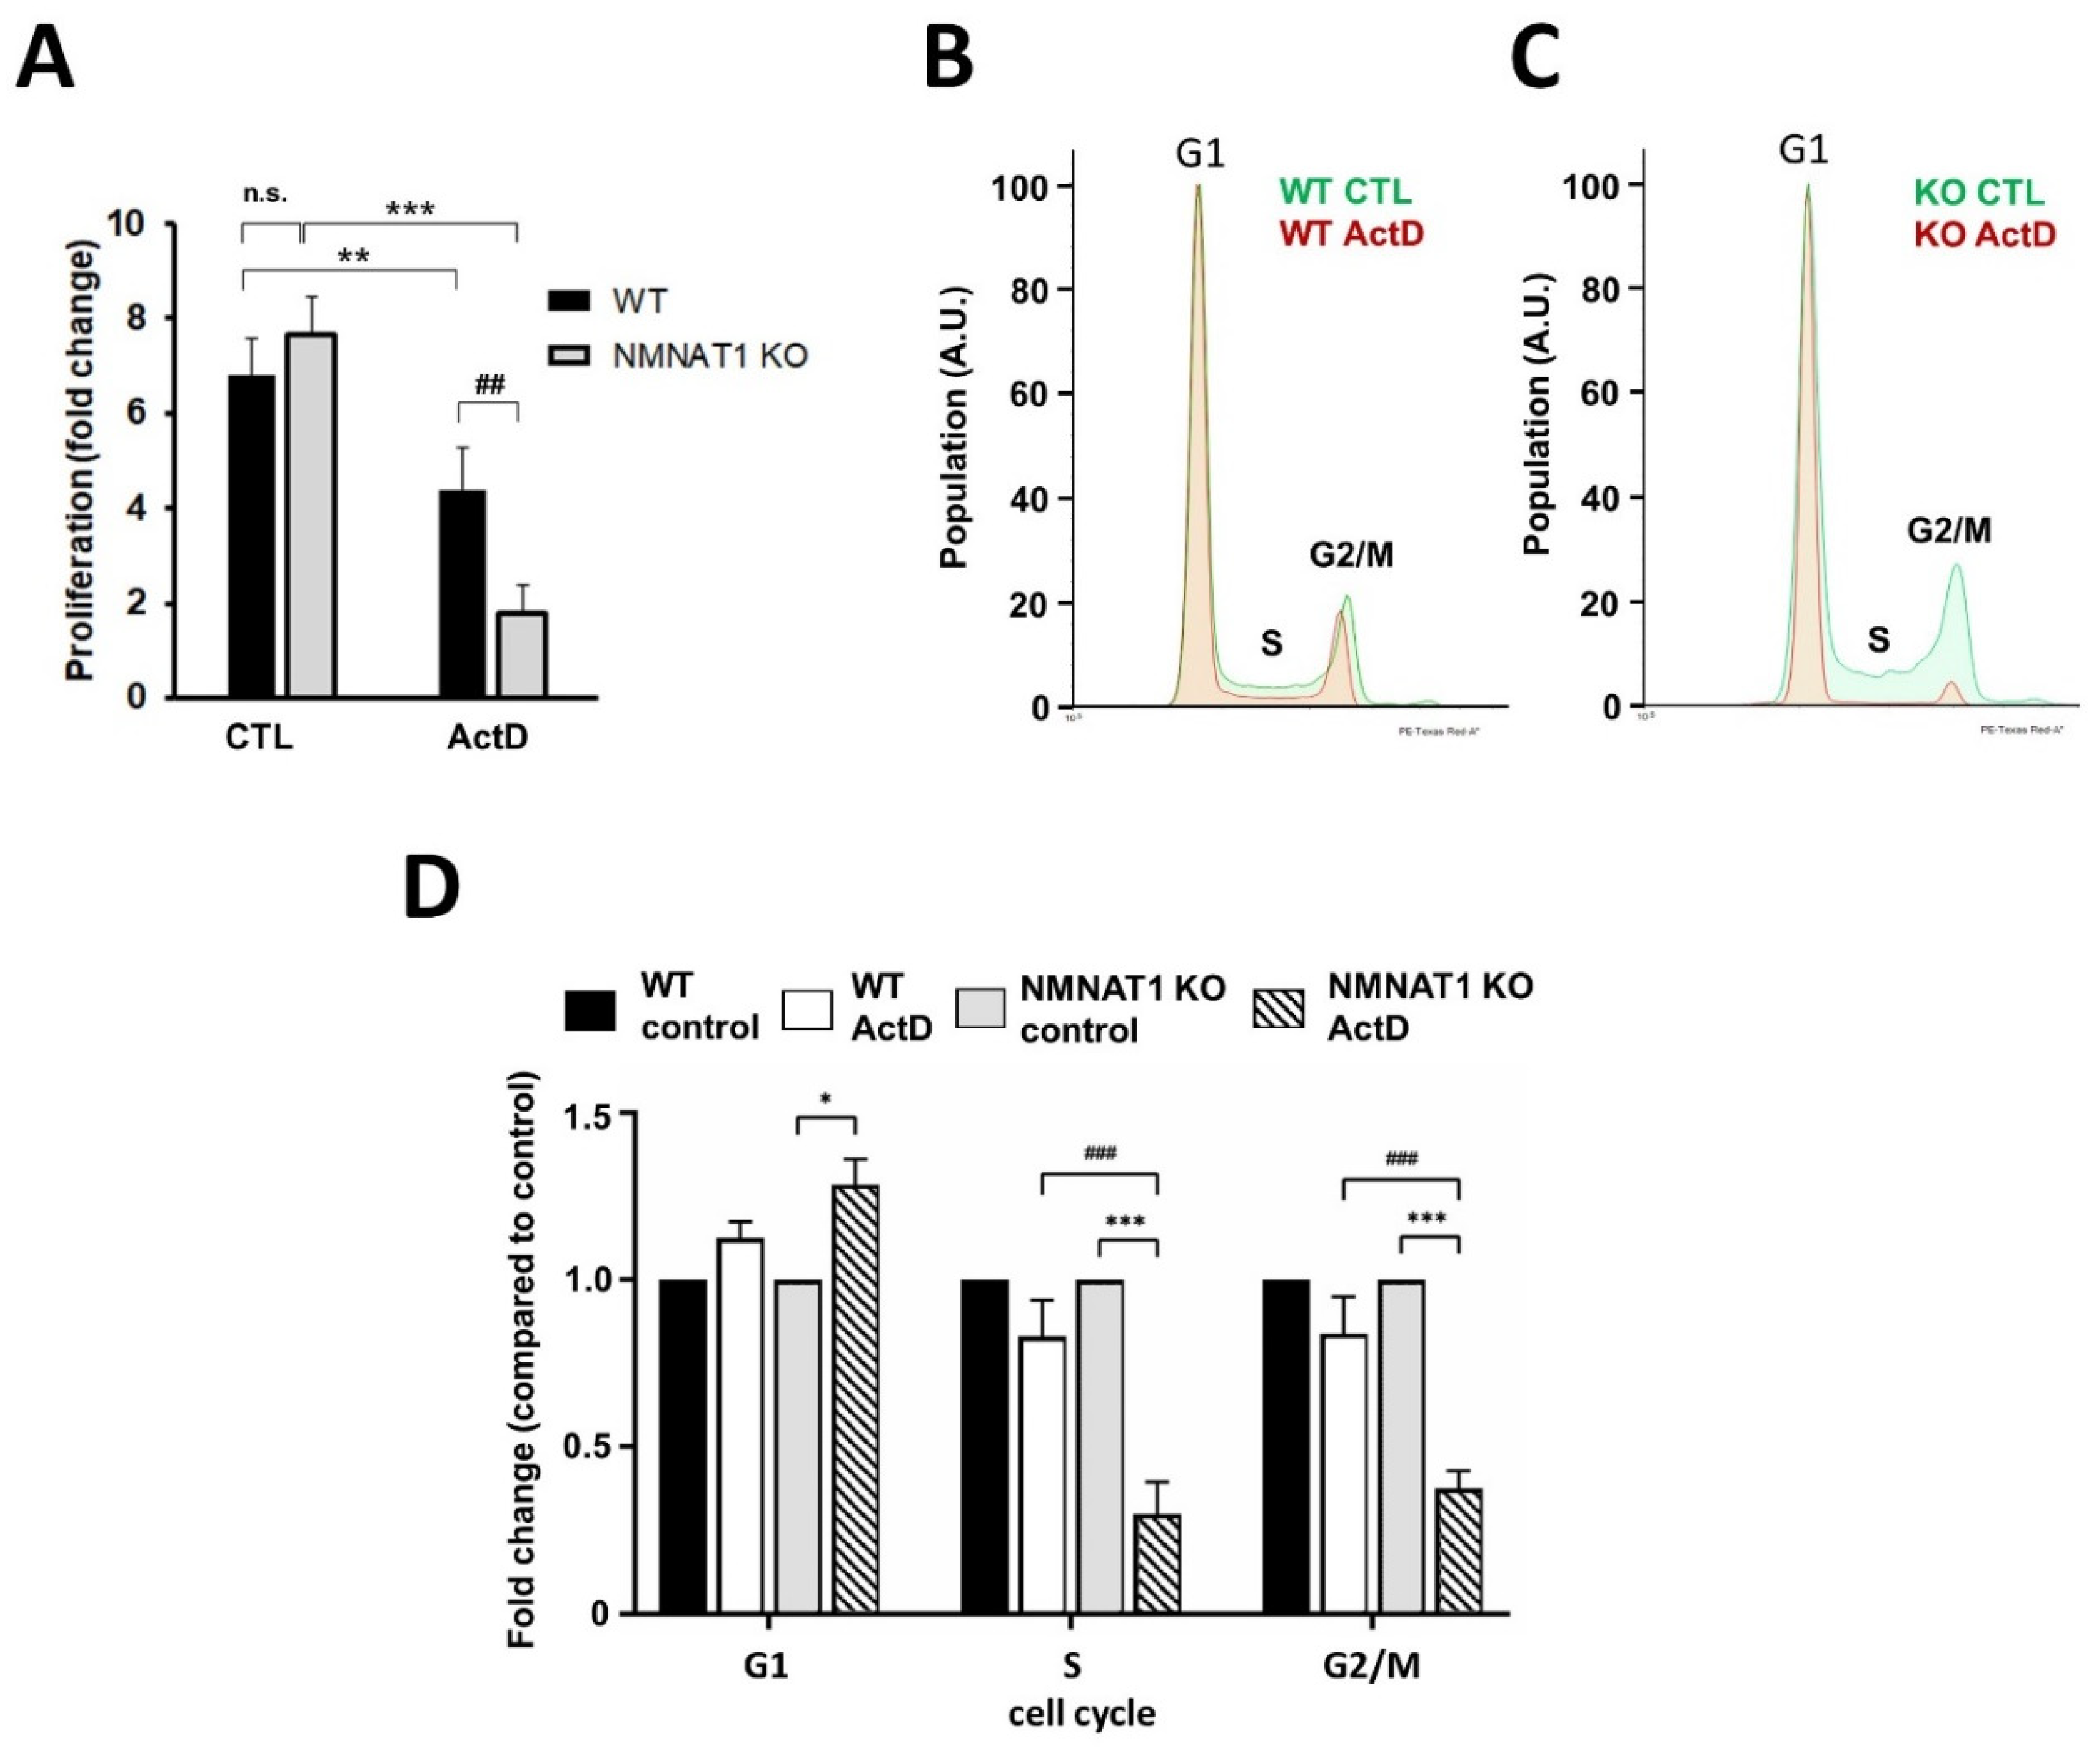
2.4. NMNAT1 Gene Inactivation Inhibits Cell Proliferation
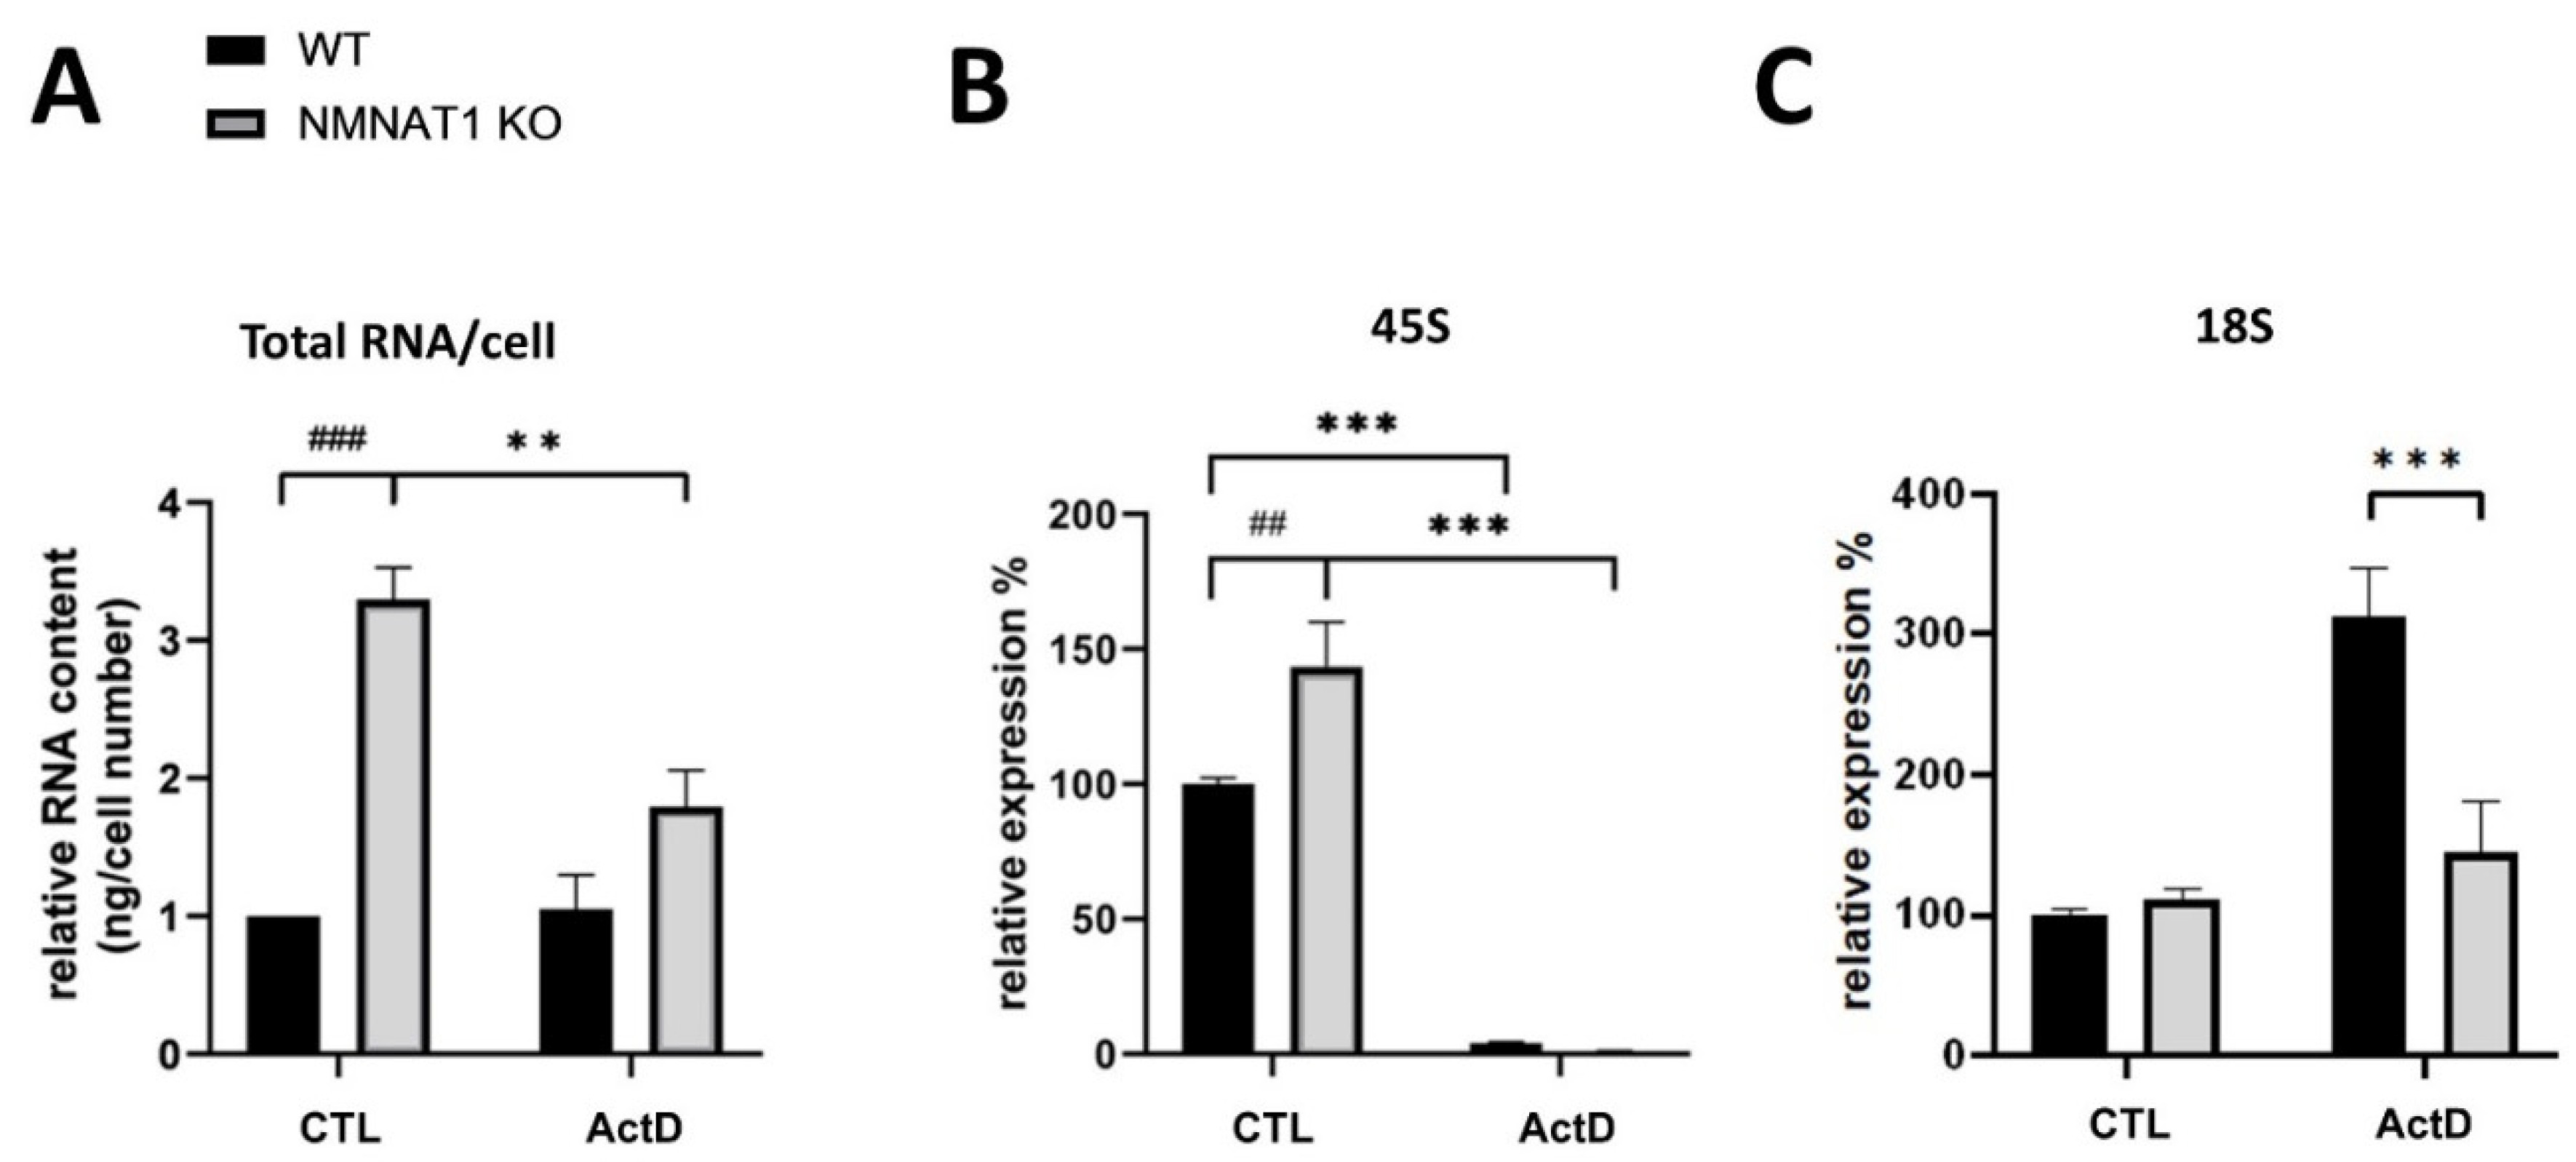
2.5. Total RNA, Ribosomal RNA
3. Discussion
4. Materials and Methods
4.1. Cell Culture
4.2. Cell Viability Assay for HTS Screening and Hit Validation
4.3. Cell Proliferation Assay (High Content Analysis)
4.4. RNA Extraction, RNA Content and Quantitative PCR
4.5. Caspase Activation and Lactate Dehydrogenase (LDH) Release Assay
4.6. Western Blotting and Cellular NAD+/ATP Assays
4.7. Cell Cycle Analysis by Flow Cytometry
4.8. Statistical Analysis
Supplementary Materials
Author Contributions
Funding
Institutional Review Board Statement
Informed Consent Statement
Data Availability Statement
Acknowledgments
Conflicts of Interest
References
- Keil, L. Bone Tumors: Primary Bone Cancers. FP Essent 2020, 493, 22–26. [Google Scholar]
- Misaghi, A.; Goldin, A.; Awad, M.; Kulidjian, A.A. Osteosarcoma: A comprehensive review. SICOT J. 2018, 4, 12. [Google Scholar] [CrossRef] [Green Version]
- Zhang, B.; Zhang, Y.; Li, R.; Li, J.; Lu, X.; Zhang, Y. The efficacy and safety comparison of first-line chemotherapeutic agents (high-dose methotrexate, doxorubicin, cisplatin, and ifosfamide) for osteosarcoma: A network meta-analysis. J. Orthop. Surg. Res. 2020, 15, 51. [Google Scholar] [CrossRef] [Green Version]
- Kiss, A.; Raduly, A.P.; Regdon, Z.; Polgar, Z.; Tarapcsak, S.; Sturniolo, I.; El-Hamoly, T.; Virag, L.; Hegedus, C. Targeting Nuclear NAD (+) Synthesis Inhibits DNA Repair, Impairs Metabolic Adaptation and Increases Chemosensitivity of U-2OS Osteosarcoma Cells. Cancers 2020, 12, 1180. [Google Scholar] [CrossRef] [PubMed]
- Berger, N.A.; Besson, V.C.; Boulares, A.H.; Burkle, A.; Chiarugi, A.; Clark, R.S.; Curtin, N.J.; Cuzzocrea, S.; Dawson, T.M.; Dawson, V.L.; et al. Opportunities for the repurposing of PARP inhibitors for the therapy of non-oncological diseases. Br. J. Pharmacol. 2018, 175, 192–222. [Google Scholar] [CrossRef] [PubMed]
- Marti, J.M.; Fernandez-Cortes, M.; Serrano-Saenz, S.; Zamudio-Martinez, E.; Delgado-Bellido, D.; Garcia-Diaz, A.; Oliver, F.J. The Multifactorial Role of PARP-1 in Tumor Microenvironment. Cancers 2020, 12, 739. [Google Scholar] [CrossRef] [PubMed] [Green Version]
- Miwa, M.; Masutani, M. PolyADP-ribosylation and cancer. Cancer Sci. 2007, 98, 1528–1535. [Google Scholar] [CrossRef] [PubMed]
- Bajrami, I.; Kigozi, A.; van Weverwijk, A.; Brough, R.; Frankum, J.; Lord, C.J.; Ashworth, A. Synthetic lethality of PARP and NAMPT inhibition in triple-negative breast cancer cells. EMBO Mol. Med. 2012, 4, 1087–1096. [Google Scholar] [CrossRef]
- Chowdhry, S.; Zanca, C.; Rajkumar, U.; Koga, T.; Diao, Y.; Raviram, R.; Liu, F.; Turner, K.; Yang, H.; Brunk, E.; et al. NAD metabolic dependency in cancer is shaped by gene amplification and enhancer remodelling. Nature 2019, 569, 570–575. [Google Scholar] [CrossRef]
- Berger, F.; Lau, C.; Dahlmann, M.; Ziegler, M. Subcellular compartmentation and differential catalytic properties of the three human nicotinamide mononucleotide adenylyltransferase isoforms. J. Biol. Chem. 2005, 280, 36334–36341. [Google Scholar] [CrossRef] [Green Version]
- Berger, F.; Lau, C.; Ziegler, M. Regulation of poly (ADP-ribose) polymerase 1 activity by the phosphorylation state of the nuclear NAD biosynthetic enzyme NMN adenylyl transferase 1. Proc. Natl. Acad. Sci. USA 2007, 104, 3765–3770. [Google Scholar] [CrossRef] [Green Version]
- Demeny, M.A.; Virag, L. The PARP Enzyme Family and the Hallmarks of Cancer Part 1. Cell Intrinsic Hallmarks. Cancers 2021, 13, 2042. [Google Scholar] [PubMed]
- Virag, L. Structure and function of poly (ADP-ribose) polymerase-1: Role in oxidative stress-related pathologies. Curr. Vasc. Pharmacol. 2005, 3, 209–214. [Google Scholar] [CrossRef] [PubMed]
- Hegedus, C.; Virag, L. Inputs and outputs of poly (ADP-ribosyl)ation: Relevance to oxidative stress. Redox. Biol. 2014, 2, 978–982. [Google Scholar] [CrossRef] [Green Version]
- Nagy, A.; Lanczky, A.; Menyhart, O.; Gyorffy, B. Validation of miRNA prognostic power in hepatocellular carcinoma using expression data of independent datasets. Sci. Rep. 2018, 8, 9227. [Google Scholar] [CrossRef] [PubMed]
- Lu, D.F.; Wang, Y.S.; Li, C.; Wei, G.J.; Chen, R.; Dong, D.M.; Yao, M. Actinomycin D inhibits cell proliferations and promotes apoptosis in osteosarcoma cells. Int. J. Clin. Exp. Med. 2015, 8, 1904–1911. [Google Scholar]
- Canto, C.; Auwerx, J. Targeting sirtuin 1 to improve metabolism: All you need is NAD (+)? Pharmacol. Rev. 2012, 64, 166–187. [Google Scholar] [CrossRef] [Green Version]
- Luna, A.; Aladjem, M.I.; Kohn, K.W. SIRT1/PARP1 crosstalk: Connecting DNA damage and metabolism. Genome. Integr. 2013, 4, 6. [Google Scholar] [CrossRef]
- Graves, D.E.; Wadkins, R.M. 7-Azidoactinomycin D: A novel probe for examining actinomycin D-DNA interactions. J. Biol. Chem. 1989, 264, 7262–7266. [Google Scholar] [CrossRef]
- Zhang, T.; Berrocal, J.G.; Yao, J.; DuMond, M.E.; Krishnakumar, R.; Ruhl, D.D.; Ryu, K.W.; Gamble, M.J.; Kraus, W.L. Regulation of poly(ADP-ribose) polymerase-1-dependent gene expression through promoter-directed recruitment of a nuclear NAD+ synthase. J. Biol. Chem. 2012, 287, 12405–12416. [Google Scholar] [CrossRef] [Green Version]
- Peck, B.; Chen, C.Y.; Ho, K.K.; di Fruscia, P.; Myatt, S.S.; Coombes, R.C.; Fuchter, M.J.; Hsiao, C.D.; Lam, E.W. SIRT inhibitors induce cell death and p53 acetylation through targeting both SIRT1 and SIRT2. Mol. Cancer Ther. 2010, 9, 844–855. [Google Scholar] [CrossRef] [Green Version]
- Zheng, J.; Zhuo, L.; Ran, D.; Ma, Y.; Luo, T.; Zhao, H.; Song, R.; Zou, H.; Zhu, J.; Gu, J.; et al. Cadmium induces apoptosis via generating reactive oxygen species to activate mitochondrial p53 pathway in primary rat osteoblasts. Toxicology 2020, 446, 152611. [Google Scholar] [CrossRef]
- Shamloo, B.; Usluer, S. p21 in Cancer Research. Cancers 2019, 11, 1178. [Google Scholar]
- Slade, D. PARP and PARG inhibitors in cancer treatment. Genes Dev. 2020, 34, 360–394. [Google Scholar] [CrossRef] [Green Version]
- Song, T.; Yang, L.; Kabra, N.; Chen, L.; Koomen, J.; Haura, E.B.; Chen, J. The NAD+ synthesis enzyme nicotinamide mononucleotide adenylyltransferase (NMNAT1) regulates ribosomal RNA transcription. J. Biol. Chem. 2013, 288, 20908–20917. [Google Scholar] [CrossRef] [PubMed] [Green Version]
- Krugh, T.R. Association of actinomycin D and deoxyribodinucleotides as a model for binding of the drug to DNA. Proc. Natl. Acad. Sci. USA 1972, 69, 1911–1914. [Google Scholar] [CrossRef] [PubMed] [Green Version]
- Aboud, O.A.; Chen, C.H.; Senapedis, W.; Baloglu, E.; Argueta, C.; Weiss, R.H. Dual and Specific Inhibition of NAMPT and PAK4 by KPT-9274 Decreases Kidney Cancer Growth. Mol. Cancer Ther. 2016, 15, 2119–2129. [Google Scholar] [CrossRef] [Green Version]
- Lucena-Cacace, A.; Otero-Albiol, D.; Jimenez-Garcia, M.P.; Munoz-Galvan, S.; Carnero, A. NAMPT Is a Potent Oncogene in Colon Cancer Progression that Modulates Cancer Stem Cell Properties and Resistance to Therapy through Sirt1 and PARP. Clin. Cancer Res. 2018, 24, 1202–1215. [Google Scholar] [CrossRef] [PubMed] [Green Version]
- Lucena-Cacace, A.; Otero-Albiol, D.; Jimenez-Garcia, M.P.; Peinado-Serrano, J.; Carnero, A. NAMPT overexpression induces cancer stemness and defines a novel tumor signature for glioma prognosis. Oncotarget 2017, 8, 99514–99530. [Google Scholar] [CrossRef] [PubMed] [Green Version]
- Pan, L.Z.; Ahn, D.G.; Sharif, T.; Clements, D.; Gujar, S.A.; Lee, P.W. The NAD+ synthesizing enzyme nicotinamide mononucleotide adenylyltransferase 2 (NMNAT-2) is a p53 downstream target. Cell Cycle 2014, 13, 1041–1048. [Google Scholar] [CrossRef] [Green Version]
- Cui, C.; Qi, J.; Deng, Q.; Chen, R.; Zhai, D.; Yu, J. Nicotinamide Mononucleotide Adenylyl Transferase 2: A Promising Diagnostic and Therapeutic Target for Colorectal Cancer. Biomed. Res. Int. 2016, 2016, 1804137. [Google Scholar] [CrossRef] [Green Version]
- Li, H.; Feng, Z.; Wu, W.; Li, J.; Zhang, J.; Xia, T. SIRT3 regulates cell proliferation and apoptosis related to energy metabolism in non-small cell lung cancer cells through deacetylation of NMNAT2. Int. J. Oncol. 2013, 43, 1420–1430. [Google Scholar] [CrossRef] [Green Version]
- Tabchi, S.; Nair, R.; Kunacheewa, C.; Patel, K.K.; Lee, H.C.; Thomas, S.K.; Amini, B.; Ahmed, S.; Mehta, R.S.; Bashir, Q.; et al. Retrospective Review of the Use of High-Dose Cyclophosphamide, Bortezomib, Doxorubicin, and Dexamethasone for the Treatment of Multiple Myeloma and Plasma Cell Leukemia. Clin. Lymphoma Myeloma Leuk. 2019, 19, 560–569. [Google Scholar] [CrossRef]
- Robak, P.; Robak, T. Bortezomib for the Treatment of Hematologic Malignancies: 15 Years Later. Drugs R D 2019, 19, 73–92. [Google Scholar] [PubMed] [Green Version]
- Roeten, M.S.F.; Cloos, J.; Jansen, G. Positioning of proteasome inhibitors in therapy of solid malignancies. Cancer Chemother. Pharmacol. 2018, 81, 227–243. [Google Scholar]
- Hurwitz, J.; Furth, J.J.; Malamy, M.; Alexander, M. The role of deoxyribonucleic acid in ribonucleic acid synthesis. III. The inhibition of the enzymatic synthesis of ribonucleic acid and deoxyribonucleic acid by actinomycin D and proflavin. Proc. Natl. Acad. Sci. USA 1962, 48, 1222–1230. [Google Scholar] [CrossRef] [PubMed] [Green Version]
- Dworkin, M. Sensitivity of gliding bacteria to actinomycin D. J. Bacteriol. 1969, 98, 851–852. [Google Scholar] [CrossRef] [PubMed] [Green Version]
- Imamichi, T.; Murphy, M.A.; Adelsberger, J.W.; Yang, J.; Watkins, C.M.; Berg, S.C.; Baseler, M.W.; Lempicki, R.A.; Guo, J.; Levin, J.G.; et al. Actinomycin D induces high-level resistance to thymidine analogs in replication of human immunodeficiency virus type 1 by interfering with host cell thymidine kinase expression. J. Virol. 2003, 77, 1011–1020. [Google Scholar] [CrossRef] [Green Version]
- Cortes, C.L.; Veiga, S.R.; Almacellas, E.; Hernandez-Losa, J.; Ferreres, J.C.; Kozma, S.C.; Ambrosio, S.; Thomas, G.; Tauler, A. Effect of low doses of actinomycin D on neuroblastoma cell lines. Mol. Cancer 2016, 15, 1. [Google Scholar]
- Sobell, H.M. Actinomycin and DNA transcription. Proc. Natl. Acad. Sci. USA 1985, 82, 5328–5331. [Google Scholar] [PubMed] [Green Version]
- National Center for Biotechnology Information. PubChem Compound Summary for CID 457193, Dactinomycin; National Center for Biotechnology Information, U.S. National Library of Medicine: Bethesda, MD, USA, 2021. Available online: https://pubchem.ncbi.nlm.nih.gov/compound/88065965 (accessed on 16 August 2021).
- Curtin, N.J.; Szabo, C. Poly (ADP-ribose) polymerase inhibition: Past, present and future. Nat. Rev. Drug Discov. 2020, 19, 711–736. [Google Scholar] [PubMed]
- Koba, M.; Konopa, J. Actinomycin D and its mechanisms of action. Postepy Hig. Med. Dosw. 2005, 59, 290–298. [Google Scholar]
- Trask, D.K.; Muller, M.T. Stabilization of type I topoisomerase-DNA covalent complexes by actinomycin D. Proc. Natl. Acad. Sci. USA 1988, 85, 1417–1421. [Google Scholar] [CrossRef] [PubMed] [Green Version]
- Yang, T.; Zhou, R.; Yu, S.; Yu, S.; Cui, Z.; Hu, P.; Liu, J.; Qiao, Q.; Zhang, J. Cytoplasmic SIRT1 inhibits cell migration and invasion by impeding epithelial-mesenchymal transition in ovarian carcinoma. Mol. Cell Biochem. 2019, 459, 157–169. [Google Scholar]
- Liu, T.; Liu, P.Y.; Marshall, G.M. The critical role of the class III histone deacetylase SIRT1 in cancer. Cancer Res. 2009, 69, 1702–1705. [Google Scholar] [CrossRef] [PubMed] [Green Version]
- Chu, F.; Chou, P.M.; Zheng, X.; Mirkin, B.L.; Rebbaa, A. Control of multidrug resistance gene mdr1 and cancer resistance to chemotherapy by the longevity gene sirt1. Cancer Res. 2005, 65, 10183–10187. [Google Scholar] [CrossRef] [PubMed] [Green Version]
- Stunkel, W.; Peh, B.K.; Tan, Y.C.; Nayagam, V.M.; Wang, X.; Salto-Tellez, M.; Ni, B.; Entzeroth, M.; Wood, J. Function of the SIRT1 protein deacetylase in cancer. Biotechnol. J. 2007, 2, 1360–1368. [Google Scholar] [CrossRef]
- Yun, U.J.; Lee, I.H.; Lee, J.S.; Shim, J.; Kim, Y.N. Ginsenoside Rp1, A Ginsenoside Derivative, Augments Anti-Cancer Effects of Actinomycin D via Downregulation of an AKT-SIRT1 Pathway. Cancers 2020, 12, 605. [Google Scholar] [CrossRef] [Green Version]
- Reed, S.M.; Quelle, D.E. p53 Acetylation: Regulation and Consequences. Cancers 2014, 7, 30–69. [Google Scholar]
- Kim, H.K.; Kong, M.Y.; Jeong, M.J.; Han, D.C.; Choi, J.D.; Kim, H.Y.; Yoon, K.S.; Kim, J.M.; Son, K.H.; Kwon, B.M. Investigation of cell cycle arrest effects of actinomycin D at G1 phase using proteomic methods in B104-1-1 cells. Int. J. Biochem. Cell Biol. 2005, 37, 1921–1929. [Google Scholar] [CrossRef]
- Brighenti, E.; Trere, D.; Derenzini, M. Targeted cancer therapy with ribosome biogenesis inhibitors: A real possibility? Oncotarget 2015, 6, 38617–38627. [Google Scholar] [CrossRef] [PubMed] [Green Version]
- Engbrecht, M.; Mangerich, A. The Nucleolus and PARP1 in Cancer Biology. Cancers 2020, 12, 1813. [Google Scholar]
- Eleazer, R.; Fondufe-Mittendorf, Y.N. The multifaceted role of PARP1 in RNA biogenesis. Wiley Interdiscip. Rev. RNA 2021, 12, e1617. [Google Scholar] [CrossRef]
- Masutani, M.; Nakagama, H.; Sugimura, T. Poly (ADP-ribosyl)ation in relation to cancer and autoimmune disease. Cell Mol. Life Sci. 2005, 62, 769–783. [Google Scholar] [CrossRef]
- Nozaki, T.; Masutani, M.; Akagawa, T.; Sugimura, T.; Esumi, H. Suppression of G1 arrest and enhancement of G2 arrest by inhibitors of poly (ADP-ribose) polymerase: Possible involvement of poly (ADP-ribosyl)ation in cell cycle arrest following gamma-irradiation. Jpn. J. Cancer Res. 1994, 85, 1094–1098. [Google Scholar] [CrossRef]
- Vormoor, B.; Curtin, N.J. Poly (ADP-ribose) polymerase inhibitors in Ewing sarcoma. Curr. Opin. Oncol. 2014, 26, 428–433. [Google Scholar] [CrossRef]


Publisher’s Note: MDPI stays neutral with regard to jurisdictional claims in published maps and institutional affiliations. |
© 2021 by the authors. Licensee MDPI, Basel, Switzerland. This article is an open access article distributed under the terms and conditions of the Creative Commons Attribution (CC BY) license (https://creativecommons.org/licenses/by/4.0/).
Share and Cite
Kiss, A.; Csikos, C.; Regdon, Z.; Polgár, Z.; Virág, L.; Hegedűs, C. NMNAT1 Is a Survival Factor in Actinomycin D-Induced Osteosarcoma Cell Death. Int. J. Mol. Sci. 2021, 22, 8869. https://0-doi-org.brum.beds.ac.uk/10.3390/ijms22168869
Kiss A, Csikos C, Regdon Z, Polgár Z, Virág L, Hegedűs C. NMNAT1 Is a Survival Factor in Actinomycin D-Induced Osteosarcoma Cell Death. International Journal of Molecular Sciences. 2021; 22(16):8869. https://0-doi-org.brum.beds.ac.uk/10.3390/ijms22168869
Chicago/Turabian StyleKiss, Alexandra, Csaba Csikos, Zsolt Regdon, Zsuzsanna Polgár, László Virág, and Csaba Hegedűs. 2021. "NMNAT1 Is a Survival Factor in Actinomycin D-Induced Osteosarcoma Cell Death" International Journal of Molecular Sciences 22, no. 16: 8869. https://0-doi-org.brum.beds.ac.uk/10.3390/ijms22168869