Article

Genome-Wide Identification and Analysis of the Metallothionein Genes in Oryza Genus

State Key Laboratory of Hybrid Rice, Hongshan Laboratory of Hubei Province, Key Laboratory for Research and Utilization of Heterosis in Indica Rice of Ministry of Agriculture, Engineering Research Center for Plant Biotechnology and Germplasm Utilization of Ministry of Education, College of Life Science, Wuhan University, Wuhan 430072, China
*
Author to whom correspondence should be addressed.
These authors contributed equally to this work.
Int. J. Mol. Sci. 2021, 22(17), 9651; https://0-doi-org.brum.beds.ac.uk/10.3390/ijms22179651
Submission received: 16 August 2021 / Revised: 3 September 2021 / Accepted: 4 September 2021 / Published: 6 September 2021
(This article belongs to the Special Issue Plant Genomics and Genome Editing)

Abstract

:
Metallothionein (MT) proteins are low molecular mass, cysteine-rich, and metal-binding proteins that play an important role in maintaining metal homeostasis and stress response. However, the evolutionary relationships and functional differentiation of MT in the Oryza genus remain unclear. Here we identified 53 MT genes from six Oryza genera, including O. sativa ssp. japonica, O. rufipogon, O. sativa ssp. indica, O. nivara, O. glumaepatula, and O. barthii. The MT genes were clustered into four groups based on phylogenetic analysis. MT genes are unevenly distributed on chromosomes; almost half of the MT genes were clustered on chromosome 12, which may result from a fragment duplication containing the MT genes on chromosome 12. Five pairs of segmental duplication events and ten pairs of tandem duplication events were found in the rice MT family. The Ka/Ks values of the fifteen duplicated MT genes indicated that the duplicated MT genes were under a strong negative selection during evolution. Next, combining the promoter activity assay with gene expression analysis revealed different expression patterns of MT genes. In addition, the expression of OsMT genes was induced under different stresses, including NaCl, CdCl2, ABA, and MeJ treatments. Additionally, we found that OsMT genes were mainly located in chloroplasts. These results imply that OsMT genes play different roles in response to these stresses. All results provide important insights into the evolution of the MT gene family in the Oryza genus, and will be helpful to further study the function of MT genes.

1. Introduction

Metallothioneins (MTs) are a family of low molecular mass (4–8 kD), cysteine (Cys)-rich proteins that bind metals via thiol groups of cysteine (Cys) residues [1]. MT genes are widespread in prokaryotes, plants, and animals [2]. MTs have a strong affinity for both essential (zinc, copper, selenium) and xenobiotic (cadmium, lead, mercury) metals, binding them through specific Cys-Cys and Cys-Xxx-Cys motifs [3,4,5]. As a result, MTs have various biological functions, including protective effects, resisting metal toxicity, controlling oxidative stress, and regulating physiological homeostasis [6,7,8].
So far, there is increasing evidence that various abiotic stresses can regulate MT gene expression; for example, drought, abscisic acid, salt, environment temperature, and reactive oxygen species [9,10,11,12]. This shows the importance of plant MTs genes in response to abiotic stress. For example, an MT-2 gene (MT2) was upregulated in boron-stressed tomato plants, implying that it may protect against boron stress [13]. In Chloris virgata Swartz (C. virgata), ChlMT1 expression was induced by several abiotic stresses, such as salts (NaCl and NaHCO3), ROS inducer (paraquat), and metals (CuSO4, Z nSO4, and CdCl2). Interestingly, alien ChlMT1 overexpression could significantly improve the tolerance of yeasts to reactive oxygen species and salinity [14]. Similarly, the ectopic expression of OsMT1e-P can increase tolerance toward multiple abiotic stresses in transgenic tobacco; also, transgenic plants could survive and produce viable seeds under salt stress [15].
In many higher plant species, MT genes have been reported to be expressed specifically in different tissues. For example, the expression level of OsMT genes in mature rice plants is extremely high in stems relative to leaf blades, leaf sheaths, endosperm, and roots [16]. METALLOTHIONEIN2b (OsMT2b) is preferentially expressed in immature rice panicles, the scutellum of germinating embryos, and the primordium of lateral roots [2]. In cucumbers, CsMT genes exhibit different tissue expression patterns [17].
Although some MT genes have been characterized in rice [18], Arabidopsis [19], cucumbers [17], tomatoes [20], and soybeans [21], systematic and thorough studies are lacking in plants, especially in the Gramineae species. Most of the MT family remains unclear to date, limiting the depth of understanding of the evolutionary patterns of MTs in Gramineae. Therefore, it would be of important to study their evolution systematically and the possible physiological role of the MT gene family in Gramineae.
For this purpose, here, we identified and systematically characterized the structure, distribution, and evolution of the MT genes in the five Oryza AA genome species, including O. sativa, O. rufipogon, O. nivara, O. glumaepatula, and O. barthii. This will deepen our understanding and facilitate further investigation of the function of MTs in Oryza species.

2. Results

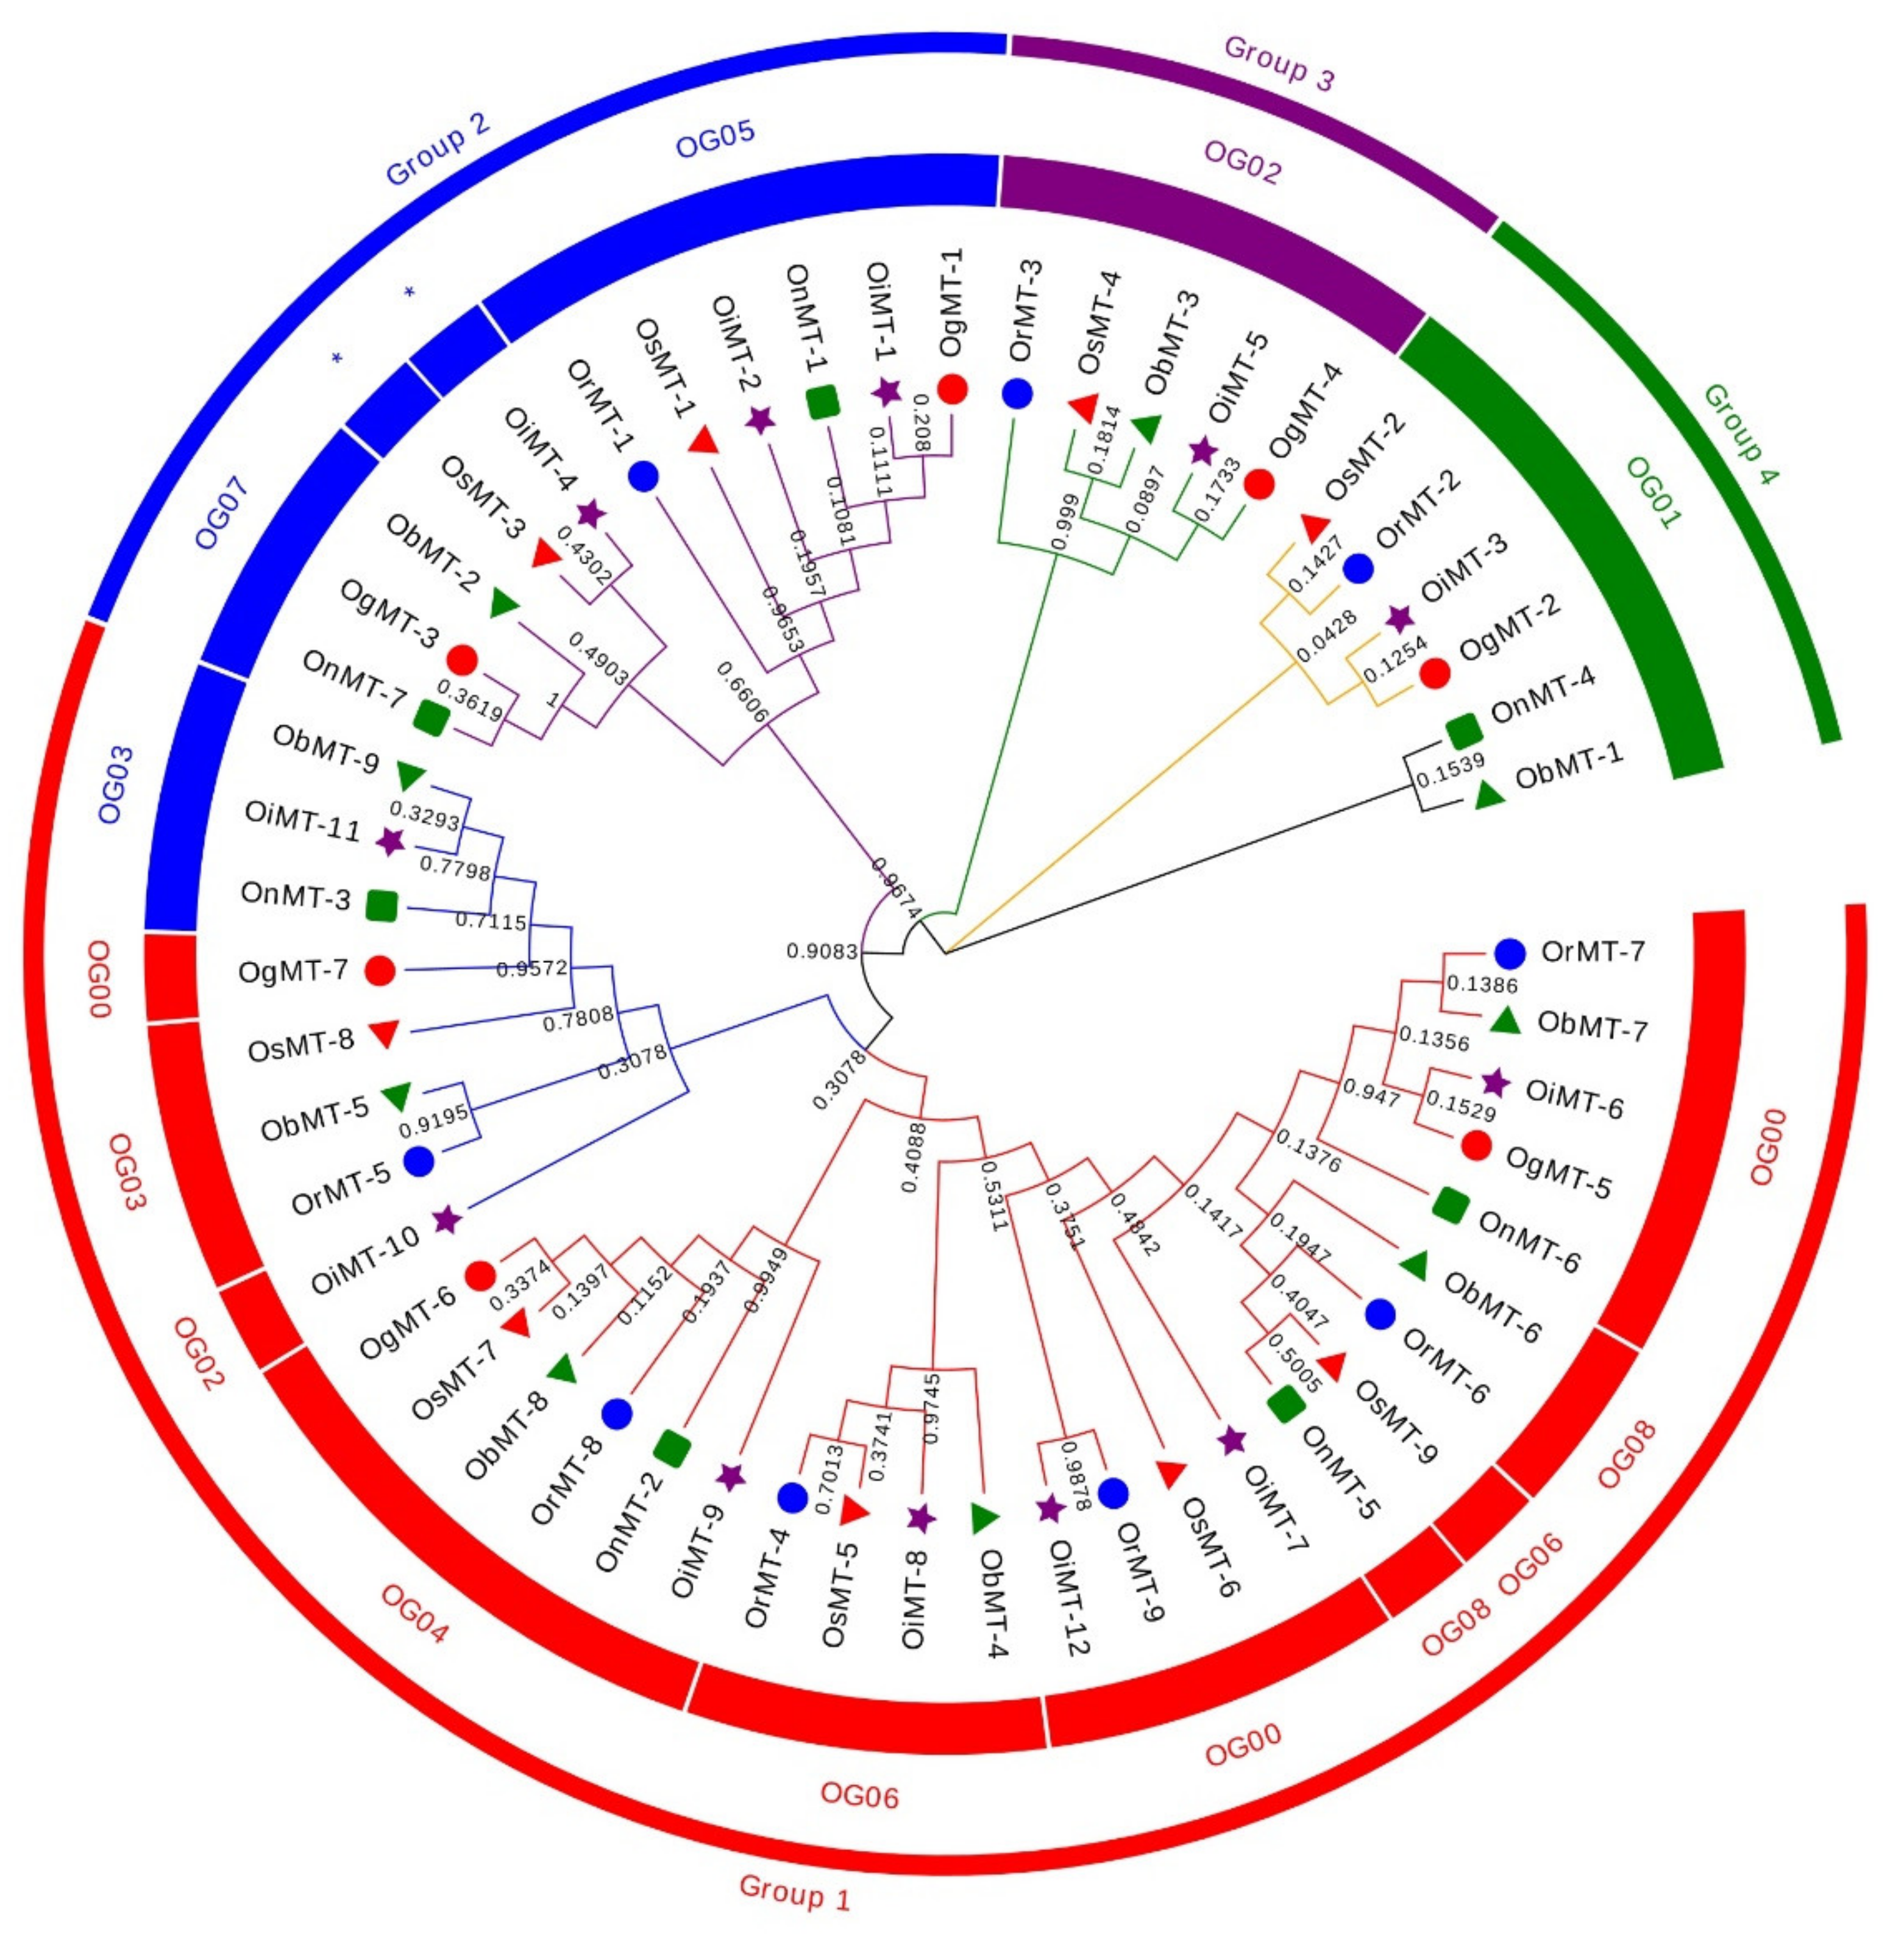
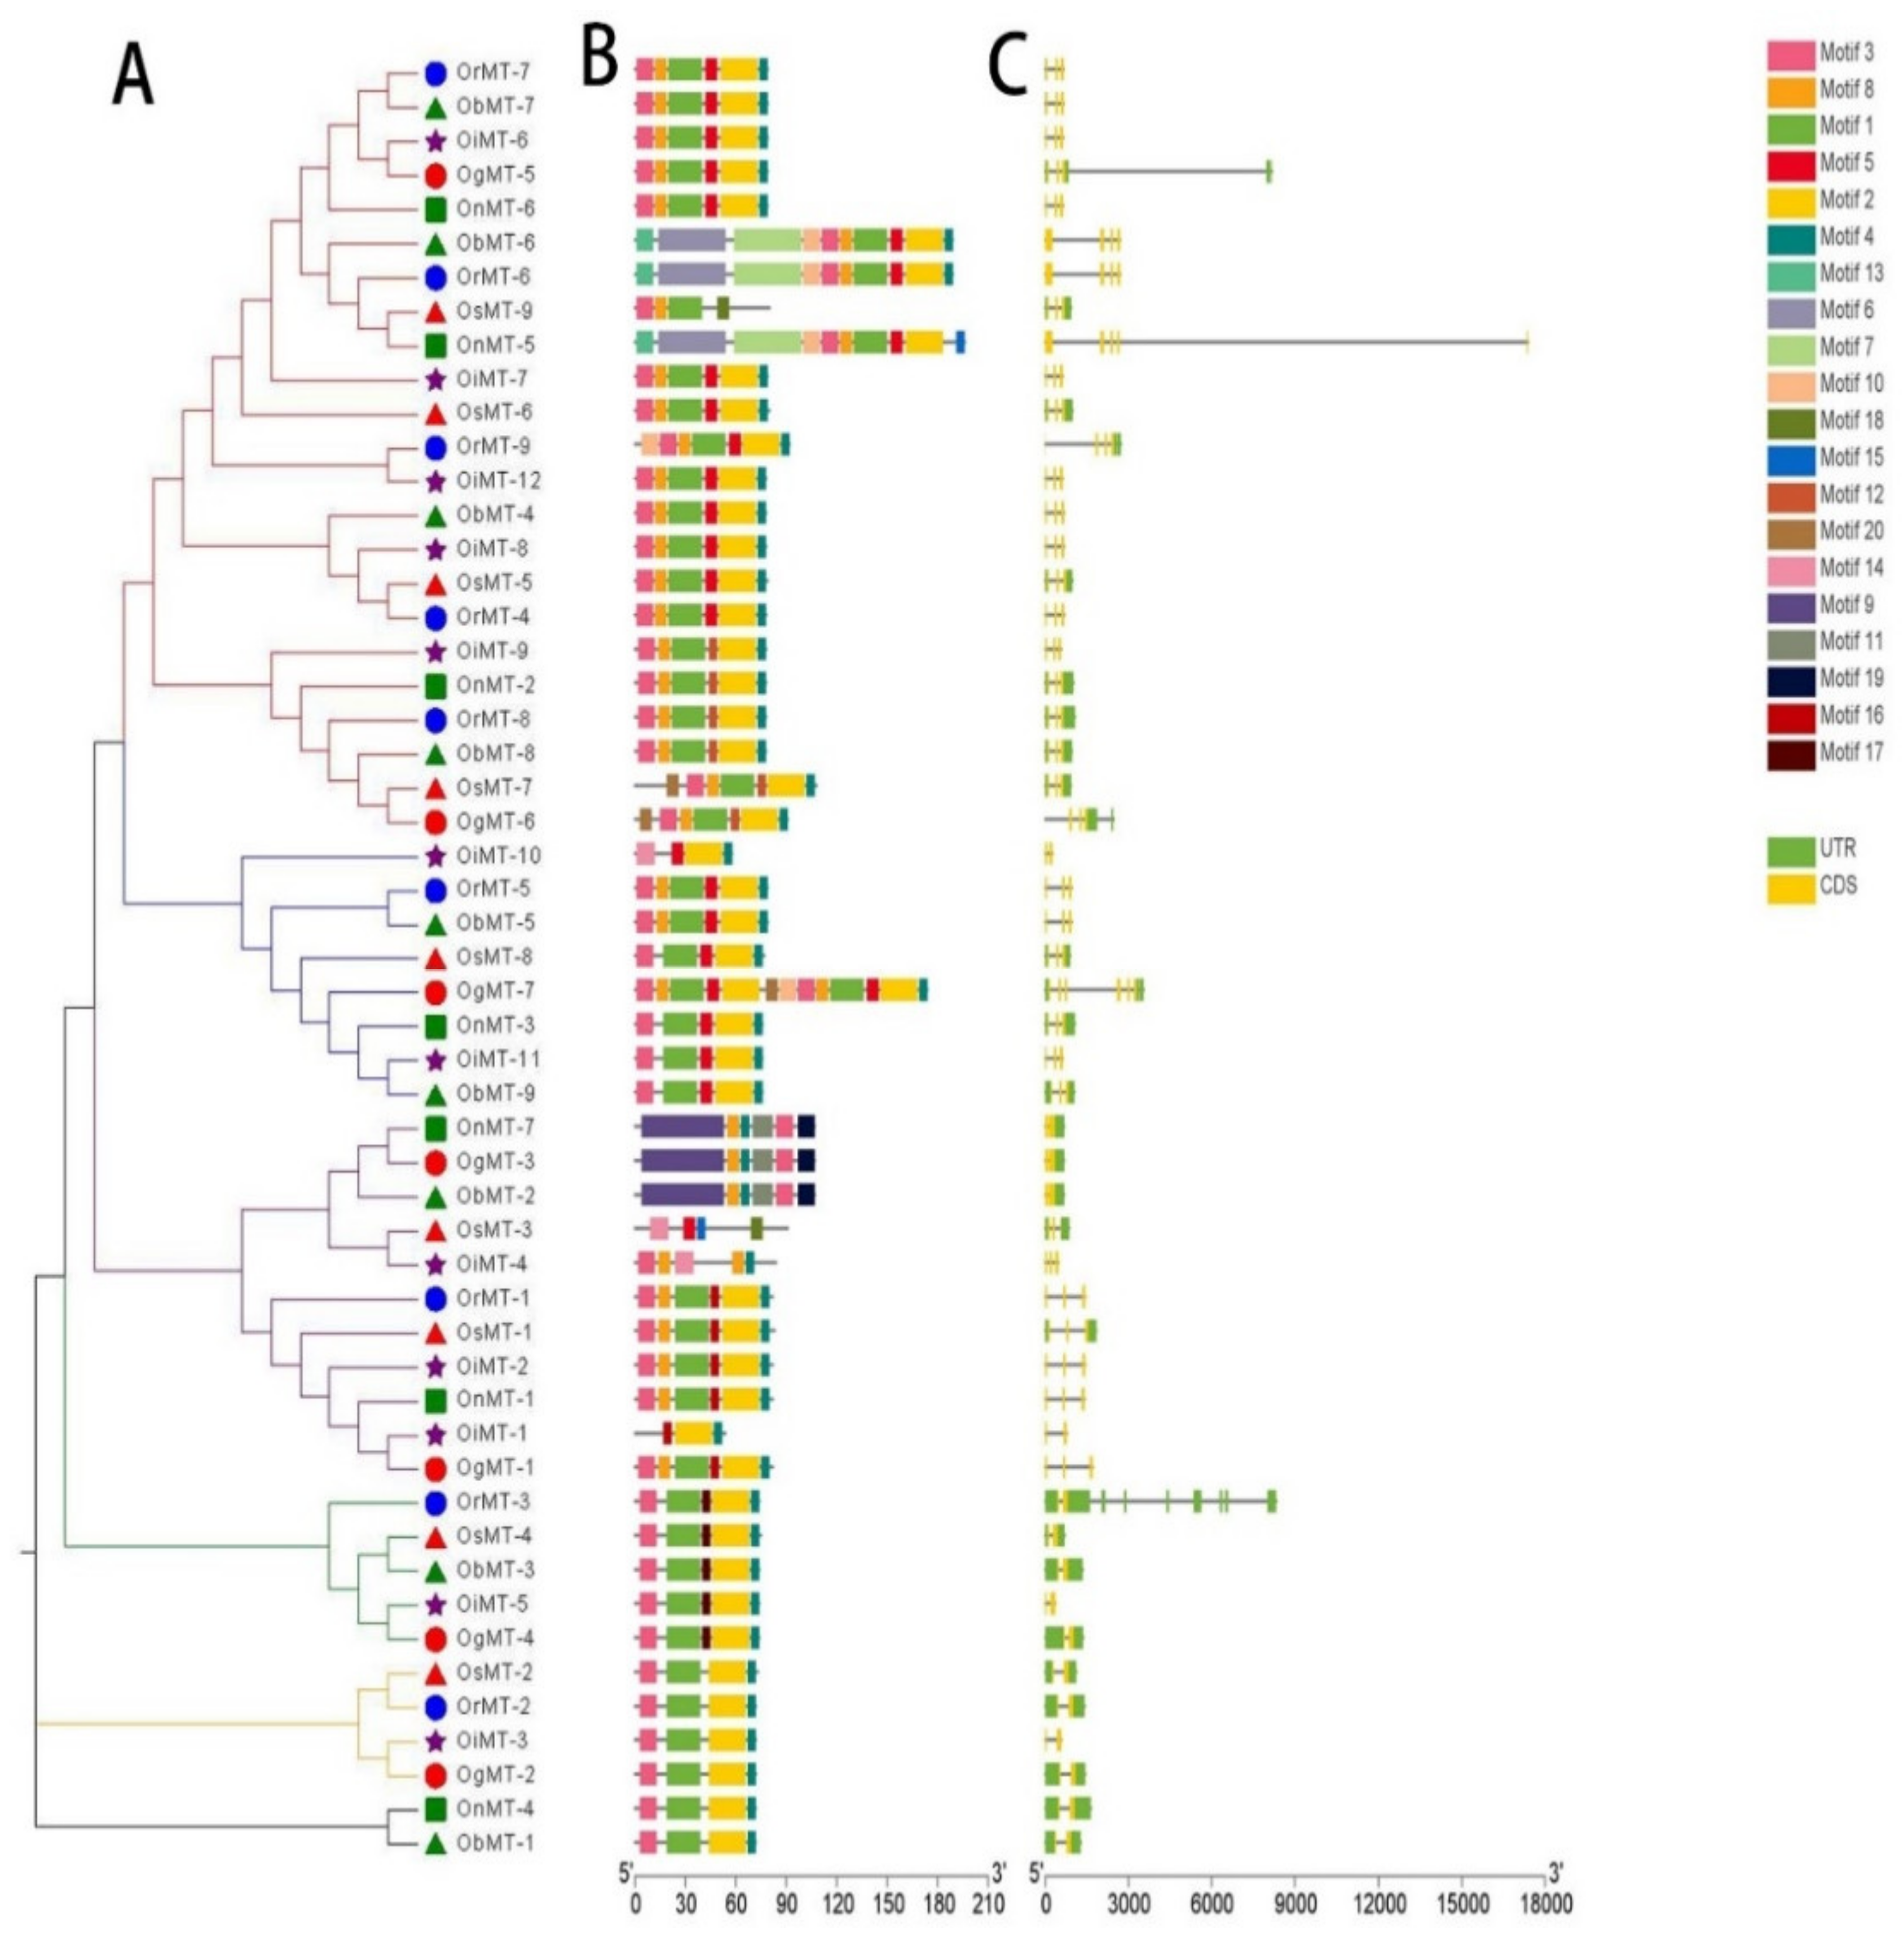
2.1. Identification and Structural Characterization of the MT Genes in the Oryza Genus

The hidden Markov model searching for proteins containing a metallothionein domain (Pfam accession no. PF01439) was downloaded from Pfam (http://pfam.xfam.org/) [22]. There were 9, 9, 12, 7, 7, and 9 MT members identified in O. sativa ssp.japonica, O. rufipogon, O. sativa ssp. indica, O. nivara, O. glumaepatula, and O. barthii, respectively. These genes are mainly dispersed across nine chromosomes, with a bias to Chr 12, where more than half of the genes are located on this chromosome (Supplementary Table S1). The 53 MT genes can be classified into four subfamilies according to the sequence identity. In detail, Chr1, Chr3, and Chr11 had six, six, and five genes, respectively, whereas two genes were found on Chr2, Chr5, and Chr8, and three genes on Chr10 (Supplementary Figure S1). Interestingly, the genes on Chr2, Chr8, and Chr12 were grouped into group 1; the Chr1, Chr5, and Chr10 MT genes belonged to group 2; the MT genes on Chr11 belonged to group 3; and the MT genes on Chr3 belonged to group 4 (Figure 1 and Supplementary Table S1). This characteristic is consistent with the classification of MT genes, reflecting the strict conservation of MT genes among the six Oryza species/subspecies.
The phylogenetic tree of MT genes based on protein sequences from six Oryza species/subspecies is shown in Figure 2A. Furthermore, the MT gene’s structure was characterized in order to acquire more viewpoints into the structural diversity of MT genes in the Oryza species (Figure 2C). Results indicated that the intron number of MT genes in six Oryza species/subspecies ranged from 1 to 8, and the exon number ranged from 2 to 6. A total of 31 MT genes (58.5%) had three exons, followed by the 16 (30.2%), 4 (7.5%), 1 (1.9%), and 1 (1.9%) gene, possessing two, four, five, and six exons, respectively. Further, 20 conserved motifs were identified from the 53 MT proteins using the MEME [23] (Supplementary Table S2), and all 53 MT proteins showed a similar motif arrangement (Figure 2B). Notably, we found that MTs from the same group showed variations in the number and length of exons/introns, suggesting the functional diversification of the MT genes in the same group.

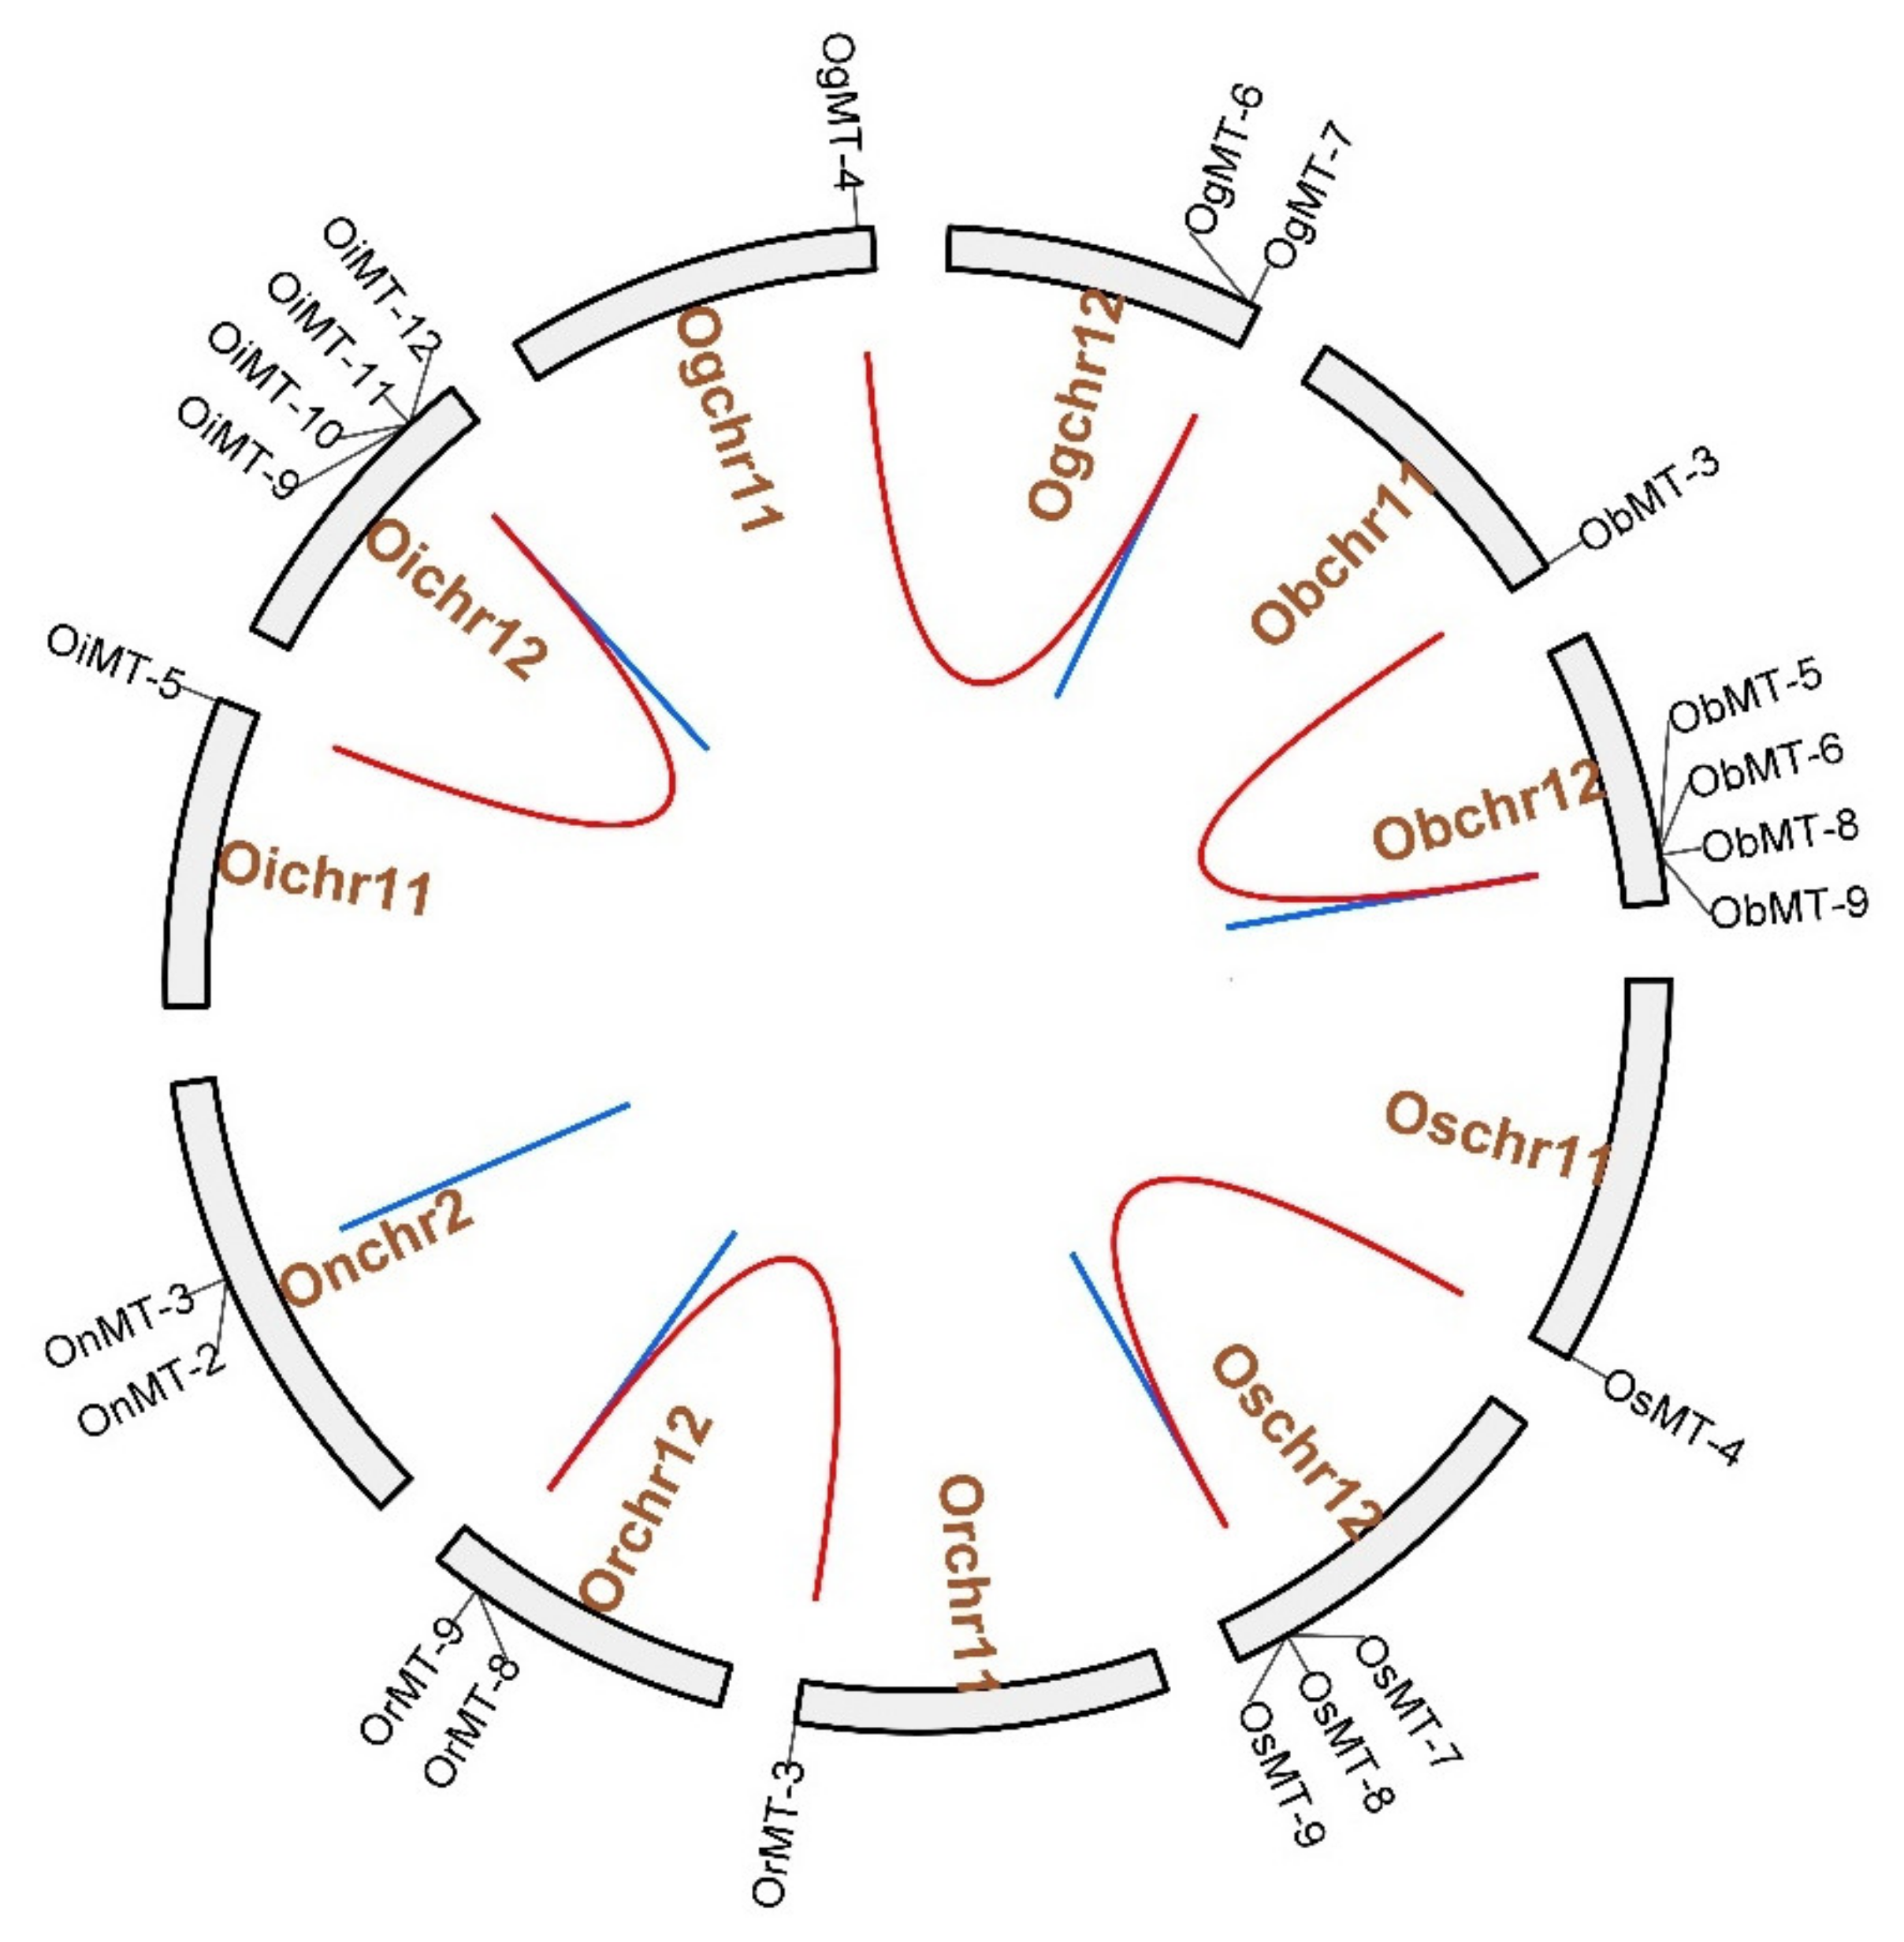
2.2. Chromosomal Distribution, and Evolutionary Characters

The chromosome location results showed that MT genes show an unbalanced distribution pattern, where no MT genes were mapped on Chr4, Chr6, Chr7, and Chr9 (Figure 3 and Supplementary Figure S1). Furthermore, we discovered five pairs of segmental duplication events and ten pairs of tandem duplication events in the six Oryza species/subspecies (Table 1 and Figure 3). Interestingly, segmental duplication events were detected in all species/subspecies except Oryza nivara (Figure 3); moreover, nine pairs of tandem duplication clusters were observed on chromosome 12, reflecting that gene duplication may be the major cause for the expansion of the MT family in the Oryza species. The segmental duplication events of these six gene pairs were estimated to occur between 7.65 and 10.32 Mya (Table 1).
Next, Ka/Ks values of MT duplicate gene pairs were calculated to evaluate the driving force underlying MT gene evolution. The results showed that Ka/Ks values of the 15 duplicated MT genes ranged from 0.1318 to 0.7686, and all Ka/Ks values were less than 1 (Table 1), indicating that the duplicated MT genes were under a strong negative selection during evolution [24].
To better understand the evolutionary relationship of the MT genes in the Oryza genus, the orthogroup clustering was analyzed and a phylogenetic tree was constructed, and showed nine orthogroups in six Oryza genera; namely, eight in O. sativa ssp. japonica, eight in O. rufipogon, seven in O. sativa ssp. indica, eleven in O. nivara, eight in O. glumaepatula, and nine in O. barthii. However, OsMT-3 and OiMT-4 were assigned to the MT family (Supplementary Table S3 and Supplementary Table S4). Furthermore, the gene numbers in each orthogroup were different, ranging from 3 to 10. Orthogroup 0 was the largest, and single-copy orthogroups were found in orthogroups 1 and 4. Besides, we found that the number of orthologs was also different among these species (Table 1). These results showed that the unequal loss and expansion of most orthogroups might have occurred during the domestication process.

2.3. Collinearity Relations of O. sativa ssp. japonica with Other Tested Species

To evaluate the evolutionary relationship of the MT genes within Gramineae, the molecular phylogeny of the MT family was analyzed using the MCScanX toolkit. Referenced to the genome of japonica rice Nipponbare, we found seven, five, nine, six, and seven collinear gene pairs between O. sativa ssp. japonica and O. rufipogon, Oryza nivara, Oryza sativa ssp. indica, Oryza glumaepatula, and Oryza barthii, respectively (Supplementary Figure S2). The MT genes showed a strongly conserved collinearity among the six Oryza species and subspecies, and the collinearity of MT genes between japonica and indica was closer than the other species, supporting their close evolutionary distance.

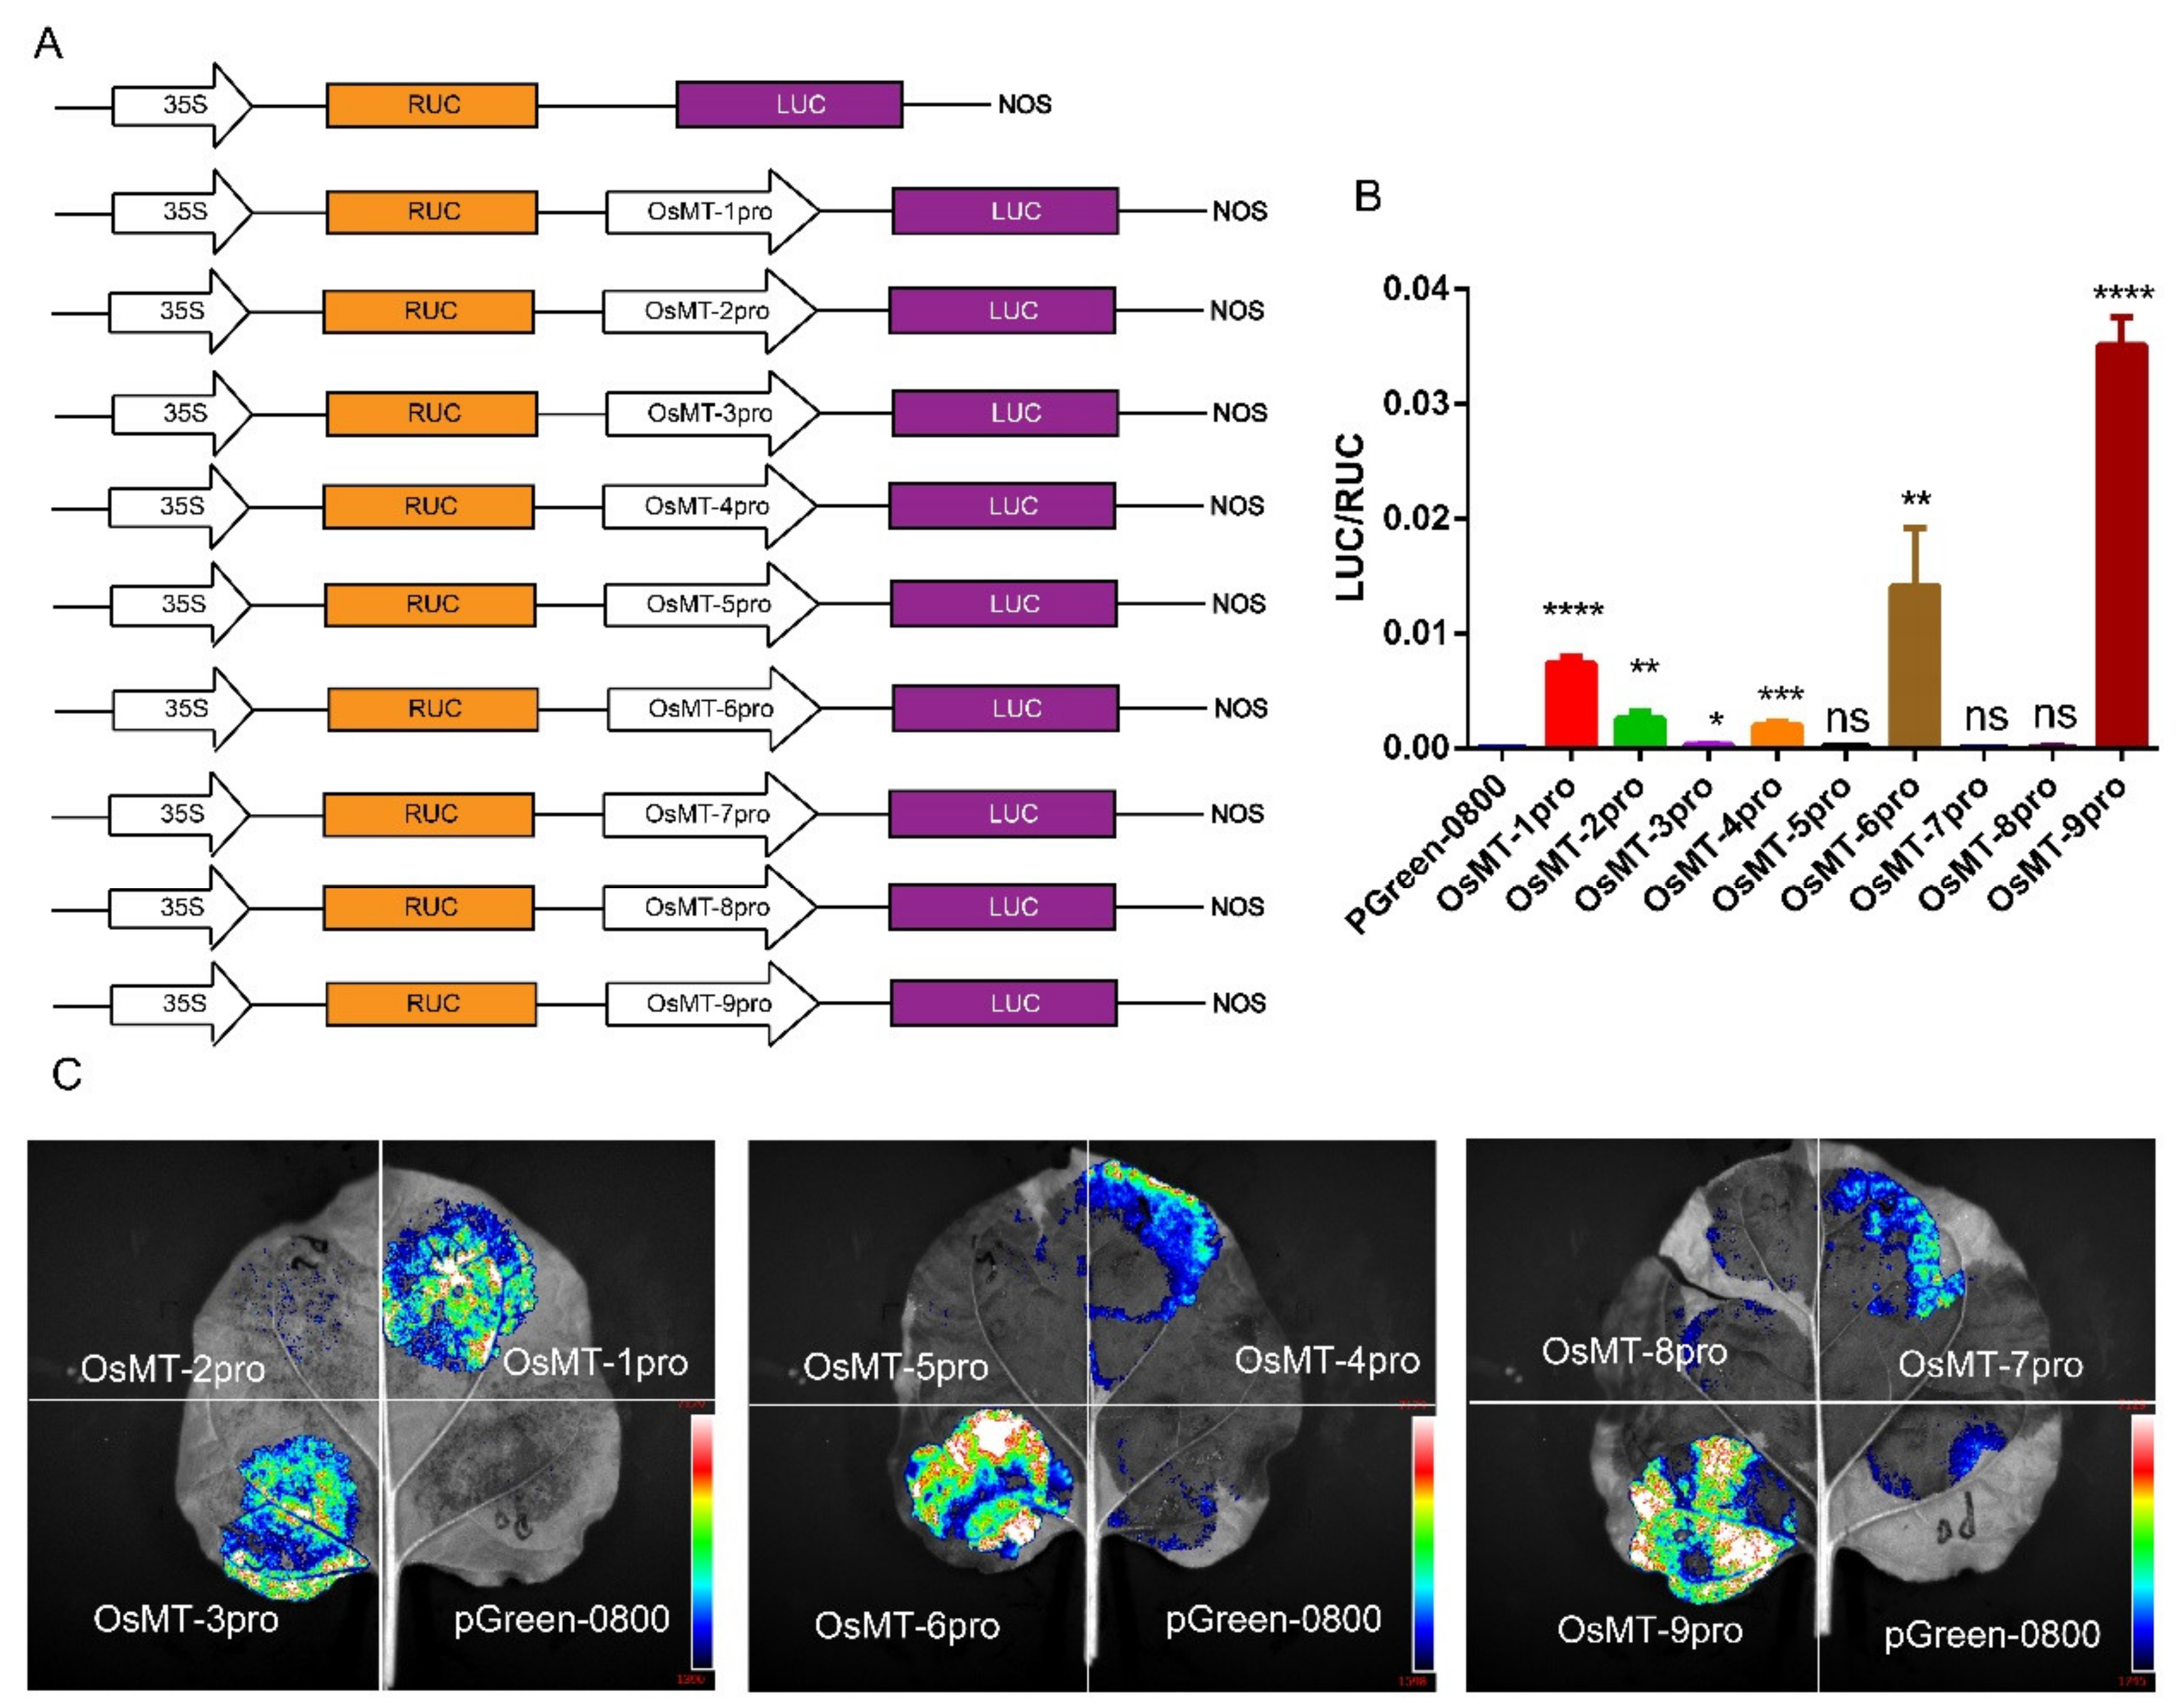
2.4. Promoter Activity and Cis-Elements Identification of OsMT Genes in O. sativa ssp. japonica

Cis-elements in the promoter usually play a vital role in responding to different environments and determining the tissue-specificity of genes [25,26]. Thus, potential cis-regulatory elements in the promoter regions of japonica rice OsMT genes were identified by searching the PlantCARE database [27]. In total, 31 types of cis-regulatory elements were identified (Supplementary Figure S3); they can be primarily classified into three categories based on their functionality: phytohormone response, growth and development, and stress response [28]. The cis-regulatory elements in the growth and development category had a higher percentage than the other two categories (Supplementary Figure S3A,B). In the growth and development category, the light-responsive/responsiveness subcategory had a total of 74 motifs that belonged to 15 types of cis-elements (Supplementary Figure S3A), which indicated that light-responsive/responsiveness is widely present in the promoter region of MT genes. In the phytohormone response category, the MeJA-responsiveness element was the largest subcategory (40), which includes the TGACG- and CGTCA motif, followed by the abscisic acid responsiveness subcategory, including the ABRE cis-element (Supplementary Figure S3A). The top three subcategories in the stress response category were the anaerobic induction, drought-inducibility, and low-temperature responsiveness elements (Supplementary Figure S3A). The marked cis-element related to biological and abiotic stress in the promoters means that OsMT genes are widely involved in the environmental stress response.
Further analysis showed that cis-regulatory elements are unevenly distributed in the OsMT genes, and that some cis-regulatory elements were preferentially present on individual OsMT genes. For example, OsMT-5 and OsMT-8 had many MeJA-responsive cis-regulatory elements, and OsMT-7 had the most auxin regulatory elements (Supplementary Figure S3C), which is the functional specificity for a few of the MT genes.
The functional specificities of plant genes are often reflected by the promoter activities [29]; thus, the promoter activity of the nine OsMT genes in rice was investigated in planta using pGreen-0800 as a control, where the vector constructs are used in the dual-luciferase assay (Figure 4A). Results showed that the OsMT-9 promoter showed the highest LUC/RUC ratio in the protoplast of rice (Figure 4B), the promoter of OsMT-5, OsMT-7, and OsMT-8 showed the weakest activity, and the promoter of OsMT-1, OsMT-3, OsMT-4, OsMT-6, and OsMT-7 showed a higher fluorescence intensity than the control in Nicotiana benthamiana leaves (Figure 4C), reflecting a tissues-specific functional differentiation of the OsMT genes in rice.

2.5. Expression Profiling of OsMT Genes in Rice

The expression profile analysis of a single gene family may provide important clues for the functional differentiation [30]. For this purpose, expression profiles of OsMT genes were assayed in rice. Results showed that almost all of the OsMTs were preferentially expressed in the vegetative tissues, particularly in roots, revealing the functional similarity of OsMT-3 genes in rice (Figure 5). Exceptionally, OsMT-3 was highly expressed in all vegetative and productive tissues, especially in young inflorescence, indicating the functional differentiation of OsMT-3 from the others in rice.

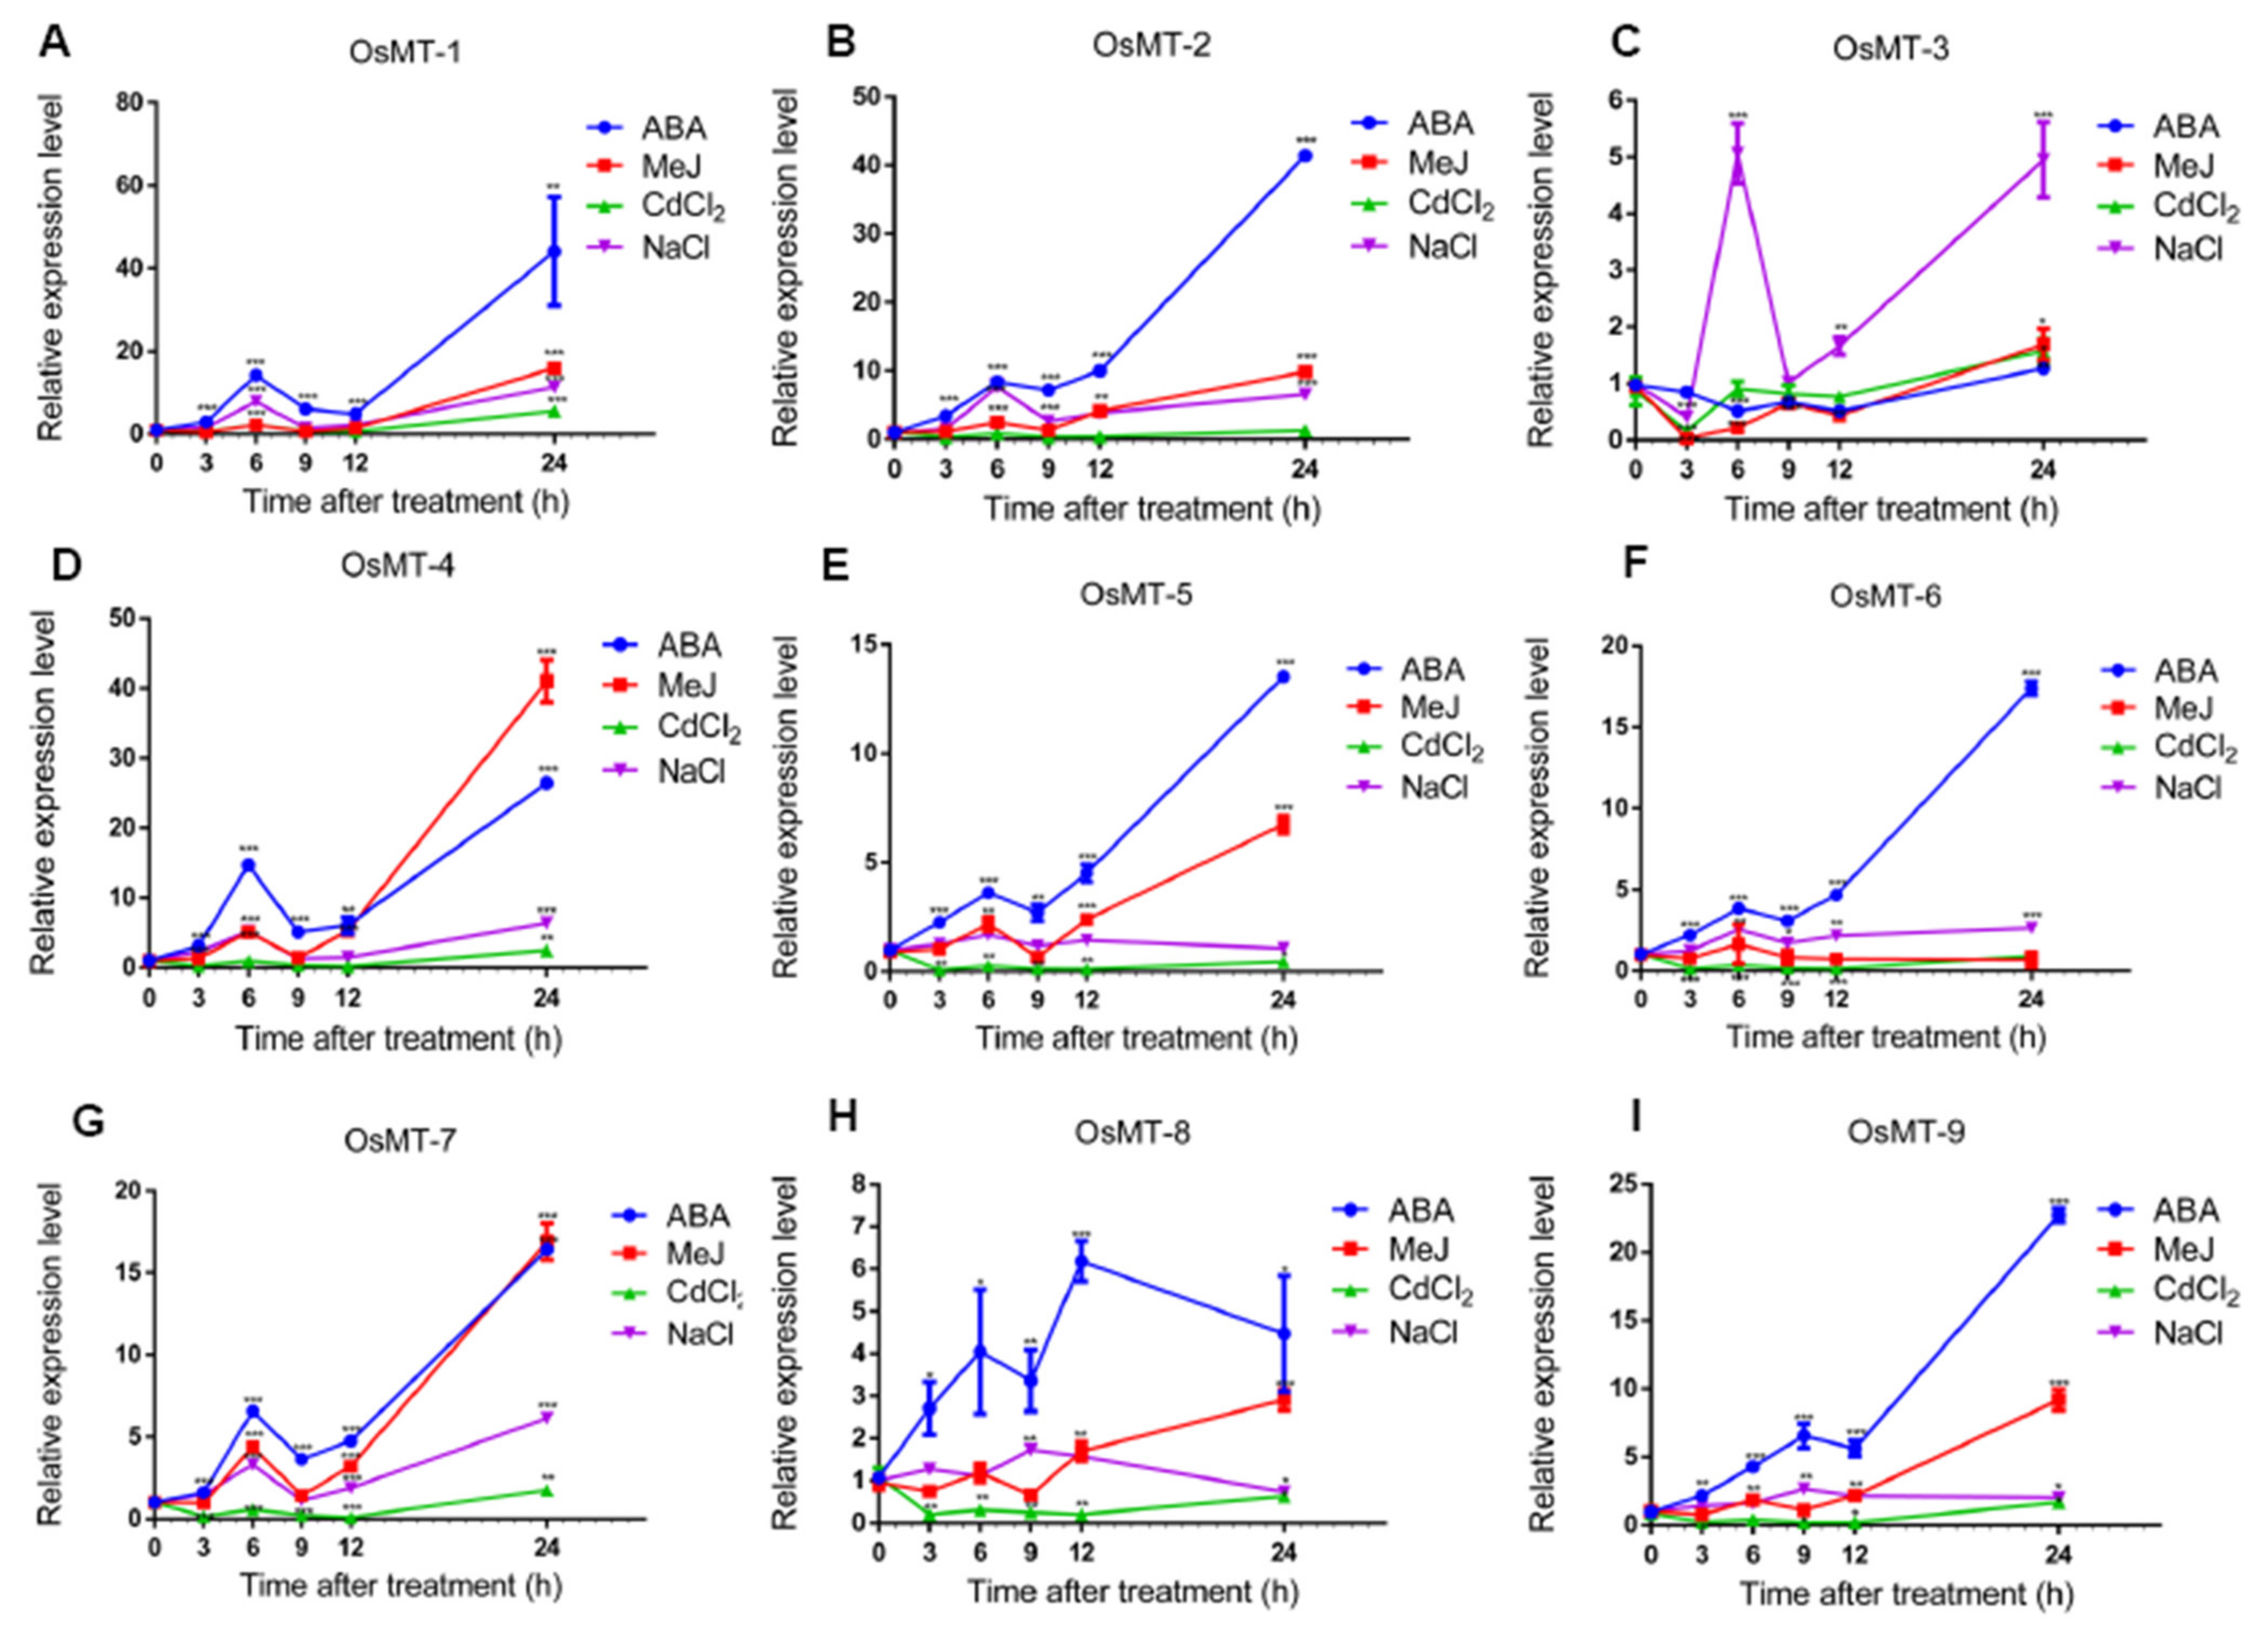
2.6. Expression Patterns of MT Genes in Rice Roots and Shoots under Various Abiotic Stresses

The OsMTs promoter cis-element analysis indicated that MTs promoters harbor an amount of ABA, JA, and SA response-related motifs, meaning that the MT genes in rice may be involved in the stress response. Therefore, we investigated the expression of rice MTs under four chemical treatments, including NaCl, CdCl2, ABA, and MeJ, to mimic environmental stresses. Results showed that all of the OsMT genes in roots had a similar response pattern at a transcriptional level under the four treatments. Apart from OsMT-1 and OsMT-3, which had two apparent expression peaks at 6 h and 24 h after treatment, the other seven OsMT genes all showed a steep increase trend from the 12 h to 24 h after different treatments. Relatively, the OsMT-1 was most sensitive to ABA, OsMT-2 was most sensitive to NaCl and MeJ, OsMT-3 and OsMT-4 was most sensitive to NaCl, OsMT-5 and OsMT-6 was most sensitive to MeJ, and OsMT-7, OsMT-8, and OsMT-9 was most sensitive to CdCl2 (Figure 6), reflecting the functional differentiation among OsMTs to some extent in rice.
In order to compare the difference in expression patterns of the OsMT genes between shoots and roots under abiotic stresses, the expression of OsMT genes in shoots were further investigated under treatments of NaCl, CdCl2, ABA, and MeJ (Figure 7). Results indicated that, with the exception OsMT-8, all of the other OsMT genes in shoots have a similar expressional trend as that in roots under various abiotic stresses; the OsMTs in shoots seem to respond more rapidly than those in roots, but the response intensity of OsMTs in shoots is apparently lighter than that in roots. The OsMTs expression was upregulated at all time points, and the expression accelerated steeply at 12 h under abiotic stresses, implying the consistency of the regulation of OsMTs between roots and shoots in rice under abiotic stresses of NaCl, CdCl2, ABA, and MeJ. Unexpectedly, the expression patterns of OsMT-8 showed a more complicated pattern than the others; the OsMT-8 expression changed in a different and even opposite way under the four chemical treatments. This means that the OsMT-8 expression in shoots is possibly regulated by some factors that are absent in roots.

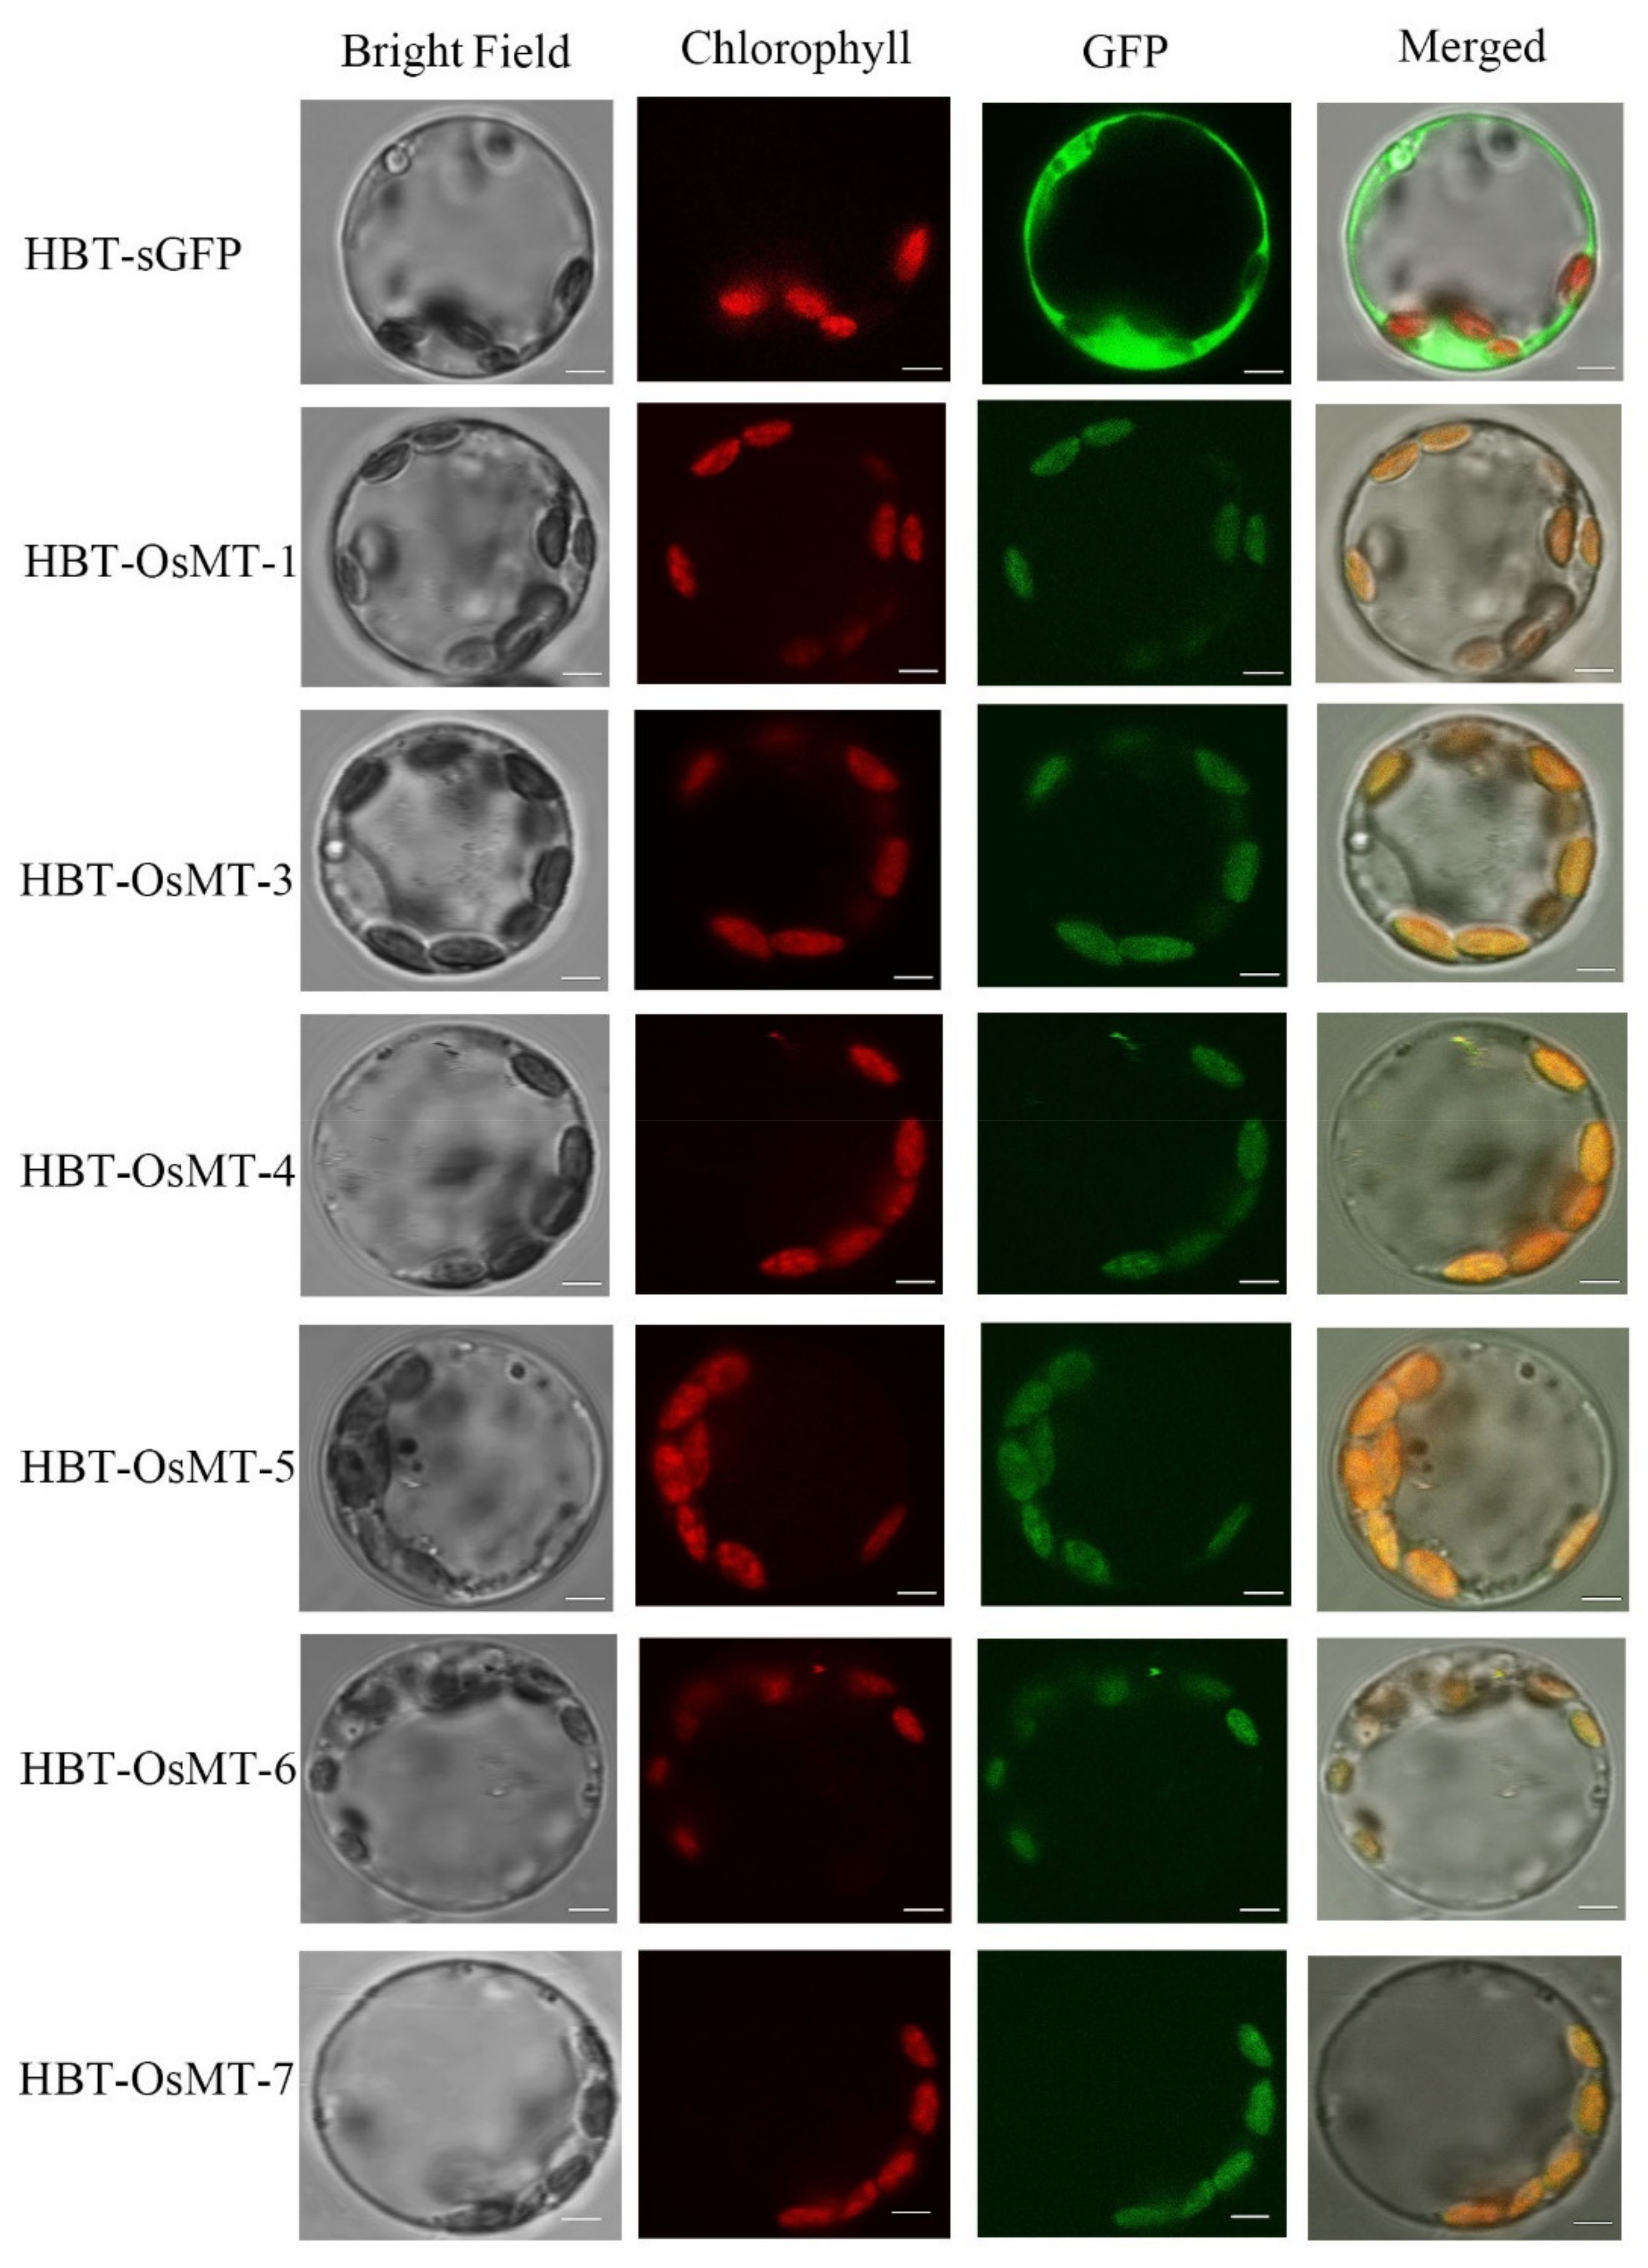
2.7. Subcellular Localization of OsMT Genes

All of the subcellular localizations of the OsMT genes were predicted in the chloroplast using WoLF PSORT (https://wolfpsort.hgc.jp/). OsMT-GFP fusion proteins were transiently expressed in rice protoplasts, except OsMT-2, OsMT-8, and OsMT-9, due to no full-length coding sequence being obtained. Results showed that, unlike the GFP signal of the empty vector mainly detected in the cytoplasm and plasma membrane, the GFP signals of the OsMT-GFP fusion proteins were completely confined to chloroplasts in cells (Figure 8), indicating that these OsMTs are mainly located in and serve a function in chloroplasts.

3. Discussion

With the rapid development of genome sequencing technology, more and more high-quality reference genomes of plants are accessible, which makes the systematic study of the structure and function of MT family genes feasible. In most dicotyledons, the number of MT genes is usually fewer than 20 members, such as Arabidopsis [19], cucumbers [17], tomatoes [20], and soybeans [21], which each have 4, 3, 4, and 9 MT genes. In this study, we found the number of MT genes ranged from seven to twelve in the Oryza AA genome species (Figure 1 and Table 1), and showed a high sequence and structural identity among different species, reflecting the evolutionarily conserved collinear relations of the MT genes in the Oryza AA genome species.
Previous studies have revealed that the expression of metallothionein genes is induced by diverse abiotic stresses and a variety of environmental stimuli in response to plant growth and development [8,9,10,13,15,17,31]. Our results showed that, although the expression profiles have some differences among OsMT genes in rice, and even OsMT-3 shows a tissue-specific expression pattern, they all showed an extremely high expression level in vegetative tissues, particularly in roots and leaves or stems (Figure 5), highlighting their functional specificity related to roots. In agreement with this character is that, when we treated the rice seedling with NaCl and CdCl2, the OsMT genes responded swiftly within 12 h and accumulated greatly in roots and shoots (Figure 6 and Figure 7), revealing the important function of MT genes involved in the resistance of plants to environmental stresses. This is consistent with the previous reports that some MT genes exhibited a higher metal tolerance, particularly for Cd2+ [10,32,33].
Usually, the cis-elements’ response to ABA, JA, and SA in the promoter is the hallmark of a gene involved in abiotic/biotic stress environments, because ABA, JA, and SA are the three central hormones in plants that integrate the critic genes and pathways to respond to the challenge of side environments. Noticeably, in this study, many cis-elements related to stress and hormone responses were detected in the promoter regions of each OsMT gene (Supplementary Table S5), further hinting that MT genes are probably involved in the anti-stress response of plants. Strikingly, when we treated the rice seedling with ABA or MeJ, the rice roots and shoots showed almost completely similar expression patterns as those of rice treated with NaCl and CdCl2 (Figure 6), meaning that the OsMT genes of rice are commonly induced by NaCl, CdCl2, ABA, and MeJ. It is worth mentioning that the OsMT proteins are all located in the chloroplast, which is in agreement with the concept that chloroplasts are organelles for ABA, SA, and MeJ synthesis [34,35,36,37], and are strongly associated with the stress response during plant growth and development [38,39,40].
Gene expansion will help to broaden the function of a gene family so as to better adapt the environment of an organism. Here, fifteen duplication events were detected in the MT family of six Oryza species/subspecies, including five pairs of segmental duplication events and ten pairs of tandem duplication events (Figure 3). Interestingly, O. sativa ssp. indica has the most duplication events (Table 1). As we know, the indica rice has been planted widely in various environments in the five continents, which are Asia, Europe, Africa, Australia, and America, meaning that it received a stronger selection than the other four Oryza species and japonica subspecies in the last thousand years. The MT family is tightly related to environment stress response. We deduce that a strong human selection may promote the expansion and accumulation of the MT family so as to well adapt to various environments around the world [30].

4. Conclusions

This study identified 53 MT genes from six Oryza species/subspecies, including O. sativa ssp. japonica, O. rufipogon, O. sativa ssp. indica, O. nivara, O. glumaepatula, and O. barthii. The Ka/Ks values of the fifteen duplicated MT genes indicated that the MT genes were under a strong negative selection. Duplication led to various expression patterns and the functional differentiation of the MT genes, so as to adapt different environment stresses, as shown in the treatments of NaCl, CdCl2, ABA, and MeJ in rice. Conclusively, this work partly uncovers the potential roles of OsMT genes that are played in response to environment stresses, which may provide a reference for the functional analysis of the MT genes in the other Gramineae species in the future.

5. Materials and Methods

5.1. Identification and Phylogenetic Tree Construction of MT Genes

To identify MT genes in Oryza genus, the whole-genome data of six representative Oryza species: O. barthii, O. indica, O. glumipatula, O.nivara, O. rufipogon, and O. sativa japonica, were downloaded from Ensembl Plants release 41 [41] and Phytozome v.12 [42]. In addition, PF01439 was downloaded from Pfam (http://pfam.xfam.org/, accessed on 10 December 2020). Furthermore, all candidate proteins were separately identified by HMMER v.3.2.1 [43] and BLASTP [44]. Finally, SMART (http://smart.embl-heidelberg.de, accessed on 10 December 2020) and Pfam (http://pfam.xfam.org/search/sequence, accessed on 10 December 2020) were used to verify these sequences [45,46].
Multiple sequence alignment of full-length MT protein sequences was performed by ClustalW [47], and an unrooted phylogenetic relationship was constructed using MEGA7 [48] using the neighbor-joining (NJ) method with the Jones–Taylor–Thornton (JTT) model based on 1000 bootstrap replicates.

5.2. Gene Structure, Conserved Motifs, and Phylogenetic Analysis

Exon/intron site and length data were extracted based on six respective genome annotation GFF files from Ensembl Plants [41]. The software MEME Suite v.5.3.3 [23] was used to identify conserved motifs with a maximum number of 20. The phylogenetic tree was drawn by EvolView v.3 [49], and exon/intron structures were shown using TBtools v.1.0971 proportionally [50].

5.3. Chromosomal Locations, Gene Duplication Analysis, and Orthogroup Analysis

The collinearity relationships were obtained using BLAST search with default parameters and generated using a procedure in ColinearScan using the MCScanX toolkit [51]. All Oryza MT genes were classified into various types of duplications. First, a schematic of the putative duplications of the MT genes was constructed using the Circos software [52]. Then, the putative WGDs/segmental duplications of MT genes were connected by links. Finally, the synonymous (Ks) and nonsynonymous (Ka) substitution rates were estimated using DnaSP v.6.0 (http://www.ub.edu/dnasp/) [53]. The divergence time (T) was estimated by T = Ks/(2 × 9.1 × 10−9) × 10−6 million years ago (MYa) [46].
The orthogroup was identified using OrthoFinder v.2.5.4 with a cut-off e-value of 1 × 10⁻³ [54]. Then, STAG and STRID algorithms were used to rebuild the phylogenetic tree of the selected species based on the detected orthogroup.

5.4. Quantitative RT-PCR (qRT-PCR) Analysis of MT Genes in O. sativa japonica

All RNA extraction and reverse transcription were performed by TRIzol Reagent (Invitrogen, Carlsbad, CA, USA) according to the manual. First-strand cDNA was synthesized from 2 µg DNase-treated RNA using HiScript III 1st Strand cDNA Synthesis Kit (+gDNA wiper) (Vazyme, Nanjing, China). Hieff qPCR SYBR Green Master Mix (No Rox) (Yeasen, Shanghai, China) was used for the qRT-PCR. The actin gene was used as an internal control. The relative expression levels of MST genes were calculated using the 2−∆∆CT method (Supplementary Table S6).

5.5. Plant Material and Treatments

The rice cultivar ZH11 (O. sativa japonica) was used in this study for expression analysis of MT genes under different biological stresses, including NaCl, CdCl2, ABA, and MeJ treatments at different time points. All seedlings were grown in a growth chamber with the climatic conditions set at 28 °C, 14 h light, and 10 h dark, with 60% relative humidity for 12 d.
For different biological stress treatments, the roots of 12-day-old seedlings were washed, followed by immediate transfer into abscisic acid solution (ABA, 100 µM), methyl jasmonate solution (MeJ, 100 µM), CdCl2 (200 µM), and NaCl solution (200 mM), respectively. Roots and shoots were sampled at 0, 3, 6, 9, 12, and 24 h during the light period after applying treatments. Three biological replicates were produced for every treatment, collected from 12 seedlings, and pooled together. The samples were immediately frozen with liquid nitrogen and stored at −80 °C for further use.

5.6. Subcellular Localization of OsMT Genes

The full-length coding sequences of OsMT were amplificated using gene-specific primers and then inserted behind the cauliflower mosaic virus CaMV 35S promoter into the HBT-GFP vector to produce a structure that is 35S: OsMT: GFP fusion vector. OsMT-GFP fusion proteins were transiently expressed in rice protoplasts. The empty HBT vector was used as a control. Protoplasts were prepared using the rice seedlings of ZH11 plants. Briefly, for the protoplast transformation, 20 µL OsMT:GFP was mixed with 200 µL protoplasts and 240 µL PEG solution (40% PEG4000, 0.6-M mannitol, and 100-mM CaCl2) for 15 min. After washing twice with W5 solution (154 mM NaCl, 125 mM CaCl2, 5 mM KCl, 5 mM glucose, 2 mM MES, pH 5.7 by KOH), the protoplasts were cultured at 28 °C overnight. The protoplasts were observed for GFP and RFP signals using the FV1000 confocal system. The primers used for subcellular localization are listed in Supplementary Table S7.

5.7. Dual-Luciferase Assays

To investigate the promoter of OsMT genes, the promoter sequence of OsMT genes was amplified by PCR from the ZH11 genomic DNA and constructed into pGreenII 0800-LUC reporter vectors in front of the luciferase (LUC) gene. Besides, the renilla luciferase (REN) reporter gene was driven by the CaMV 35S promoter as a control in each transformation. The different reporters were transformed into rice protoplasts according to a previous method [55]. The luciferase activities were measured using the Dual-Luciferase Reporter Assay System (Promega, Madison, WI, USA) and compared with empty vector pGreenII 0800-LUC. The relative luciferase activity was calculated by the ratio of firefly luciferase and renilla luciferase (fLUC/rLUC). Using GV3101(pSoup-p19) Agrobacterium-mediated transformation, the reporter was injected into 30-day N. benthamiana leaves. The injected N. benthamiana was grown in a greenhouse for three days. Finally, luciferin was injected into the leaves to test luciferase intensity in Tianeng 4800 automatic chemiluminescence image analysis system. The primers used for dual-luciferase assays are listed in Supplementary Table S8.

Supplementary Materials

The following are available online at www.mdpi.com/article/10.3390/ijms22179651/s1.

Author Contributions

M.C. and H.Y. designed this experiment. M.C. and H.Y. carried out the bioinformatic analyses. R.W. performed subcellular localization and partial quantitative PCR experiments. J.Z., T.L., and F.Y. participated in carrying out some experiments. M.C., H.Y., and S.L. wrote the manuscript. All authors have read and agreed to the published version of the manuscript.

Funding

This study was funded by the National Natural Science Foundation of China (U20A2023 and 31870322), the Creative Research Groups of the Natural Science Foundation of Hubei Province (2020CFA009), and Huanghe Patent Project of Wuhan City.

Institutional Review Board Statement

Not Applicable.

Informed Consent Statement

Not Applicable.

Data Availability Statement

Data is contained in Supplementary Materials.

Acknowledgments

This work was supported by the funds from the National Natural Science Foundation of China (U20A2023 and 31870322), the Creative Research Groups of the Natural Science Foundation of Hubei Province (2020CFA009), and Huanghe Patent Project of Wuhan City.

Conflicts of Interest

The authors declare no conflict of interest.

Abbreviations

MTMetallothionein
OsOryza sativa ssp. japonica.
OrOryza rufipogon.
OnOryza nivara.
OiOryza sativa ssp. indica.
OgOryza glumaepatula.
ObOryza barthii.
ABAAbscisic acid
MeJMethyl Jasmonate
qRT-PCRQuantitative real-time PCR

References

  1. Cobbett, C.; Goldsbrough, P. Phytochelatins and metallothioneins: Roles in heavy metal detoxification and homeostasis. Ann. Rev. Plant. Biol. 2002, 53, 159–182. [Google Scholar] [CrossRef] [Green Version]
  2. Yuan, J.; Chen, D.; Ren, Y.; Zhang, X.; Zhao, J. Characteristic and expression analysis of a metallothionein gene, OsMT2b, down-regulated by cytokinin suggests functions in root development and seed embryo germination of rice. Plant. Physiol. 2008, 146, 1637–1650. [Google Scholar] [CrossRef] [Green Version]
  3. Ragusa, M.A.; Nicosia, A.; Costa, S.; Cuttitta, A.; Gianguzza, F. Metallothionein Gene Family in the Sea Urchin paracentrotus lividus: Gene Structure, Differential Expression and Phylogenetic Analysis. Int. J. Mol. Sci. 2017, 18, 812. [Google Scholar] [CrossRef] [PubMed] [Green Version]
  4. Macirella, R.; Guardia, A.; Pellegrino, D.; Bernabo, I.; Tronci, V.; Ebbesson, L.O.; Sesti, S.; Tripepi, S.; Brunelli, E. Effects of Two Sublethal Concentrations of Mercury Chloride on the Morphology and Metallothionein Activity in the Liver of Zebrafish (Danio rerio). Int. J. Mol. Sci. 2016, 17, 361. [Google Scholar] [CrossRef] [PubMed] [Green Version]
  5. Huang, Y.Y.; Gong, F.Y.; Shen, C.; He, C.T.; Fu, H.L.; Wang, X.S.; Tan, X.; Xu, P.L.; Yang, Z.Y. Cloning, characterization and expression analysis of metallothioneins from Ipomoea aquatica and their cultivar-dependent roles in Cd accumulation and detoxification. Ecotoxicol. Environ. Saf. 2018, 165, 450–458. [Google Scholar] [CrossRef]
  6. Kumari, M.V.; Hiramatsu, M.; Ebadi, M. Free radical scavenging actions of metallothionein isoforms I and II. Free Radic. Res. 1998, 29, 93–101. [Google Scholar] [CrossRef] [PubMed]
  7. Yang, M.; Chitambar, C.R. Role of oxidative stress in the induction of metallothionein-2A and heme oxygenase-1 gene expression by the antineoplastic agent gallium nitrate in human lymphoma cells. Free Radic. Biol. Med. 2008, 45, 763–772. [Google Scholar] [CrossRef] [Green Version]
  8. Ling, X.B.; Wei, H.W.; Wang, J.; Kong, Y.Q.; Wu, Y.Y.; Guo, J.L.; Li, T.F.; Li, J.K. Mammalian Metallothionein-2A and Oxidative Stress. Int. J. Mol. Sci. 2016, 17, 1483. [Google Scholar] [CrossRef]
  9. Kim, S.H.; Jeong, J.C.; Ahn, Y.O.; Lee, H.S.; Kwak, S.S. Differential responses of three sweetpotato metallothionein genes to abiotic stress and heavy metals. Mol. Biol. Rep. 2014, 41, 6957–6966. [Google Scholar] [CrossRef] [PubMed]
  10. Yang, M.; Zhang, F.; Wang, F.; Dong, Z.; Cao, Q.; Chen, M. Characterization of a Type 1 Metallothionein Gene from the Stresses-Tolerant Plant Ziziphus jujuba. Int. J. Mol. Sci. 2015, 16, 16750–16762. [Google Scholar] [CrossRef] [PubMed] [Green Version]
  11. Gill, S.S.; Tuteja, N. Reactive oxygen species and antioxidant machinery in abiotic stress tolerance in crop plants. Plant. Physiol. Biochem. 2010, 48, 909–930. [Google Scholar] [CrossRef]
  12. Huang, Y.; Fang, Y.; Long, X.; Liu, L.; Wang, J.; Zhu, J.; Ma, Y.; Qin, Y.; Qi, J.; Hu, X.; et al. Characterization of the rubber tree metallothionein family reveals a role in mitigating the effects of reactive oxygen species associated with physiological stress. Tree Physiol. 2018, 38, 911–924. [Google Scholar] [CrossRef] [PubMed]
  13. Tombuloglu, H.; Semizoglu, N.; Sakcali, S.; Kekec, G. Boron induced expression of some stress-related genes in tomato. Chemosphere 2012, 86, 433–438. [Google Scholar] [CrossRef] [PubMed]
  14. Nishiuchi, S.; Liu, S.; Takano, T. Isolation and characterization of a metallothionein-1 protein in Chloris virgata Swartz that enhances stress tolerances to oxidative, salinity and carbonate stress in Saccharomyces cerevisiae. Biotechnol. Lett. 2007, 29, 1301–1305. [Google Scholar] [CrossRef]
  15. Kumar, G.; Kushwaha, H.R.; Panjabi-Sabharwal, V.; Kumari, S.; Joshi, R.; Karan, R.; Mittal, S.; Pareek, S.L.S.; Pareek, A. Clustered metallothionein genes are co-regulated in rice and ectopic expression of OsMT1e-P confers multiple abiotic stress tolerance in tobacco via ROS scavenging. BMC Plant. Biol. 2012, 12, 1–16. [Google Scholar] [CrossRef] [PubMed] [Green Version]
  16. Yu, L.-H.; Umeda, M.; Liu, J.-Y.; Zhao, N.-M.; Uchimiya, H. A novel MT gene of rice plants is strongly expressed in the node portion of the stem. Gene 1998, 206, 29–35. [Google Scholar] [CrossRef]
  17. Zhou, Y.; Liu, J.; Liu, S.; Jiang, L.; Hu, L. Identification of the metallothionein gene family from cucumber and functional characterization of CsMT4 in Escherichia coli under salinity and osmotic stress. 3 Biotech 2019, 9, 394. [Google Scholar] [CrossRef]
  18. Zhou, G.; Xu, Y.; Li, J.; Yang, L.; Liu, J.-Y. Molecular analyses of the metallothionein gene family in rice (Oryza sativa L.). J. Biochem. Mol. Biol. 2006, 39, 595–606. [Google Scholar] [CrossRef] [Green Version]
  19. Zhou, J.; Goldsbrough, P. Structure, organization and expression of the metallothionein gene family in Arabidopsis. Molecular & general genetics. MGG 1995, 248, 318–328. [Google Scholar]
  20. Kisa, D.; Ozturk, L.; Doker, S.; Gokce, I. Expression analysis of metallothioneins and mineral contents in tomato (Lycopersicon esculentum) under heavy metal stress. J. Sci. Food Agric. 2017, 97, 1916–1923. [Google Scholar] [CrossRef]
  21. Pagani, M.A.; Tomas, M.; Carrillo, J.; Bofill, R.; Capdevila, M.; Atrian, S.; Andreo, C.S. The response of the different soybean metallothionein isoforms to cadmium intoxication. J. Inorg. Biochem. 2012, 117, 306–315. [Google Scholar] [CrossRef]
  22. Mistry, J.; Chuguransky, S.; Williams, L.; Qureshi, M.; Salazar, G.A.; Sonnhammer, E.L.L.; Tosatto, S.C.E.; Paladin, L.; Raj, S.; Richardson, L.J.; et al. Pfam: The protein families database in 2021. Nucleic Acids Res. 2021, 49, D412–D419. [Google Scholar] [CrossRef]
  23. Bailey, T.L.; Boden, M.; Buske, F.A.; Frith, M.; Grant, C.E.; Clementi, L.; Ren, J.; Li, W.W.; Noble, W.S. MEME SUITE: Tools for motif discovery and searching. Nucleic Acids Res. 2009, 37, W202–W208. [Google Scholar] [CrossRef] [PubMed]
  24. Kong, W.; Zhong, H.; Deng, X.; Gautam, M.; Gong, Z.; Zhang, Y.; Zhao, G.; Liu, C.; Li, Y. Evolutionary Analysis of GH3 Genes in Six Oryza Species/Subspecies and Their Expression under Salinity Stress in Oryza sativa ssp. japonica. Plants 2019, 8, 30. [Google Scholar] [CrossRef] [PubMed] [Green Version]
  25. Walther, D.; Brunnemann, R.; Selbig, J. The regulatory code for transcriptional response diversity and its relation to genome structural properties in A. thaliana. PLoS Genet. 2007, 3, e11. [Google Scholar] [CrossRef]
  26. Wang, J.; Zhou, L.; Shi, H.; Chern, M.; Yu, H.; Yi, H.; He, M.; Yin, J.; Zhu, X.; Li, Y.; et al. A single transcription factor promotes both yield and immunity in rice. Science 2018, 361, 1026–1028. [Google Scholar]
  27. Lescot, M.D.P.; Thijs, G.; Marchal, K.; Moreau, Y.; Van de Peer, Y.; Rouzé, P.; Rombauts, S. PlantCARE, a database of plant cis-acting regulatory elements and a portal to tools for in silico analysis of promoter sequences. Nucleic Acids Res. 2002, 30, 325–327. [Google Scholar] [CrossRef] [PubMed]
  28. Abdullah, M.; Cao, Y.; Cheng, X.; Meng, D.; Chen, Y.; Shakoor, A.; Gao, J.; Cai, Y. The Sucrose Synthase Gene Family in Chinese Pear (Pyrus bretschneideri Rehd.): Structure, Expression, and Evolution. Molecules 2018, 23, 1144. [Google Scholar] [CrossRef] [PubMed] [Green Version]
  29. Liu, C.L.; Gao, Z.Y.; Shang, L.G.; Yang, C.H.; Ruan, B.P.; Zeng, D.L.; Guo, L.B.; Zhao, F.J.; Huang, C.F.; Qian, Q. Natural variation in the promoter of OsHMA3 contributes to differential grain cadmium accumulation between indica and japonica rice. J. Integr. Plant. Biol. 2020, 62, 314–329. [Google Scholar] [CrossRef] [PubMed] [Green Version]
  30. Deng, X.; An, B.; Zhong, H.; Yang, J.; Kong, W.; Li, Y. A Novel Insight into Functional Divergence of the MST Gene Family in Rice Based on Comprehensive Expression Patterns. Genes 2019, 10, 3. [Google Scholar] [CrossRef] [PubMed] [Green Version]
  31. Duan, L.; Kong, J.J.; Wang, T.Q.; Sun, Y. Binding of Cd (II), Pb (II), and Zn (II) to a type 1 metallothionein from maize (Zea mays). Biometals 2018, 31, 539–550. [Google Scholar] [CrossRef]
  32. Pan, Y.; Zhu, M.; Wang, S.; Ma, G.; Huang, X.; Qiao, C.; Wang, R.; Xu, X.; Liang, Y.; Lu, K.; et al. Genome-Wide Characterization and Analysis of Metallothionein Family Genes That Function in Metal Stress Tolerance in Brassica napus L. Int. J. Mol. Sci. 2018, 19, 2181. [Google Scholar] [CrossRef] [Green Version]
  33. Xu, X.; Duan, L.; Yu, J.; Su, C.; Li, J.; Chen, D.; Zhang, X.; Song, H.; Pan, Y. Characterization analysis and heavy metal-binding properties of CsMTL3 in Escherichia coli. FEBS Open Bio 2018, 8, 1820–1829. [Google Scholar] [CrossRef]
  34. Wang, C.; Chen, S.; Dong, Y.; Ren, R.; Chen, D.; Chen, X. Chloroplastic Os3BGlu6 contributes significantly to cellular ABA pools and impacts drought tolerance and photosynthesis in rice. New Phytol. 2020, 226, 1042–1054. [Google Scholar] [CrossRef]
  35. Georgopoulou, Z.; Milborrow, B.V. Initiation of the synthesis of ‘stress’ ABA by (+)− [2H6] ABA infiltrated into leaves of Commelina communis. Physiol. Plant. 2012, 146, 149–159. [Google Scholar] [CrossRef] [PubMed]
  36. Qi, G.; Chen, J.; Chang, M.; Chen, H.; Hall, K.; Korin, J.; Liu, F.; Wang, D.; Fu, Z.Q. Pandemonium Breaks Out: Disruption of Salicylic Acid-Mediated Defense by Plant Pathogens. Mol. Plant. 2018, 11, 1427–1439. [Google Scholar] [CrossRef] [Green Version]
  37. Zubo, Y.O.; Yamburenko, M.V.; Kusnetsov, V.V.; Borner, T. Methyl jasmonate, gibberellic acid, and auxin affect transcription and transcript accumulation of chloroplast genes in barley. J. Plant. Physiol. 2011, 168, 1335–1344. [Google Scholar] [CrossRef]
  38. Agathokleous, E.; Feng, Z.; Penuelas, J. Chlorophyll hormesis: Are chlorophylls major components of stress biology in higher plants? Sci. Total Environ. 2020, 726, 138637. [Google Scholar] [CrossRef]
  39. Jiang, Z.; Zhu, L.; Wang, Q.; Hou, X. Autophagy-Related 2 Regulates Chlorophyll Degradation under Abiotic Stress Conditions in Arabidopsis. Int. J. Mol. Sci. 2020, 21, 4515. [Google Scholar] [CrossRef] [PubMed]
  40. Mao, C.; Lu, S.; Lv, B.; Zhang, B.; Shen, J.; He, J.; Luo, L.; Xi, D.; Chen, X.; Ming, F. A Rice NAC Transcription Factor Promotes Leaf Senescence via ABA Biosynthesis. Plant. Physiol. 2017, 174, 1747–1763. [Google Scholar] [CrossRef] [PubMed] [Green Version]
  41. Bolser, D.M.; Staines, D.M.; Perry, E.; Kersey, P.J. Ensembl Plants: Integrating Tools for Visualizing, Mining, and Analyzing Plant Genomic Data. Methods Mol. Biol. 2017, 1533, 1–31. [Google Scholar]
  42. Goodstein, D.M.; Shu, S.; Howson, R.; Neupane, R.; Hayes, R.D.; Fazo, J.; Mitros, T.; Dirks, W.; Hellsten, U.; Putnam, N.; et al. Phytozome: A comparative platform for green plant genomics. Nucleic Acids Res. 2012, 40, D1178–D1186. [Google Scholar] [CrossRef]
  43. Finn, R.D.; Clements, J.; Eddy, S.R. HMMER web server: Interactive sequence similarity searching. Nucleic Acids Res. 2011, 39, W29–W37. [Google Scholar] [CrossRef] [Green Version]
  44. Camacho, C.; Coulouris, G.; Avagyan, V.; Ma, N.; Papadopoulos, J.; Bealer, K.; Madden, T.L. BLAST+: Architecture and applications. BMC Bioinform. 2009, 10, 421. [Google Scholar] [CrossRef] [Green Version]
  45. Kong, W.; Yang, S.; Wang, Y.; Bendahmane, M.; Fu, X. Genome-wide identification and characterization of aquaporin gene family in Beta vulgaris. PeerJ 2017, 5, e3747. [Google Scholar] [CrossRef] [PubMed] [Green Version]
  46. Kong, W.; Bendahmane, M.; Fu, X. Genome-Wide Identification and Characterization of Aquaporins and Their Role in the Flower Opening Processes in Carnation (Dianthus caryophyllus). Molecules 2018, 23, 1895. [Google Scholar] [CrossRef] [Green Version]
  47. Edgar, R.C.; Sjolander, K. A comparison of scoring functions for protein sequence profile alignment. Bioinformatics 2004, 20, 1301–1308. [Google Scholar] [CrossRef] [PubMed]
  48. Kumar, S.; Stecher, G.; Tamura, K. MEGA7: Molecular Evolutionary Genetics Analysis Version 7.0 for Bigger Datasets. Mol. Biol. Evol. 2016, 33, 1870–1874. [Google Scholar] [CrossRef] [PubMed] [Green Version]
  49. Subramanian, B.; Gao, S.; Lercher, M.J.; Hu, S.; Chen, W.H. Evolview v3: A webserver for visualization, annotation, and management of phylogenetic trees. Nucleic Acids Res. 2019, 47, W270–W275. [Google Scholar] [CrossRef] [PubMed]
  50. Chen, C.; Chen, H.; Zhang, Y.; Thomas, H.R.; Frank, M.H.; He, Y.; Xia, R. TBtools: An Integrative Toolkit Developed for Interactive Analyses of Big Biological Data. Mol. Plant. 2020, 13, 1194–1202. [Google Scholar] [CrossRef]
  51. Wang, Y.; Tang, H.; Debarry, J.D.; Tan, X.; Li, J.; Wang, X.; Lee, T.H.; Jin, H.; Marler, B.; Guo, H.; et al. MCScanX: A toolkit for detection and evolutionary analysis of gene synteny and collinearity. Nucleic Acids Res. 2012, 40, e49. [Google Scholar] [CrossRef] [PubMed] [Green Version]
  52. Krzywinski, M.; Schein, J.; Birol, I.; Connors, J.; Gascoyne, R.; Horsman, D.; Jones, S.J.; Marra, M.A. Circos: An information aesthetic for comparative genomics. Genome Res. 2009, 19, 1639–1645. [Google Scholar] [CrossRef] [Green Version]
  53. Rozas, J.; Ferrer-Mata, A.; Sanchez-DelBarrio, J.C.; Guirao-Rico, S.; Librado, P.; Ramos-Onsins, S.E.; Sanchez-Gracia, A. DnaSP 6: DNA Sequence Polymorphism Analysis of Large Data Sets. Mol. Biol. Evol. 2017, 34, 3299–3302. [Google Scholar] [CrossRef] [PubMed]
  54. Emms, D.M.; Kelly, S. OrthoFinder: Phylogenetic orthology inference for comparative genomics. Genome Biol. 2019, 20, 238. [Google Scholar] [CrossRef] [PubMed] [Green Version]
  55. Zong, W.; Tang, N.; Yang, J.; Peng, L.; Ma, S.; Xu, Y.; Li, G.; Xiong, L. Feedback Regulation of ABA Signaling and Biosynthesis by a bZIP Transcription Factor Targets Drought-Resistance-Related Genes. Plant. Physiol. 2016, 171, 2810–2825. [Google Scholar] [CrossRef] [PubMed] [Green Version]
Figure 1. Phylogenetic tree of MT genes based on protein sequences from six Oryza species/subspecies. ClustalW is used for multiple sequence alignment. MEGA v.7.0 is adopted for phylogenetic reconstruction using the neighbor-joining (NJ) clustering method. Bootstrap numbers (1000 replicates) are shown. Different color of circles represents different subfamilies. Different-shaped markers indicate the different species. The numbers inside the red circles represent the different orthogroups (OGs). * means unassigned proteins.
Ijms 22 09651 g001
Figure 2. The phylogenetic tree (A), motif composition (B), and exon/intron structure (C) of the MT genes in six Oryza species/subspecies. (A) Sequence alignments and the NJ-phylogenetic trees were made using ClustalW and MEGA v.7.0, respectively. A bootstrap number (1000 replicates) is adopted; (B,C) the widths of the gray bars represent the relative lengths of genes and proteins. The green boxes and gray lines display exons and introns, respectively.
Ijms 22 09651 g002
Figure 3. The chromosome location and duplication events of MT genes in six species/subspecies. Os represents Oryza sativa ssp. japonica. Or represents Oryza rufipogon. On represents Oryza nivara. Oi represents Oryza sativa ssp. indica. Og represents Oryza glumaepatula. Ob represents Oryza barthii. The location of each MT gene is marked with a gray line using Circos software. The whole-genome duplication (WGD) or segmental duplication/tandem duplication gene pairs are linked by red/blue lines.
Ijms 22 09651 g003
Figure 4. Analysis of the promoter function of OsMT genes in vivo: (A) the vector constructs are used in the dual-luciferase assay; (B) dual-luciferase assay in the protoplast of rice; (C) dual-luciferase assay in Nicotiana benthamiana leaves. The error bars show the standard deviations of the three independent biological replicates. Significance analysis was performed using t-test; *: p < 0.05, **: p < 0.01, ***: p < 0.001, ****: p < 0.0001.
Ijms 22 09651 g004
Figure 5. Expression profiles of OsMT genes in different tissues. Real-time quantitative PCR, YP0: 0–0.5 cm panicle, YP1: 0.5–1 cm panicle, YP3: 1–2 cm panicle, YP4: 2–3 cm panicle, YP5: 3–4 cm panicle. The error bars show the standard deviations of the three independent qRT-PCR biological replicates. (AI) The expression profiles of 9 OsMTs in different tissues.
Ijms 22 09651 g005
Figure 6. qRT-PCR of relative expression of OsMT genes in roots at the rice seedling stage under various abiotic stress treatments, including NaCl, CdCl2, ABA, and MeJ: (AI) the expression of OsMT genes was calculated at 3, 6, 9, 12, and 24 h of treatments compared with the expression value at 0 h, which was normalized to 1. The error bars show the standard deviations of the three independent qRT-PCR biological replicates. Significance analysis was performed using t-test; *: p < 0.05, **: p < 0.01, ***: p < 0.001.
Ijms 22 09651 g006
Figure 7. qRT-PCR of relative expression of OsMT genes in shoots at the rice seedling stage under various abiotic stress treatments, including NaCl, CdCl2, ABA, and MeJ: (AI) the expression of OsMT genes was calculated at 3, 6, 9, 12, and 24 h of treatments compared with the expression value at 0 h, which was normalized to 1. The error bars show the standard deviations of the three independent qRT-PCR biological replicates. The significance analysis was performed using t-test; *: p < 0.05, **: p < 0.01, ***: p < 0.001.
Ijms 22 09651 g007
Figure 8. Subcellular localization of OsMT proteins in rice green seedling protoplasts. The empty vector, HBT-sGFP, was used as a control. Bright-field images (Bright Field), chlorophyll autofluorescence (Chlorophyll), fluorescence of eGFP fusion protein (GFP), and merged images (Merged) were examined using laser scanning confocal microscopy. Bars = 3 μm.
Ijms 22 09651 g008
Table 1. Ka, Ks, and Ka/Ks values for duplicated gene pairs in rice.
Seq1Seq2KsKaKa/Ks RatioDate (MY)Duplication Type
OsMT-4OsMT-70.13920.90120.15447.65WGD or segmental duplications
OsMT-7OsMT-80.12170.77070.15796.69tandem duplication
OsMT-8OsMT-90.20800.60900.341611.43tandem duplication
OrMT-3OrMT-80.13920.97450.14287.65WGD or segmental duplications
OrMT-8OrMT-90.08820.49470.17844.85tandem duplication
OnMT-2OnMT-30.11170.78520.14226.14tandem duplication
OiMT-5OiMT-90.13920.97450.14287.65WGD or segmental duplications
OiMT-9OiMT-100.24440.61860.395113.43tandem duplication
OiMT-10OiMT-110.21950.28560.768612.06tandem duplication
OiMT-11OiMT-120.11010.42260.26066.05tandem duplication
OgMT-4OgMT-60.18780.92030.204110.32WGD or segmental duplications
OgMT-6OgMT-70.18610.59800.311210.22tandem duplication
ObMT-3ObMT-80.13921.05560.13187.65WGD or segmental duplications
ObMT-5ObMT-60.12120.49320.24586.66tandem duplication
ObMT-8ObMT-90.11170.78520.14226.14tandem duplication
Synonymous (Ks) and nonsynonymous (Ka) substitution rates of duplicate gene pairs (Ka/Ks ratios).
Publisher’s Note: MDPI stays neutral with regard to jurisdictional claims in published maps and institutional affiliations.

