Article

RNA-Sequencing Based microRNA Expression Signature of Colorectal Cancer: The Impact of Oncogenic Targets Regulated by miR-490-3p

1
Department of Digestive Surgery, Breast and Thyroid Surgery, Graduate School of Medical and Dental Sciences, Kagoshima University, Kagoshima 890-8520, Japan
2
Department of Functional Genomics, Graduate School of Medicine, Chiba University, Chiba 260-8670, Japan
3
Department of Biochemistry and Genetics, Graduate School of Medicine, Chiba University, Chiba 260-8670, Japan
*
Author to whom correspondence should be addressed.
Int. J. Mol. Sci. 2021, 22(18), 9876; https://0-doi-org.brum.beds.ac.uk/10.3390/ijms22189876
Submission received: 23 August 2021 / Revised: 8 September 2021 / Accepted: 10 September 2021 / Published: 13 September 2021
(This article belongs to the Special Issue microRNA as a Biomarker in Gastroenterological Cancers)

Abstract

:
To elucidate novel aspects of the molecular pathogenesis of colorectal cancer (CRC), we have created a new microRNA (miRNA) expression signature based on RNA-sequencing. Analysis of the signature showed that 84 miRNAs were upregulated, and 70 were downregulated in CRC tissues. Interestingly, our signature indicated that both guide and passenger strands of some miRNAs were significantly dysregulated in CRC tissues. These findings support our earlier data demonstrating the involvement of miRNA passenger strands in cancer pathogenesis. Our study focused on downregulated miR-490-3p and investigated its tumor-suppressive function in CRC cells. We successfully identified a total of 38 putative oncogenic targets regulated by miR-490-3p in CRC cells. Among these targets, the expression of three genes (IRAK1: p = 0.0427, FUT1: p = 0.0468, and GPRIN2: p = 0.0080) significantly predicted 5-year overall survival of CRC patients. Moreover, we analyzed the direct regulation of IRAK1 by miR-490-3p, and its resultant oncogenic function in CRC cells. Thus, we have clarified a part of the molecular pathway of CRC based on the action of tumor-suppressive miR-490-3p. This new miRNA expression signature of CRC will be a useful tool for elucidating new molecular pathogenesis in this disease.

1. Introduction

Colorectal cancer (CRC) is one of the most common cancers of the digestive system, as it constitutes approximately 10% of all diagnosed cancers, with almost 900,000 deaths annually [1,2]. The expansion of treatment options and the spread of diagnostic systems have greatly contributed to improving the prognosis of patients with CRC [2,3,4]. However, for patients with advanced cancer with metastasis, the 5-year survival rate is approximately 14%, and improving the prognosis of these patients is an important clinical issue [3]. Furthermore, the number of young people (under the age of 50) with colorectal cancer is increasing, especially rectal cancer and left-sided colon cancer [2].
Over the past few decades, the mechanism of CRC oncogenesis has been revealed by molecular genetic analyses [5,6,7]. A previous study demonstrated that several genes are frequently mutated, e.g., APC, TP53, SMAD4, KRAS, PIK3CA, ARID1A, SOX9, and FAM123B, and pivotal oncogenic pathways, e.g., WNT, RAS-MAPK, PI3K, TGF-β, P53, and DNA mismatch-repair are closely associated with this disease [7]. Notably, for younger CRC patients, the mutation rate of these genes is low, and it is expected that there are other factors involved [8].
The Human Genome Project revealed that a large number of non-protein-coding RNA molecules (ncRNAs) are transcribed from the human genome [9]. Current studies indicate that a large number of ncRNAs play critical roles in various biological processes, e.g., stabilization of RNA molecules, regulation of gene expression, and control of the cell cycle [10,11]. Notably, it is evident that dysregulation of ncRNA is involved in the enhancement of human diseases, including cancers [12].
Functional ncRNAs are classified by their nucleotide length: short ncRNAs (19–30 nucleotides), medium ncRNAs (50–200 nucleotides), and long ncRNAs (>200 nucleotides) [13]. MicroRNAs (miRNAs) constitute the most commonly analyzed class of short ncRNAs. They function as fine-tuners of gene expression, working in a sequence-dependent manner [14]. One of the hallmarks of miRNAs is that a single miRNA regulates multiple RNA transcripts. Moreover, they contribute to various cellular signaling pathways in both physiological and pathological conditions [14,15]. A vast number of studies have shown that ectopic expression of miRNAs modulates oncogenes and/or tumor-suppressors in human cancer cells, including CRC [16,17,18].
We have identified tumor-suppressive miRNAs, and their regulated oncogenes, in several types of cancers [19,20,21]. Our previous studies revealed that the expression of tumor-suppressive miRNAs and regulated oncogenes are closely related to the molecular pathogenesis of cancers. Our miRNA-based strategy is an attractive approach to the identification of novel oncogenic genes/pathways in cancer cells.
In this study, we attempted to identify novel dysregulated miRNAs in CRC tissues. Thus, we created a new miRNA expression signature using next-generation sequencing technology. Currently available RNA sequencing technologies are suitable for rapidly, and accurately, generating miRNA signatures [22]. Our new CRC signature showed that a total of 154 miRNAs (84 upregulated and 70 downregulated) were significantly dysregulated in CRC tissues. Here, we focused on miR-490-3p (the most downregulated miRNA in this signature), and we investigated its tumor-suppressive roles and its targeted oncogenes in CRC cells. Finally, we identified IRAK1 as an oncogenic miR-490-3p target and demonstrated that its expression is closely involved in CRC molecular pathogenesis.
Using tumor-suppressive miR-490-3p as a starting point, we have succeeded in identifying molecules involved in the oncogenesis of CRC. The CRC miRNA signature we provide in this study will contribute to the search for regulatory molecular networks in CRC.

2. Results

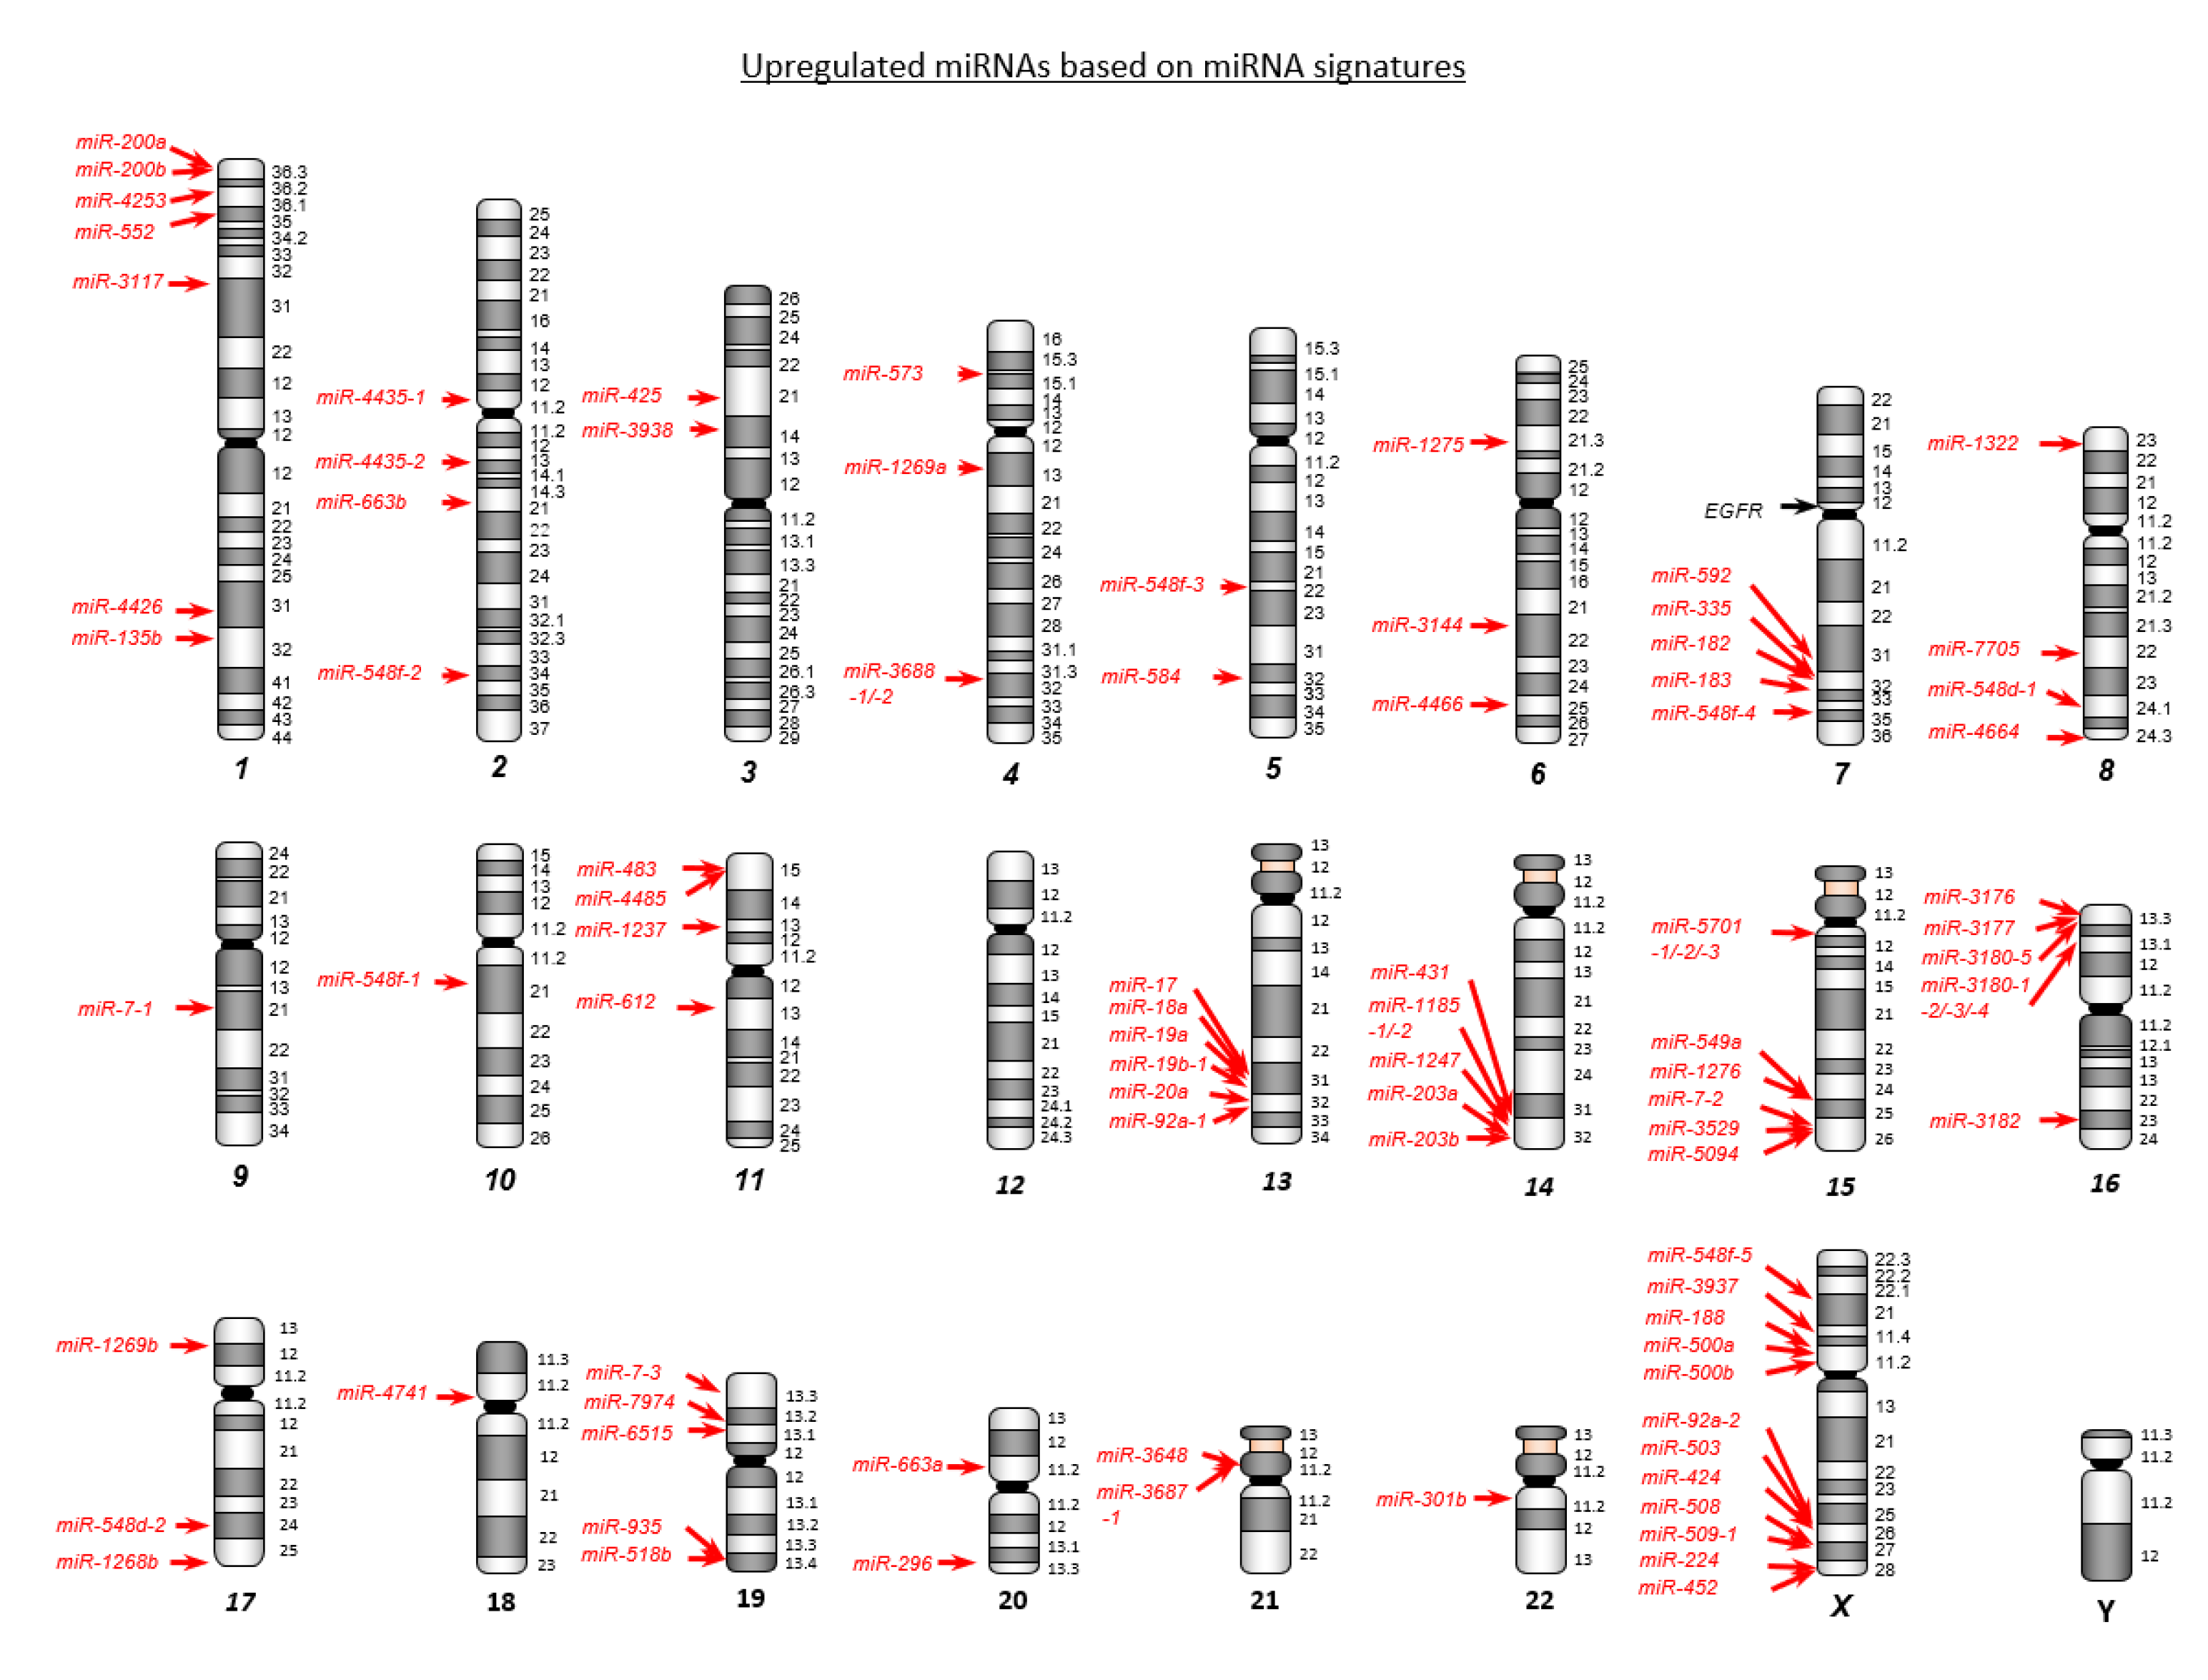
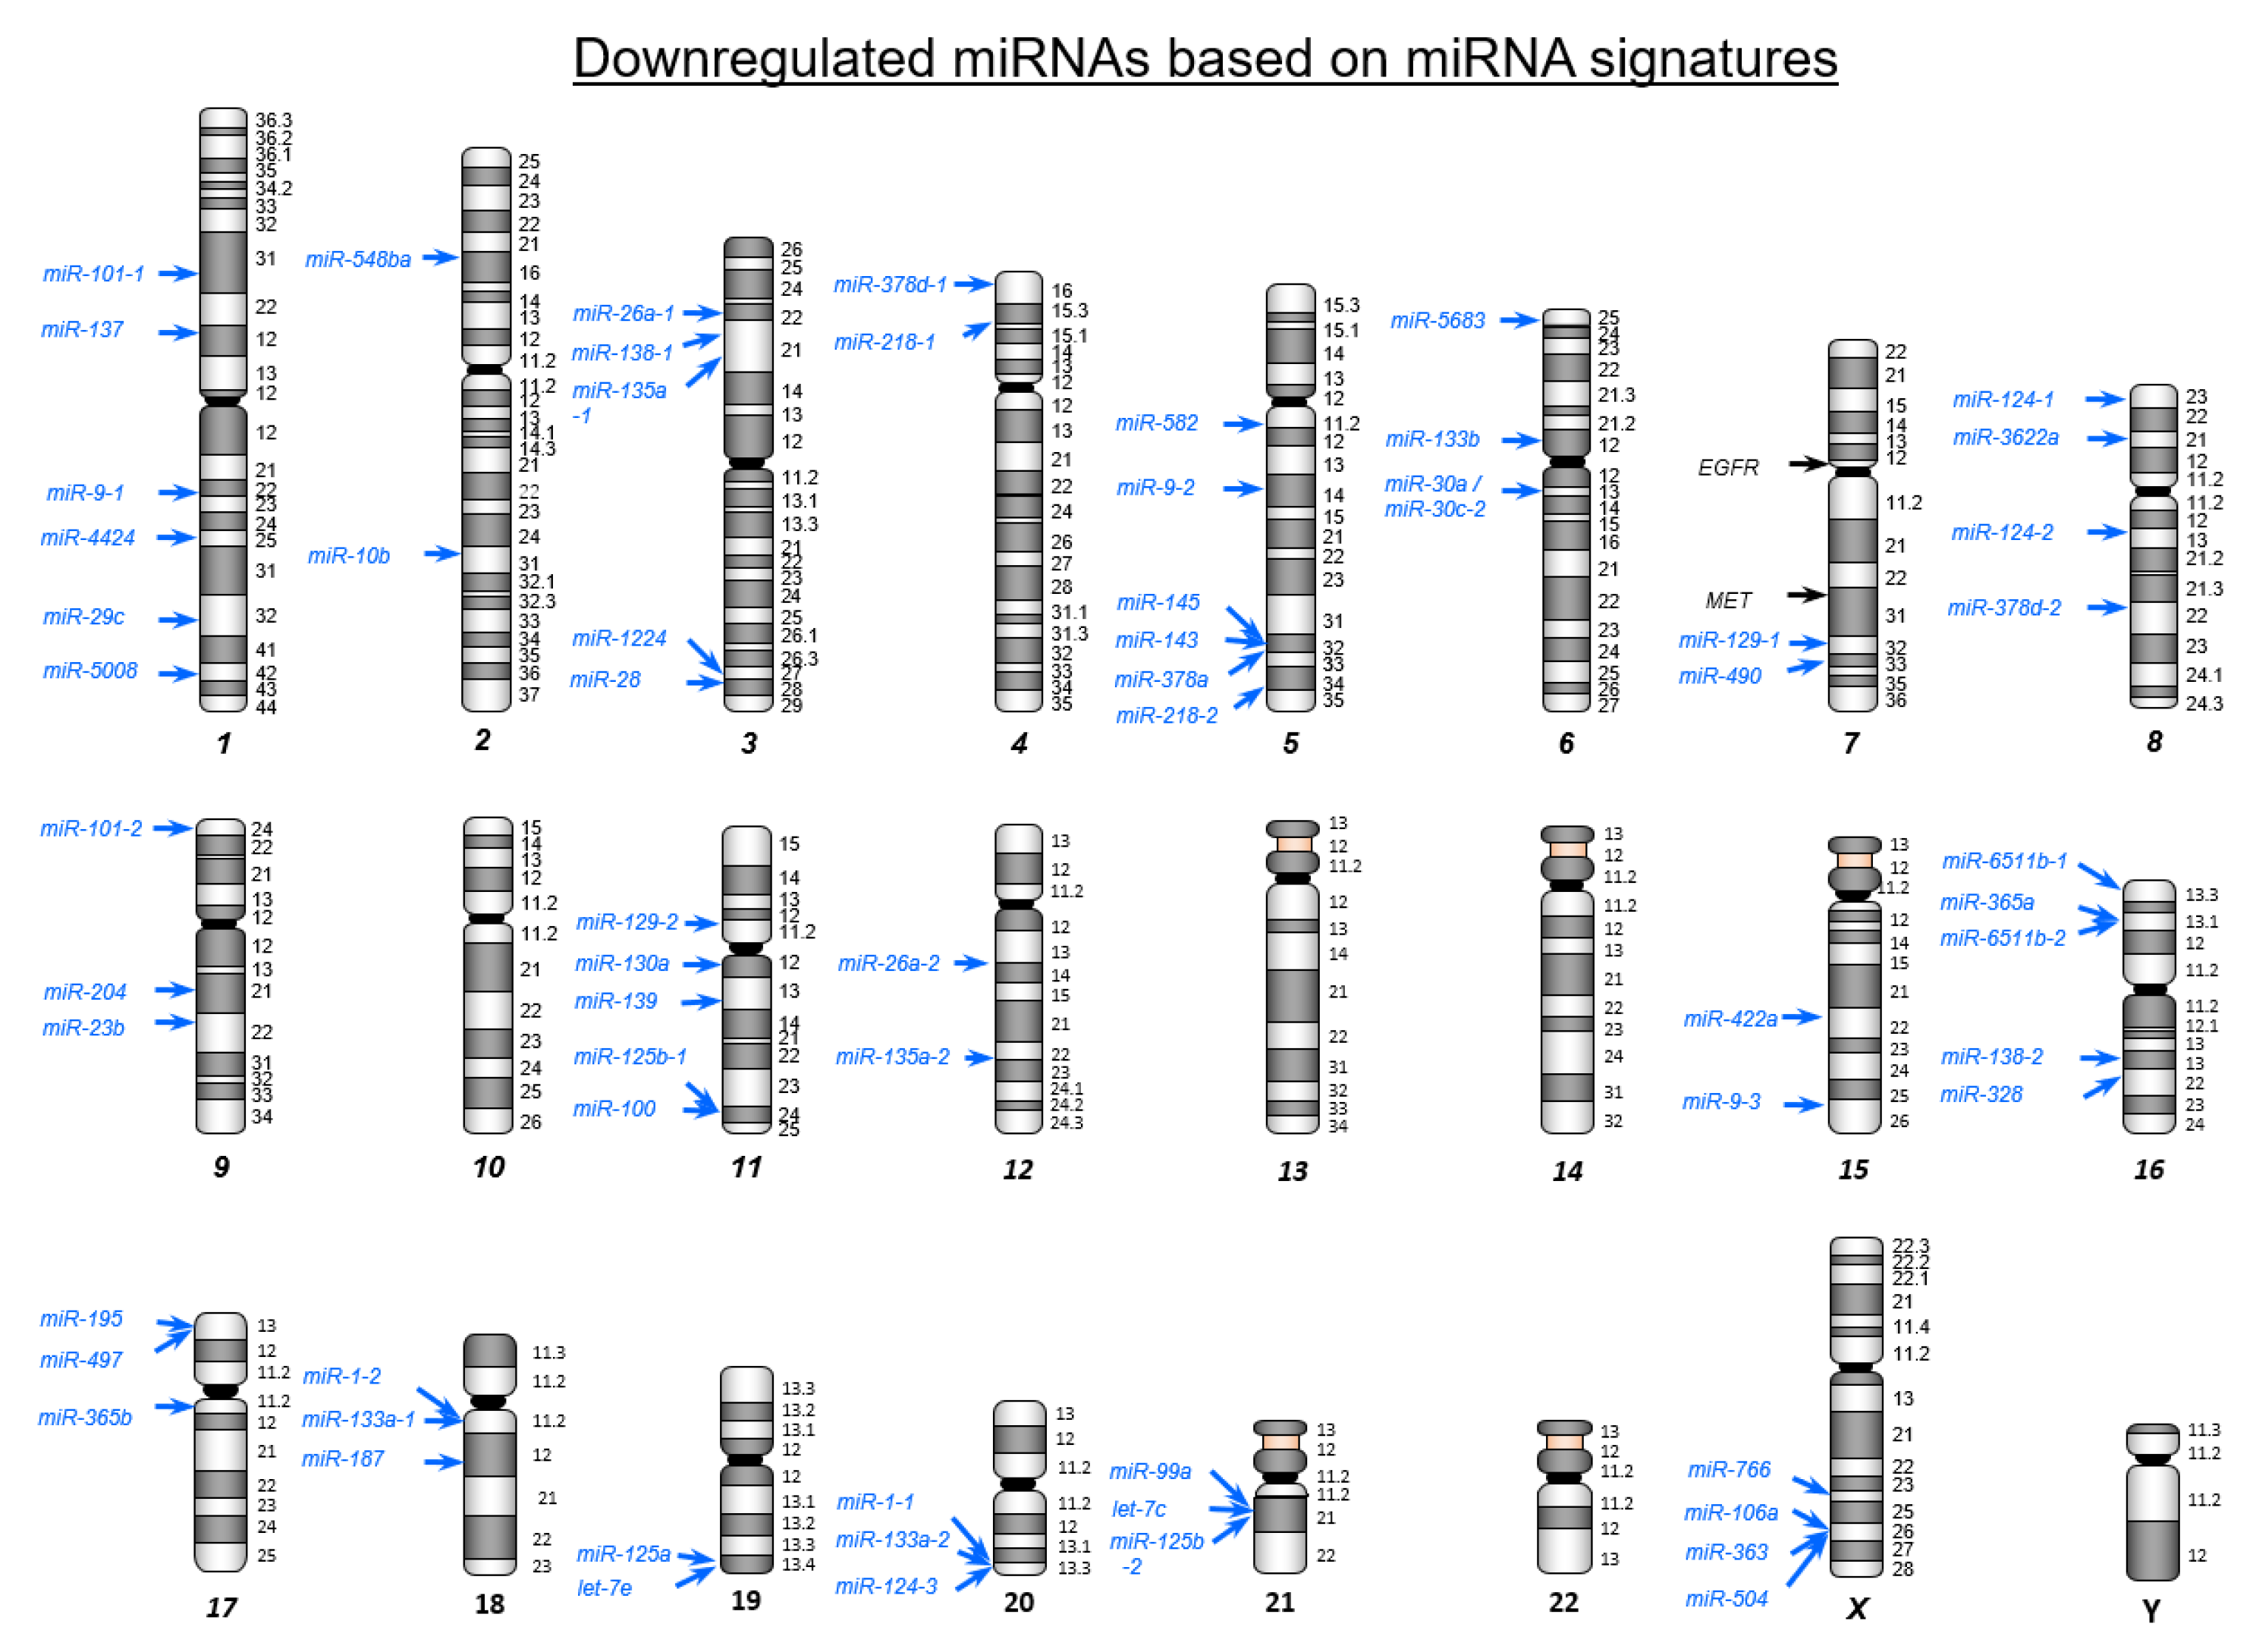
2.1. Creating miRNA Expression Signature in CRC

A total of 10 samples (5 CRC tissues and 5 noncancerous tumor-adjacent tissues) were analyzed using RNA sequencing techniques to generate a CRC miRNA signature. The characteristics of five patients with CRC are summarized in Table 1. In this analysis, we obtained between 11,432,618 and 19,286,983 total sequence reads (Table S1). After the trimming procedure, we mapped them to the human genome and determined that 3,018,259 to 16,436,280 sequences were small human RNAs (Table S1). Our RNA sequence data was deposited in the Gene Expression Omnibus (GEO) database (GSE183437).
Differentially expressed miRNAs were mapped on human chromosomes (Figure 1 and Figure 2). Upregulated and downregulated miRNAs (84 and 70, respectively) were aberrantly dysregulated in CRC tissues (Tables S2 and S3). Interestingly, among the abnormally downregulated miRNAs in CRC tissue, 16 pairs of miRNAs (i.e., miR-490, miR-133a, miR-145, miR-129, miR-143, miR-497, miR-9, miR-139, miR-125b, miR-100, miR-30a, miR-218, miR-195, miR-99a, miR-29c, and miR-28) represented both miR-5p and -3p sequences.

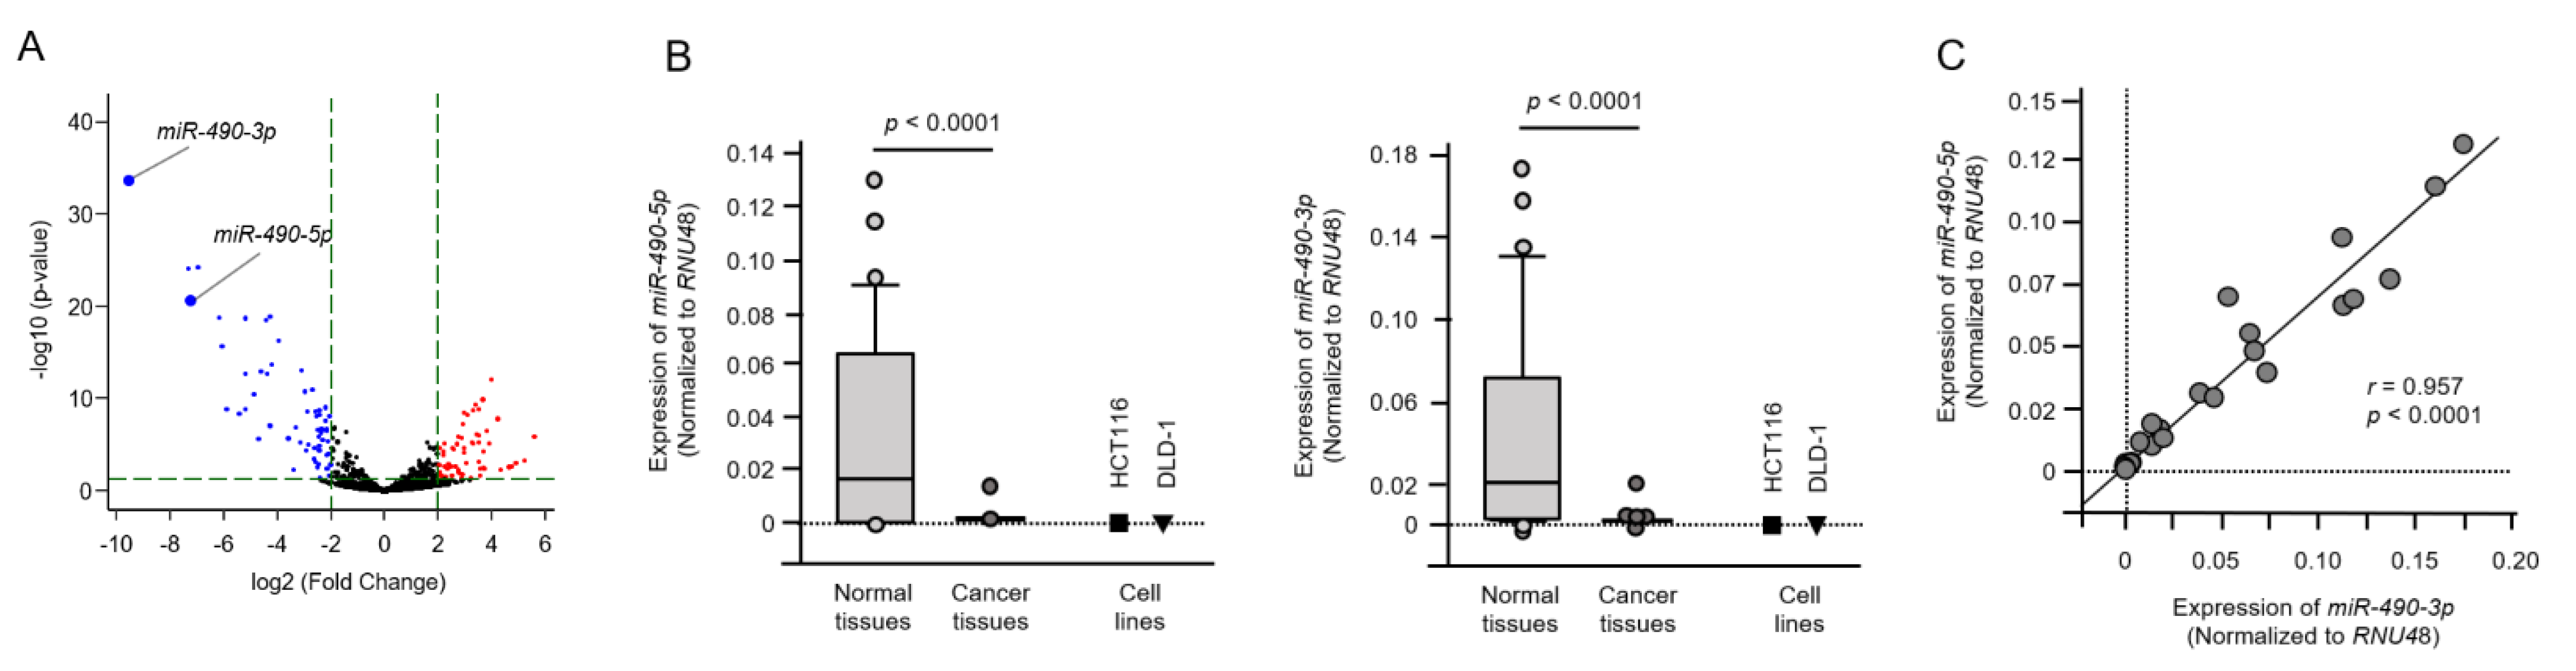
2.2. Tumor-Suppressive Roles of miR-490-5p and miR-490-3p in CRC Cells

The miR-490-duplex was the most downregulated in this miRNA expression signature (Figure 3A). In this study, we investigated the functional and oncogenic significance of both strands of the miR-490-duplex in CRC cells. To confirm the validity of the CRC signature, we measured the expression levels of miR-490-3p and miR-490-5p in clinical specimens (27 CRC specimens and 27 tumor-adjacent normal colorectal epithelial specimens). The characteristics of 27 patients with CRC are summarized in Table S5. Expression levels of both miR-490-3p and miR-490-5p were significantly reduced (p < 0.0001) in CRC tissues compared with those in normal colorectal epithelial tissues, assessed by quantitative polymerase chain reaction (qPCR). (Figure 3B). The expression levels of these miRNAs in two cell lines (HCT116 and DLD-1) were lower than those in normal colorectal epithelial tissues (Figure 3B). There was a positive correlation between the expression levels of the two miRNAs by Spearman’s rank analysis (r = 0.957, p < 0.0001; Figure 3C).
To investigate the antitumor functions of miR-490-3p and miR-490-5p in CRC cells, we performed ectopic expression assays. The experiments were performed by a transient transfection method using mature miRNAs, miR-490-3p (caaccuggaggacuccaugcug), or miR-490-5p (ccauggaucuccaggugggu). Cell proliferation, migration and invasive ability were significantly attenuated by miR-490-3p transfection into CRC cell lines (Figure 4A–C). In contrast, cell migration abilities were not blocked by miR-490-5p transfection into CRC cell lines (Figure 4C).

2.3. MiR-490-3p and miR-490-5p Was Incorporated into the RNA-Induced Silencing Complex (RISC) in CRC Cells

In miRNA biogenesis, it is essential that miRNAs are incorporated into the RISC to regulate target genes. Ago2 is a fundamental component of the RISC. We investigated that miR-490-3p and miR-490-5p actually functioned in CRC cells by immunoprecipitation using an anti-Ago2 antibody. Levels of the miRNA incorporation into Ago2 were quantified with qPCR. Mature miR-490-3p was transfected into CRC cells, and it was incorporated into the RISC. Levels of miR-490-3p were significantly higher than that in cells transfected with mock, miR-control, and miR-490-5p (Figure S1). Similarly, when transfected with mature miR-490-5p, the levels of miR-490-5p were significantly higher than those of cells transfected with mock, miR-control, and miR-490-3p (Figure S1). These results indicated that miR-490-3p and miR-490-5p were incorporated into RISC separately.

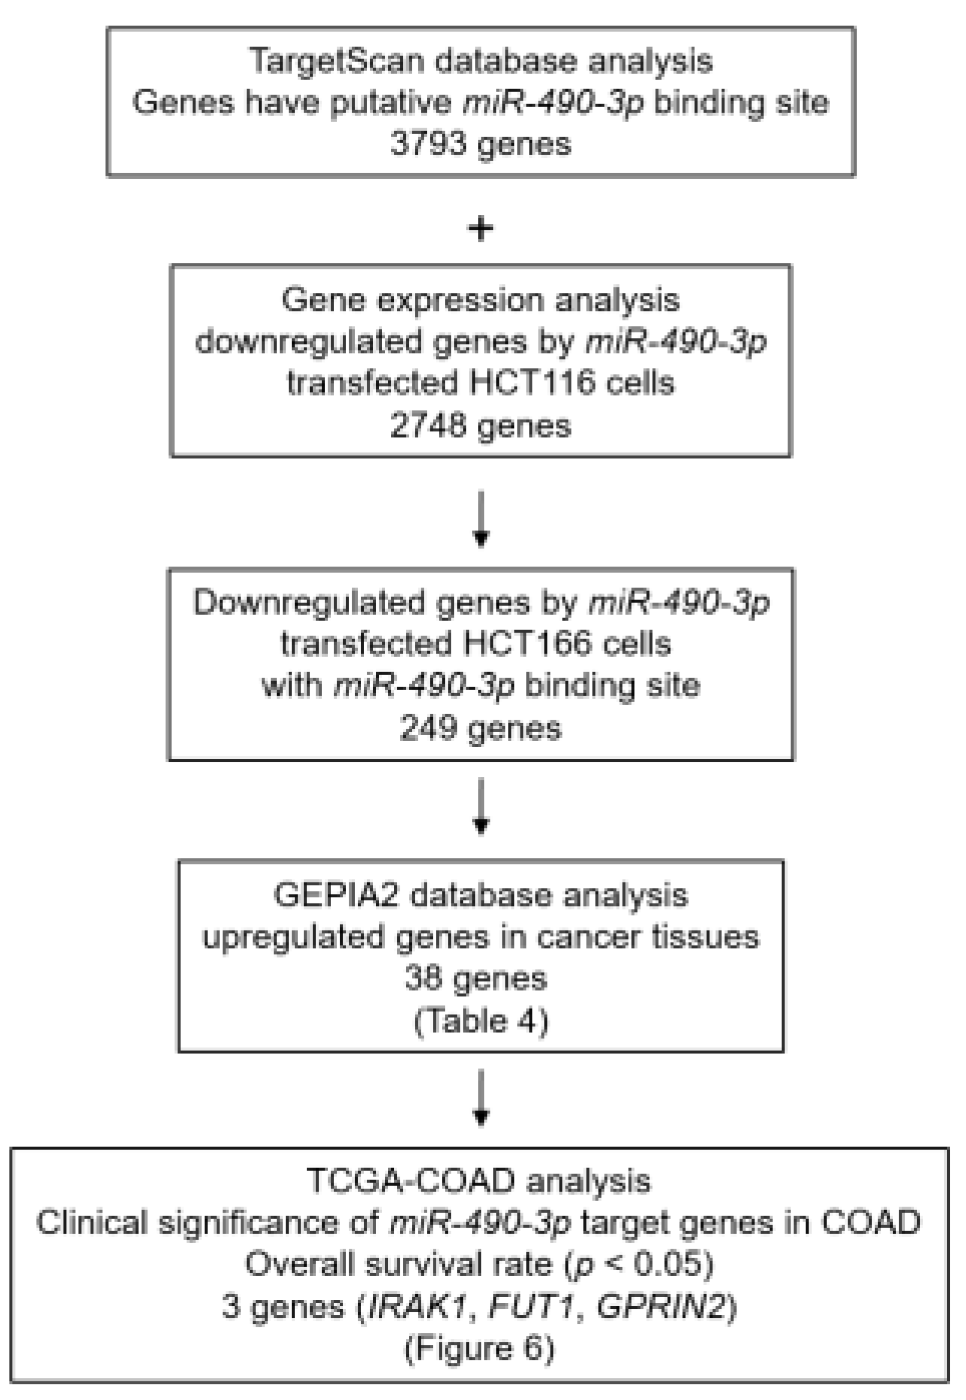
2.4. Screening of Putative Oncogenic Targets by miR-490-3p Regulation in CRC Cells

Our screening strategy of miR-490-3p targets is shown in Figure 5. To identify the putative oncogenic targets of miR-490-3p regulation in CRC cells, we assessed three datasets, i.e., TargetScan database, the GEO database (genes downregulated in miR-490-3p-transfected HCT116), and TCGA-COAD database through the GEPIA2 platform (genes upregulated in CRC tissues).
There were 38 candidate targets for miR-490-3p regulation in CRC cells (Table 2), of which three genes (IRAK1, FUT1, and GPRIN2) were associated with poor prognosis (Figure 6). Among these targets, we focused on IRAK1 as an oncogenic target of miR-490-3p regulation in CRC cells.

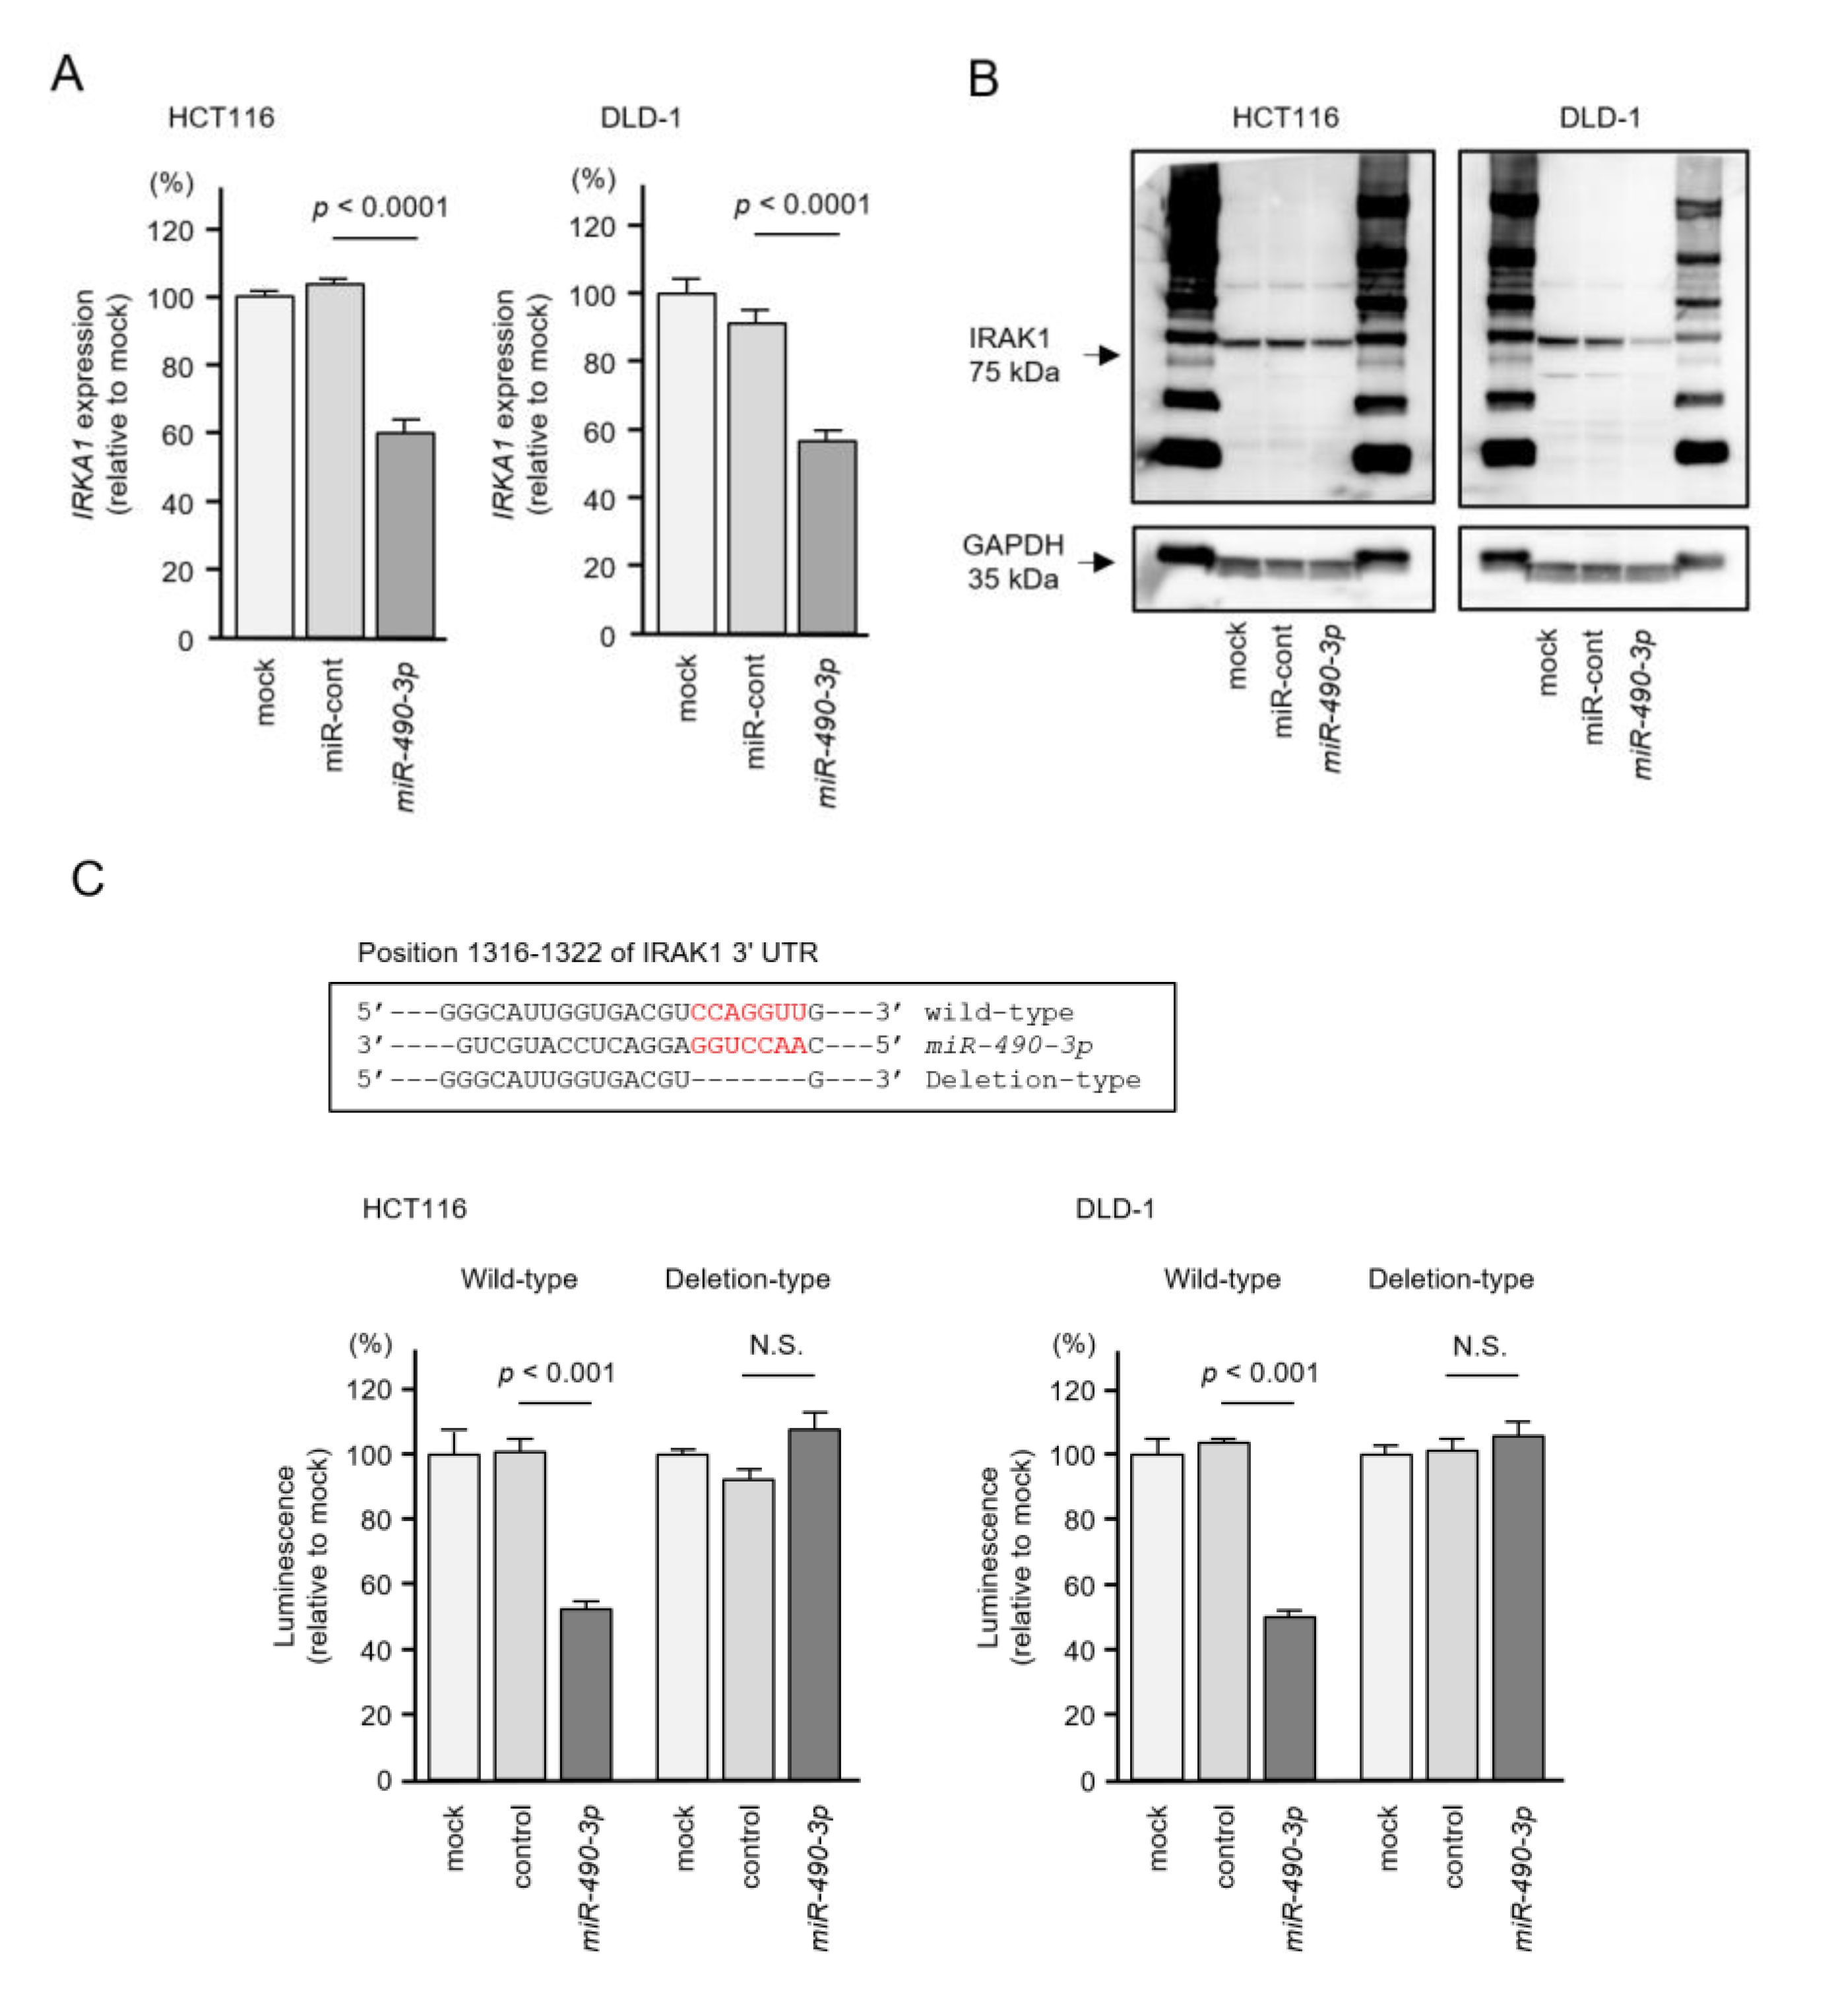
2.5. Direct Regulation of IRAK1 by miR-490-3p in CRC Cells

We investigated direct regulation of IRAK1 by miR-490-3p in CRC cells. Expression levels of IRAK1 mRNA and IRAK1 protein were significantly reduced by aberrant expression of miR-490-3p in CRC cells (HCT116 and DLD-1, Figure 7A,B).
Next, a dual luciferase reporter assay was performed to assess whether miR-490-3p bound directly to the IRAK1 target site. Luciferase activity was significantly reduced after co-transfection of miR-490-3p and a vector carrying the wild-type miR-490-3p target site. In contrast, luciferase activity was not changed following co-transfection of miR-490-3p and a vector carrying the deletion-type miR-490-3p target site (Figure 7C). These results showed that IRAK1 was directly regulated by miR-490-3p in CRC cells.

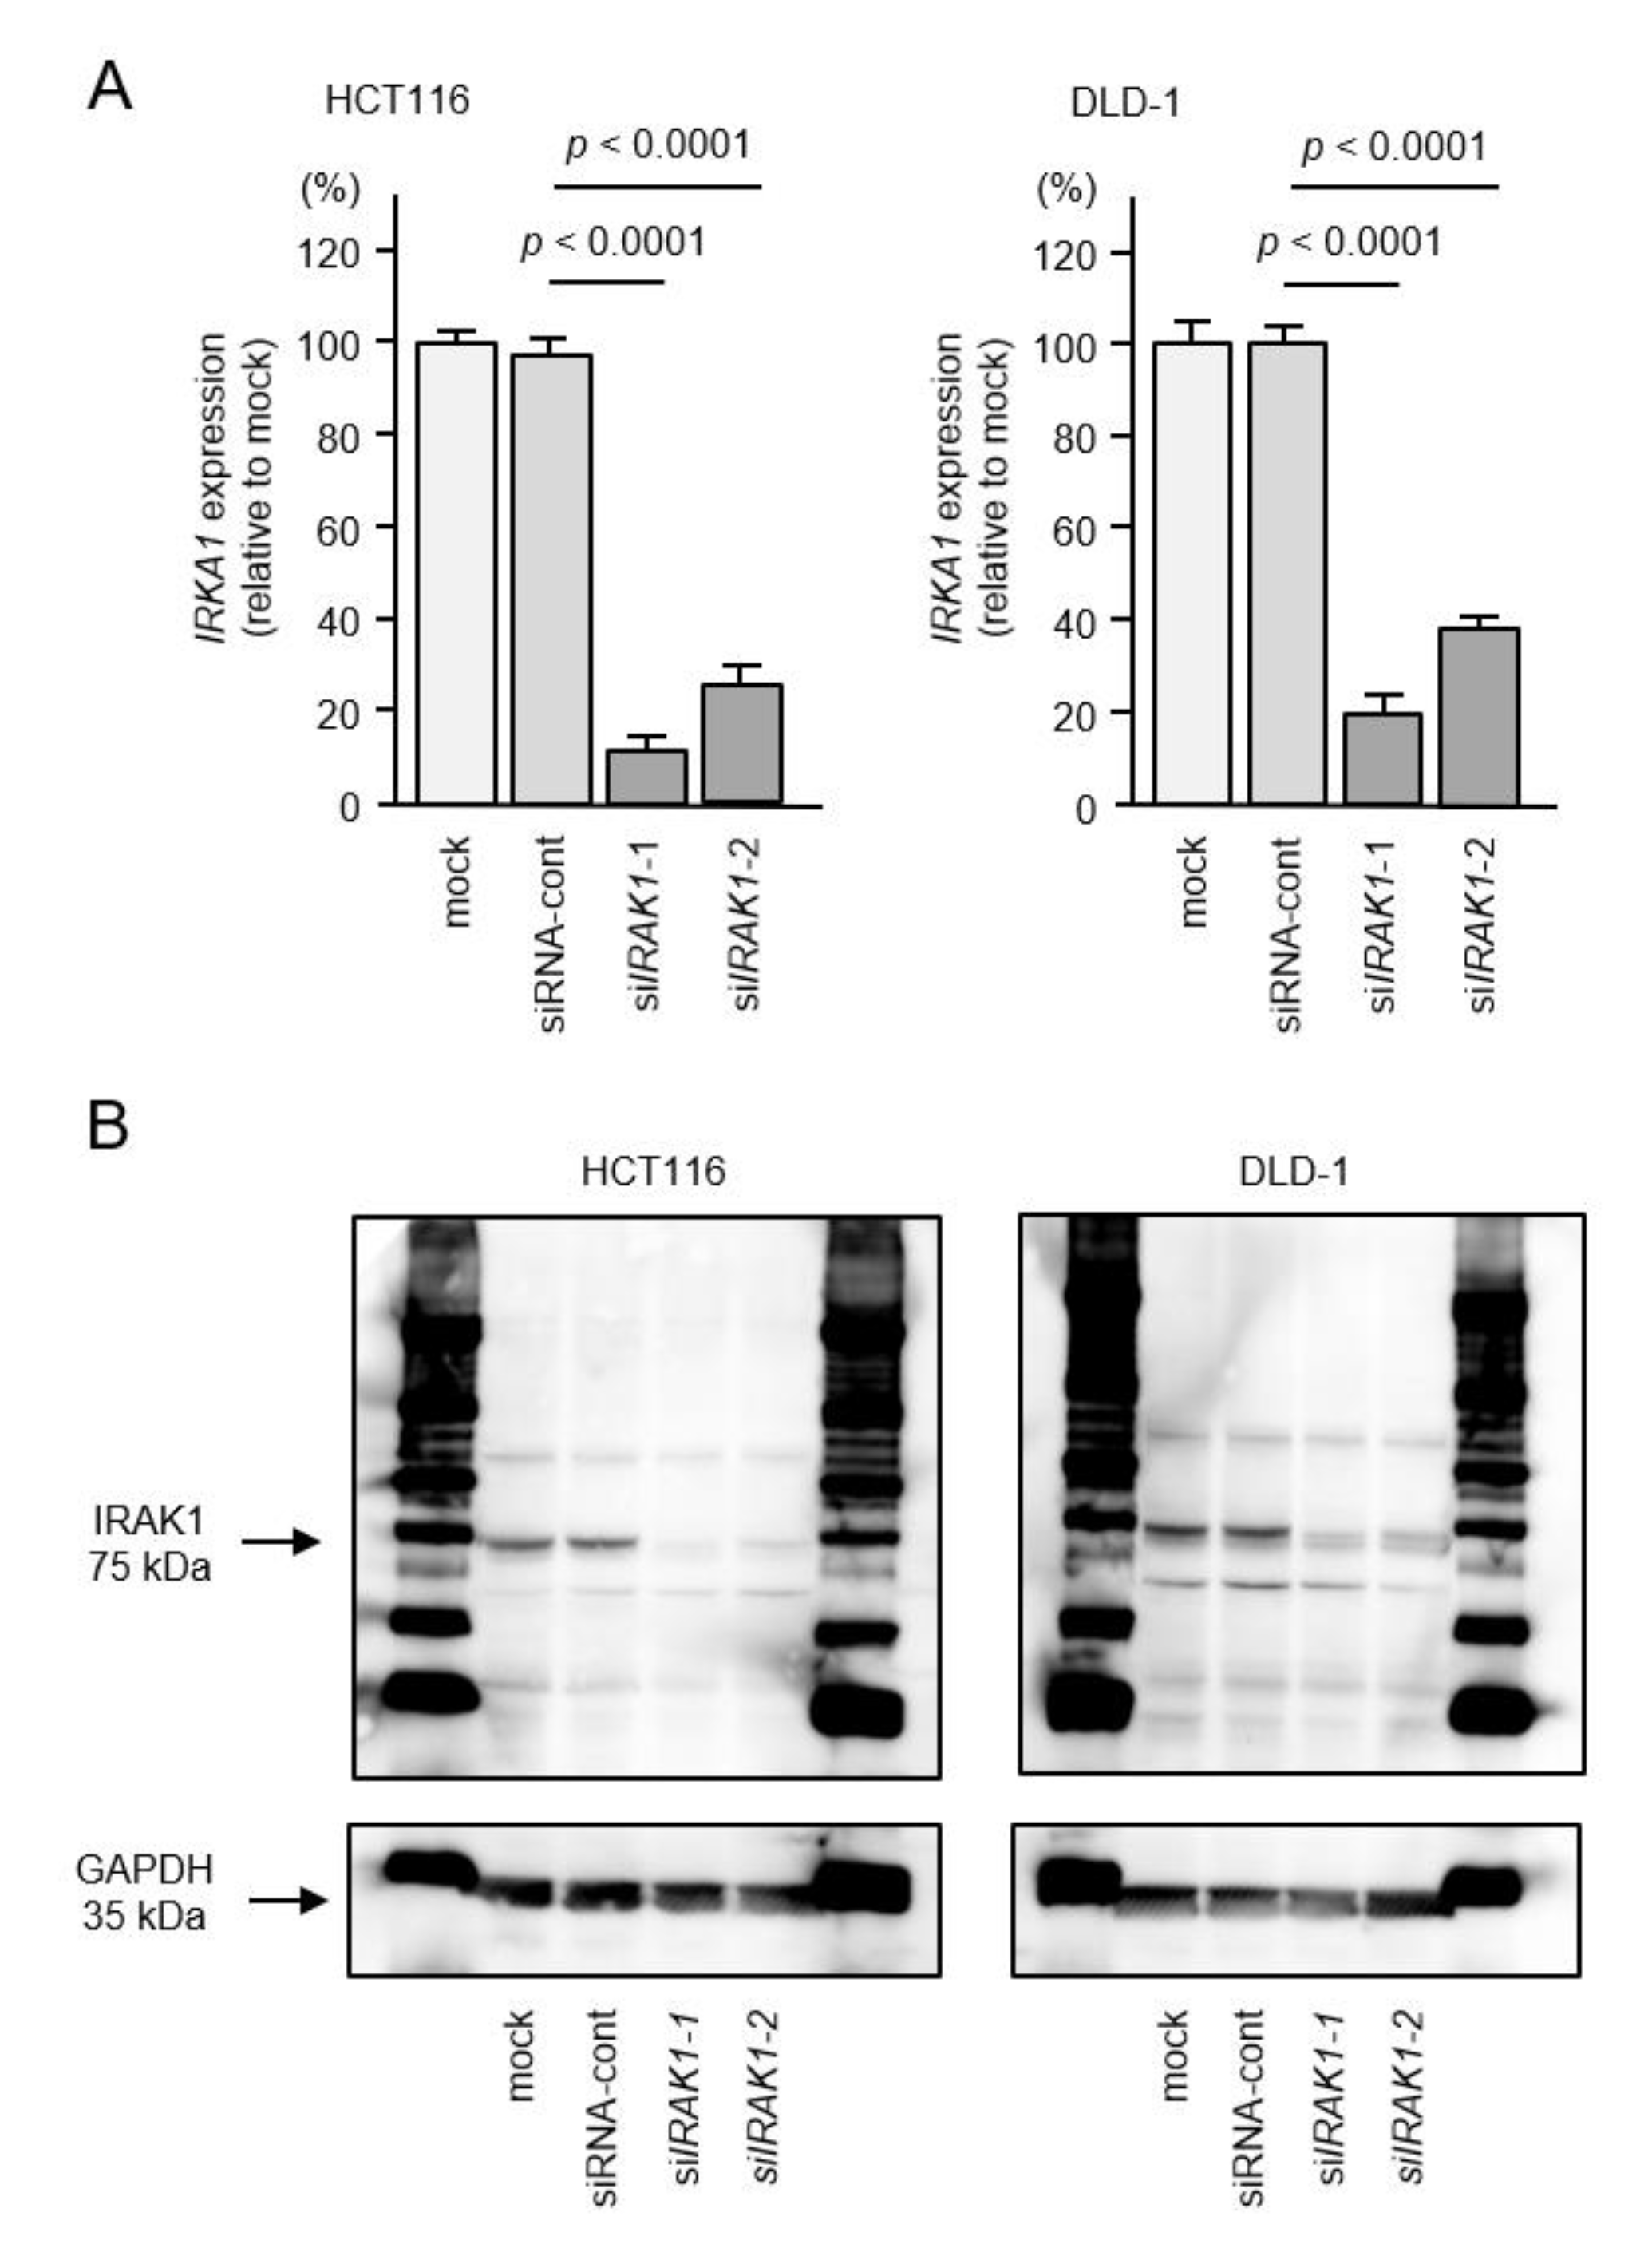
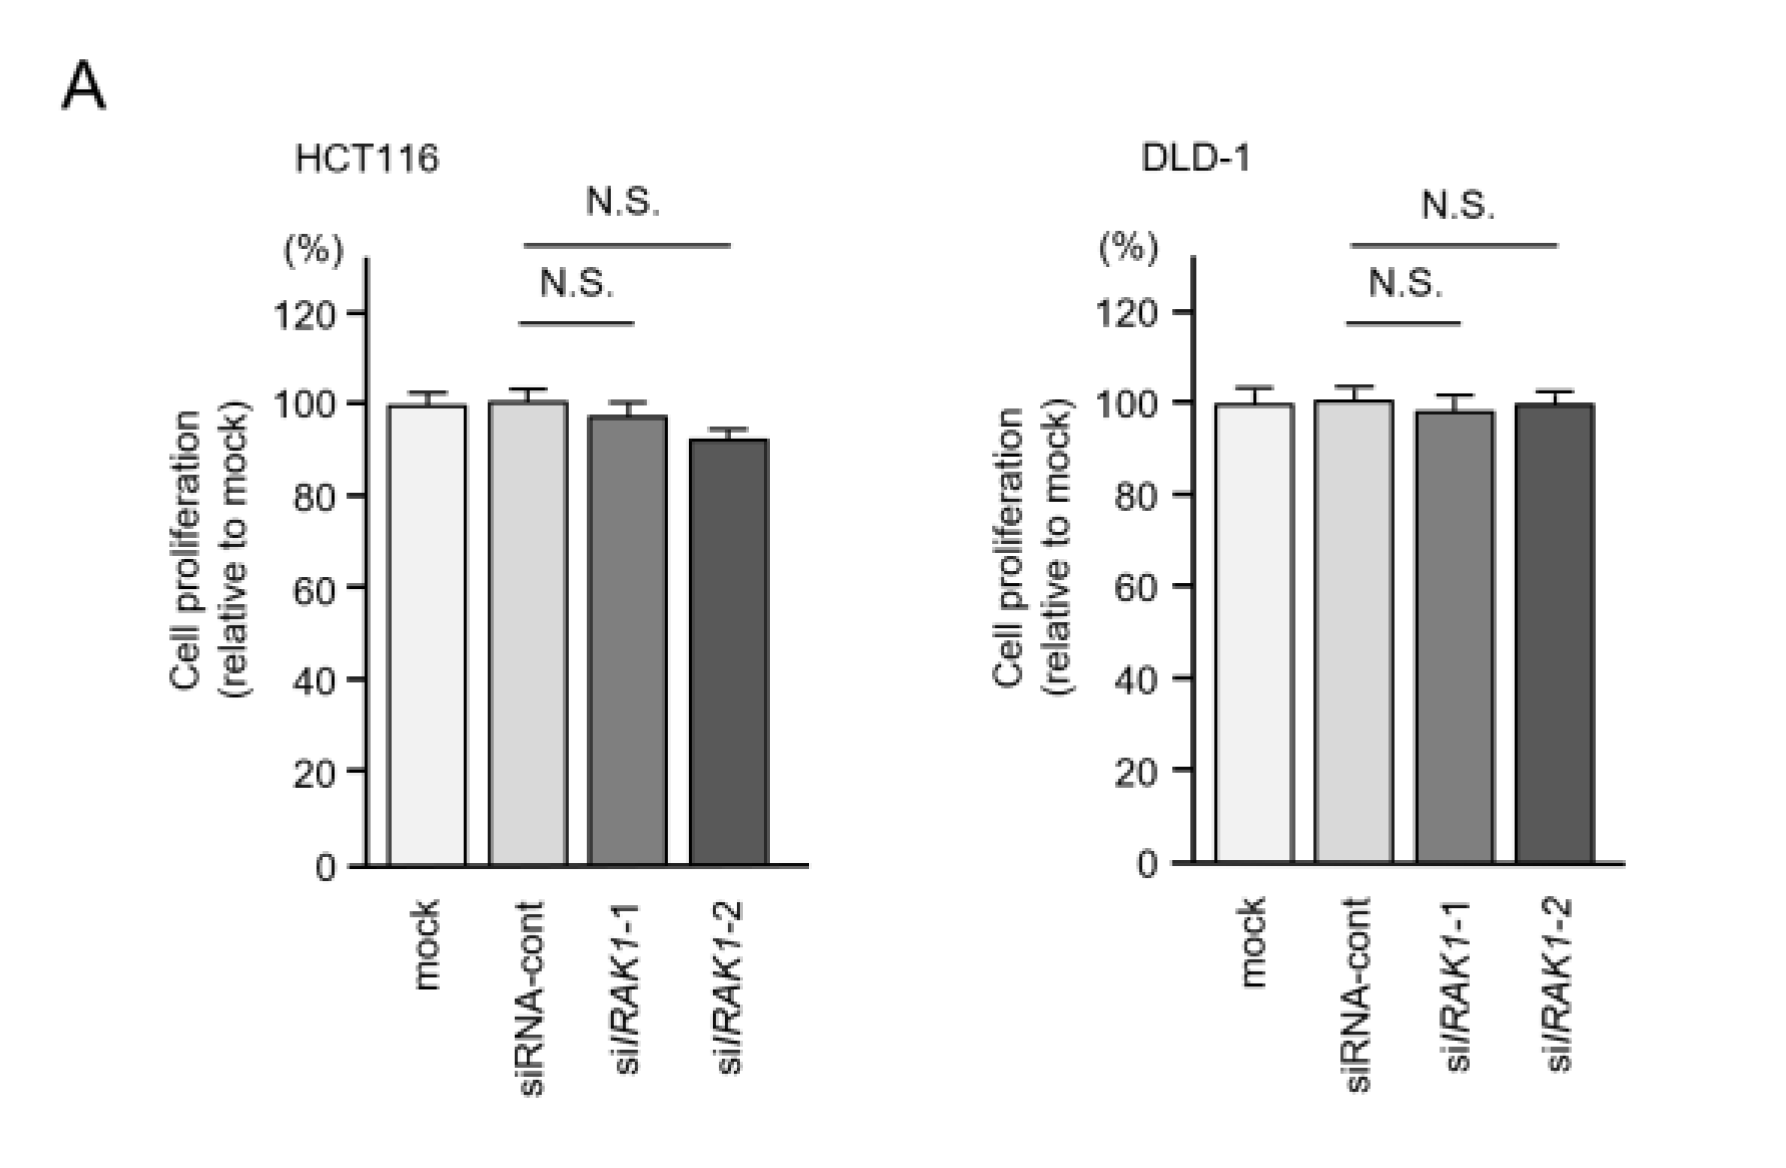
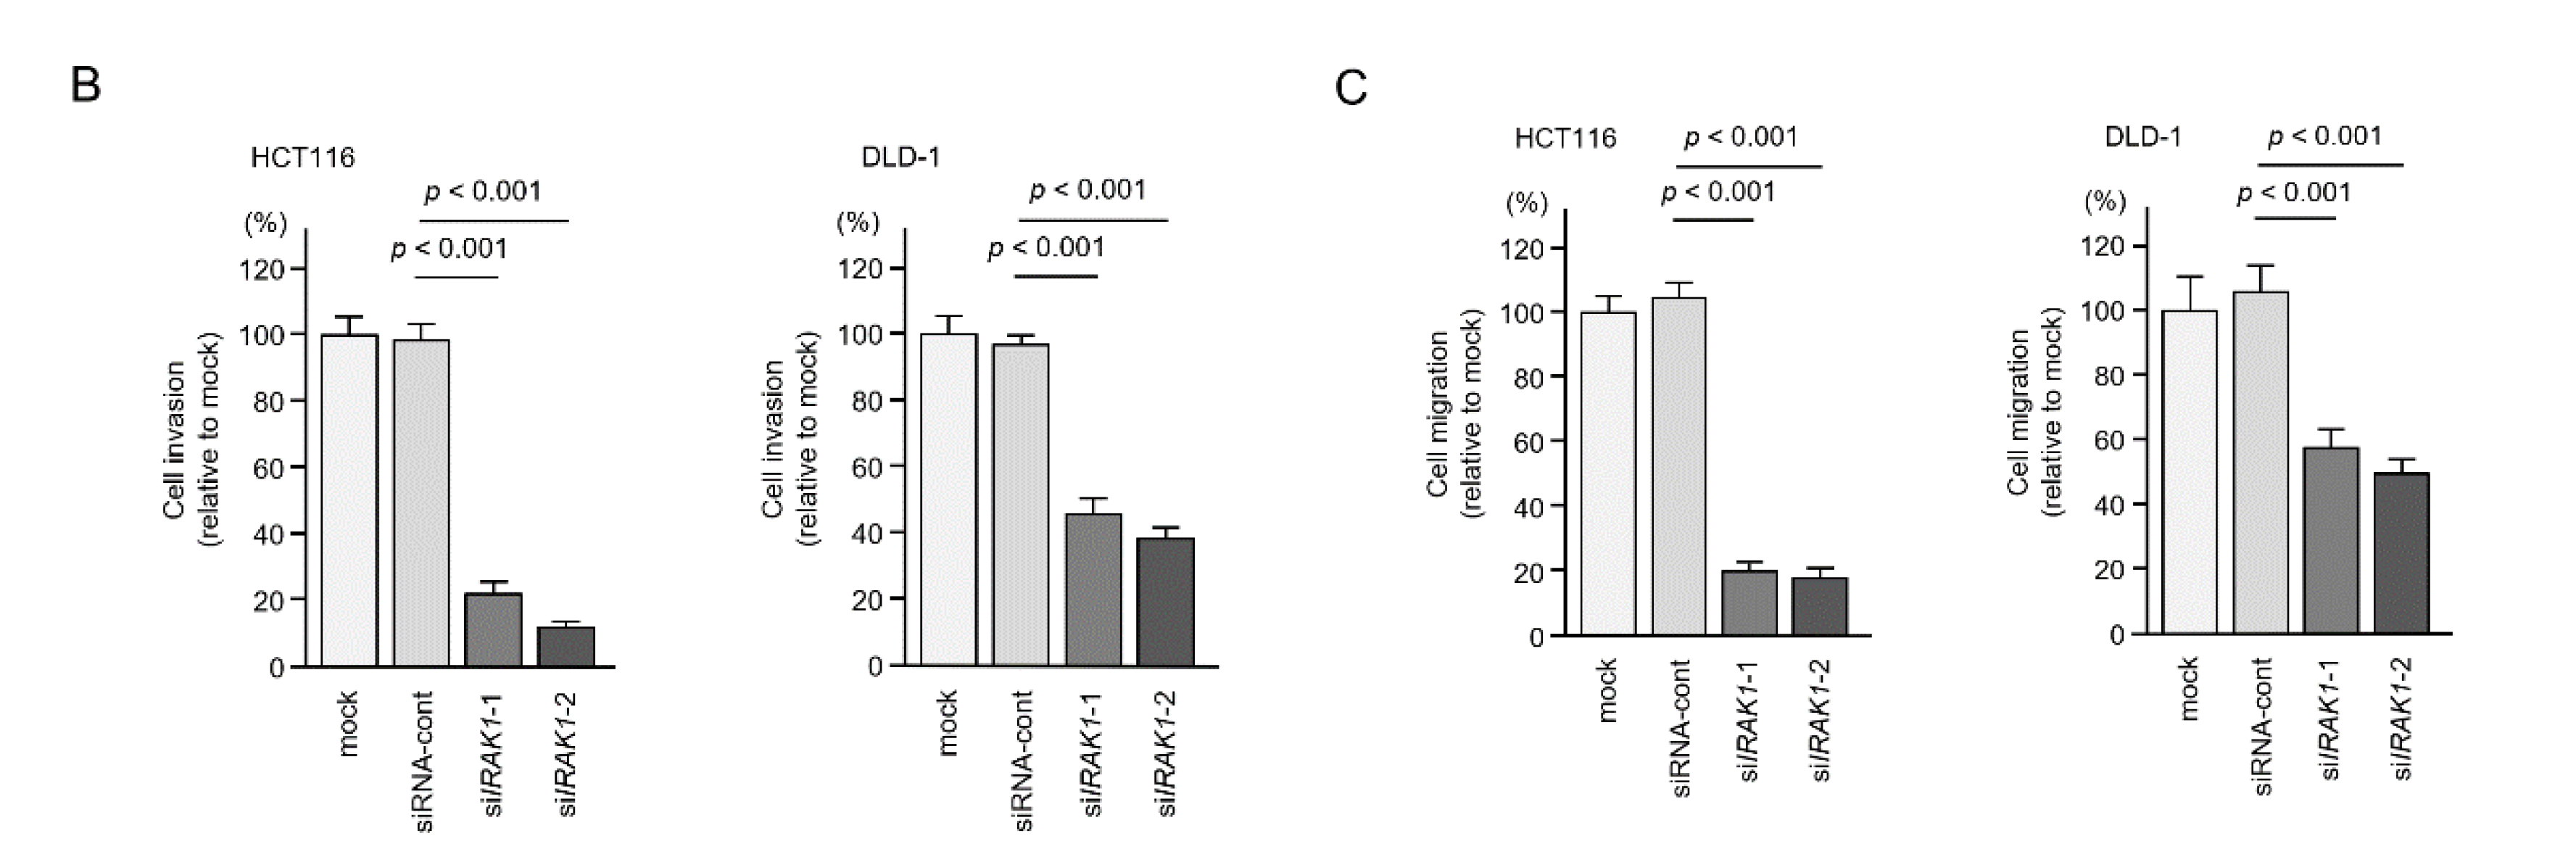
2.6. Effects of IRAK1 Knockdown in CRC Cells

To investigate the expression of IRAK1 mRNA/IRAK1 protein in CRC cells, we performed CRC knockdown assays using two different siRNAs. The expression levels of both IRAK1 mRNA and IRAK1 protein were markedly reduced by siIRAK1-1 and siIRAK1-2 in the two cell lines (Figure 8A,B).
By suppressing IRAK1 expression, cell proliferation assays showed no significant effects of these siRNA transfected into the two cell lines (Figure 9A), but migration and invasive abilities were significantly blocked in CRC cells (Figure 9B,C). These data suggested that aberrant expression of IRAK1 promoted cancer-related phenotypes in CRC cells.

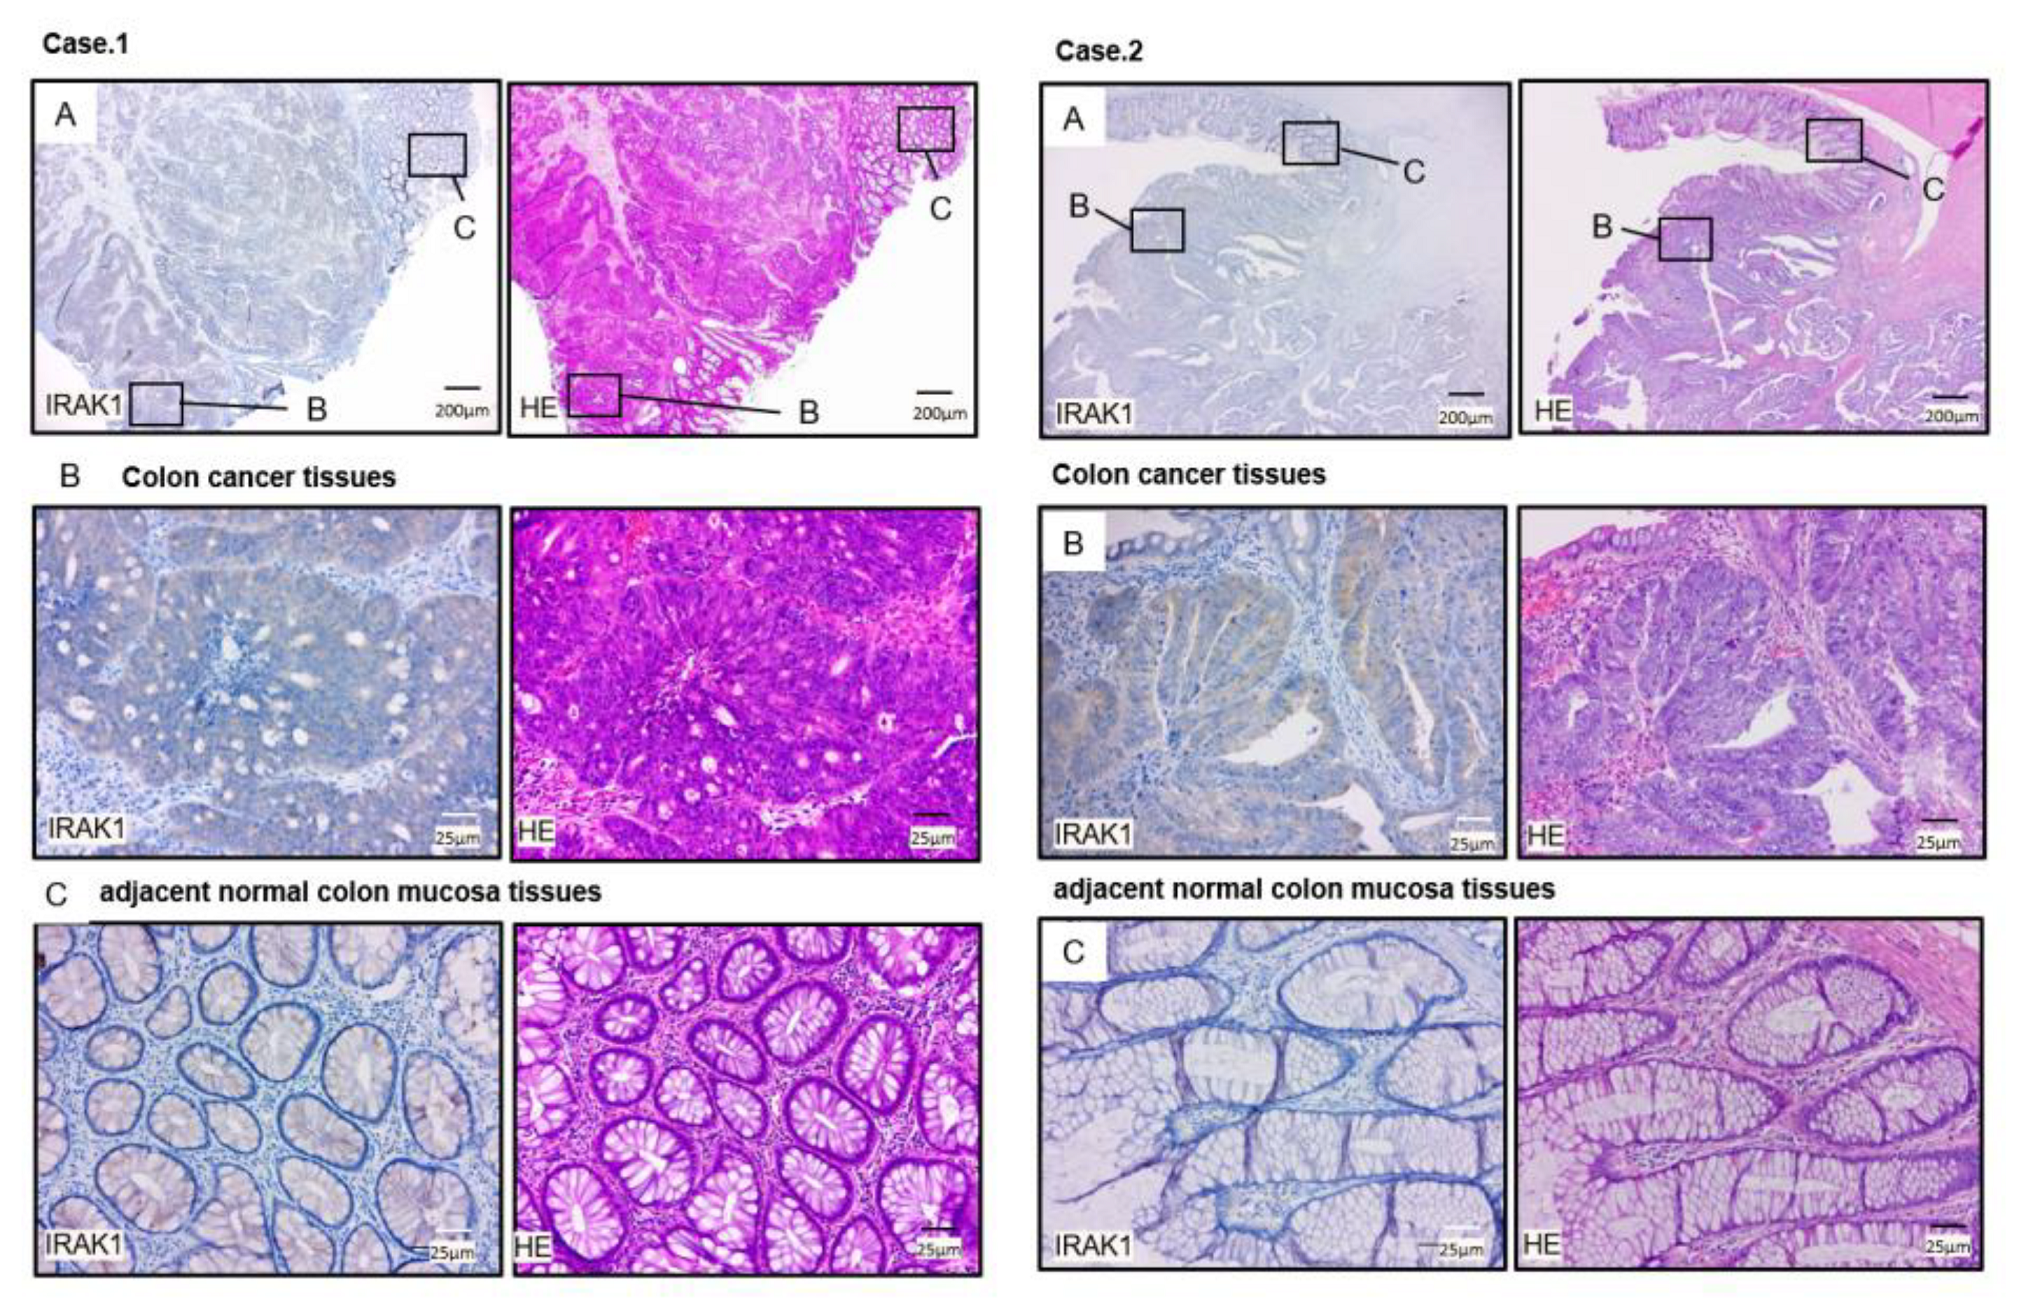
2.7. Expression of IRAK1 in CRC Clinical Specimens

We analyzed expression levels of IRAK1 (RNA-Sequence data in 275 colon cancer tissues compared to 349 normal colon tissues) using TCGA-COAD database through the GEPIA2 platform. Expression of IRAK1 was significantly upregulated (p < 0.01; Figure 6). In addition, immunohistochemistry was used to assess protein expression levels of IRAK1 in CRC clinical specimens, and high expression of IRAK1 were shown in cancer lesions (Figure 10).

3. Discussion

Clarifying the molecular pathogenesis of CRC based on the latest genomic analyses will contribute to the development of new treatment strategies for this disease. We have elucidated novel molecular pathogenesis using a miRNA-based approach in various carcinomas [26,27]. To date, high-throughput technologies (e.g., oligo-microarrays, PCR-based arrays, and RNA sequences) have enabled the construction of CRC miRNA expression signatures, revealing aberrant expression of many miRNAs [24,28,29,30,31,32,33,34]. Previous studies have shown that miR-490-3p, miR-195-5p, and miR-30a-5p, which are frequently downregulated in CRC, function as tumor-suppressive miRNA in CRC cells [25,35,36,37,38,39]. These miRNAs were included in the signature we created in this study. Importantly, for 16 pairs downregulated, both miRNA strands (−5p and −3p) were ectopically expressed in cancer tissues. Recently, it was suggested that the initial hypothesis that one of the two strands is degraded during miRNA biosynthesis may be incorrect [40]. Our recent studies show that some passenger miRNAs have a tumor suppressor function in cancer cells. (e.g., miR-148-5p, miR-145-3p, miR-143-5p, miR-30c-2-3p, and miR-30a-3p) [19,26,41,42]. Those miRNA duplexes and their target oncogenic genes are closely associated with cancer pathogenesis [19,26,41,42].
Growing body of studies showed that downregulation of miR-490-5p and miR-490-3p were closely associated with a wide range of human cancers [43]. Among them, we focused on miR-490-3p, which was the most down-regulated in our newly created signature. Previous study showed that downregulation of miR-490-3p was reported by high-throughput sequence-based analysis in CRC [24,25]. Moreover, several studies have shown that downregulation of miR-490-3p occurs frequently in several types of cancer (e.g., breast cancer, lung adenocarcinoma) and that this miRNA acts as a tumor suppressor [44,45,46]. These reports indicate that downregulation of miR-490-3p has a critical effect on human tumorigenesis, and it is an important issue to identify for target molecules of miR-490-3p in each cancer type.
Previous studies showed that tumor-suppressive function of miR-490-3p in CRC cells through targeting several oncogenic genes [35,36,47,48]. For example, ectopic expression of miR-490-3p blocked migration and invasion abilities in CRC cells [47]. Transfection of miR-490-3p inhibited cancer cell malignant phenotypes, e.g., cells proliferation, metastasis, invasion, and anti-apoptosis [36]. In addition, miR-490-3p directly regulated VDAC1 expression, and a negatively controlled VDAC1/AMPK/mTOR pathway [36]. Ectopic expression of miR-490-3p attenuated to cancer cell malignant transformation both in vitro and in vivo [48]. Additionally, miR-490-3p directly controlled RAB14 in CRC cells [48]. Expression of miR-490-3p affected cell viability and resistance to chemotherapy in CRC cells through regulating TNKS2 [35]. Our data also showed that ectopic expression of miR-490-3p significantly blocked malignant phenotypes of CRC cells, which is completely consistent with previous reports.
Next, we aimed to elucidate miR-490-3p-regulated oncogenes and oncogenic pathways in CRC cells. Our in silico analysis revealed that three genes (IRAK1, FUT1, and GPRIN2) were associated with poor prognosis. In this study, we focused on IRAK1 (interleukin-1 receptor-related kinase 1) because this kinase family is a target of drug discovery.
IRAK1 is one of the serine-threonine kinases that mediates the signaling pathways of toll-like receptors and the inflammatory mediator interleukin-1 [49,50]. Recent studies have revealed that IRAK1 is involved not only in inflammatory diseases but also in progression of several cancers [51,52,53,54]. In vivo, inhibition of IRAK1, in mice with colitis-induced tumorigenesis, reduced the inflammatory response and inhibited the epithelial–mesenchymal transition [55]. In the current study, we focused on IRAK1 and showed that its aberrant expression was closely associated with CRC malignant phenotypes. Further functional analyses of IRAK1 will possibly reveal the biological characteristics of CRC. Starting from tumor-suppressive miRNA, we identified effective prognostic markers and therapeutic targets for CRC, indicating that our miRNA-based strategy was feasible.

4. Materials and Methods

4.1. Patient Samples

CRC tissues and noncancerous tumor-adjacent tissues (27 each) were used to verify the expression status of miR-490-5p and miR-490-3p (Table S5). All samples were collected from patients who underwent surgical resection at Kagoshima University Hospital between 2014 and 2017. Written informed consent for the use of their specimens was obtained from all patients. The study was conducted according to the guidelines of the Declaration of Helsinki and approved by Ethics Committee of Kagoshima University (approval no. 160,038 28-65, date of approval: 19 March 2021)

4.2. CRC Cell Lines and Cell Culture

The two human CRC cell lines (HCT116 and DLD-1) were used in this study. HCT116 cells were obtained from the RIKEN Cell Bank (Tsukuba, Ibaraki, Japan) and DLD-1 cells were obtained from the Cell Resource Center for Biomedical Research/Cell Bank (Sendai, Miyagi, Japan). HCT116 was maintained in DMEM supplemented with 10% fetal bovine serum (FBS). DLD-1 was cultured in RPMI-1640 medium with 10% FBS.

4.3. Small RNA Sequencing

The small RNA sequencing and data mining process were performed as in previous studies [19,21]. Briefly, flesh frozen on dry ice using 10 samples (5 CRC tissues, and RNA was harvested using Trizol reagent). Illumina TruSeq Small RNA Sample Preparation Kit was used for the construction of sequencing libraries. miRNA libraries were prepared for sequencing using standard Illumina protocols. New miRNA expression signatures were generated using a next-generation sequencer HiSeq 2500 (Illumina, San Diego, CA, USA). Sequenced reads were trimmed for adaptor sequence, and masked for low-quality sequence using cutadapt v.1.2.1. A false discovery rate (FDR) less than 0.05 was considered significant. The present RNA sequencing data was deposited in GEO database (GSE183437).

4.4. RNA Extraction and qPCR

We performed RNA extraction from clinical samples, cell lines, and qRT-PCR using the methods we described previously [16,21]. According to the manufacturer’s protocol, total RNA was isolated from flesh frozen colorectal tissues and cell lines using TRIzol reagent. RNA quality was confirmed using an Agilent 2100 Bioanalyzer (Agilent Technologies, Santa Clara, CA, USA). Then, RNA sample reverse transcription was achieved with a High Capacity cDNA Reverse Transcription Kit (Applied Biosystems, Waltham, MA, USA). The qPCR was performed with a PCR Master Mix (Applied Biosystems, Waltham, MA, USA) real-time PC detection system (BioRad Laboratories, Hercules, CA, USA). RNU48 and GUSB were used as normalized controls. The reagents used in the analysis are listed in Table S6.

4.5. Transfection of Mature miRNAs, Small-Interfering RNAs, and Plasmid Vectors into CRC Cells

The miRNA precursors and siRNAs were obtained by Invitrogen (Thermo Fisher Scientific, Waltham, MA, USA). Transfection of miRNA precursors, siRNAs, or negative control miRNA/siRNA was performed with Lipofectamine™ RNAiMAX and that of plasmid vectors was performed with Lipofectamine™ 2000 (Thermo Fisher Scientific, Waltham, MA, USA). HCT116 and DLD-1 cells were transfected with 10 nM miRNA, siRNA, or negative control miRNA/siRNA. The reagents used in the process are listed in Table S6.

4.6. Cell Proliferation, Migration and Invasion Assays in CRC Cells

The methods used for functional assessment of CRC cells (e.g., proliferation, invasion, and migration) were outlined in previous studies [16,21]. In brief, for proliferation assays, cells were transferred to 96-well plates. HCT116 or DLD-1 cells were plated at 1.0 × 10⁴ cells per well. After 72 h, cell proliferation was evaluated using XTT assays. For migration and invasion assays, HCT116 cells or DLD-1 cells at 1.2 × 10⁵ were transfected in 6-well plates. After 72 h, HCT116 cells or DLD-1 cells were added into each chamber at 2.5 × 10⁵ per well. After 48 h, the cells on the lower surface were counted for analysis. All experiments were performed in triplicate.

4.7. Assay of miR-490-3p Incorporation into the RNA-Induced Silencing Complex (RISC)

Mature miR-490-3p and miR-490-5p were separately transfected into 1.2 × 10⁵ CRC cells (HCH116 and DLD-1) per ml. After 72 h, miRNA incorporated into the RISC were isolated using a human AGO2 miRNA isolation kit (Wako Pure Chemical Industries, Ltd., Osaka, Japan) according to the manufacturer’s protocol. Amount of incorporated miRNA was evaluated by RT-qPCR as described previously [56]. miR-21 was used as the internal control.

4.8. Candidate Target Genes Controlled by miR-490-3p in CRC Cells

To identify genes targeted by miR-490-3p, we obtained microarray data for HCT116 cells transfected with miR-490-3p. By combining these data with the Target Scan Human 7.2 database (http://www.targetscan.org/vert_71 (accessed on 12 May 2021)), we extracted a total of 249 possible target genes with mi-490-3p binding sites. Next, we analyzed the gene expression levels of 275 colon cancer tissues and 349 normal colon tissue samples in the Cancer Genome Atlas (TCGA)-COAD database via the GEPIA2 platform (https://cancergenome.nih.gov/ (accessed on 2 May 2021)) and thereby identified 38 oncogenic genes. Among those 38 genes, the expression of 3 genes showed statistically significant correlations with the 5-year overall survival rates of patients with CRC obtained from OncoLnc (http://www.oncolnc.org/ (accessed on 9 May 2021)). Our microarray data were deposited in the GEO database (GSE129043).

4.9. Dual-Luciferase Reporter Assays

The predicted binding site sequence of miR-490-3p in the 3′-UTR of IRAK1 was extracted from the TargetScanHuman database (https://www.targetscan.org/, release 7.2 (accessed on 12 May 2021)). Based on those data, a PsiCHECK-2 plasmid vector (Promega, Madison, Wisconsin, USA) containing wild-type was used. To generate the IRAK1 mutant reporter, the seed region of the IRAK1 3′-UTR was mutated to remove all complementarity to nucleotides of miR-490-3p. CRC cells were seeded into a 24-well plate. After being cultured overnight, CRC cells were co-transfected with the indicated vectors and miR precursor of miR-490-3p or negative control miRNA. Luciferase assays were performed 60 h after transfection using the Dual Luciferase Reporter Assay System (Promega). Normalized data were calculated as the Renilla/firefly luciferase activity ratio.

4.10. Western Blotting and Immunohistochemistry

The procedures for Western blotting and immunostaining were described previously [16,21]. Briefly, 21 µg of protein lysates were separated on 4–20% SDS PAGE Gel and transferred to PVDF membranes (Thermo Fisher Scientific). Membranes were blocked with skim milk and incubated with the indicated primary antibodies overnight at 4 °C. The antibodies used in this study are shown in Table S6. GAPDH was used as the internal control. We assessed expression of IRAK1 proteins by immunohistochemistry. The procedure for immunostaining was described previously.

4.11. Statistical Analyses

Differences between 2 groups were evaluated using Mann–Whitney U tests. Correlation coefficients were evaluated using Spearman’s test. All statistical analyses were performed using JMP Pro 15 (SAS Institute Inc., Cary, NC, USA). p-values < 0.05 were considered statistically significant, and all data are presented as the mean ± standard error (SE).

5. Conclusions

We created new RNA sequencing-based CRC miRNA signatures that revealed novel miRNAs that were aberrantly expressed. This miRNA signature laid the foundation for exploring a new molecular RNA network for CRC. Moreover, we revealed that IRAK1, regulated by miR-490-3p, may be a novel diagnostic and therapeutic target in CRC. Our approach, which utilized the analysis of miRNA signatures, could contribute to the elucidation of the molecular pathogenesis of cancer.

Supplementary Materials

Author Contributions

Conceptualization, Y.H. and N.S.; data curation, Y.H., Y.K. and R.Y.; formal analysis, Y.H. and T.I.; funding acquisition, N.S., T.T., T.I., M.W., H.T. and T.O.; investigation, Y.H., T.I. and K.T.; methodology, N.S.; project administration, N.S.; resources, T.I., H.K. and T.O.; supervision, T.O.; validation, S.A. and S.M. (Shogo Moriya); visualization, Y.H. and Y.K.; writing—original draft preparation, Y.H. and Y.K.; writing—review and editing, S.M. (Shinichiro Mori) and N.S. All authors have read and agreed to the published version of the manuscript.

Funding

The present study was supported by KAKENHI Grant Number JP18K08687, JP18K16322, JP19K09077, JP19K09049, JP19K09050, JP21K08783, JP21K16426, JP21K15597 and JP21K09577.

Institutional Review Board Statement

The study was conducted according to the guidelines of the Declaration of Helsinki and approved by Ethics Committee of Kagoshima University (approval no. 160038 28-65, date of approval: 19 March 2021).

Informed Consent Statement

Written prior informed consent and approval were obtained from all patients who were diagnosed with CRC and resected at Kagoshima University Hospital.

Data Availability Statement

The data presented in this study are available on request from the corresponding author.

Conflicts of Interest

The authors declare no conflict of interest.

References

  1. Bray, F.; Ferlay, J.; Soerjomataram, I.; Siegel, R.L.; Torre, L.A.; Jemal, A. Global cancer statistics 2018: Globocan estimates of incidence and mortality worldwide for 36 cancers in 185 countries. CA Cancer J. Clin. 2018, 68, 394–424. [Google Scholar] [CrossRef] [Green Version]
  2. Dekker, E.; Tanis, P.J.; Vleugels, J.L.A.; Kasi, P.M.; Wallace, M.B. Colorectal cancer. Lancet 2019, 394, 1467–1480. [Google Scholar] [CrossRef]
  3. Siegel, R.L.; Miller, K.D.; Goding Sauer, A.; Fedewa, S.A.; Butterly, L.F.; Anderson, J.C.; Cercek, A.; Smith, R.A.; Jemal, A. Colorectal cancer statistics, 2020. CA Cancer J. Clin. 2020, 70, 145–164. [Google Scholar] [CrossRef] [Green Version]
  4. Carlomagno, C.; De Stefano, A.; Rosanova, M.; De Falco, S.; Attademo, L.; Fiore, G.; De Placido, S. Multiple treatment lines and prognosis in metastatic colorectal cancer patients. Cancer Metastasis Rev. 2019, 38, 307–313. [Google Scholar] [CrossRef] [PubMed]
  5. Leslie, A.; Carey, F.A.; Pratt, N.R.; Steele, R.J. The colorectal adenoma–carcinoma sequence. BJS 2002, 89, 845–860. [Google Scholar] [CrossRef] [PubMed] [Green Version]
  6. Grady, W.M.; Markowitz, S.D. The Molecular Pathogenesis of Colorectal Cancer and Its Potential Application to Colorectal Cancer Screening. Dig. Dis. Sci. 2015, 60, 762–772. [Google Scholar] [CrossRef] [PubMed] [Green Version]
  7. The Cancer Genome Atlas Network. Comprehensive molecular characterization of human colon and rectal cancer. Nature 2012, 487, 330–337. [Google Scholar] [CrossRef] [PubMed] [Green Version]
  8. Bala, P.; Singh, A.K.; Kavadipula, P.; Kotapalli, V.; Sabarinathan, R.; Bashyam, M.D. Exome sequencing identifies ARID2 as a novel tumor suppressor in early-onset sporadic rectal cancer. Oncogene 2021, 40, 863–874. [Google Scholar] [CrossRef]
  9. Anfossi, S.; Babayan, A.; Pantel, K.; Calin, G.A. Clinical utility of circulating non-coding RNAs—An update. Nat. Rev. Clin. Oncol. 2018, 15, 541–563. [Google Scholar] [CrossRef]
  10. Esteller, M. Non-coding RNAs in human disease. Nat. Rev. Genet. 2011, 12, 861–874. [Google Scholar] [CrossRef] [PubMed]
  11. Panni, S.; Lovering, R.C.; Porras, P.; Orchard, S. Non-coding RNA regulatory networks. Biochim. Biophys. Acta Bioenerg. 2020, 1863, 194417. [Google Scholar] [CrossRef]
  12. Anastasiadou, E.; Jacob, L.S.; Slack, F.J. Non-coding RNA networks in cancer. Nat. Rev. Cancer 2018, 18, 5–18. [Google Scholar] [CrossRef]
  13. Liu, X.; Hao, L.; Li, D.; Zhu, L.; Hu, S. Long Non-coding RNAs and Their Biological Roles in Plants. Genom. Proteom. Bioinform. 2015, 13, 137–147. [Google Scholar] [CrossRef] [Green Version]
  14. Ha, M.; Kim, V.N. Regulation of microRNA biogenesis. Nat. Rev. Mol. Cell Biol. 2014, 15, 509–524. [Google Scholar] [CrossRef]
  15. He, L.; Hannon, G.J. MicroRNAs: Small RNAs with a big role in gene regulation. Nat. Rev. Genet. 2004, 5, 522–531. [Google Scholar] [CrossRef]
  16. Idichi, T.; Seki, N.; Kurahara, H.; Fukuhisa, H.; Toda, H.; Shimonosono, M.; Yamada, Y.; Arai, T.; Kita, Y.; Kijima, Y.; et al. Involvement of anti-tumor miR-124-3p and its targets in the pathogenesis of pancreatic ductal adenocarcinoma: Direct regulation of ITGA3 and ITGB1 by miR-124-3p. Oncotarget 2018, 9, 28849–28865. [Google Scholar] [CrossRef]
  17. Goto, Y.; Kojima, S.; Nishikawa, R.; Enokida, H.; Chiyomaru, T.; Kinoshita, T.; Nakagawa, M.; Naya, Y.; Ichikawa, T.; Seki, N. The microRNA-23b/27b/24-1 cluster is a disease progression marker and tumor suppressor in prostate cancer. Oncotarget 2014, 5, 7748–7759. [Google Scholar] [CrossRef] [Green Version]
  18. Xie, N.; Meng, Q.; Zhang, Y.; Luo, Z.; Xue, F.; Liu, S.; Li, Y.; Huang, Y. MicroRNA-142-3p suppresses cell proliferation, invasion and epithelial-to-mesenchymal transition via RAC1-ERK1/2 signaling in colorectal cancer. Mol. Med. Rep. 2021, 24, 1–12. [Google Scholar] [CrossRef] [PubMed]
  19. Wada, M.; Goto, Y.; Tanaka, T.; Okada, R.; Moriya, S.; Idichi, T.; Noda, M.; Sasaki, K.; Kita, Y.; Kurahara, H.; et al. RNA sequencing-based microRNA expression signature in esophageal squamous cell carcinoma: Oncogenic targets by antitumor miR-143-5p and miR-143-3p regulation. J. Hum. Genet. 2020, 65, 1019–1034. [Google Scholar] [CrossRef] [PubMed]
  20. Toda, H.; Kurozumi, S.; Kijima, Y.; Idichi, T.; Shinden, Y.; Yamada, Y.; Arai, T.; Maemura, K.; Fujii, T.; Horiguchi, J.; et al. Molecular pathogenesis of triple-negative breast cancer based on microRNA expression signatures: Antitumor miR-204-5p targets AP1S3. J. Hum. Genet. 2018, 63, 1197–1210. [Google Scholar] [CrossRef] [PubMed]
  21. Yonemori, K.; Seki, N.; Idichi, T.; Kurahara, H.; Osako, Y.; Koshizuka, K.; Arai, T.; Okato, A.; Kita, Y.; Arigami, T.; et al. The microRNA expression signature of pancreatic ductal adenocarcinoma by RNA sequencing: Anti-tumour functions of the microRNA-216 cluster. Oncotarget 2017, 8, 70097–70115. [Google Scholar] [CrossRef] [Green Version]
  22. Pantaleão, L.C.; Ozanne, S. Small RNA Sequencing: A Technique for miRNA Profiling. Methods Mol. Biol. 2018, 1735, 321–330. [Google Scholar] [CrossRef] [PubMed]
  23. Xing, X.L.; Yao, Z.Y.; Zhang, T.; Zhu, N.; Liu, Y.W.; Peng, J. MicroRNA-Related Prognosis Biomarkers from High-Throughput Sequencing Data of Colorectal Cancer. Biomed. Res. Int. 2020, 2020, 7905380. [Google Scholar] [CrossRef]
  24. Neerincx, M.; Sie, D.; Buffart, T.E.; Verheul, H.M.W.; Van Der Wiel, M.A.; Van Grieken, N.C.T.; Burggraaf, J.D.; Dekker, H.; Eijk, P.P.; Ylstra, B.; et al. MiR expression profiles of paired primary colorectal cancer and metastases by next-generation sequencing. Oncogenesis 2015, 4, e170. [Google Scholar] [CrossRef] [Green Version]
  25. Hamfjord, J.; Stangeland, A.M.; Hughes, T.; Skrede, M.L.; Tveit, K.M.; Ikdahl, T.; Kure, E.H. Differential Expression of miRNAs in Colorectal Cancer: Comparison of Paired Tumor Tissue and Adjacent Normal Mucosa Using High-Throughput Sequencing. PLoS ONE 2012, 7, e34150. [Google Scholar] [CrossRef] [PubMed]
  26. Tanaka, T.; Okada, R.; Hozaka, Y.; Wada, M.; Moriya, S.; Satake, S.; Idichi, T.; Kurahara, H.; Ohtsuka, T.; Seki, N. Molecular Pathogenesis of Pancreatic Ductal Adenocarcinoma: Impact of miR-30c-5p and miR-30c-2-3p Regulation on Oncogenic Genes. Cancers 2020, 12, 2731. [Google Scholar] [CrossRef]
  27. Kawagoe, K.; Wada, M.; Idichi, T.; Okada, R.; Yamada, Y.; Moriya, S.; Okubo, K.; Matsushita, D.; Arigami, T.; Kurahara, H.; et al. Regulation of aberrantly expressed SERPINH1 by antitumor miR-148a-5p inhibits cancer cell aggressiveness in gastric cancer. J. Hum. Genet. 2020, 65, 647–656. [Google Scholar] [CrossRef] [PubMed]
  28. Del Vecchio, F.; Mastroiaco, V.; Di Marco, A.; Compagnoni, C.; Capece, D.; Zazzeroni, F.; Capalbo, C.; Alesse, E.; Tessitore, A. Next-generation sequencing: Recent applications to the analysis of colorectal cancer. J. Transl. Med. 2017, 15, 1–19. [Google Scholar] [CrossRef] [Green Version]
  29. Röhr, C.; Kerick, M.; Fischer, A.; Kühn, A.; Kashofer, K.; Timmermann, B.; Daskalaki, A.; Meinel, T.; Drichel, D.; Börno, S.T.; et al. High-Throughput miRNA and mRNA Sequencing of Paired Colorectal Normal, Tumor and Metastasis Tissues and Bioinformatic Modeling of miRNA-1 Therapeutic Applications. PLoS ONE 2013, 8, e67461. [Google Scholar] [CrossRef]
  30. Lee, J.; Hong, H.K.; Peng, S.B.; Kim, T.W.; Lee, W.Y.; Yun, S.H.; Kim, H.C.; Liu, J.; Ebert, P.J.; Aggarwal, A.; et al. Identifying metastasis-initiating miRNA-target regulations of colorectal cancer from expressional changes in primary tumors. Sci. Rep. 2020, 10, 14919. [Google Scholar] [CrossRef]
  31. Bandrés, E.; Cubedo, E.; Agirre, X.; Malumbres, R.; Zárate, R.; Ramirez, N.; Abajo, A.; Navarro, A.; Moreno, I.; Monzó, M.; et al. Identification by Real-time PCR of 13 mature microRNAs differentially expressed in colorectal cancer and non-tumoral tissues. Mol. Cancer 2006, 5, 29. [Google Scholar] [CrossRef] [Green Version]
  32. Sarver, A.L.; French, A.J.; Borralho, P.M.; Thayanithy, V.; Oberg, A.L.; Silverstein, K.A.; Morlan, B.W.; Riska, S.M.; Boardman, L.A.; Cunningham, J.M.; et al. Human colon cancer profiles show differential microRNA expression depending on mismatch repair status and are characteristic of undifferentiated proliferative states. BMC Cancer 2009, 9, 401. [Google Scholar] [CrossRef] [Green Version]
  33. Schetter, A.J.; Leung, S.Y.; Sohn, J.J.; Zanetti, K.A.; Bowman, E.D.; Yanaihara, N.; Yuen, S.T.; Chan, T.L.; Kwong, D.L.W.; Au, G.K.H.; et al. MicroRNA Expression Profiles Associated with Prognosis and Therapeutic Outcome in Colon Adenocarcinoma. JAMA 2008, 299, 425–436. [Google Scholar] [CrossRef] [Green Version]
  34. Cummins, J.M.; He, Y.; Leary, R.J.; Pagliarini, R.; Diaz, L.; Sjoblom, T.; Barad, O.; Bentwich, Z.; Szafranska, A.E.; Labourier, E.; et al. The colorectal microRNAome. Proc. Natl. Acad. Sci. USA 2006, 103, 3687–3692. [Google Scholar] [CrossRef] [Green Version]
  35. Li, J.; Mo, R.; Zheng, L. MicroRNA-490-3p inhibits migration and chemoresistance of colorectal cancer cells via targeting TNKS2. World J. Surg. Oncol. 2021, 19, 117. [Google Scholar] [CrossRef] [PubMed]
  36. Liu, X.; He, B.; Xu, T.; Pan, Y.; Hu, X.; Chen, X.; Wang, S. MiR-490-3p Functions as a Tumor Suppressor by Inhibiting Oncogene VDAC1 Expression in Colorectal Cancer. J. Cancer 2018, 9, 1218–1230. [Google Scholar] [CrossRef] [Green Version]
  37. Wang, L.; Guo, J.; Zhou, J.; Wang, D.; Kang, X.; Zhou, L. NF-κB maintains the stemness of colon cancer cells by downregulating miR-195-5p/497-5p and upregulating MCM2. J. Exp. Clin. Cancer Res. 2020, 39, 225. [Google Scholar] [CrossRef]
  38. Koduru, S.V.; Tiwari, A.K.; Hazard, S.W.; Mahajan, M.; Ravnic, D.J. Exploration of small RNA-seq data for small non-coding RNAs in Human Colorectal Cancer. Int. J. Genom. 2017, 5, 16–31. [Google Scholar] [CrossRef] [Green Version]
  39. Yu, D.; Liu, H.; Qin, J.; Huangfu, M.; Guan, X.; Li, X.; Zhou, L.; Dou, T.; Liu, Y.; Wang, L.; et al. Curcumol inhibits the viability and invasion of colorectal cancer cells via miR-30a-5p and Hippo signaling pathway. Oncol. Lett. 2021, 21, 1–13. [Google Scholar] [CrossRef]
  40. Mitra, R.; Adams, C.M.; Jiang, W.; Greenawalt, E.; Eischen, C.M. Pan-cancer analysis reveals cooperativity of both strands of microRNA that regulate tumorigenesis and patient survival. Nat. Commun. 2020, 11, 1–15. [Google Scholar] [CrossRef] [Green Version]
  41. Idichi, T.; Seki, N.; Kurahara, H.; Fukuhisa, H.; Toda, H.; Shimonosono, M.; Okato, A.; Arai, T.; Kita, Y.; Mataki, Y.; et al. Molecular pathogenesis of pancreatic ductal adenocarcinoma: Impact of passenger strand of pre-miR-148a on gene regulation. Cancer Sci. 2018, 109, 2013–2026. [Google Scholar] [CrossRef] [PubMed] [Green Version]
  42. Shimomura, H.; Okada, R.; Tanaka, T.; Hozaka, Y.; Wada, M.; Moriya, S.; Idichi, T.; Kita, Y.; Kurahara, H.; Ohtsuka, T.; et al. Role of miR-30a-3p Regulation of Oncogenic Targets in Pancreatic Ductal Adenocarcinoma Pathogenesis. Int. J. Mol. Sci. 2020, 21, 6459. [Google Scholar] [CrossRef]
  43. Li, Y.; Tian, D.; Chen, H.; Cai, Y.; Chen, S.; Duan, S. MicroRNA-490-3p and -490-5p in carcinogenesis: Separate or the same goal? Oncol. Lett. 2021, 22, 678. [Google Scholar] [CrossRef] [PubMed]
  44. Zheng, X.; Zhao, L. MicroRNA-490 inhibits tumorigenesis and progression in breast cancer. Oncol. Targets Ther. 2016, 9, 4505–4516. [Google Scholar] [CrossRef] [Green Version]
  45. Jia, Z.; Liu, Y.; Gao, Q.; Han, Y.; Zhang, G.; Xu, S.; Cheng, K.; Zou, W. miR-490-3p inhibits the growth and invasiveness in triple-negative breast cancer by repressing the expression of TNKS2. Gene 2016, 593, 41–47. [Google Scholar] [CrossRef]
  46. Li, Z.; Jiang, D.; Yang, S. MiR-490-3p Inhibits the Malignant Progression of Lung Adenocarcinoma. Cancer Manag. Res. 2020, 12, 10975–10984. [Google Scholar] [CrossRef]
  47. Xu, X.; Chen, R.; Li, Z.; Huang, N.; Wu, X.; Li, S.; Li, Y.; Wu, S. MicroRNA-490-3p inhibits colorectal cancer metastasis by targeting TGFβR1. BMC Cancer 2015, 15, 1–10. [Google Scholar] [CrossRef] [Green Version]
  48. Wang, B.; Yin, M.; Cheng, C.; Jiang, H.; Jiang, K.; Shen, Z.; Ye, Y.; Wang, S. Decreased expression of miR-490-3p in colorectal cancer predicts poor prognosis and promotes cell proliferation and invasion by targeting RAB14. Int. J. Oncol. 2018, 53, 1247–1256. [Google Scholar] [CrossRef]
  49. Flannery, S.; Bowie, A.G. The interleukin-1 receptor-associated kinases: Critical regulators of innate immune signalling. Biochem. Pharmacol. 2010, 80, 1981–1991. [Google Scholar] [CrossRef]
  50. Rhyasen, G.W.; Starczynowski, D.T. IRAK signalling in cancer. Br. J. Cancer 2015, 112, 232–237. [Google Scholar] [CrossRef] [Green Version]
  51. Wee, Z.N.; Yatim, S.M.; Kohlbauer, V.K.; Feng, M.; Goh, J.Y.; Bao, Y.; Lee, P.L.; Zhang, S.; Wang, P.P.; Lim, E.; et al. IRAK1 is a therapeutic target that drives breast cancer metastasis and resistance to paclitaxel. Nat. Commun. 2015, 6, 8746. [Google Scholar] [CrossRef] [PubMed]
  52. Wang, Y.; Wang, Y.; Duan, X.; Wang, Y.; Zhang, Z. Interleukin-1 receptor-associated kinase 1 correlates with metastasis and invasion in endometrial carcinoma. J. Cell Biochem. 2018, 119, 2545–2555. [Google Scholar] [CrossRef]
  53. Adams, A.K.; Bolanos, L.C.; Dexheimer, P.J.; Karns, R.A.; Aronow, B.J.; Komurov, K.; Jegga, A.G.; Casper, K.A.; Patil, Y.J.; Wilson, K.M.; et al. IRAK1 is a novel DEK transcriptional target and is essential for head and neck cancer cell survival. Oncotarget 2015, 6, 43395–43407. [Google Scholar] [CrossRef] [Green Version]
  54. Singer, J.W.; Fleischman, A.; Al-Fayoumi, S.; Mascarenhas, J.O.; Yu, Q.; Agarwal, A. Inhibition of interleukin-1 receptor-associated kinase 1 (IRAK1) as a therapeutic strategy. Oncotarget 2018, 9, 33416–33439. [Google Scholar] [CrossRef] [Green Version]
  55. Feng, Z.; Duan, Z.; Shi, G.; Wang, Q.; Zhou, J.; Chen, Y. Pharmacological inhibition of IRAK1 attenuates colitis-induced tumorigenesis in mice by inhibiting the inflammatory response and epithelial–mesenchymal transition. J. Biochem. Mol. Toxicol. 2021, e22838. [Google Scholar] [CrossRef]
  56. Toda, H.; Seki, N.; Kurozumi, S.; Shinden, Y.; Yamada, Y.; Nohata, N.; Moriya, S.; Idichi, T.; Maemura, K.; Fujii, T.; et al. RNA-sequence-based microRNA expression signature in breast cancer: Tumor-suppressive miR-101-5p regulates molecular pathogenesis. Mol. Oncol. 2020, 14, 426–446. [Google Scholar] [CrossRef] [Green Version]
Figure 1. Chromosome mapping of aberrantly upregulated miRNAs in colorectal cancer (CRC). Upregulated miRNAs in CRC tissues are mapped on human chromosomes. A total of 84 miRNAs are identified by our RNA sequence based signature.
Ijms 22 09876 g001
Figure 2. Chromosome mapping of aberrantly downregulated miRNAs in colorectal cancer (CRC). Downregulated miRNAs in CRC tissues are mapped on human chromosomes. A total of 70 miRNAs are identified by our RNA sequence based signature. In order to ensure the validity of our signature created in this study, we compared to previous miRNA signatures of CRC [23,24,25]. Two miRNAs, miR-592 (upregulated miRNA) and miR-139-5p (downregulated miRNA) were common miRNAs to all four independent signatures (Table S4). Eight miRNAs, miR-335-3p, miR-552-5p, miR-3180-5p, miR-301b and miR-3144-3p (upregulated miRNA), and miR-378a-5p, miR-490-3p, and miR-422a were common to multiple independent signatures (Table S4). These signatures suggest that aberrant expressed miRNAs, listed in multiple studies, play a vital role in CRC tumorigenesis.
Ijms 22 09876 g002
Figure 3. Expression of miR-490-5p and miR-490-3p by small RNA sequencing and expression of miR-490-5p and miR-490-3p in colorectal cancer (CRC) tissues and cell lines. (A) Volcano plot of the miRNA expression signature determined by RNA sequencing. The log2 fold-change (FC) is plotted on the x-axis, and the −log10 (p-value) is plotted on the y-axis. The blue points represent the downregulated miRNAs with an absolute −log2 FC ≥ 1 (FC = 2) and p-value < 0.05. (B) The expression levels of miR-490-5p and miR-490-3p, by quantitative polymerase chain reaction, were evaluated in CRC clinical tissues and cell lines (HCT116 and DLD-1). Expression levels of these miRNAs were significantly reduced in cancer tissues (p < 0.001). (C) Spearman’s rank test showed positive correlations between the expression levels of miR-490-5p and miR-490-3p in clinical specimens (r = 0.957, p < 0.001).
Ijms 22 09876 g003
Figure 4. Tumor-suppressive roles of miR-490-5p and miR-490-3p in colorectal cancer (CRC) cells (HCT116 and DLD-1). Functional assays of miR-490-5p and miR-490-3p in CRC cells using miRNAs precursors. (A) Cell proliferation, assessed by XTT assay, 72 h after transfection of mature miRNAs (B) Cell invasion, determined by Matrigel invasion assay, 48 h after seeding inhibitor-transfected cells into the chambers. (C) Cell migration assessed, using a membrane culture system, 48 h after seeding inhibitor-transfected cells into the chambers.
Ijms 22 09876 g004
Figure 5. Flowchart for searching for oncogenic targets subject to miR-490-3p regulation in colorectal cancer (CRC) cells. To identify genes controlled by miR-490-3p in CRC cells, we used the TargetScan database and gene expression profile of miR-490-3p transfected HCT116 cells (GEO accession number: GSE129043). Moreover, GEPIA2 database analysis was used to identify upregulated genes in CRC tissues. A total of 38 genes were identified as possibly controlled by miR-490-3p in CRC cells.
Ijms 22 09876 g005
Figure 6. Clinical significance of miR-490-3p target genes (IRAK1, FUT1, and GPRIN2) in CRC cohort data analysis. Among 38 putative target genes, 3 genes (IRAK1, FUT1 and GPRIN2) were significantly associated with poor prognosis in patients with colorectal cancer (p < 0.05). Kaplan–Meier curves for 5-year overall survivals of 3 genes are shown at left side. Patients were divided into high and low groups (relative to median expression) according to miRNA expression. The red line shows the high expression group, and the blue line shows the low expression group. Expression levels of three genes (IRAK1, FUT1, and GPRIN2) in CRC tissues and normal tissues obtained from TCGA-COAD, based on the GEPIA2 platform, are shown at the right side.
Ijms 22 09876 g006
Figure 7. Direct regulation of IRAK1 expression by miR-490-3p in colorectal cancer (CRC) cells (HCT116 and DLD-1). (A) Real-time PCR showing significantly reduced expression of IRAK1 mRNA at 72 h after miR-490-3p transfection in CRC cells. Expression of GAPDH was used as an internal control. (B) Western blot showing reduced expression of IRAK1 protein at 72 h after miR-490-3p transfection in CRC cells. Expression of GAPDH was used as an internal control. (C) One putative miR-490-3p binding site predicted within the 3′-UTR of IRAK1 by TargetScanHuman analyses (upper panel). Dual luciferase reporter assays showed reduced luminescence activity after cotransfection of the wild-type IRAK1 3′-UTR sequence (containing the miR-490-3p binding site) with miR-490-3p in CRC cells (lower panel). Normalized data were calculated as the Renilla/firefly luciferase activity ratio (N.S., not significant).
Ijms 22 09876 g007
Figure 8. Knockdown efficiencies of IRAK1 expression by siRNAs in colorectal cancer (CRC) cells. Two different siRNAs, siIRAK1-1 and siIRAK1-2 were used. (A) Real-time PCR showing significantly reduced expression of IRAK1 mRNA 72 h after either siIRAK1-1 or siIRAK1-2 transfection in CRC cells (HCT116 and DLD-1). Expression of GAPDH was used as an internal control. (B) Western blots showing reduced expression of IRAK1 protein 72 h after siIRAK1-1 or siIRAK1-2 transfection in CRC cells. Expression of GAPDH was used as an internal control.
Ijms 22 09876 g008
Figure 9. Effects of knockdown of IRAK1 in colorectal cancer (CRC) cells (HCT116 and DLD-1). Functional assays of IRAK1 (siIRAK1-1 and siIRAK1-2 transfection) in CRC cells. (A) Cell proliferation assessed by XTT assay 72 h after transfection of siRNA (B) Cell invasion determined by Matrigel invasion assay 48 h after seeding inhibitor-transfected cells into the chambers. (C) Cell migration assessed using a membrane culture system 48 h after seeding inhibitor-transfected cells into the chambers.
Ijms 22 09876 g009aIjms 22 09876 g009b
Figure 10. IRAK1 was high expression in colorectal tissues compared to adjacent normal colon tissues as demonstrated. The representative clinical sections of samples from case 1 (patient number 8) and case 2 (patient number 17) are shown. (A) Microscopic finding of immunohistochemical staining for IRAK1 on the left side and hematoxylin and eosin (H&E) staining on the right side were shown (magnification, ×20). Areas in the boxes are shown magnified at colon cancer tissue (B) and adjacent normal colon mucosa tissue (C). (B) Immunohistochemical staining for IRAK1 H&E staining in the colon cancer cell were shown (magnification, ×200). (C) Immunohistochemical staining for IRAK1 and H&E staining and in the normal colon epithelial cells were shown (magnification, ×200).
Ijms 22 09876 g010
Table 1. Clinicopathological features of five colorectal cancer (CRC) patients whose CRC tissue and normal colorectal tissue were analyzed to generate the CRC miRNA signature.
No.Age (Years)SexLocationDifferentiationTNMStagelyvRecurrence
166MaleRectumModerate31a0IIIB01
266MaleColon(S)Moderate31a0IIIB11
379MaleRectumModerate32a0IIIB11
478FemaleColon(S)Moderate300IIA01
583FemaleColon(S)Moderate31a0IIIB10
ly, lymphatic invasion; M, metastasis; N, nodes; T, tumor; v, venous invasion; colon (S), sigmoid colon.
Table 2. Candidate genes of miR-490-3p targets in CRC cells.
Entrez
Gene ID
Gene
Symbol
Gene NameBinding SitesHCT116
miR-490-3p
Transfectant
log2 FC ≤ 1
OncoLnc 5 yrs
(p-Value *)
9721GPRIN2G protein regulated inducer of neurite outgrowth 21−2.31305980.008
3654IRAK1interleukin-1 receptor-associated kinase 11−1.05981250.0427
2523FUT1fucosyltransferase 1 (galactoside 2-alpha-L-fucosyltransferase, H blood group)1−1.52359680.0468
135112NCOA7nuclear receptor coactivator 71−1.1772080.0585
84061MAGT1magnesium transporter 11−1.50501920.0799
6382SDC1syndecan 11−1.03367910.088
3635INPP5Dinositol polyphosphate-5-phosphatase, 145 kDa1−1.20421270.1059
3178HNRNPA1heterogeneous nuclear ribonucleoprotein A13−1.64666460.1496
84152PPP1R1Bprotein phosphatase 1, regulatory (inhibitor) subunit 1B1−2.4598180.163
56886UGGT1UDP-glucose glycoprotein glucosyltransferase 11−1.08721450.2326
8529CYP4F2cytochrome P450, family 4, subfamily F, polypeptide 21−2.59926750.2469
647024C6orf132chromosome 6 open reading frame 1322−1.26319980.3329
10525HYOU1hypoxia up-regulated 12−1.62245880.3420
2444FRKfyn-related kinase2−1.21275040.3546
154796AMOTangiomotin1−1.03760370.3709
23446SLC44A1solute carrier family 44 (choline transporter), member 12−1.14564990.4167
440145MZT1mitotic spindle organizing protein 11−1.05969240.4636
28985MCTS1malignant T cell amplified sequence 11−1.07541050.4927
4642MYO1Dmyosin ID1−1.12912420.5085
84187TMEM164transmembrane protein 1641−1.07235460.5172
80223RAB11FIP1RAB11 family interacting protein 1 (class I)2−1.3744270.5477
8635RNASET2ribonuclease T21−1.48263380.5618
3146HMGB1high mobility group box 11−1.84013180.5719
340706VWA2von Willebrand factor A domain containing 21−1.33710190.6107
51561IL23Ainterleukin 23, alpha subunit p191−1.15644180.6474
6850SYKspleen tyrosine kinase1−1.0656370.6535
2232FDXRferredoxin reductase1−1.00800340.7008
2525FUT3fucosyltransferase 3 (galactoside 3(4)-L-fucosyltransferase, Lewis blood group)1−2.24993680.7117
7416VDAC1voltage-dependent anion channel 12−1.38665580.7136
80201HKDC1hexokinase domain containing 11−2.34327220.7136
196264MPZL3myelin protein zero-like 31−1.08346690.7250
3703STT3ASTT3A, subunit of the oligosaccharyltransferase complex (catalytic)1−1.68531910.7465
7039TGFAtransforming growth factor, alpha2−1.02810870.7569
4494MT1Fmetallothionein 1F1−1.74031150.7756
6523SLC5A1solute carrier family 5 (sodium/glucose cotransporter), member 11−2.39842820.8507
6653SORL1sortilin-related receptor, L (DLR class) A repeats containing1−1.07424460.853
201595STT3BSTT3B, subunit of the oligosaccharyltransferase complex (catalytic)1−2.00692180.0046
345079SOWAHBsosondowah ankyrin repeat domain family member B1−1.86731390.0519
* Kaplan-Meier analysis log-rank p-value < 0.05. Bold values, Kaplan-Meier analysis log-rank p-value < 0.05, poor prognosis with a high expression. Italic value, Kaplan-Meier analysis log-rank p-value < 0.05, poor prognosis with a low expression.
Publisher’s Note: MDPI stays neutral with regard to jurisdictional claims in published maps and institutional affiliations.

