
Microcystin-LR (MC-LR) Triggers Inflammatory Responses in Macrophages

 , , , , , and
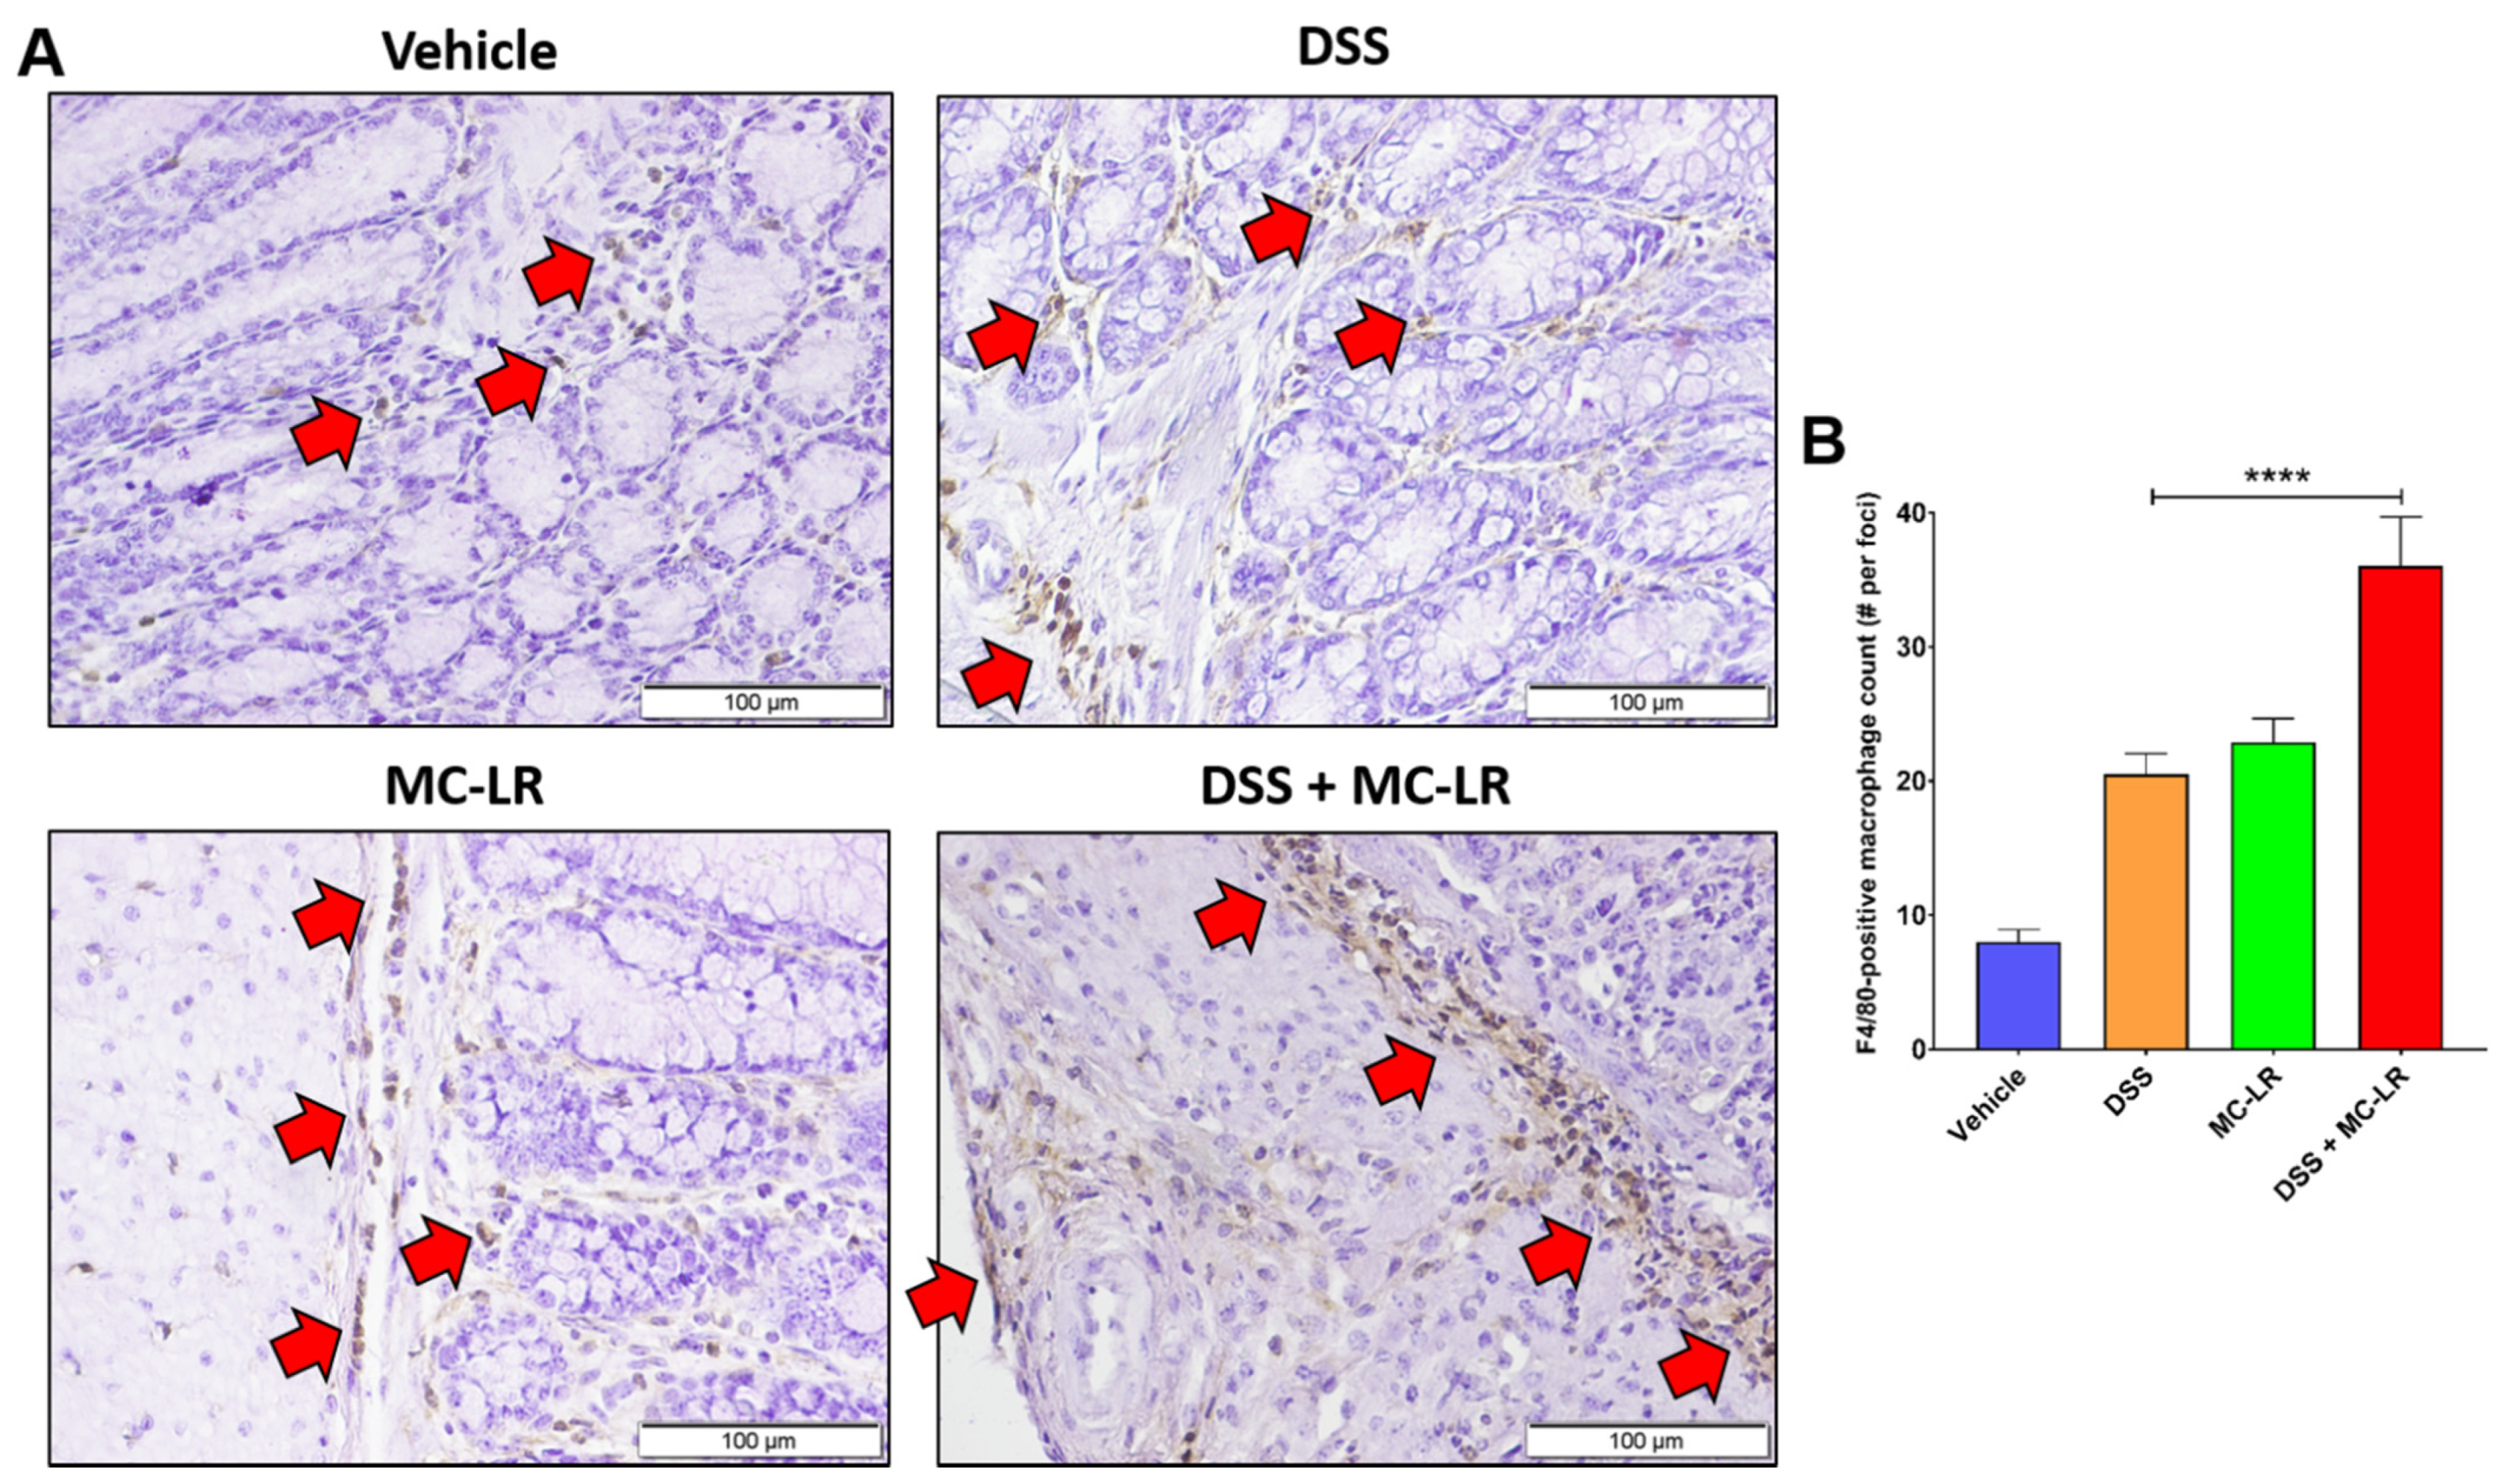
Abstract
:1. Introduction
2. Results
2.1. Characterization of Inflammatory Cell Infiltration of the Colon
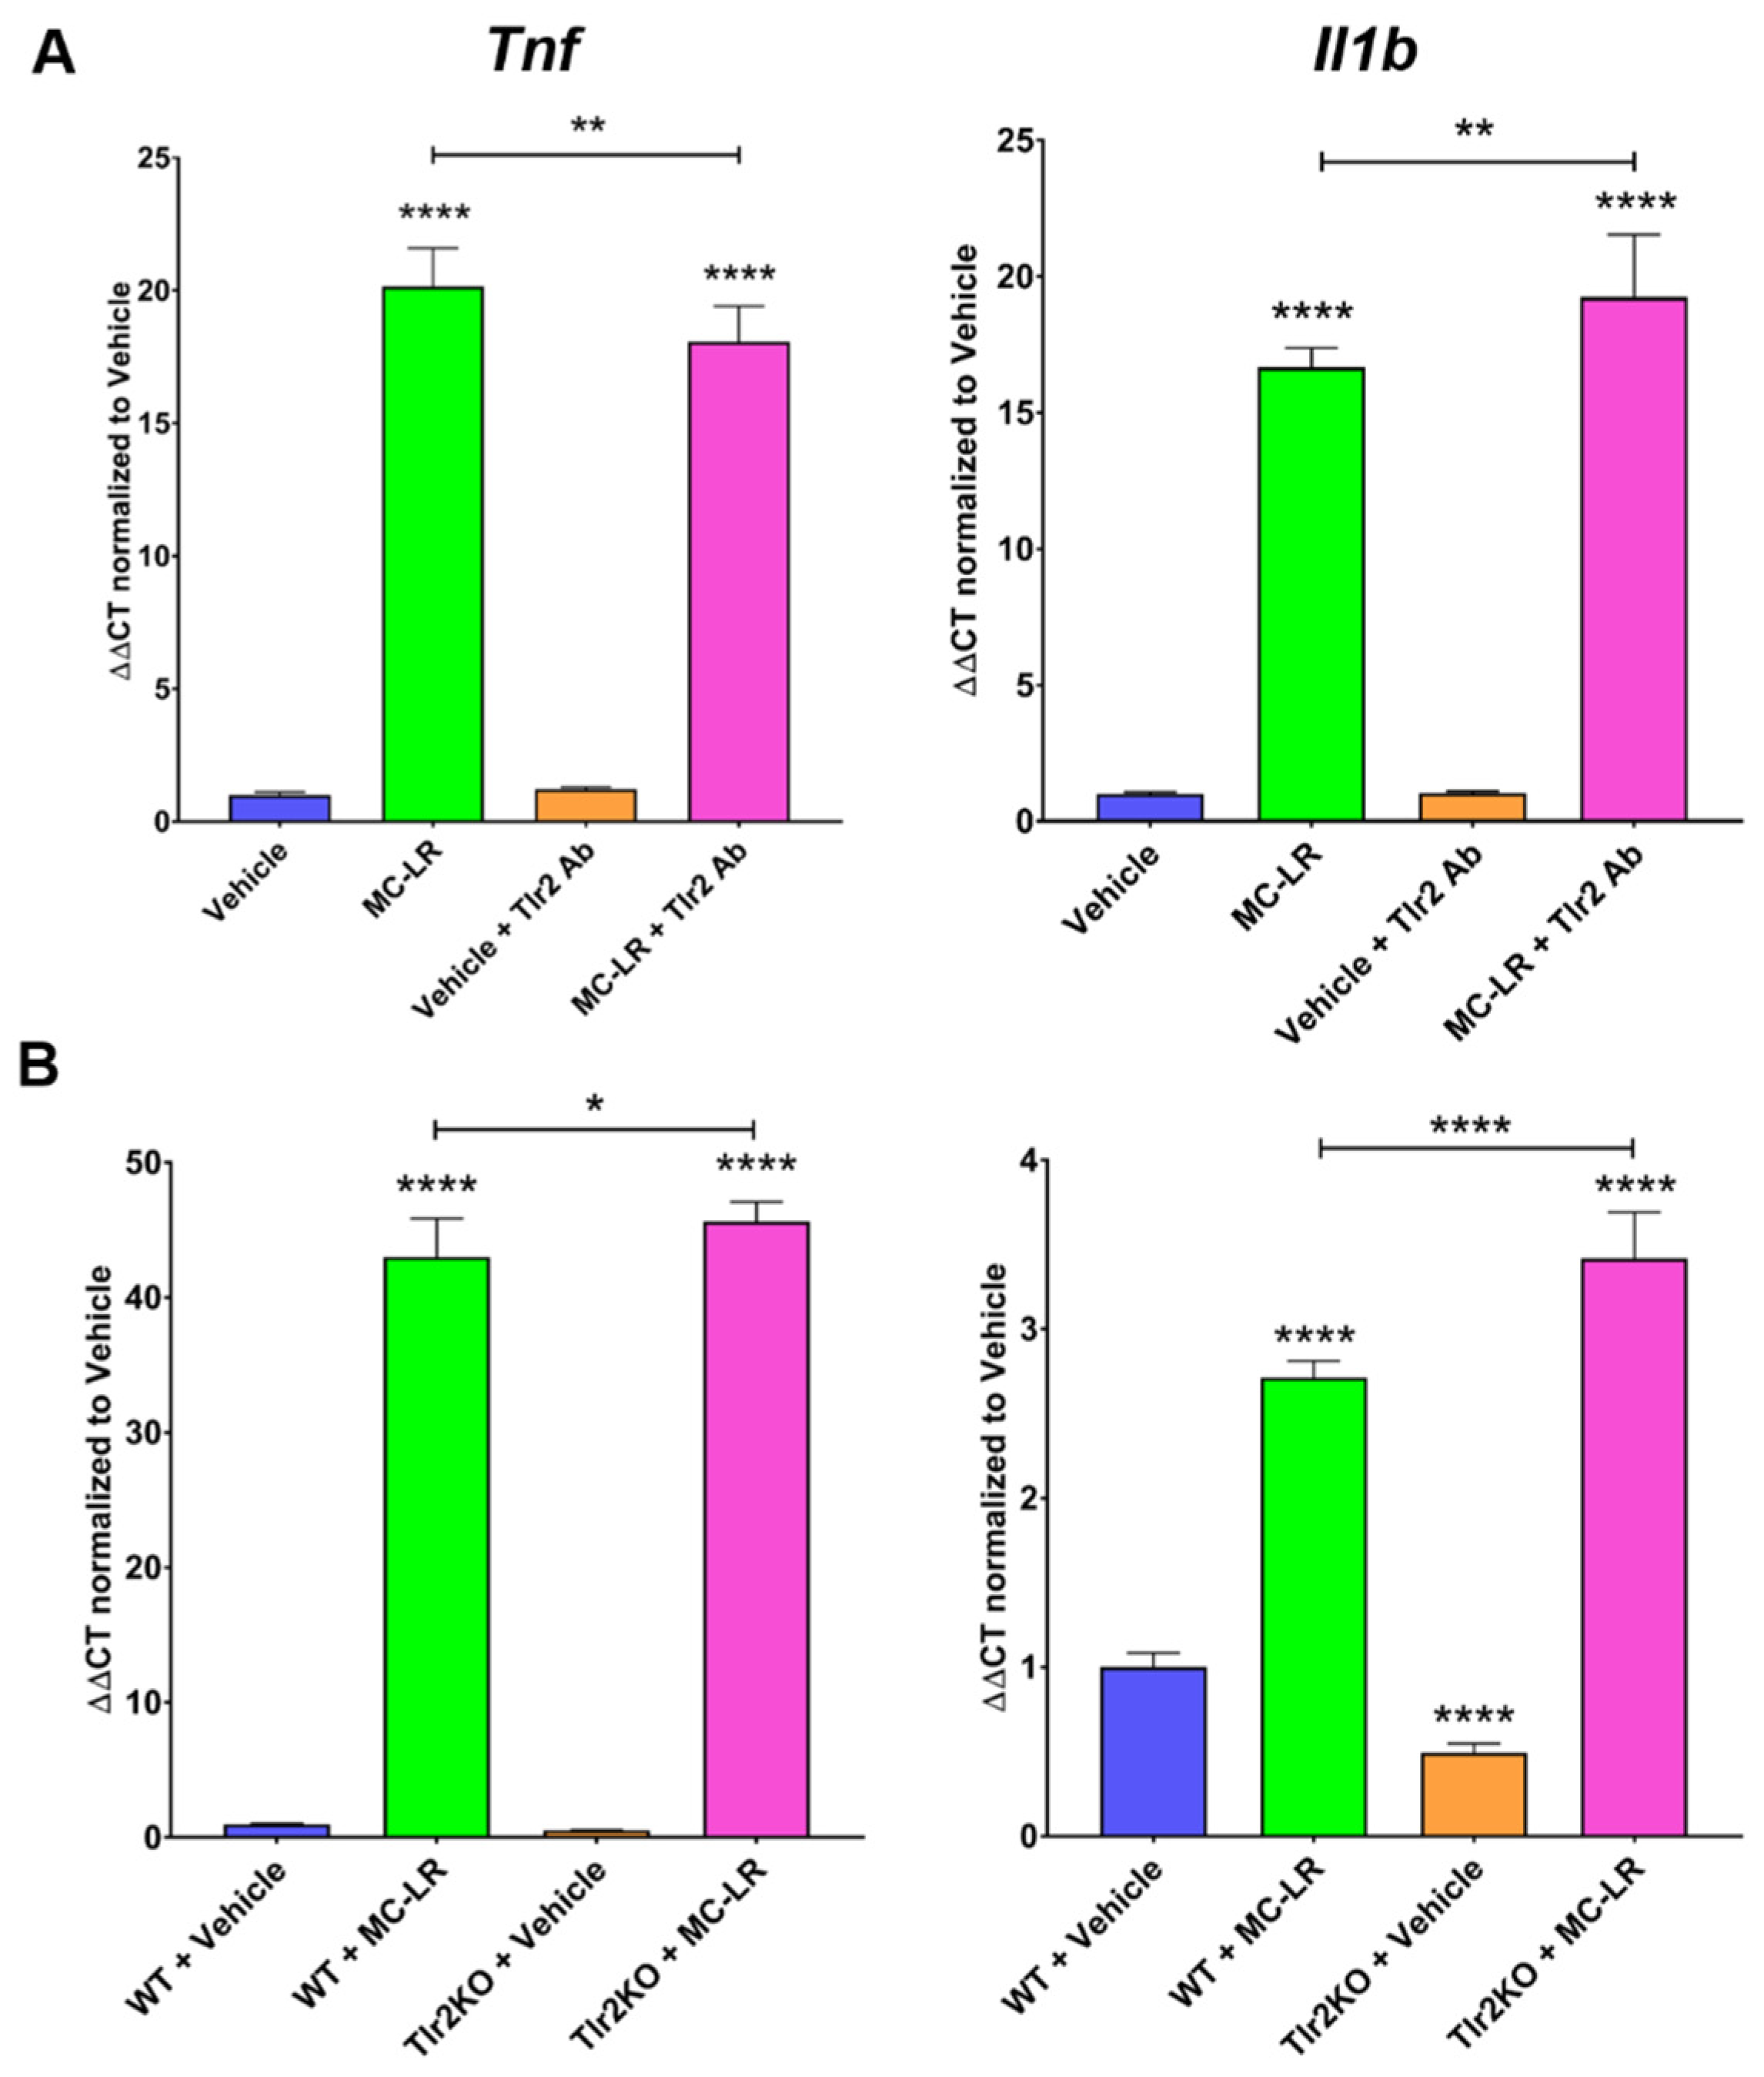
2.2. MC-LR Effects in Macrophages
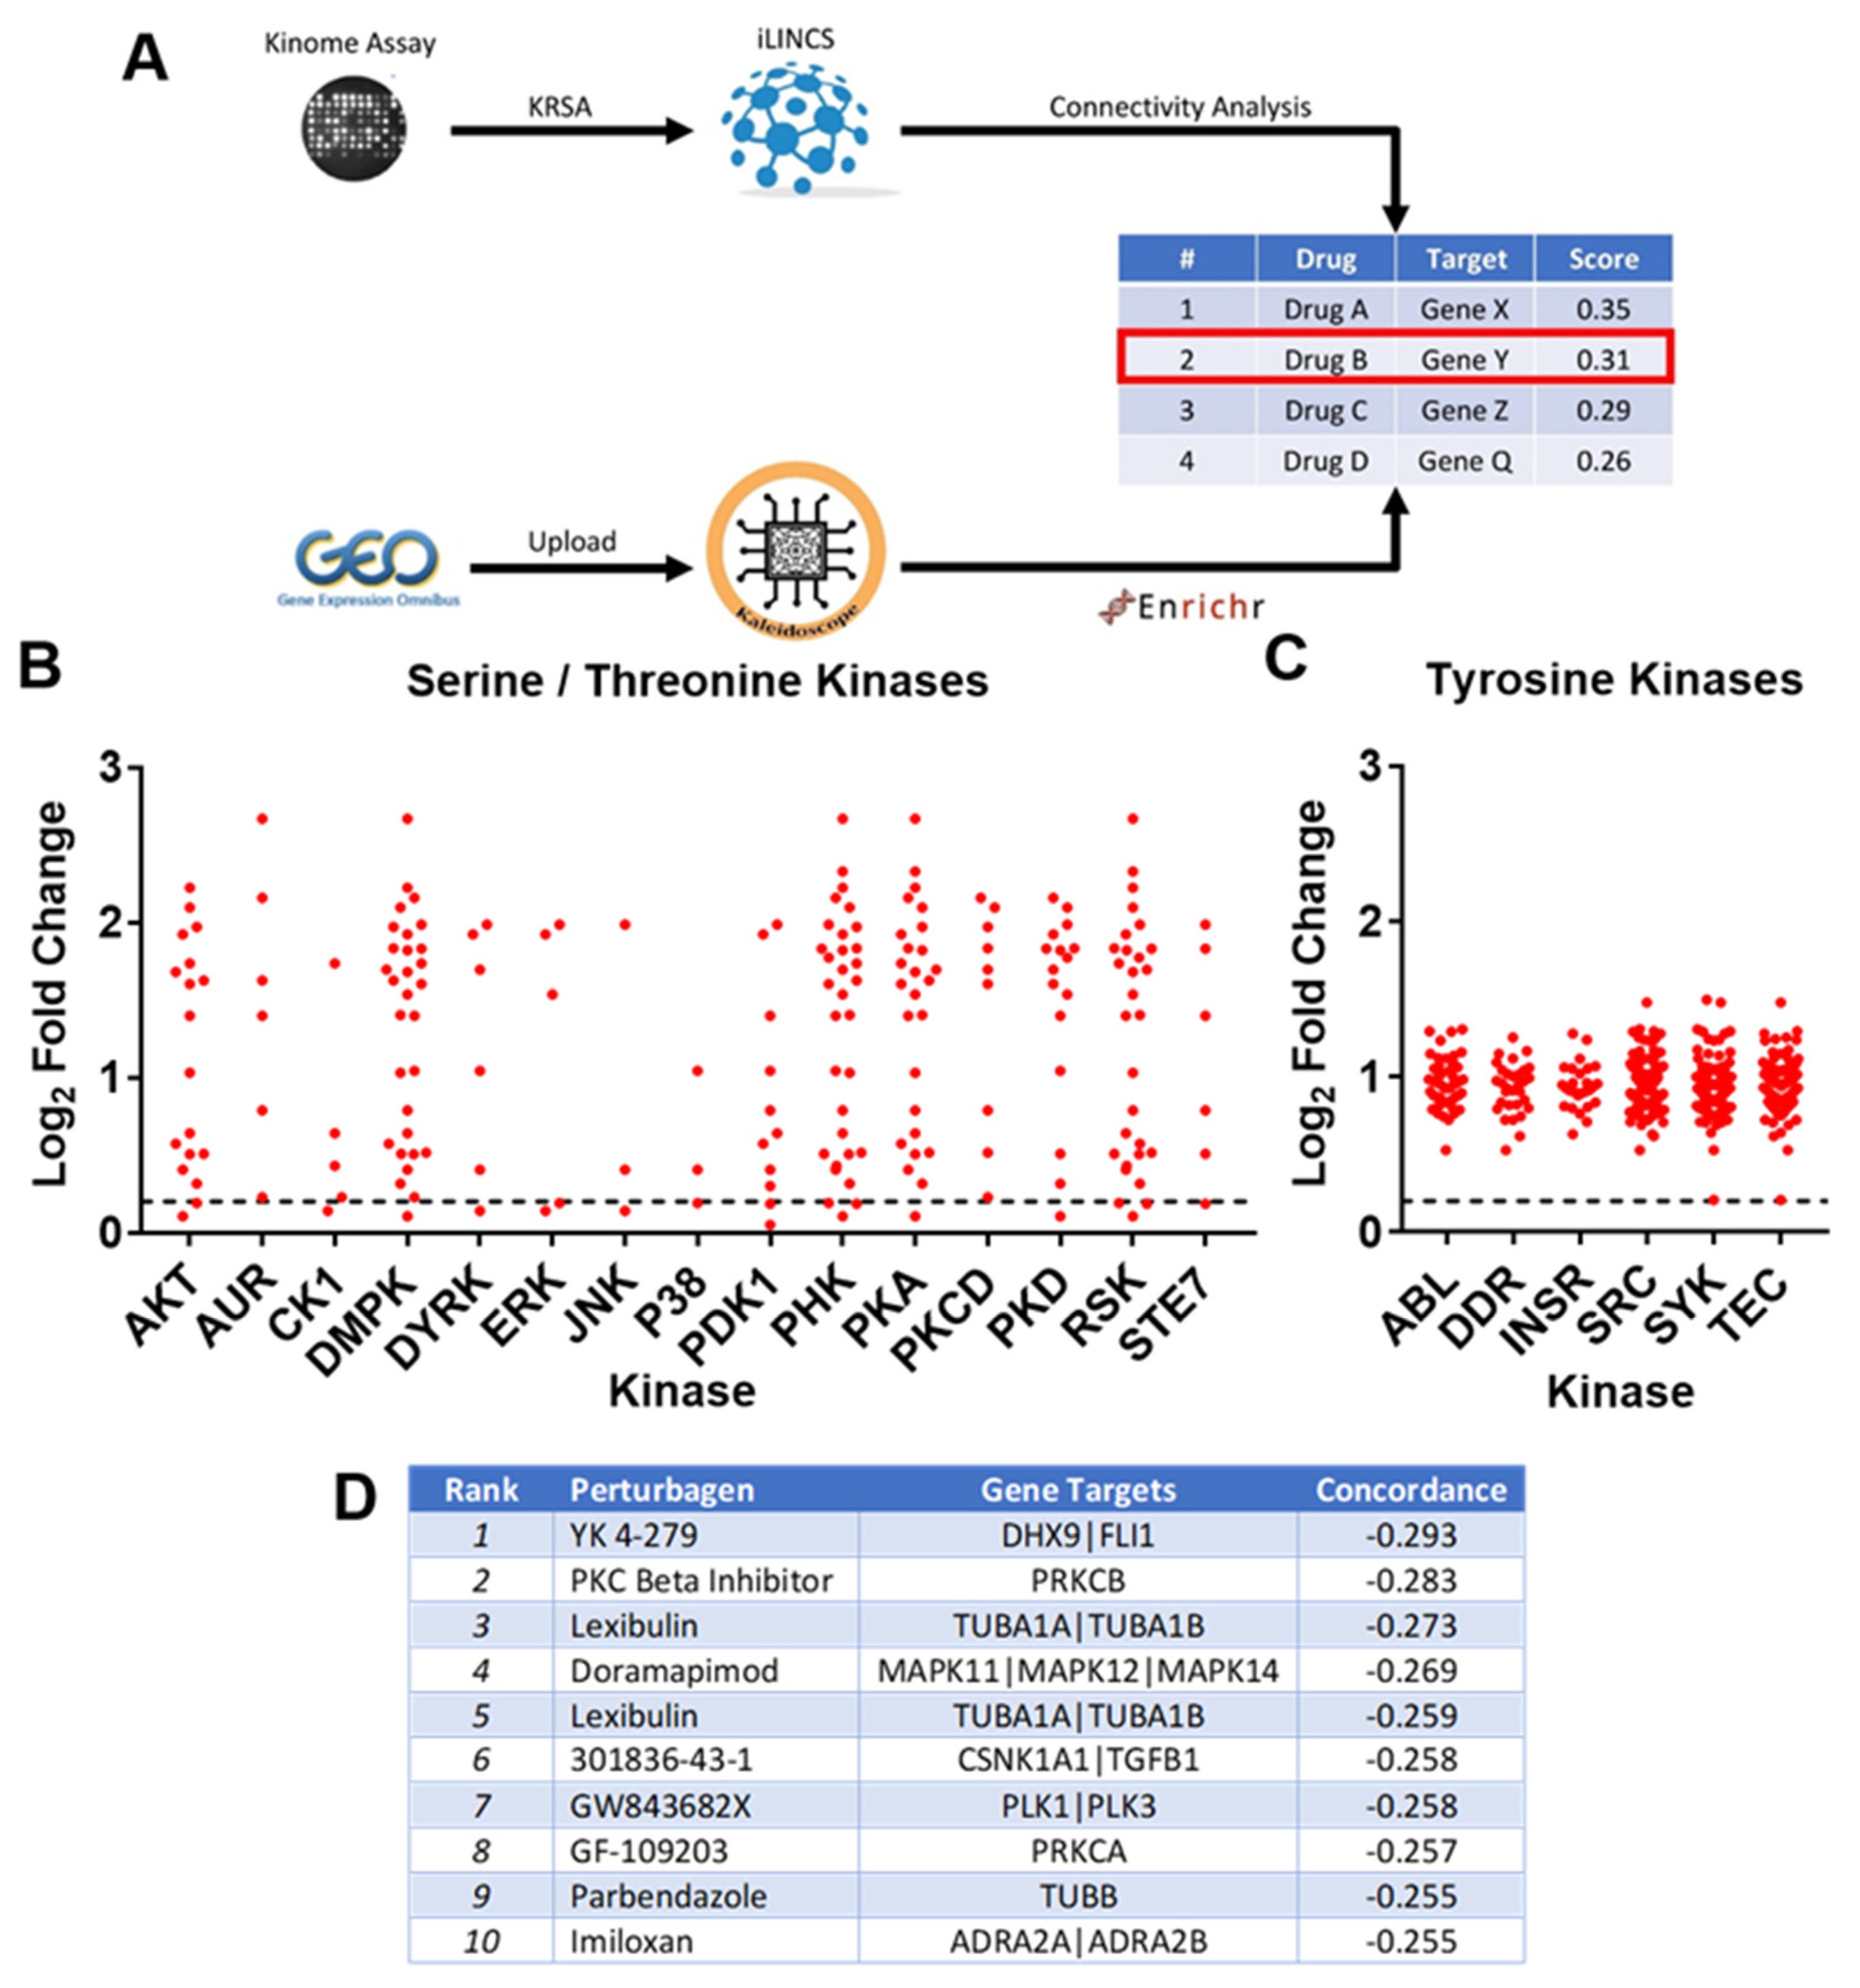
2.3. MC-LR Induced Macrophage Kinomics
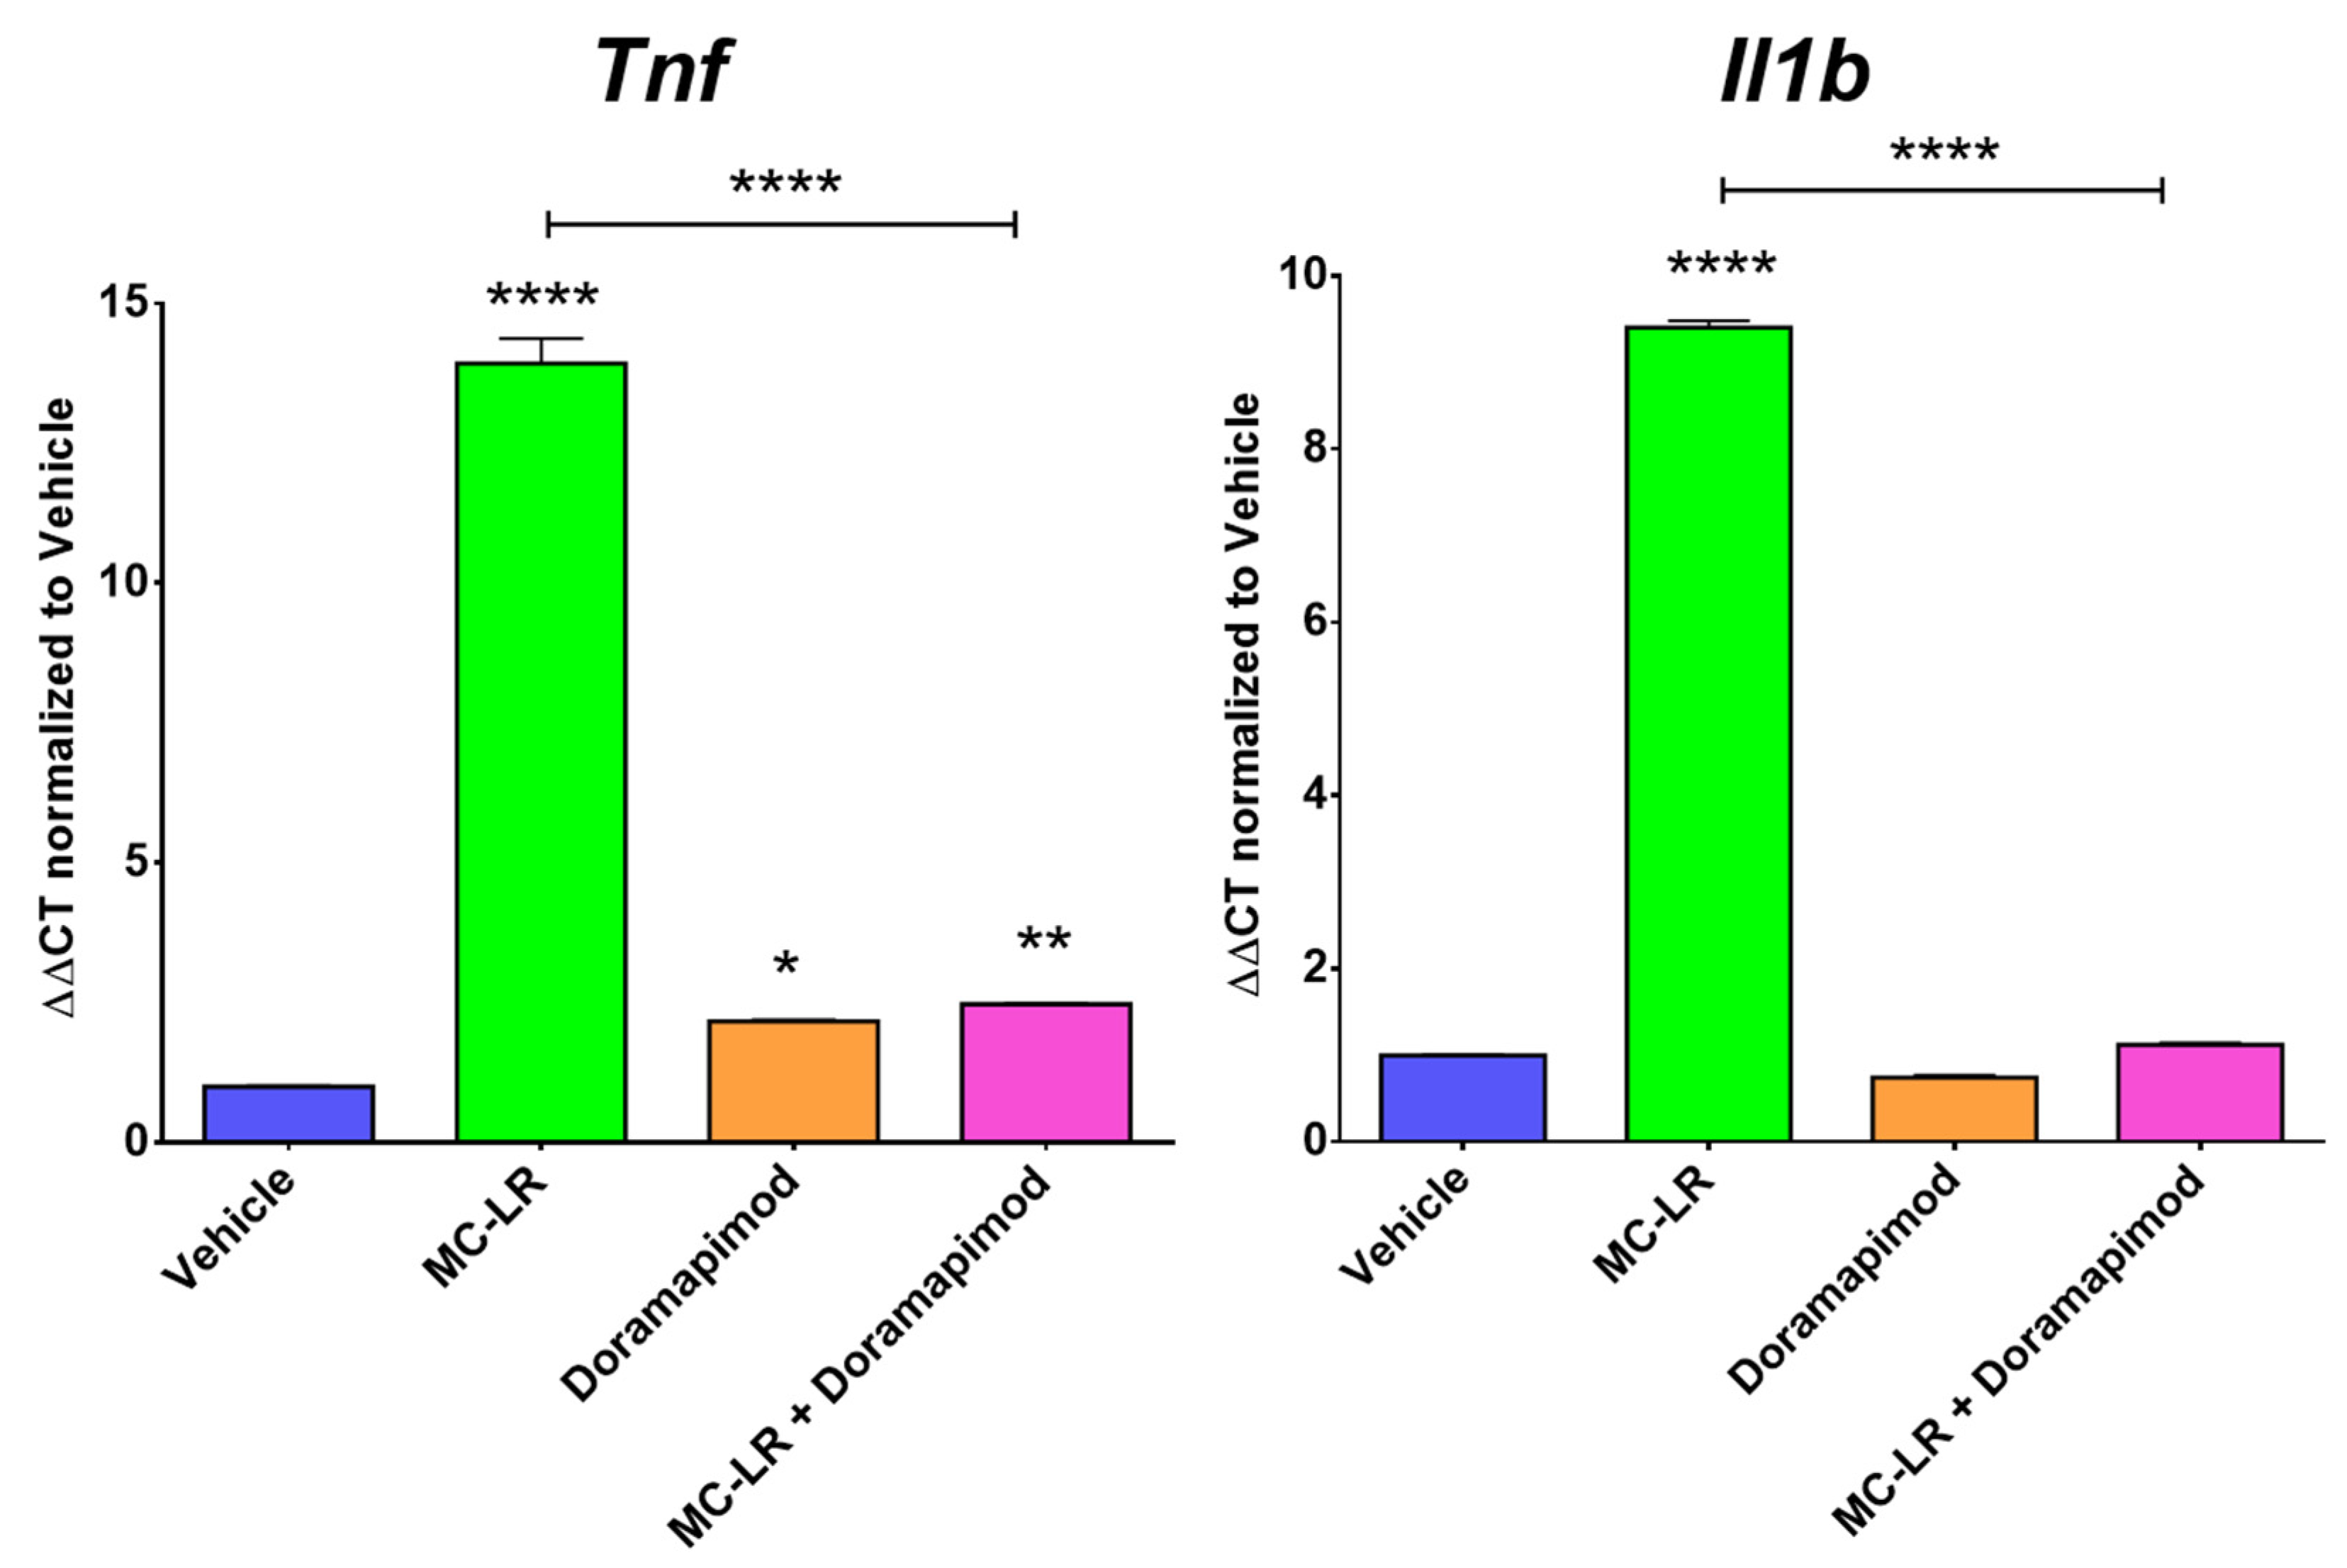
2.4. Doramapimod’s Effects on Macrophage Inflammatory Responses to MC-LR
3. Discussion
4. Materials and Methods
4.1. Animal Studies
4.2. In Vitro Macrophage Experiments
4.3. RNA Extraction and RT-PCR Method
4.4. Kinase Activity Profiling
4.5. In Silico Drug Repurposing Analysis
4.6. Dataset Pathway Analysis
4.7. Statistical Analysis
Author Contributions
Funding
Institutional Review Board Statement
Data Availability Statement
Conflicts of Interest
References
- Campos, A.; Vasconcelos, V. Molecular Mechanisms of Microcystin Toxicity in Animal Cells. Int. J. Mol. Sci. 2010, 11, 268. [Google Scholar] [CrossRef] [Green Version]
- Lone, Y.; Koiri, R.K.; Bhide, M. An overview of the toxic effect of potential human carcinogen Microcystin-LR on testis. Toxicol. Rep. 2015, 2, 289–296. [Google Scholar] [CrossRef] [Green Version]
- Sedan, D.; Laguens, M.; Copparoni, G.; Aranda, J.O.; Giannuzzi, L.; Marra, C.A.; Andrinolo, D. Hepatic and intestine alterations in mice after prolonged exposure to low oral doses of Microcystin-LR. Toxicon 2015, 104, 26–33. [Google Scholar] [CrossRef] [PubMed]
- Fawell, J.K.; Mitchell, R.E.; Everett, D.J.; Hill, R.E. The toxicity of cyanobacterial toxins in the mouse: I microcystin-LR. Hum. Exp. Toxicol. 1999, 18, 162–167. [Google Scholar] [CrossRef] [PubMed]
- Nishiwaki-Matsushima, R.; Ohta, T.; Nishiwaki, S.; Suganuma, M.; Kohyama, K.; Ishikawa, T.; Carmichael, W.W.; Fujiki, H. Liver tumor promotion by the cyanobacterial cyclic peptide toxin microcystin-LR. J. Cancer Res. Clin. Oncol. 1992, 118, 420–424. [Google Scholar] [CrossRef] [PubMed]
- Svircev, Z.; Drobac, D.; Tokodi, N.; Mijovic, B.; Codd, G.A.; Meriluoto, J. Toxicology of microcystins with reference to cases of human intoxications and epidemiological investigations of exposures to cyanobacteria and cyanotoxins. Arch. Toxicol. 2017, 91, 621–650. [Google Scholar] [CrossRef]
- Jochimsen, E.M.; Carmichael, W.W.; An, J.S.; Cardo, D.M.; Cookson, S.T.; Holmes, C.E.; Antunes, M.B.; de Melo Filho, D.A.; Lyra, T.M.; Barreto, V.S.; et al. Liver failure and death after exposure to microcystins at a hemodialysis center in Brazil. N. Engl. J. Med. 1998, 338, 873–878. [Google Scholar] [CrossRef]
- Carmichael, W.W.; Azevedo, S.M.; An, J.S.; Molica, R.J.; Jochimsen, E.M.; Lau, S.; Rinehart, K.L.; Shaw, G.R.; Eaglesham, G.K. Human fatalities from cyanobacteria: Chemical and biological evidence for cyanotoxins. Environ. Health Perspect. 2001, 109, 663–668. [Google Scholar] [CrossRef]
- Su, R.C.; Blomquist, T.M.; Kleinhenz, A.L.; Khalaf, F.K.; Dube, P.; Lad, A.; Breidenbach, J.D.; Mohammed, C.J.; Zhang, S.; Baum, C.E.; et al. Exposure to the Harmful Algal Bloom (HAB) Toxin Microcystin-LR (MC-LR) Prolongs and Increases Severity of Dextran Sulfate Sodium (DSS)-Induced Colitis. Toxins 2019, 11, 371. [Google Scholar] [CrossRef] [Green Version]
- Chassaing, B.; Aitken, J.D.; Malleshappa, M.; Vijay-Kumar, M. Dextran sulfate sodium (DSS)-induced colitis in mice. Curr. Protoc. Immunol. 2014, 104, 15–25. [Google Scholar] [CrossRef]
- Okayasu, I.; Hatakeyama, S.; Yamada, M.; Ohkusa, T.; Inagaki, Y.; Nakaya, R. A novel method in the induction of reliable experimental acute and chronic ulcerative colitis in mice. Gastroenterology 1990, 98, 694–702. [Google Scholar] [CrossRef]
- Redhu, N.S.; Bakthavatchalu, V.; Conaway, E.A.; Shouval, D.S.; Tsou, A.; Goettel, J.A.; Biswas, A.; Wang, C.; Field, M.; Muller, W.; et al. Macrophage dysfunction initiates colitis during weaning of infant mice lacking the interleukin-10 receptor. Elife 2017, 6, e27652. [Google Scholar] [CrossRef]
- Ey, B.; Eyking, A.; Klepak, M.; Salzman, N.H.; Gothert, J.R.; Runzi, M.; Schmid, K.W.; Gerken, G.; Podolsky, D.K.; Cario, E. Loss of TLR2 worsens spontaneous colitis in MDR1A deficiency through commensally induced pyroptosis. J. Immunol. 2013, 190, 5676–5688. [Google Scholar] [CrossRef] [PubMed]
- Pierik, M.; Joossens, S.; Van Steen, K.; Van Schuerbeek, N.; Vlietinck, R.; Rutgeerts, P.; Vermeire, S. Toll-like receptor-1, -2, and -6 polymorphisms influence disease extension in inflammatory bowel diseases. Inflamm. Bowel Dis. 2006, 12, 1–8. [Google Scholar] [CrossRef]
- Adamovsky, O.; Moosova, Z.; Pekarova, M.; Basu, A.; Babica, P.; Svihalkova Sindlerova, L.; Kubala, L.; Blaha, L. Immunomodulatory Potency of Microcystin, an Important Water-Polluting Cyanobacterial Toxin. Environ. Sci. Technol. 2015, 49, 12457–12464. [Google Scholar] [CrossRef]
- Lin, W.; Hou, J.; Guo, H.; Qiu, Y.; Li, L.; Li, D.; Tang, R. Dualistic immunomodulation of sub-chronic microcystin-LR exposure on the innate-immune defense system in male zebrafish. Chemosphere 2017, 183, 315–322. [Google Scholar] [CrossRef] [PubMed]
- Austyn, J.M.; Gordon, S. F4/80, a monoclonal antibody directed specifically against the mouse macrophage. Eur. J. Immunol. 1981, 11, 805–815. [Google Scholar] [CrossRef] [PubMed]
- Chistiakov, D.A.; Killingsworth, M.C.; Myasoedova, V.A.; Orekhov, A.N.; Bobryshev, Y.V. CD68/macrosialin: Not just a histochemical marker. Lab. Investig. 2017, 97, 4–13. [Google Scholar] [CrossRef] [PubMed] [Green Version]
- Barros, M.H.; Hauck, F.; Dreyer, J.H.; Kempkes, B.; Niedobitek, G. Macrophage polarisation: An immunohistochemical approach for identifying M1 and M2 macrophages. PLoS ONE 2013, 8, e80908. [Google Scholar] [CrossRef] [Green Version]
- Di Gregorio, G.B.; Yao-Borengasser, A.; Rasouli, N.; Varma, V.; Lu, T.; Miles, L.M.; Ranganathan, G.; Peterson, C.A.; McGehee, R.E.; Kern, P.A. Expression of CD68 and macrophage chemoattractant protein-1 genes in human adipose and muscle tissues: Association with cytokine expression, insulin resistance, and reduction by pioglitazone. Diabetes 2005, 54, 2305–2313. [Google Scholar] [CrossRef] [Green Version]
- Hu, J.M.; Liu, K.; Liu, J.H.; Jiang, X.L.; Wang, X.L.; Chen, Y.Z.; Li, S.G.; Zou, H.; Pang, L.J.; Liu, C.X.; et al. CD163 as a marker of M2 macrophage, contribute to predicte aggressiveness and prognosis of Kazakh esophageal squamous cell carcinoma. Oncotarget 2017, 8, 21526–21538. [Google Scholar] [CrossRef] [Green Version]
- Shiraishi, D.; Fujiwara, Y.; Horlad, H.; Saito, Y.; Iriki, T.; Tsuboki, J.; Cheng, P.; Nakagata, N.; Mizuta, H.; Bekki, H.; et al. CD163 Is Required for Protumoral Activation of Macrophages in Human and Murine Sarcoma. Cancer Res. 2018, 78, 3255–3266. [Google Scholar] [CrossRef] [Green Version]
- Kubota, K.; Moriyama, M.; Furukawa, S.; Rafiul, H.; Maruse, Y.; Jinno, T.; Tanaka, A.; Ohta, M.; Ishiguro, N.; Yamauchi, M.; et al. CD163(+) CD204(+) tumor-associated macrophages contribute to T cell regulation via interleukin-10 and PD-L1 production in oral squamous cell carcinoma. Sci. Rep. 2017, 7, 1755. [Google Scholar] [CrossRef]
- Minami, K.; Hiwatashi, K.; Ueno, S.; Sakoda, M.; Iino, S.; Okumura, H.; Hashiguchi, M.; Kawasaki, Y.; Kurahara, H.; Mataki, Y.; et al. Prognostic significance of CD68, CD163 and Folate receptor-beta positive macrophages in hepatocellular carcinoma. Exp. Ther. Med. 2018, 15, 4465–4476. [Google Scholar] [CrossRef] [PubMed] [Green Version]
- Schmid, M.C.; Khan, S.Q.; Kaneda, M.M.; Pathria, P.; Shepard, R.; Louis, T.L.; Anand, S.; Woo, G.; Leem, C.; Faridi, M.H.; et al. Integrin CD11b activation drives anti-tumor innate immunity. Nat. Commun. 2018, 9, 5379. [Google Scholar] [CrossRef] [PubMed]
- Yao, X.; Dong, G.; Zhu, Y.; Yan, F.; Zhang, H.; Ma, Q.; Fu, X.; Li, X.; Zhang, Q.; Zhang, J.; et al. Leukadherin-1-Mediated Activation of CD11b Inhibits LPS-Induced Pro-inflammatory Response in Macrophages and Protects Mice Against Endotoxic Shock by Blocking LPS-TLR4 Interaction. Front. Immunol. 2019, 10, 215. [Google Scholar] [CrossRef] [PubMed]
- Zheng, C.; Yang, Q.; Xu, C.; Shou, P.; Cao, J.; Jiang, M.; Chen, Q.; Cao, G.; Han, Y.; Li, F.; et al. CD11b regulates obesity-induced insulin resistance via limiting alternative activation and proliferation of adipose tissue macrophages. Proc. Natl. Acad. Sci. USA 2015, 112, E7239–E7248. [Google Scholar] [CrossRef] [Green Version]
- Taciak, B.; Bialasek, M.; Braniewska, A.; Sas, Z.; Sawicka, P.; Kiraga, L.; Rygiel, T.; Krol, M. Evaluation of phenotypic and functional stability of RAW 264.7 cell line through serial passages. PLoS ONE 2018, 13, e0198943. [Google Scholar] [CrossRef]
- Ryoo, S.; Choi, J.; Kim, J.; Bae, S.; Hong, J.; Jo, S.; Kim, S.; Lee, Y. BIRB 796 has Distinctive Anti-inflammatory Effects on Different Cell Types. Immune Netw. 2013, 13, 283–288. [Google Scholar] [CrossRef] [Green Version]
- Branger, J.; van den Blink, B.; Weijer, S.; Madwed, J.; Bos, C.L.; Gupta, A.; Yong, C.L.; Polmar, S.H.; Olszyna, D.P.; Hack, C.E.; et al. Anti-inflammatory effects of a p38 mitogen-activated protein kinase inhibitor during human endotoxemia. J. Immunol. 2002, 168, 4070–4077. [Google Scholar] [CrossRef] [Green Version]
- Khalaf, F.K.; Tassavvor, I.; Mohamed, A.; Chen, Y.; Malhotra, D.; Xie, Z.; Tian, J.; Haller, S.T.; Westfall, K.; Tang, W.H.W.; et al. Epithelial and Endothelial Adhesion of Immune Cells Is Enhanced by Cardiotonic Steroid Signaling Through Na(+)/K(+)-ATPase-alpha-1. J. Am. Heart Assoc. 2020, 9, e013933. [Google Scholar] [CrossRef]
- Kennedy, D.J.; Khalaf, F.K.; Sheehy, B.; Weber, M.E.; Agatisa-Boyle, B.; Conic, J.; Hauser, K.; Medert, C.M.; Westfall, K.; Bucur, P.; et al. Telocinobufagin, a Novel Cardiotonic Steroid, Promotes Renal Fibrosis via Na(+)/K(+)-ATPase Profibrotic Signaling Pathways. Int. J. Mol. Sci. 2018, 19, 2566. [Google Scholar] [CrossRef] [Green Version]
- McGuire, J.L.; Hammond, J.H.; Yates, S.D.; Chen, D.; Haroutunian, V.; Meador-Woodruff, J.H.; McCullumsmith, R.E. Altered serine/threonine kinase activity in schizophrenia. Brain Res. 2014, 1568, 42–54. [Google Scholar] [CrossRef] [Green Version]
- McGuire, J.L.; Depasquale, E.A.; Funk, A.J.; O’Donnovan, S.M.; Hasselfeld, K.; Marwaha, S.; Hammond, J.H.; Hartounian, V.; Meador-Woodruff, J.H.; Meller, J.; et al. Abnormalities of signal transduction networks in chronic schizophrenia. NPJ Schizophr. 2017, 3, 30. [Google Scholar] [CrossRef] [PubMed]
- Creeden, J.F.; Alganem, K.; Imami, A.S.; Brunicardi, F.C.; Liu, S.H.; Shukla, R.; Tomar, T.; Naji, F.; McCullumsmith, R.E. Kinome Array Profiling of Patient-Derived Pancreatic Ductal Adenocarcinoma Identifies Differentially Active Protein Tyrosine Kinases. Int. J. Mol. Sci. 2020, 21, 8679. [Google Scholar] [CrossRef]
- Xue, Y.; Liu, Z.; Gao, X.; Jin, C.; Wen, L.; Yao, X.; Ren, J. GPS-SNO: Computational prediction of protein S-nitrosylation sites with a modified GPS algorithm. PLoS ONE 2010, 5, e11290. [Google Scholar] [CrossRef]
- Bentea, E.; Depasquale, E.A.K.; O’Donovan, S.M.; Sullivan, C.R.; Simmons, M.; Meador-Woodruff, J.H.; Zhou, Y.; Xu, C.; Bai, B.; Peng, J.; et al. Kinase network dysregulation in a human induced pluripotent stem cell model of DISC1 schizophrenia. Mol. Omics 2019, 15, 173–188. [Google Scholar] [CrossRef] [PubMed] [Green Version]
- DePasquale, E.A.K.; Alganem, K.; Bentea, E.; Nawreen, N.; McGuire, J.L.; Naji, F.; Hilhorst, R.; Meller, J.; McCullumsmith, R.E. KRSA: Network-based Prediction of Differential Kinase Activity from Kinome Array Data. bioRxiv 2020. [Google Scholar] [CrossRef]
- Subramanian, A.; Narayan, R.; Corsello, S.M.; Peck, D.D.; Natoli, T.E.; Lu, X.; Gould, J.; Davis, J.F.; Tubelli, A.A.; Asiedu, J.K.; et al. A Next Generation Connectivity Map: L1000 Platform and the First 1,000,000 Profiles. Cell 2017, 171, 1437–1452.e17. [Google Scholar] [CrossRef]
- Pilarczyk, M.; Kouril, M.; Shamsaei, B.; Vasiliauskas, J.; Niu, W.; Mahi, N.; Zhang, L.; Clark, N.; Ren, Y.; White, S.; et al. Connecting omics signatures of diseases, drugs, and mechanisms of actions with iLINCS. bioRxiv 2020. [Google Scholar] [CrossRef] [Green Version]
- Barrett, T.; Wilhite, S.E.; Ledoux, P.; Evangelista, C.; Kim, I.F.; Tomashevsky, M.; Marshall, K.A.; Phillippy, K.H.; Sherman, P.M.; Holko, M.; et al. NCBI GEO: Archive for functional genomics data sets--update. Nucleic Acids Res. 2013, 41, D991–D995. [Google Scholar] [CrossRef] [PubMed] [Green Version]
- Alganem, K.; Shukla, R.; Eby, H.; Abel, M.; Zhang, X.; McIntyre, W.B.; Lee, J.; Au-Yeung, C.; Asgariroozbehani, R.; Panda, R.; et al. Kaleidoscope: A New Bioinformatics Pipeline Web Application for In Silico Hypothesis Exploration of Omics Signatures. bioRxiv 2020. [Google Scholar] [CrossRef]
- Chen, E.Y.; Tan, C.M.; Kou, Y.; Duan, Q.; Wang, Z.; Meirelles, G.V.; Clark, N.R.; Ma’ayan, A. Enrichr: Interactive and collaborative HTML5 gene list enrichment analysis tool. BMC Bioinform. 2013, 14, 128. [Google Scholar] [CrossRef] [PubMed] [Green Version]
- Kuleshov, M.V.; Jones, M.R.; Rouillard, A.D.; Fernandez, N.F.; Duan, Q.; Wang, Z.; Koplev, S.; Jenkins, S.L.; Jagodnik, K.M.; Lachmann, A.; et al. Enrichr: A comprehensive gene set enrichment analysis web server 2016 update. Nucleic Acids Res. 2016, 44, W90–W97. [Google Scholar] [CrossRef] [Green Version]


Publisher’s Note: MDPI stays neutral with regard to jurisdictional claims in published maps and institutional affiliations. |
© 2021 by the authors. Licensee MDPI, Basel, Switzerland. This article is an open access article distributed under the terms and conditions of the Creative Commons Attribution (CC BY) license (https://creativecommons.org/licenses/by/4.0/).
Share and Cite
Su, R.C.; Breidenbach, J.D.; Alganem, K.; Khalaf, F.K.; French, B.W.; Dube, P.; Malhotra, D.; McCullumsmith, R.; Presloid, J.B.; Wooten, R.M.; et al. Microcystin-LR (MC-LR) Triggers Inflammatory Responses in Macrophages. Int. J. Mol. Sci. 2021, 22, 9939. https://0-doi-org.brum.beds.ac.uk/10.3390/ijms22189939
Su RC, Breidenbach JD, Alganem K, Khalaf FK, French BW, Dube P, Malhotra D, McCullumsmith R, Presloid JB, Wooten RM, et al. Microcystin-LR (MC-LR) Triggers Inflammatory Responses in Macrophages. International Journal of Molecular Sciences. 2021; 22(18):9939. https://0-doi-org.brum.beds.ac.uk/10.3390/ijms22189939
Chicago/Turabian StyleSu, Robin C., Joshua D. Breidenbach, Khaled Alganem, Fatimah K. Khalaf, Benjamin W. French, Prabhatchandra Dube, Deepak Malhotra, Robert McCullumsmith, John B. Presloid, R. Mark Wooten, and et al. 2021. "Microcystin-LR (MC-LR) Triggers Inflammatory Responses in Macrophages" International Journal of Molecular Sciences 22, no. 18: 9939. https://0-doi-org.brum.beds.ac.uk/10.3390/ijms22189939