
Molecular Imaging of Human Skeletal Myoblasts (huSKM) in Mouse Post-Infarction Myocardium

 , , , , , , , , , , ,
Abstract
:1. Introduction
2. Results
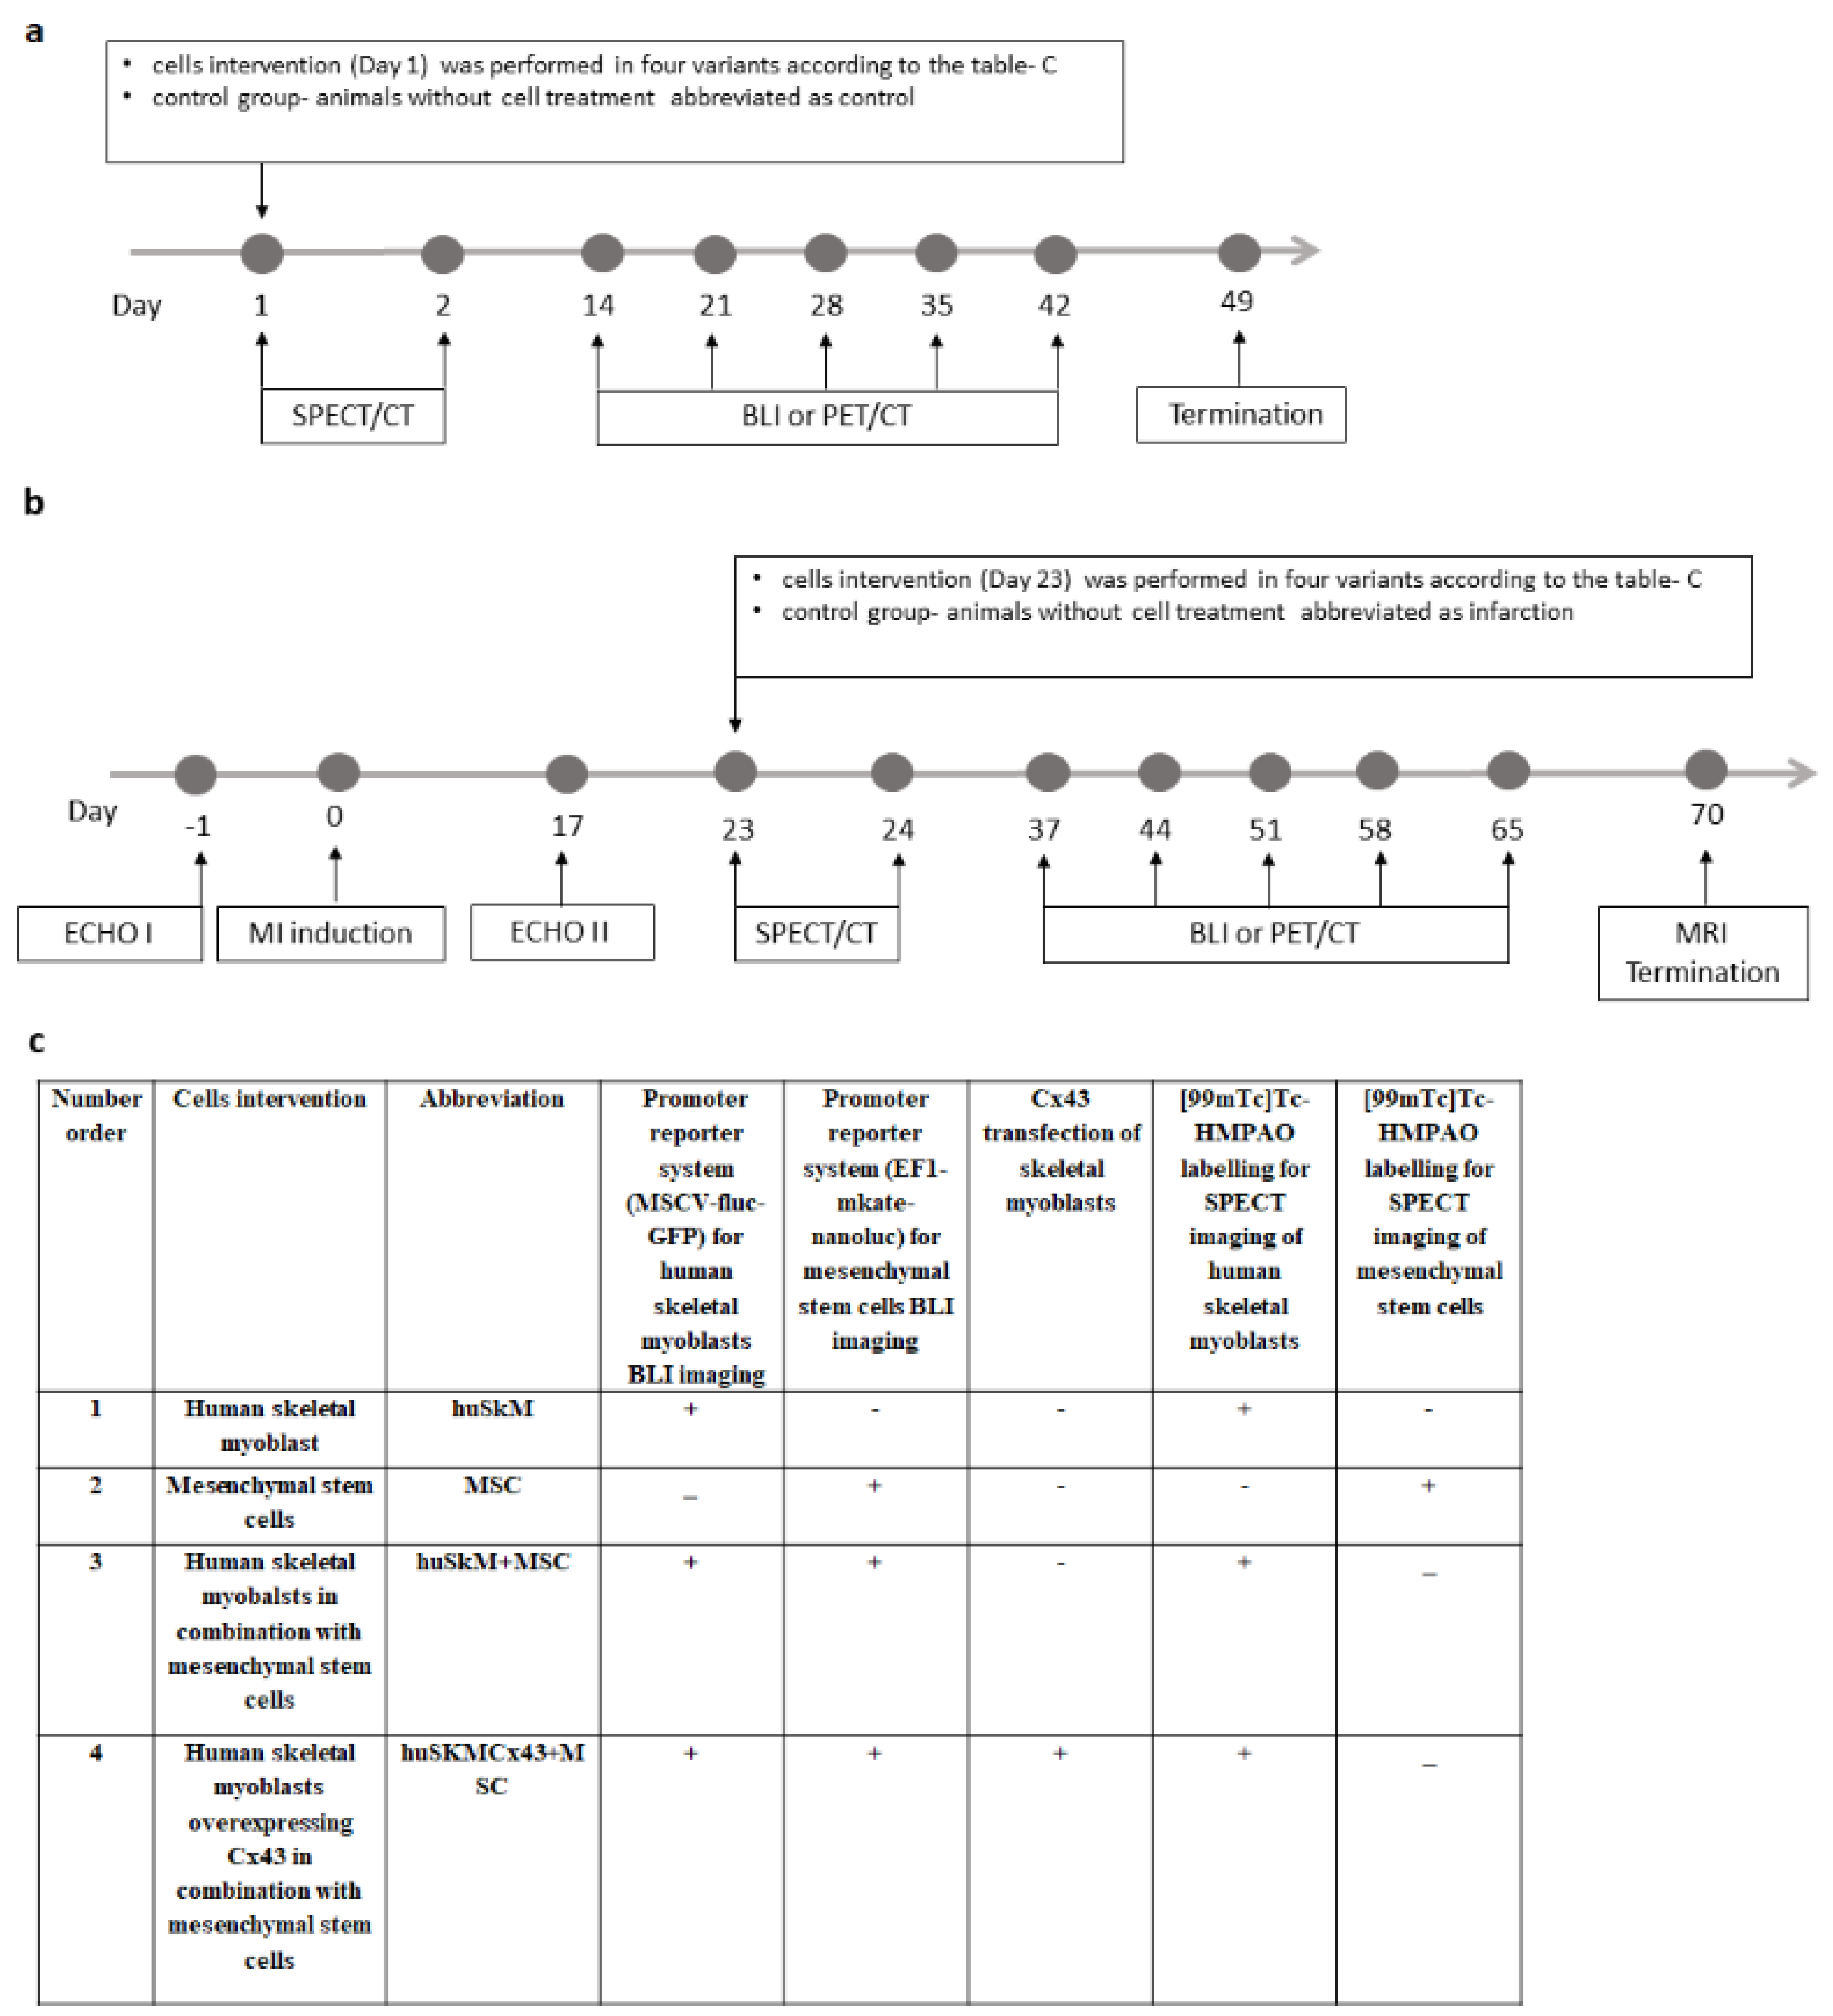
2.1. Experimental Design
2.2. Characteristics of huSkM
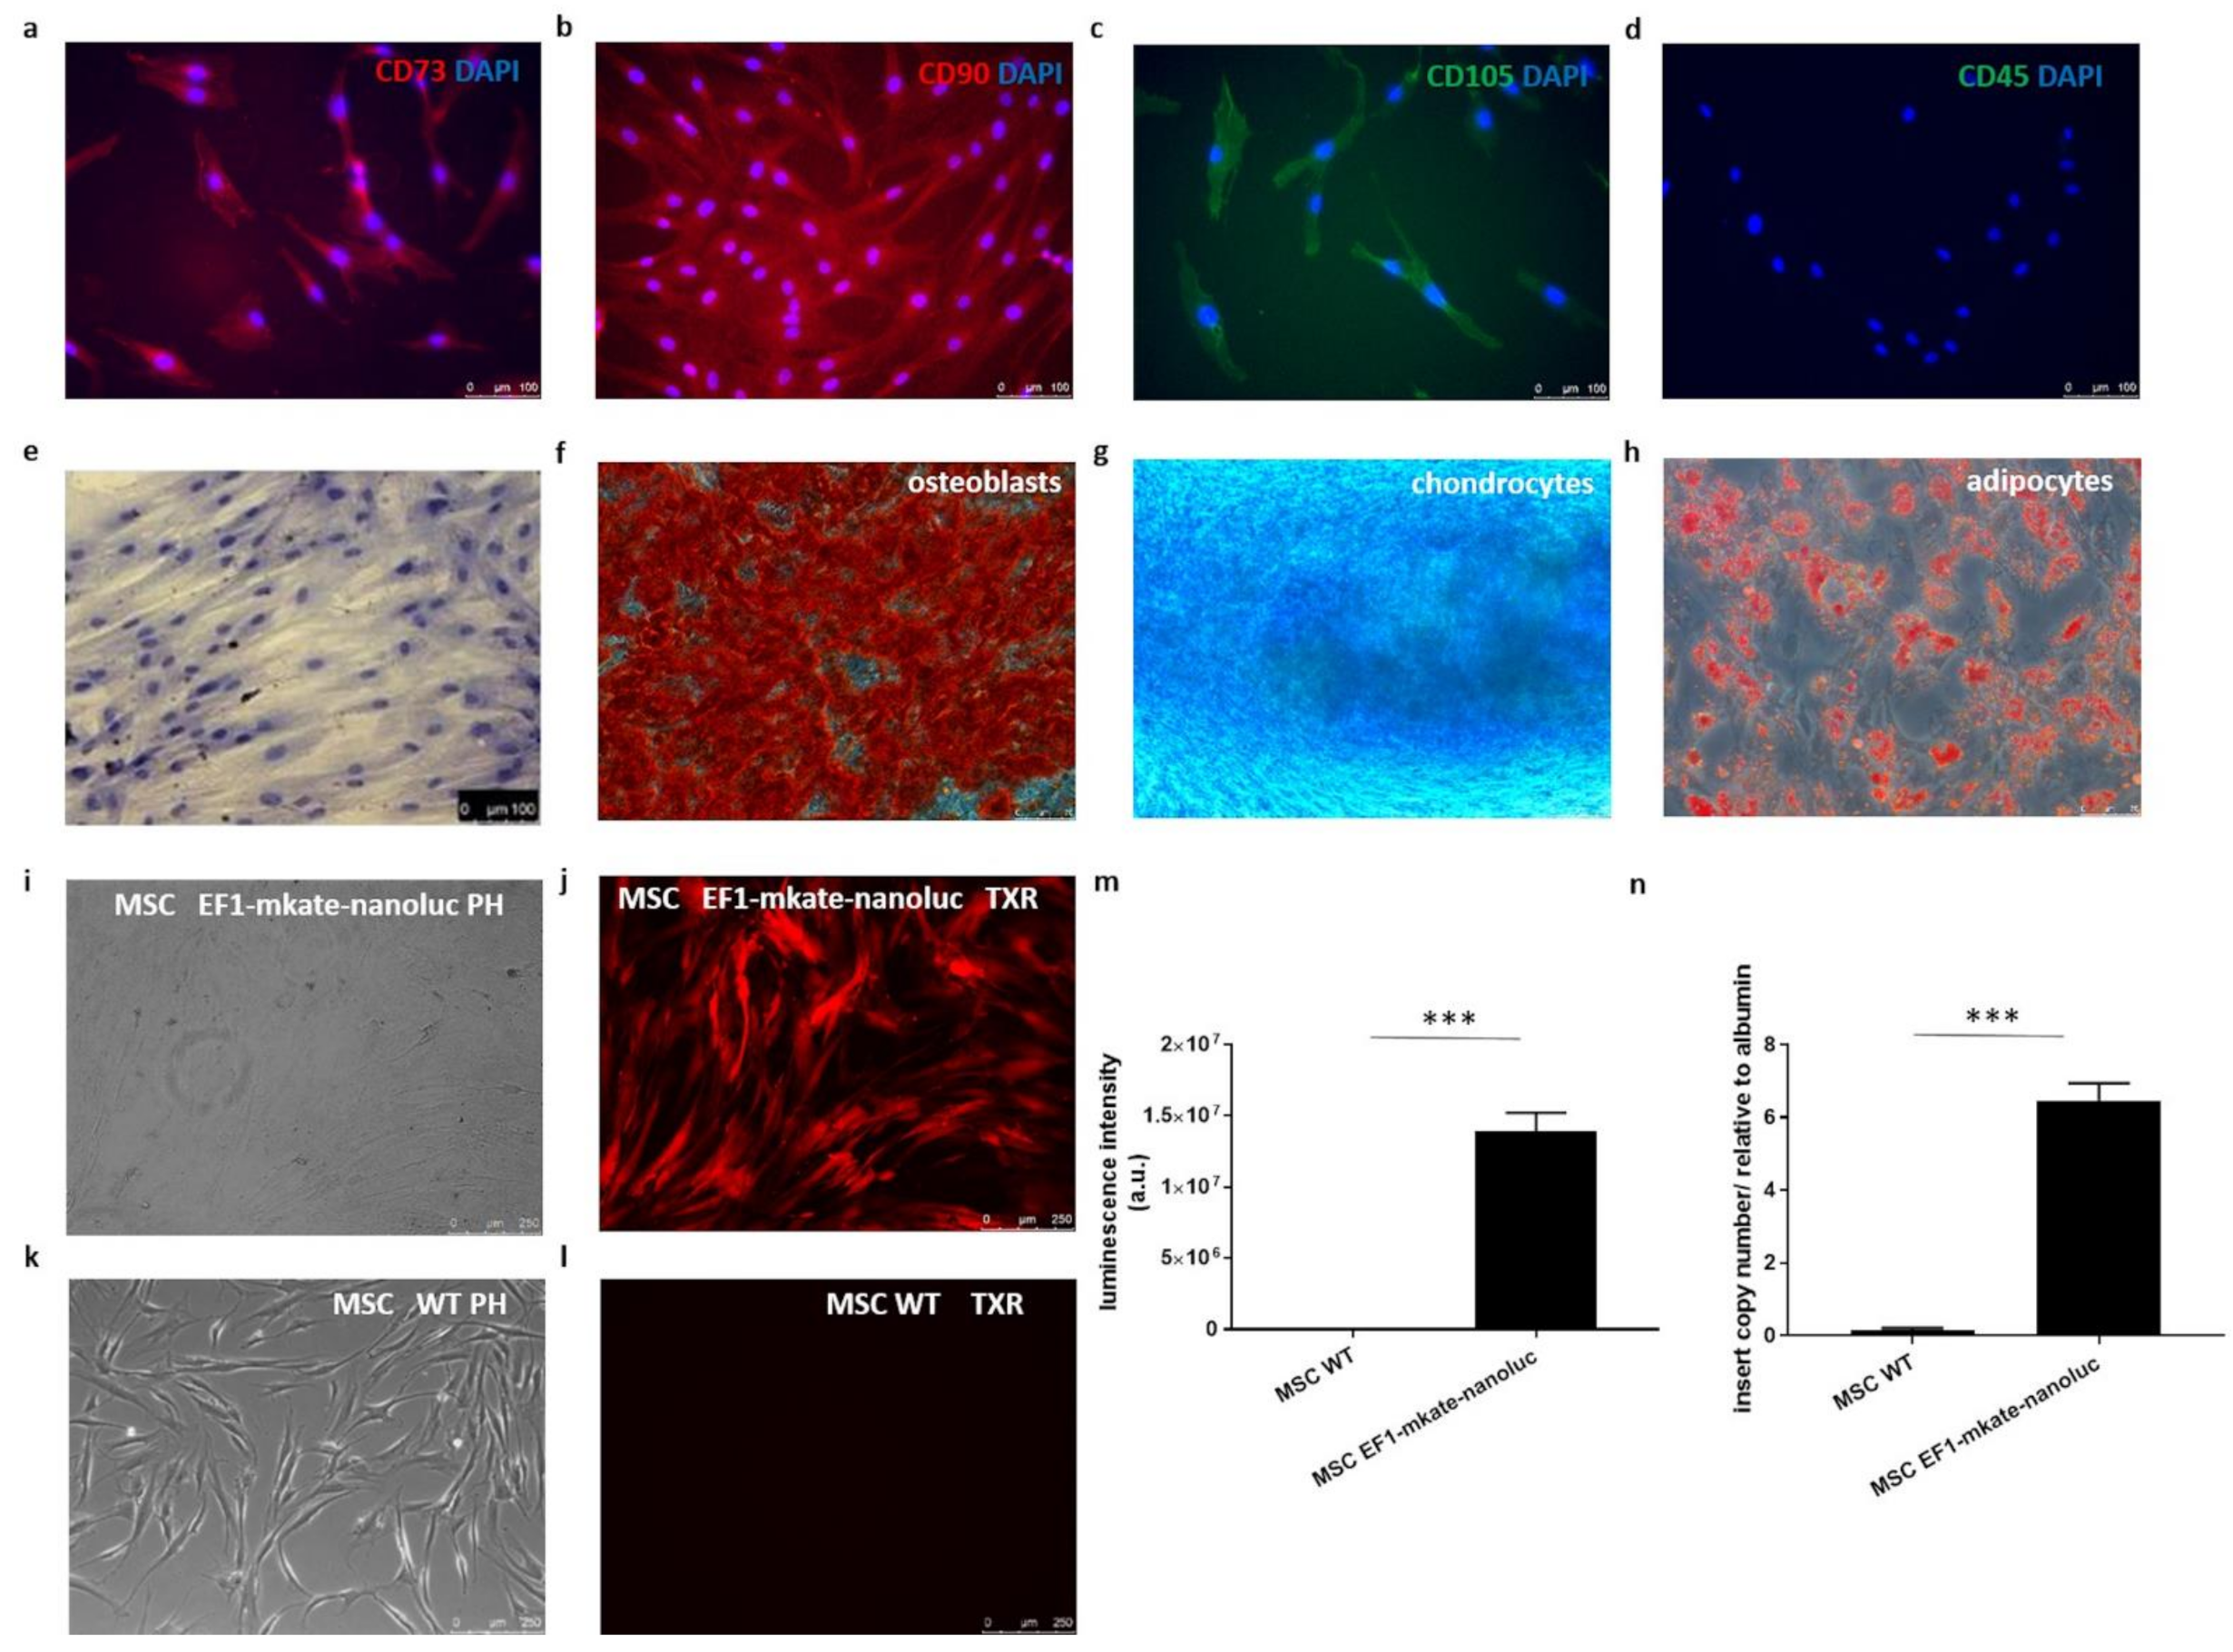
2.3. Characteristics of Mesenchymal Stem Cells
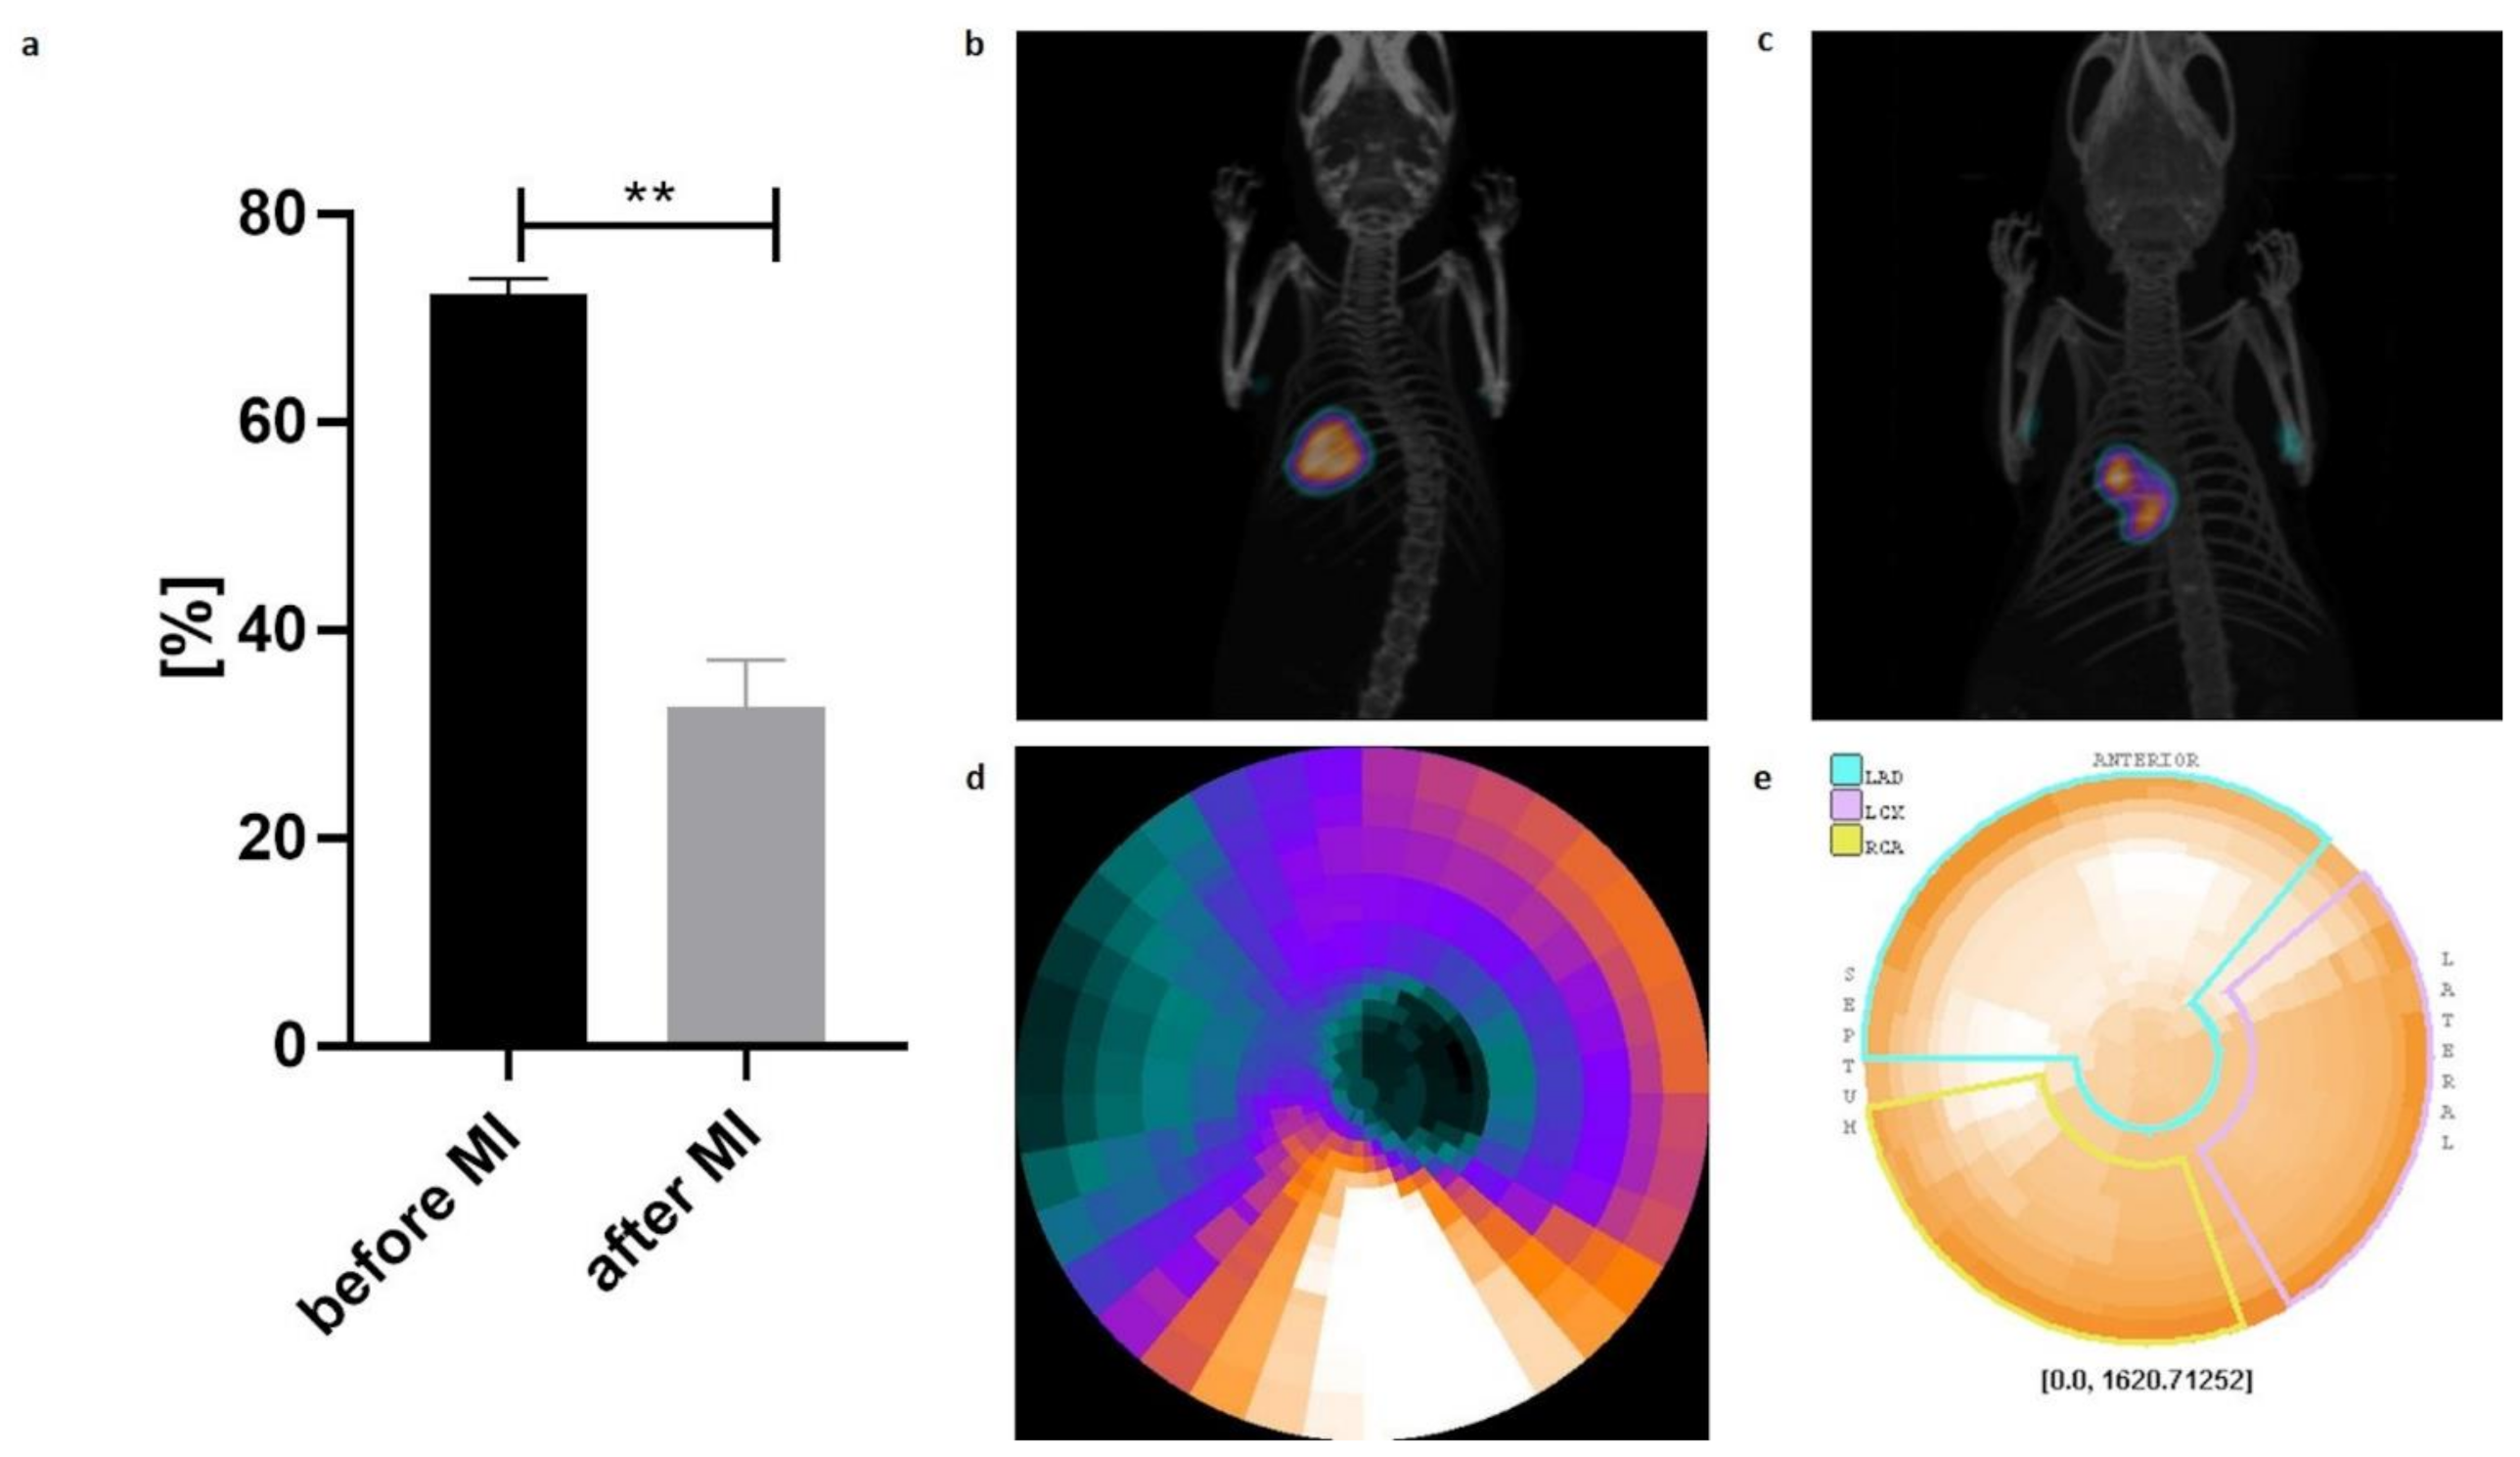
2.4. Echocardiography and PET/CT
2.5. SPECT/CT
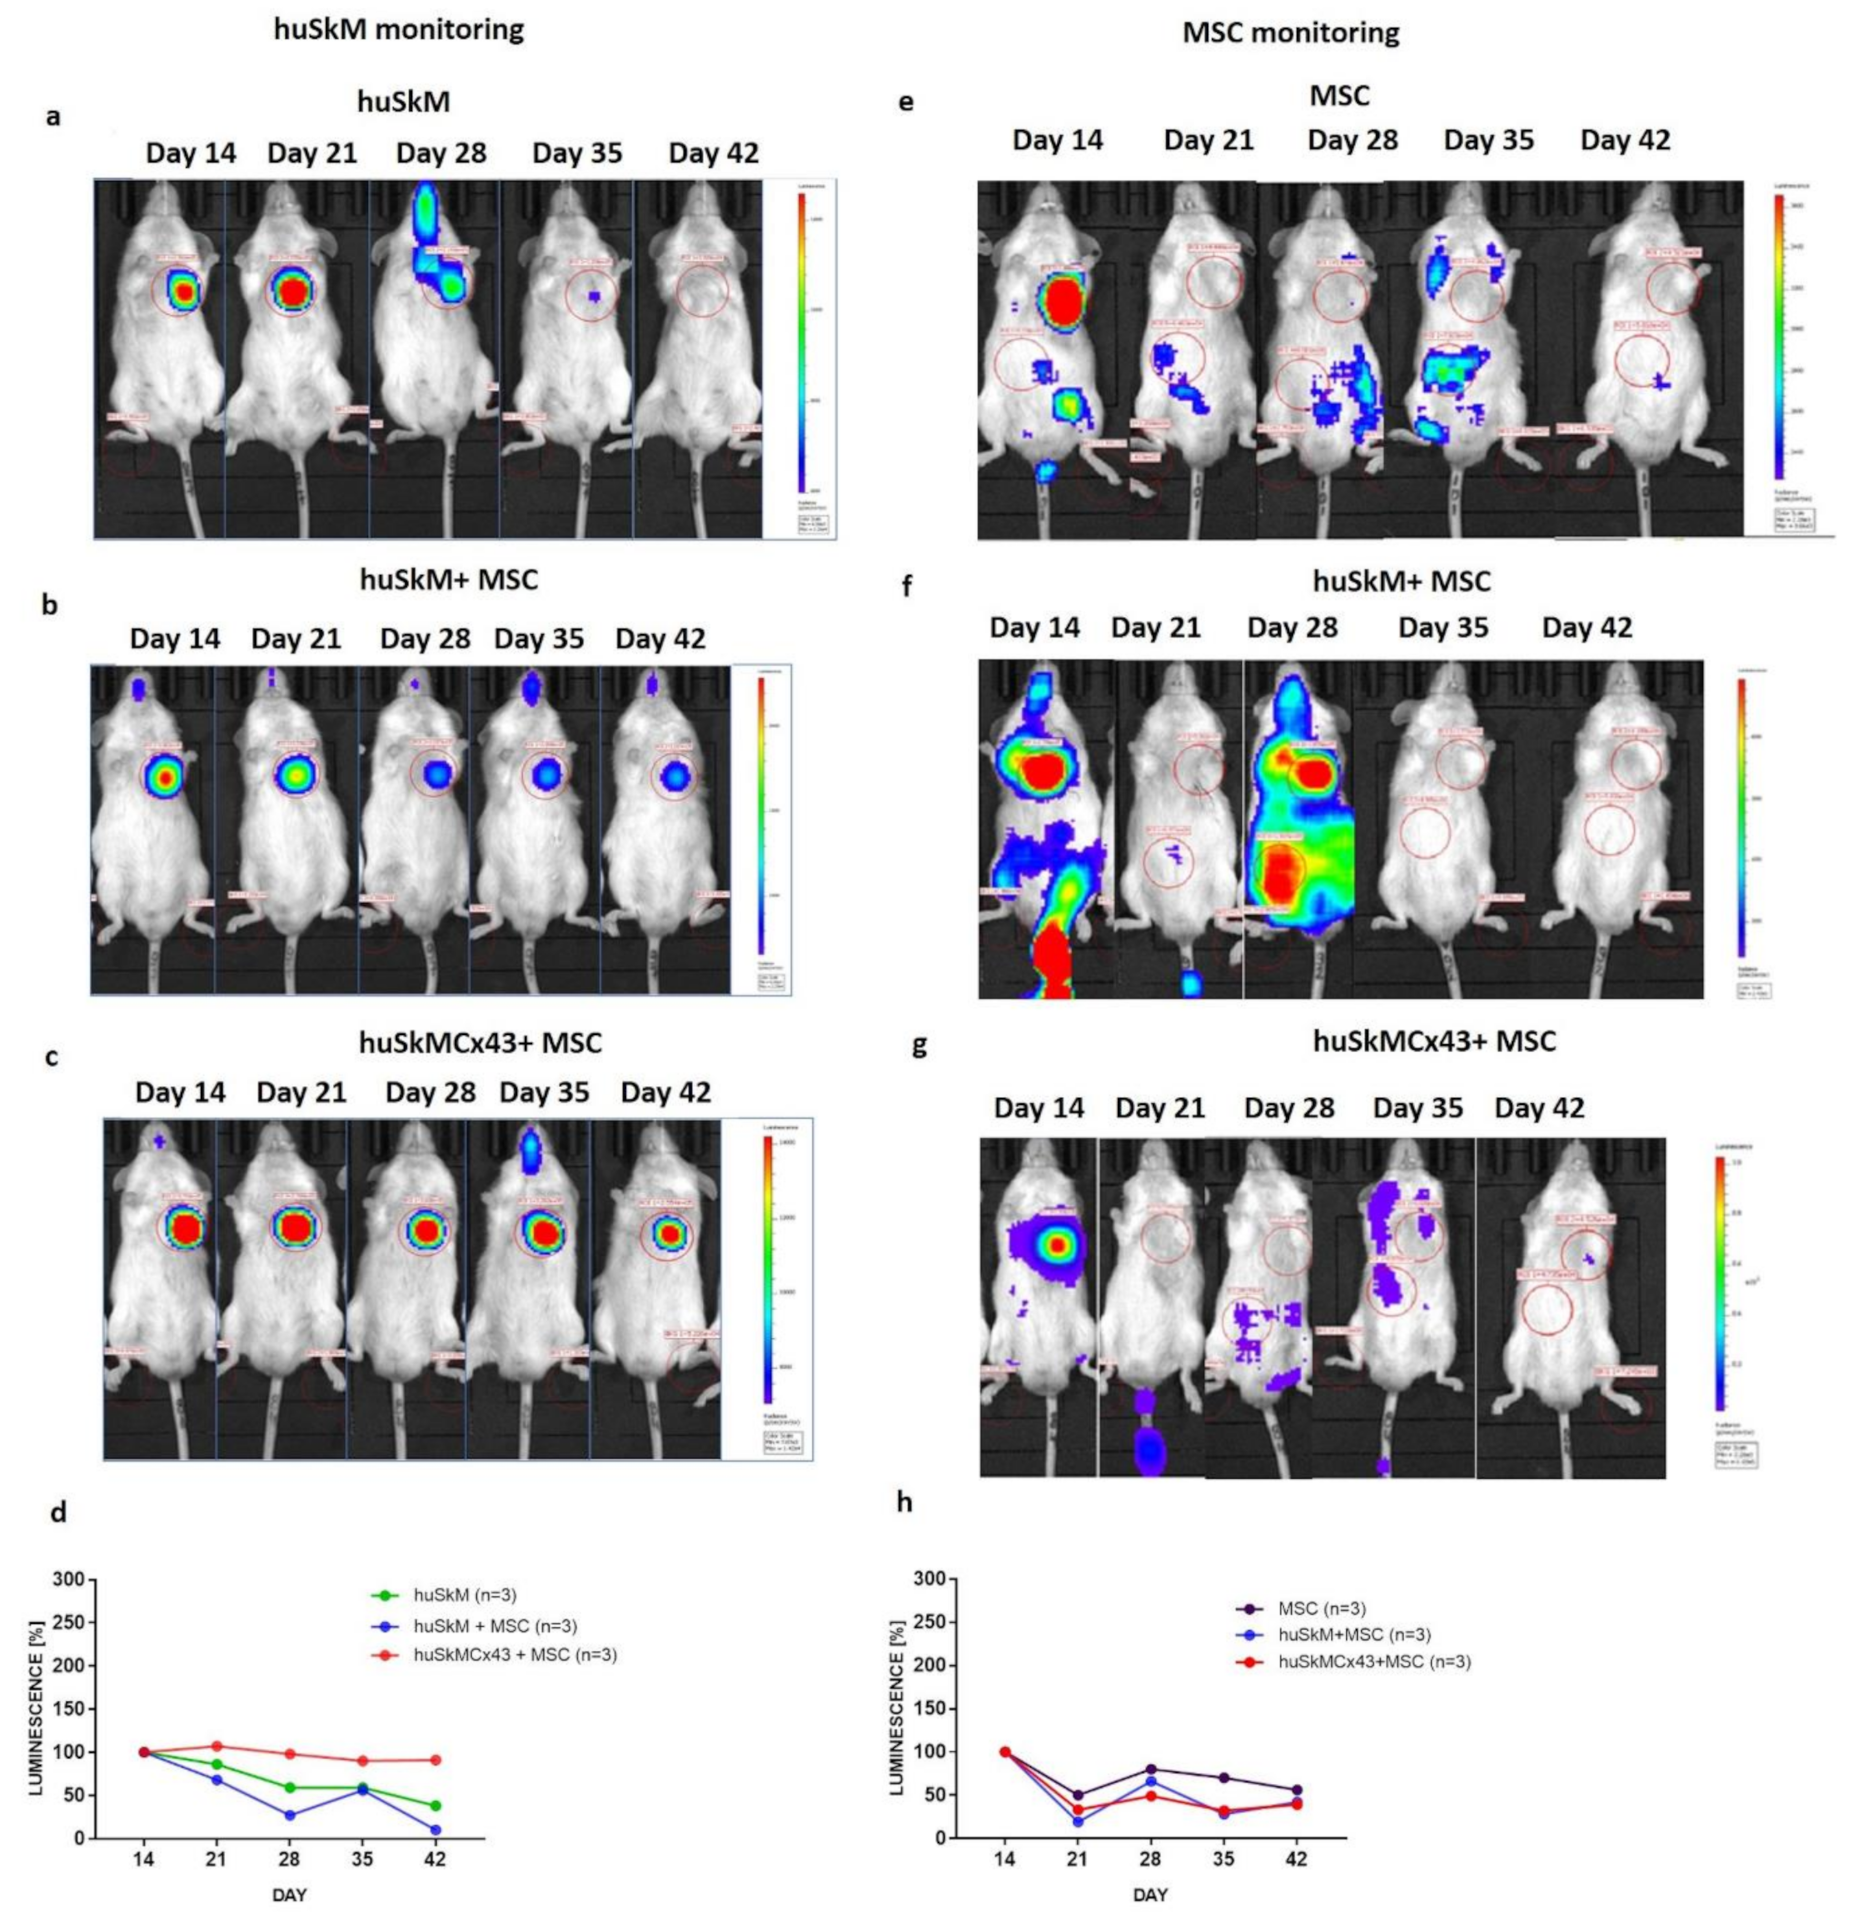
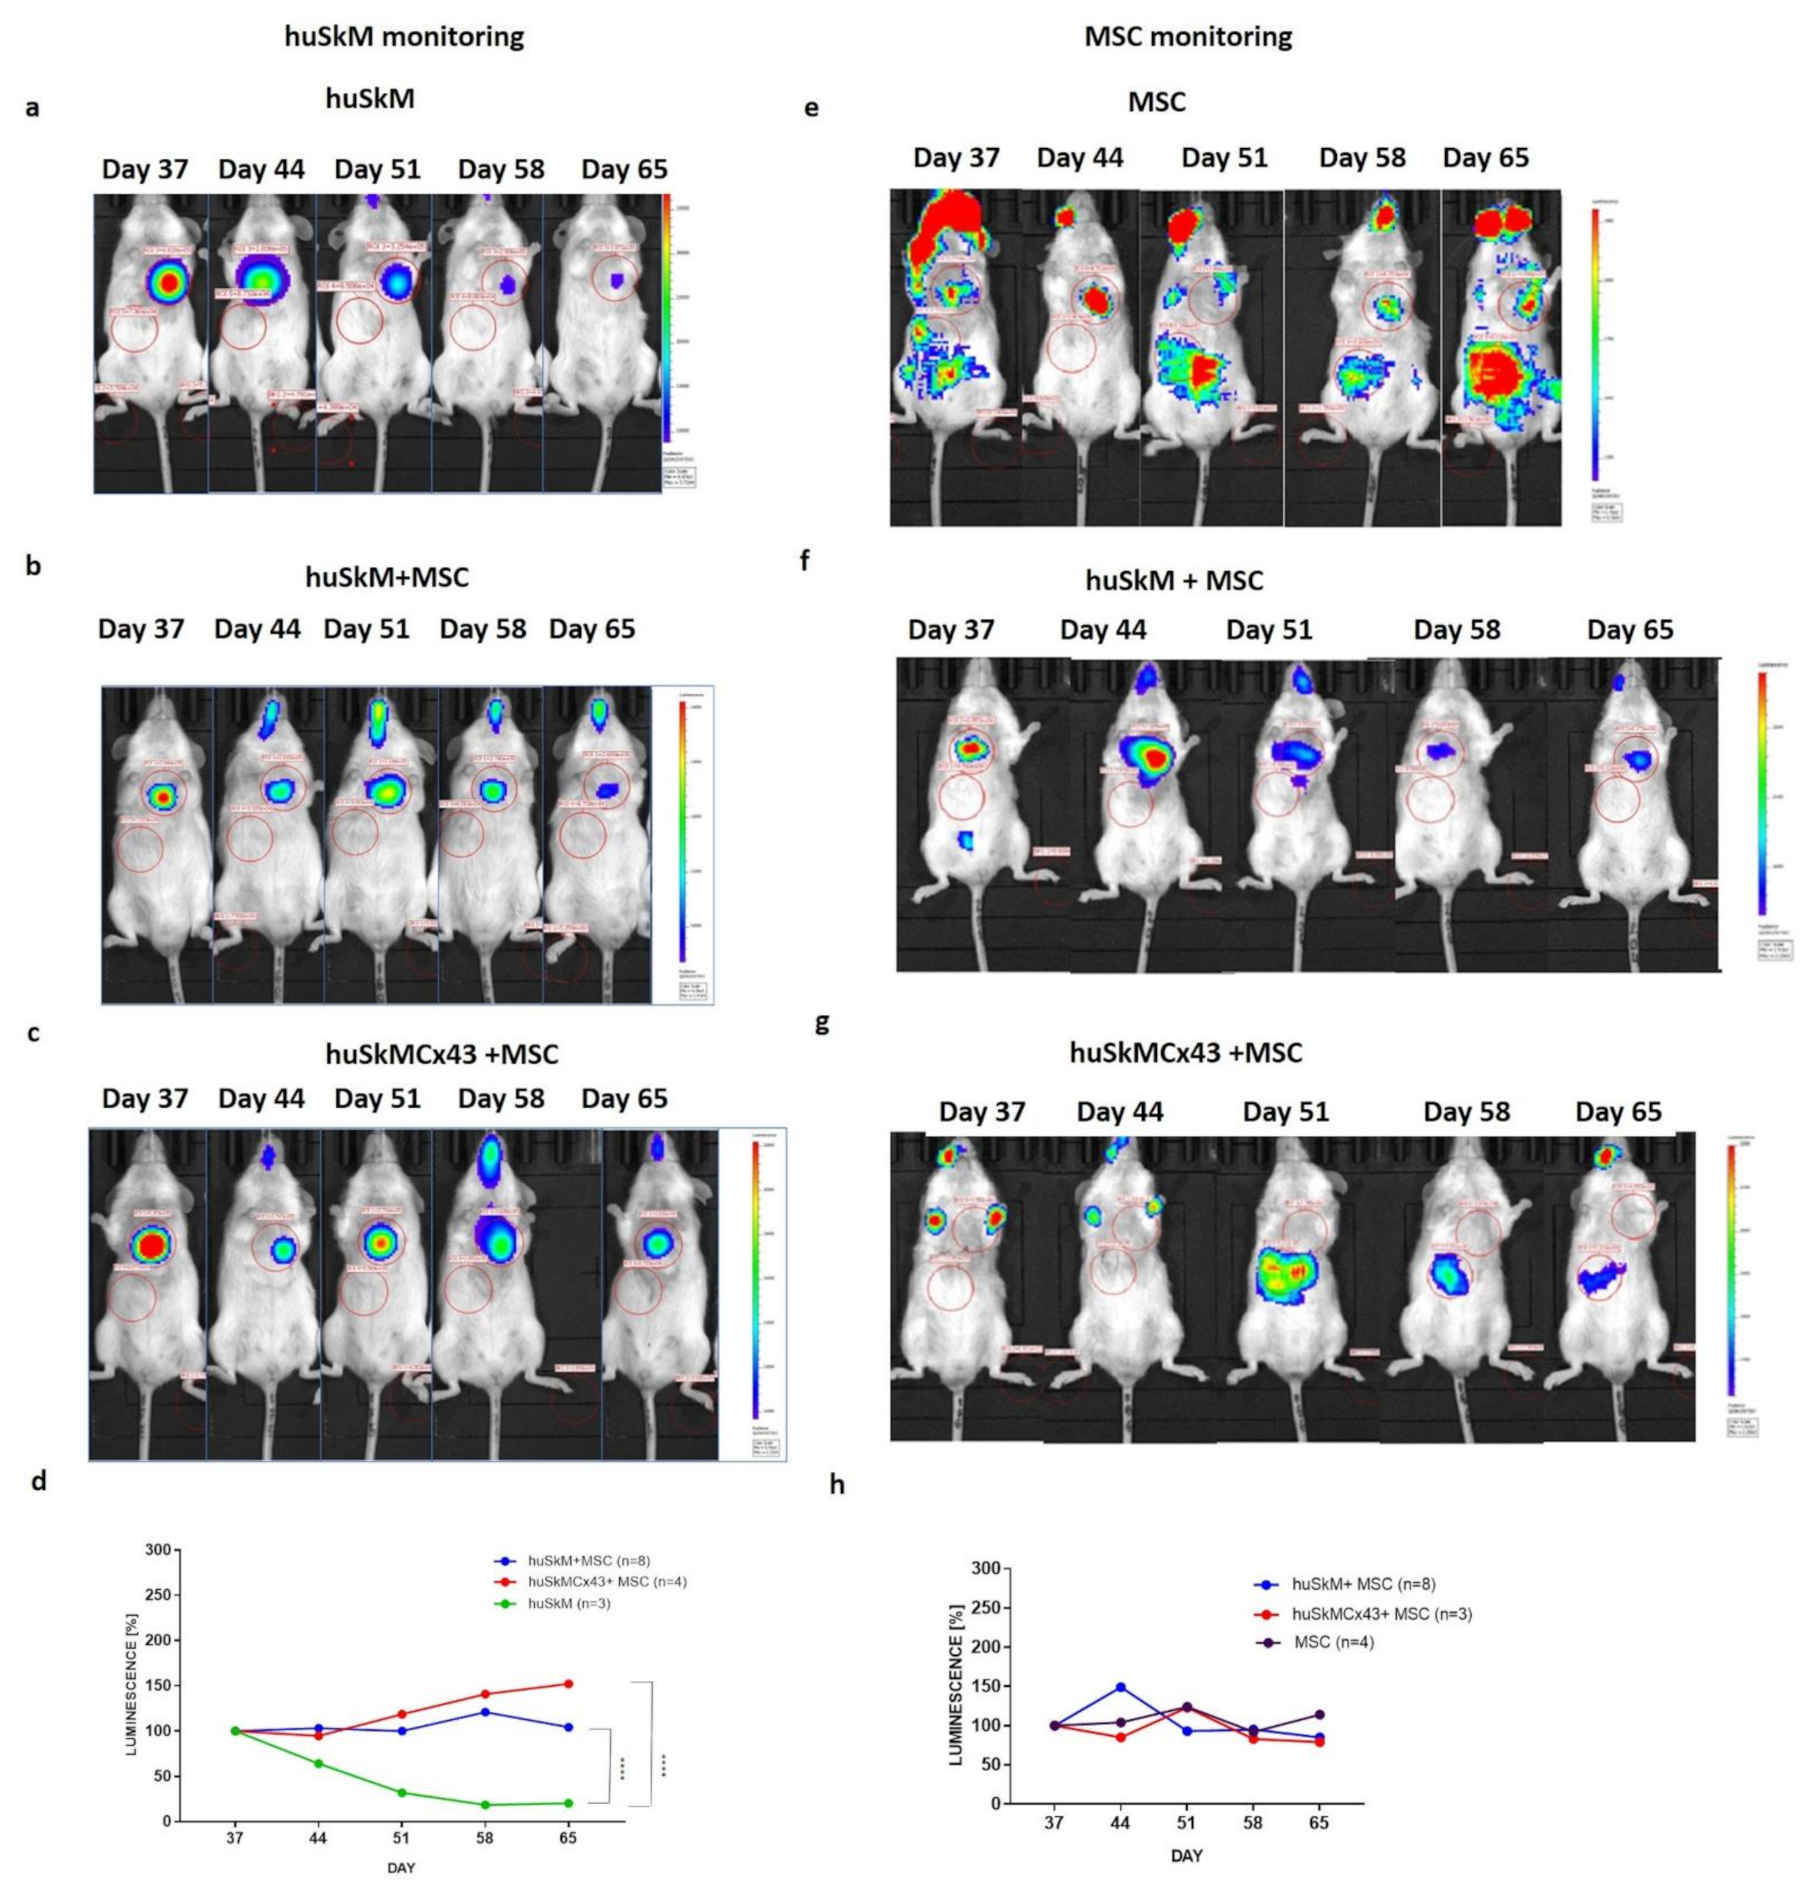
2.6. BLI
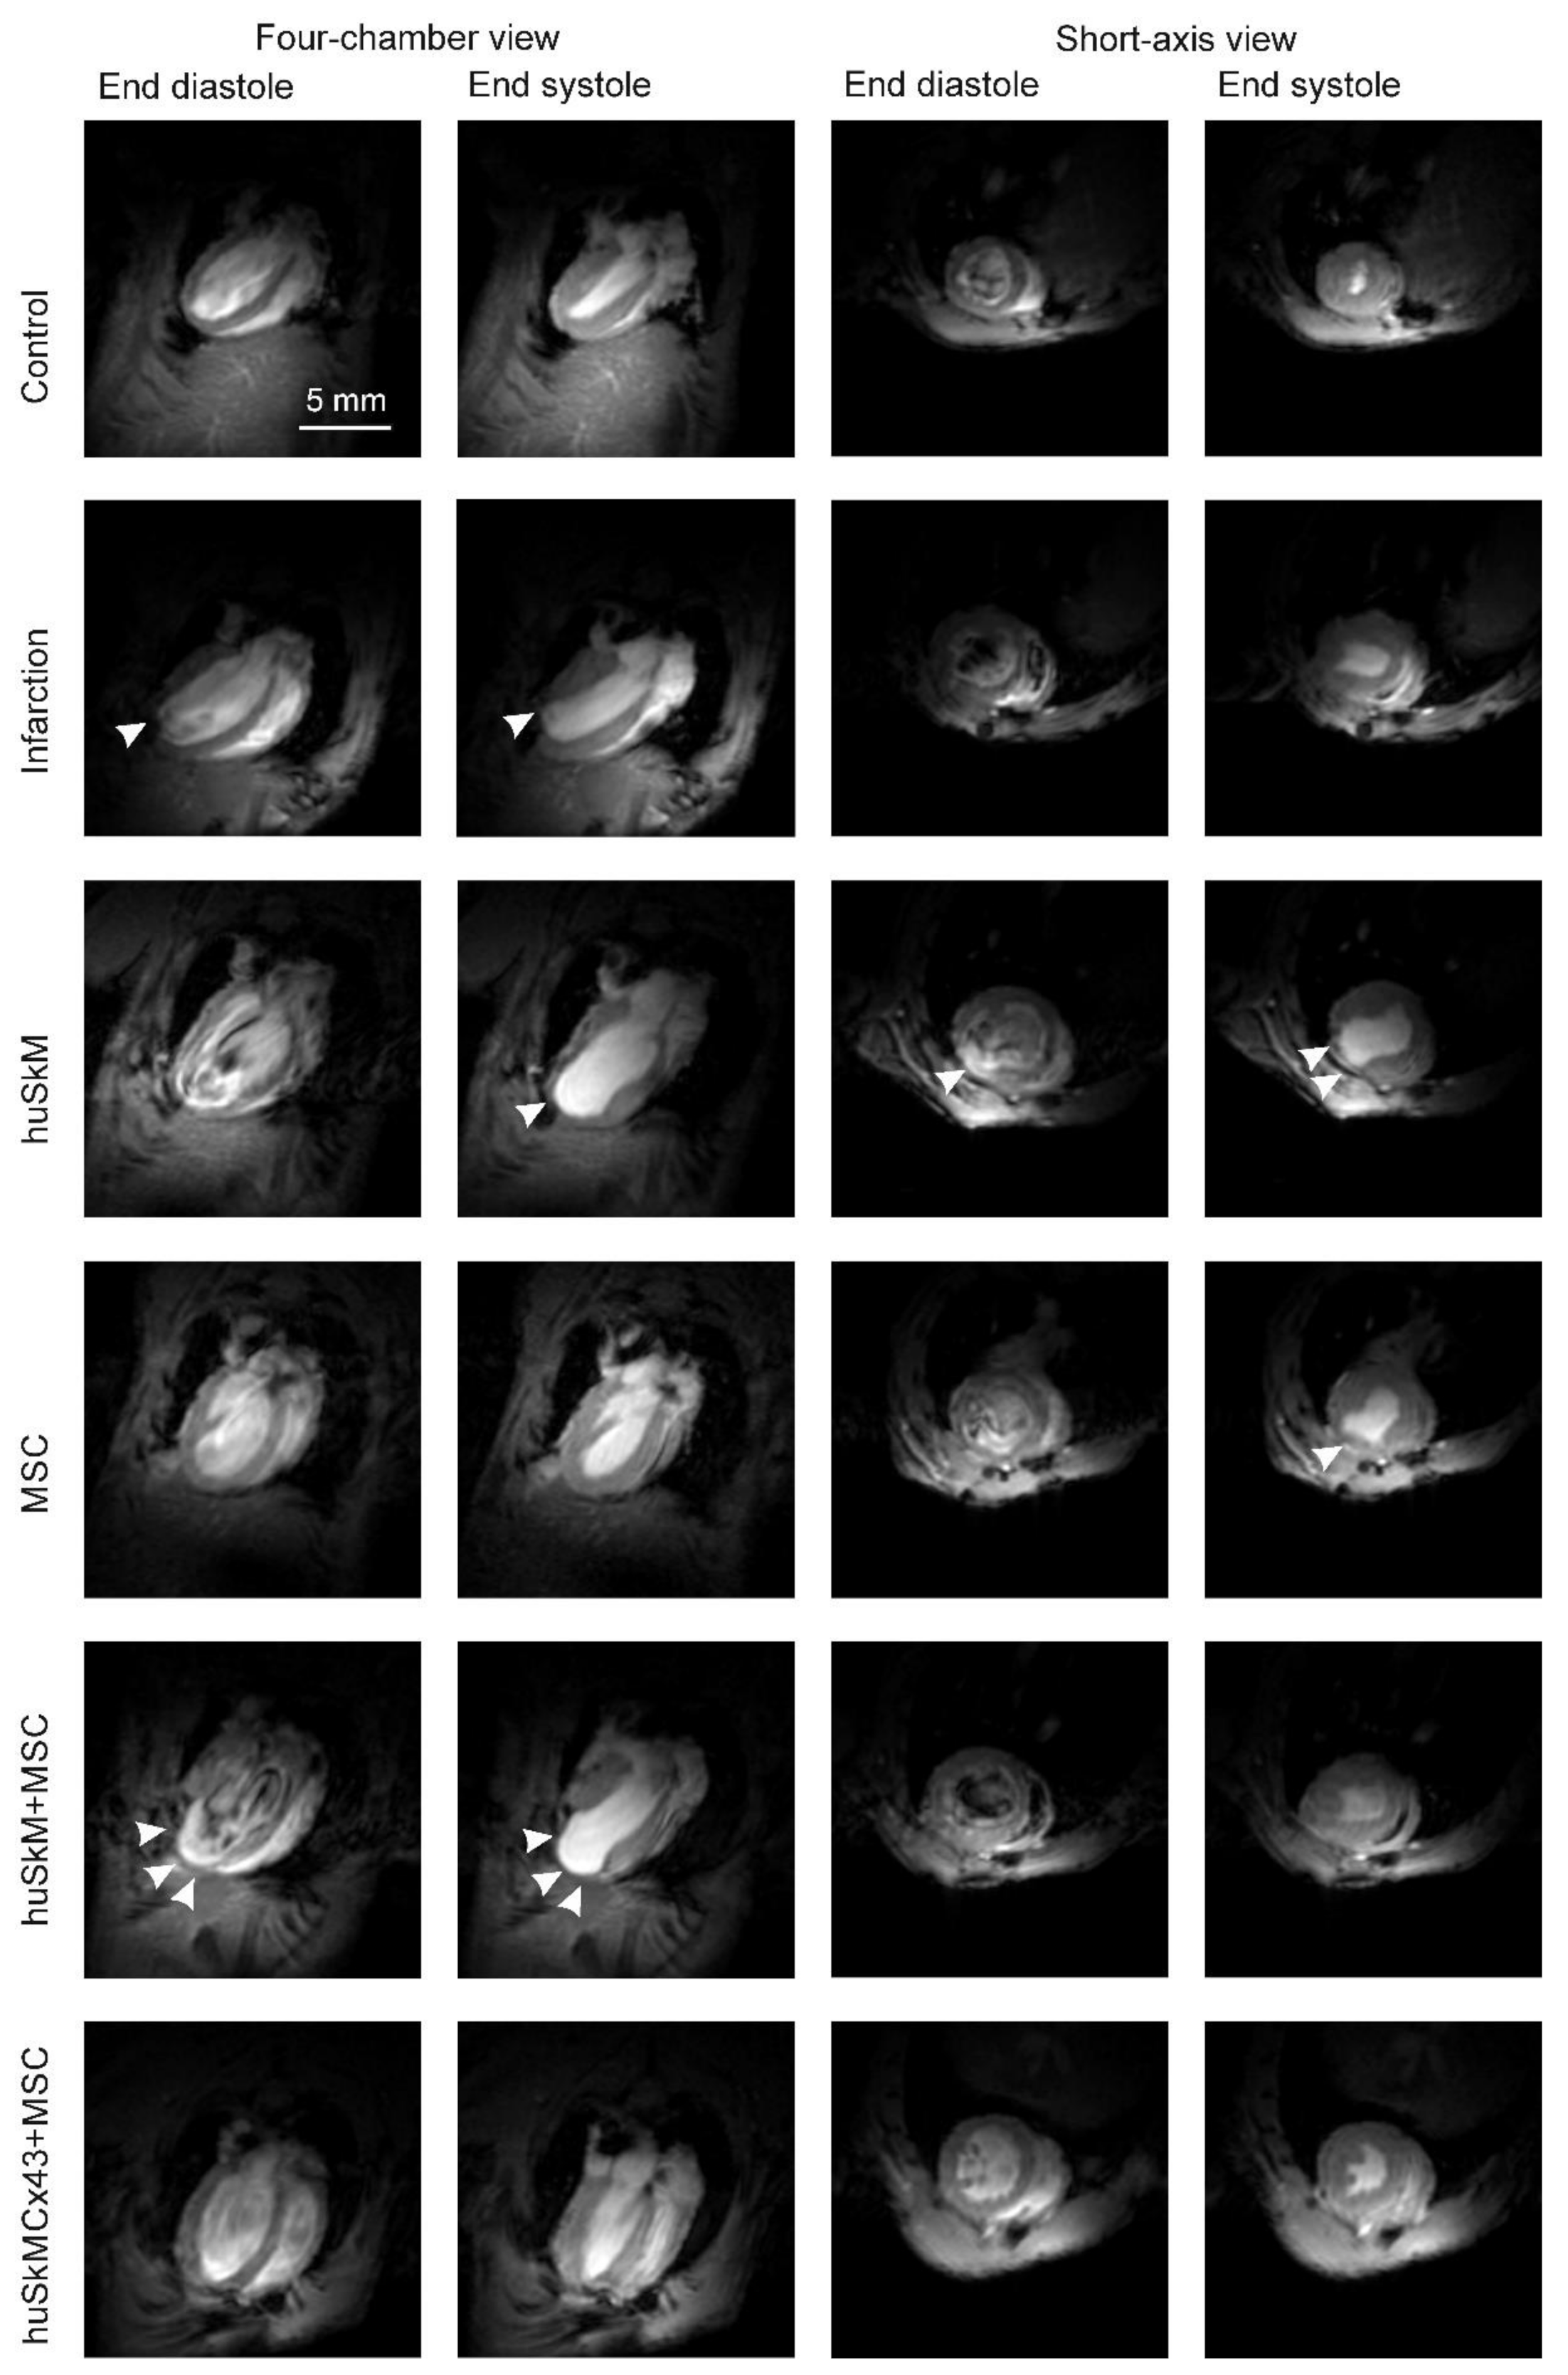
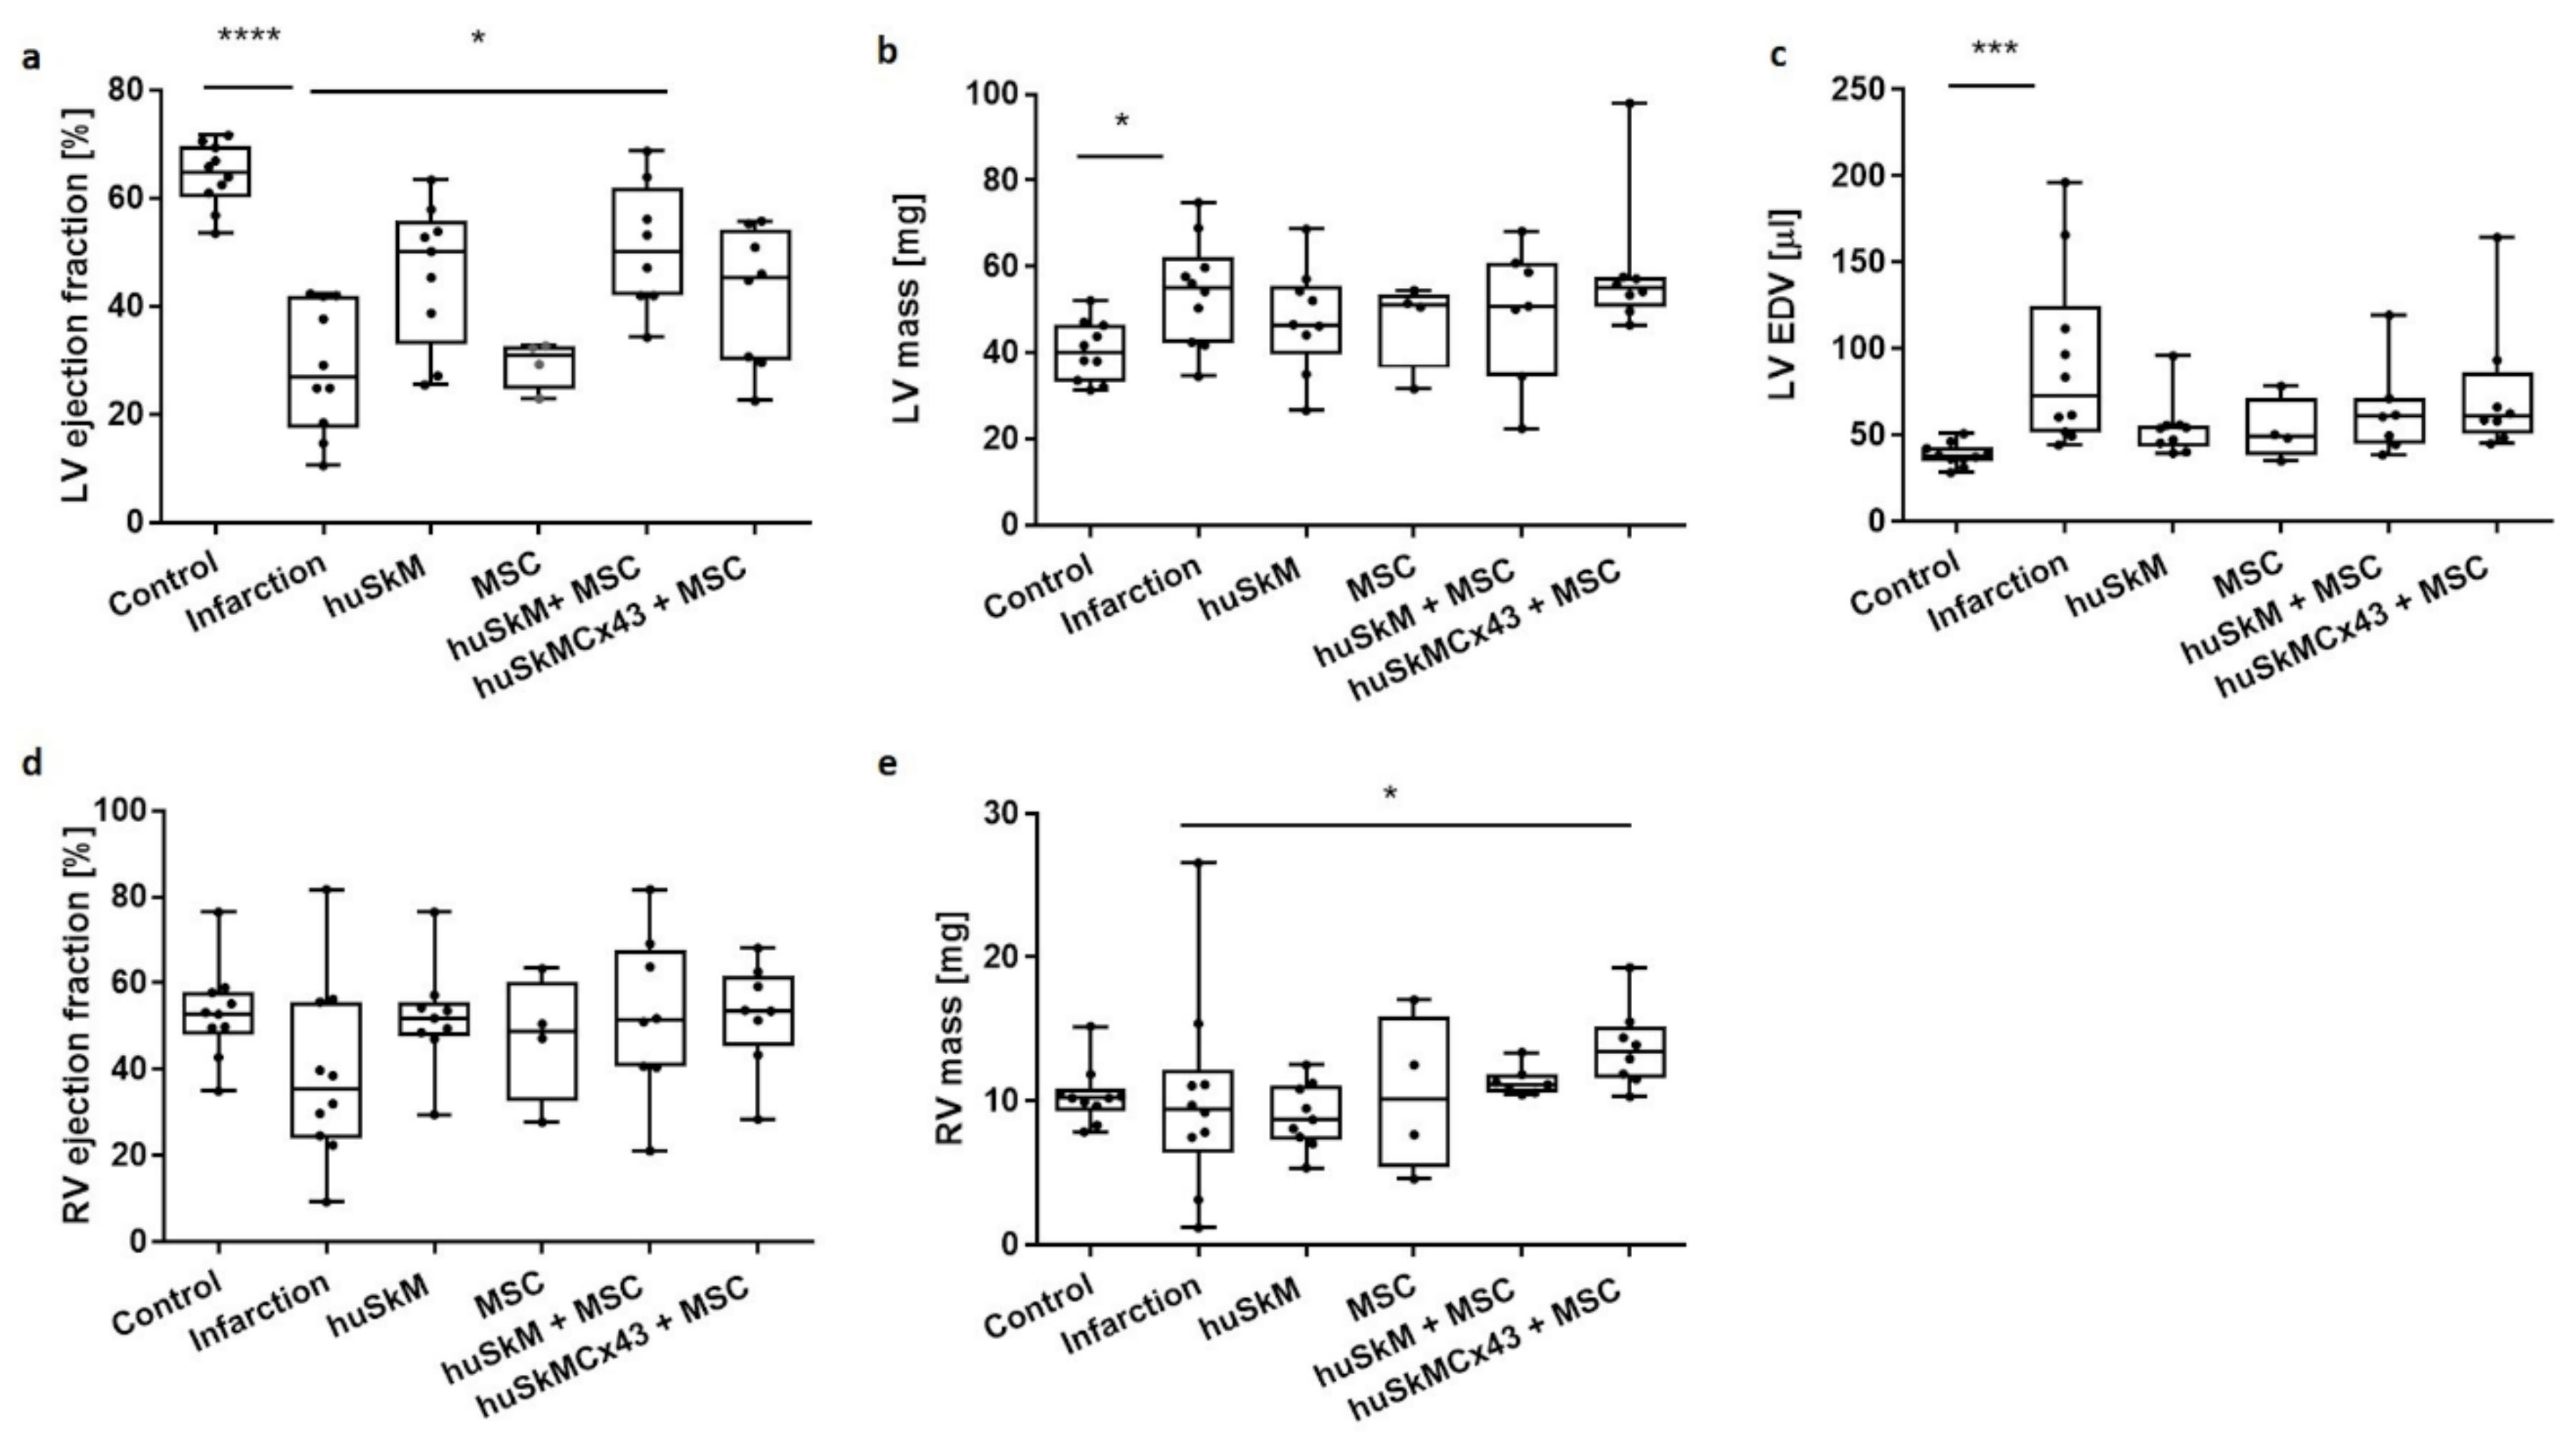
2.7. MRI
3. Discussion
4. Materials and Methods
4.1. In Vitro Cell Culture
4.1.1. husk
4.1.2. Isolation and In Vitro Culture of Mesenchymal Stem Cells
4.2. Construction of Lentiviral Plasmids
4.2.1. Lentiviral Packaging
4.2.2. Lentiviral Transduction of huSkM and Mesenchymal Stem Cells
4.2.3. Estimation of Insert Copy Number by Quantitative Real-Time Polymerase Chain Reaction (qPCR)
4.3. Connexin 43 Plasmid Construction and Cx43 Overexpression in huSkM
4.4. Animal Model
4.5. Induction and Evaluation of Myocardial Infarction
4.6. SPECT and CT Imaging
4.7. PET/CT
4.8. Bioluminescent Imaging
4.9. MRI Acquisition
4.10. MRI Data Analysis
4.11. Statistical Analysis
5. Conclusions
Supplementary Materials
Author Contributions
Funding
Institutional Review Board Statement
Informed Consent Statement
Data Availability Statement
Acknowledgments
Conflicts of Interest
Abbreviations
References
- Garbern, J.C.; Lee, R.T. Cardiac stem cell therapy and the promise of heart regeneration. Cell Stem Cell 2013, 12, 689–698. [Google Scholar] [CrossRef] [Green Version]
- Guan, X.; Xu, W.; Zhang, H.; Wang, Q.; Yu, J.; Zhang, R.; Chen, Y.; Xia, Y.; Wang, J.; Wang, D. Transplantation of human induced pluripotent stem cell-derived cardiomyocytes improves myocardial function and reverses ventricular remodeling in infarcted rat hearts. Stem Cell Res. Ther. 2020, 11, 73. [Google Scholar] [CrossRef] [Green Version]
- Li, G.; Chen, J.; Zhang, X.; He, G.; Ta, W.; Wu, H.; Li, R.; Chen, Y.; Gu, R.; Xie, J.; et al. Cardiac repair in a mouse model of acute myocardial infarction with trophoblast stem cells. Sci. Rep. 2017, 7, 44376. [Google Scholar] [CrossRef] [Green Version]
- He, K.L.; Yi, G.H.; Sherman, W.; Zhou, H.; Zhang, G.P.; Gu, A.; Kao, R.; Haimes, H.B.; Harvey, J.; Roos, E.; et al. Autologous skeletal myoblast transplantation improved hemodynamics and left ventricular function in chronic heart failure dogs. J. Hear Lung Transplant. 2005, 24, 1940–1949. [Google Scholar] [CrossRef]
- Gavira, J.J.; Nasarre, E.; Abizanda, G.; Pérez-Ilzarbe, M.; de Martino-Rodriguez, A.; de Jalón, J.A.G.; Mazo, M.; Macias, A.; García-Bolao, I.; Pelacho, B.; et al. Repeated implantation of skeletal myoblast in a swine model of chronic myocardial infarion. Eur. Heart J. 2010, 31, 1013–1021. [Google Scholar] [CrossRef] [Green Version]
- Herrerosa, J.; Prósper, F.; Perez, A.; Gavira, J.J.; Garcia-Velloso, M.J.; Barba, J.; Sánchez, P.L.; Cañizo, C.; Rábago, G.; Martí-Climent, J.M.; et al. Autologous intramyocardial injection of cultured skeletal muscle-derived stem cells in patients with non-acute myocardial infarction. Eur. Heart J. 2003, 24, 2012–2020. [Google Scholar] [CrossRef] [PubMed] [Green Version]
- Menasché, P.; Alfieri, O.; Janssens, S.; McKenna, W.; Reichenspurner, H.; Trinquart, L.; Vilquin, J.T.; Marolleau, J.P.; Seymour, B.; Larghero, J.; et al. The myoblast autologous grafting in ischemic cardiomyopathy (MAGIC) trial: First randomized placebo-controlled study of myoblast transplantation. Circulation 2008, 117, 1189–1200. [Google Scholar] [CrossRef] [PubMed] [Green Version]
- Beaudry, M.; Hidalgo, M.; Launay, T.; Bello, V.; Darribère, T. Regulation of myogenesis by environmental hypoxia. J. Cell Sci. 2016, 129, 2887–2896. [Google Scholar] [CrossRef] [PubMed] [Green Version]
- Suzuki, K.; Murtuza, B.; Smolenski, R.T.; Sammut, I.A.; Suzuki, N.; Kaneda, Y.; Yacoub, M.H. Cell transplantation for the treatment of acute myocardial infarction using vascular endothelial growth factor-expressing skeletal myoblasts. Circulation 2001, 104, I207–I212. [Google Scholar] [CrossRef] [Green Version]
- Zimna, A.; Wiernicki, B.; Kolanowski, T.; Rozwadowska, N.; Malcher, A.; Labedz, W.; Trzeciak, T.; Chojnacka, K.; Bednarek-Rajewska, K.; Majewski, P.; et al. Biological and Pro-Angiogenic Properties of Genetically Modified Human Primary Myoblasts Overexpressing Placental Growth Factor in In Vitro and In Vivo Studies. Arch. Immunol. Ther. Exp. 2018, 66, 145–159. [Google Scholar] [CrossRef] [Green Version]
- Wang, B.; Zhang, L.; Cao, H.; Yang, J.; Wu, M.; Ma, Y.; Fan, H.; Zhan, Z.; Liu, Z. Myoblast transplantation improves cardiac function after myocardial infarction through attenuating inflammatory responses. Oncotarget 2017, 8, 68780–68794. [Google Scholar] [CrossRef] [Green Version]
- Rodríguez-Sinovas, A.; Antonio Sánchez, J.; Valls-Lacalle, L.; Consegal, M.; Ferreira-González, I. Connexins in the Heart: Regulation, Function and Involvementin Cardiac Disease. Int. J. Mol. Sci. 2021, 22, 4413. [Google Scholar] [CrossRef]
- Gwizdała, A.; Rozwadowska, N.; Kolanowski, T.J.; Cieplucha, A.; Perek, B.; Seniuk, W.; Straburzynska-Migaj, E.; Oko-Sarnowska, Z.; Cholewinski, W.; Michalak, M.; et al. Safety, feasibility and effectiveness of first in-human administration of muscle-derived stem/progenitor cells modified with connexin-43 gene for treatment of advanced chronic heart failure. Eur. J. Heart Fail. 2017, 19, 148–157. [Google Scholar] [CrossRef] [Green Version]
- Suzuki, K.; Brand, N.J.; Allen, S.; Khan, M.A.; Farrell, A.O.; Murtuza, B.; Oakley, R.E.; Yacoub, M.H. Overexpression of connexin 43 in skeletal myoblasts: Relevance to cell transplantation to the heart. J. Thorac. Cardiovasc. Surg. 2001, 122, 759–766. [Google Scholar] [CrossRef] [Green Version]
- Tolmachov, O.; Ma, Y.L.; Themis, M.; Patel, P.; Spohr, H.; Macleod, K.T.; Ullrich, N.D.; Kienast, Y.; Coutelle, C.; Peters, N.S. Overexpression of connexin 43 using a retroviral vector improves electrical coupling of skeletal myoblasts with cardiac myocytes in vitro. BMC Cardiovasc. Disord. 2006, 6, 25. [Google Scholar] [CrossRef] [Green Version]
- Abraham, M.R.; Henrikson, C.A.; Tung, L.; Chang, M.G.; Aon, M.; Xue, T.; Li, R.A.; O’Rourke, B.; Marbán, E. Antiarrhythmic engineering of skeletal myoblasts for cardiac transplantation. Circ. Res. 2005, 97, 159–167. [Google Scholar] [CrossRef] [Green Version]
- Murphy, M.B.; Moncivais, K.; Caplan, A.I. Mesenchymal stem cells: Environmentally responsive therapeutics for regenerative medicine. Exp. Mol. Med. 2013, 45, e54. [Google Scholar] [CrossRef] [PubMed] [Green Version]
- Ward, M.R.; Abadeh, A.; Connelly, K.A. Concise review: Rational use of mesenchymal stem cells in the treatment of ischemic heart disease. Stem Cells Transl. Med. 2018, 7, 543–550. [Google Scholar] [CrossRef] [PubMed]
- Kinnaird, T.; Stabile, E.; Burnett, M.S.; Shou, M.; Lee, C.W.; Barr, S.; Fuchs, S.; Epstein, S.E. Local Delivery of Marrow-Derived Stromal Cells Augments Collateral Perfusion Through Paracrine Mechanisms. Circulation 2004, 109, 1543–1549. [Google Scholar] [CrossRef] [PubMed]
- Haynesworth, S.E.; Baber, M.A.; Caplan, A.I. Cytokine expression by human marrow-derived mesenchymal progenitor cells in vitro: Effects of dexamethasone and IL-1α. J. Cell Physiol. 1996, 166, 585–592. [Google Scholar] [CrossRef]
- Kozlowska, U.; Krawczenko, A.; Futoma, K.; Jurek, T.; Rorat, M.; Patrzalek, D.; Klimczak, A. Similarities and differences between mesenchymal stem/progenitor cells derived from various human tissues. World J. Stem Cells 2019, 11, 347–374. [Google Scholar] [CrossRef]
- Tabakov, V.Y.; Zinov’eva, O.E.; Voskresenskaya, O.N.; Skoblov, M.Y. Isolation and Characterization of Human Myoblast Culture In Vitro for Technologies of Cell and Gene Therapy of Skeletal Muscle Pathologies. Bull Exp. Biol. Med. 2018, 164, 536–542. [Google Scholar] [CrossRef] [PubMed]
- Badimon, L.; Oñate, B.; Vilahur, G. Adipose-derived Mesenchymal Stem Cells and Their Reparative Potential in Ischemic Heart Disease. Rev. Española Cardiol. 2015, 68, 599–611. [Google Scholar] [CrossRef]
- Fernandes, S.; Amirault, J.C.; Lande, G.; Nguyen, J.M.; Forest, V.; Bignolais, O.; Lamirault, G.; Heudes, D.; Orsonneau, J.L.; Heymann, M.F.; et al. Autologous myoblast transplantation after myocardial infarction increases the inducibility of ventricular arrhythmias. Cardiovasc Res. 2006, 69, 348–358. [Google Scholar] [CrossRef] [PubMed]
- Du Pré, B.C.; Doevendans, P.A.; Van Laake, L.W. Stem cells for cardiac repair: An introduction. J. Geriatr. Cardiol. 2013, 10, 186–197. [Google Scholar]
- Paitazoglou, C.; Bergmann, M.W.; Vrtovec, B.; Chamuleau, S.A.J.; van Klarenbosch, B.; Wojakowski, W.; Michalewska-Włudarczyk, A.; Gyöngyösi, M.; Ekblond, A.; Haack-Sørensen, M.; et al. SCIENCE Investigators. Rationale and design of the European multicentre study on Stem Cell therapy in IschEmic Non-treatable Cardiac diseasE (SCIENCE). Eur. J. Heart Fail. 2019, 21, 1032–1041. [Google Scholar] [CrossRef] [PubMed] [Green Version]
- Hudson, W.; Collins, M.C.; deFreitas, D.; Sun, Y.S.; Muller-Borer, B.; Kypson, A.P. Beating and Arrested Intramyocardial Injections are Associated with Significant Mechanical Loss: Implications for Cardiac Cell Transplantation. J. Surg. Res. 2007, 142, 263–267. [Google Scholar] [CrossRef]
- Tran, D.H.; Wang, Z.V. Glucose Metabolism in Cardiac Hypertrophy and Heart Failure. J. Am. Heart Assoc. 2019, 8, e012673. [Google Scholar] [CrossRef]
- Toma, C.; Pittenger, M.F.; Cahill, K.S.; Byrne, B.J.; Kessler, P.D. Human mesenchymal stem cells differentiate to a cardiomyocyte phenotype in the adult murine heart. Circulation 2002, 105, 93–98. [Google Scholar] [CrossRef]
- Wiernicki, B.; Rozwadowska, N.; Malcher, A.; Kolanowski, T.; Zimna, A.; Rugowska, A.; Kurpisz, M. Human myoblast transplantation in mice infarcted heart alters the expression profile of cardiac genes associated with left ventricle remodeling. Int. J. Cardiol. 2016, 202, 710–721. [Google Scholar] [CrossRef]
- Fiedorowicz, K.; Rozwadowska, N.; Zimna, A.; Malcher, A.; Tutak, K.; Szczerbal, I.; Nowicka-Bauer, K.; Nowaczyk, M.; Kolanowski, T.J.; Łabędź, W.; et al. Tissue-specific promoter-based reporter system for monitoring cell differentiation from iPSCs to cardiomyocytes. Sci. Rep. 2020, 10, 1895. [Google Scholar] [CrossRef] [PubMed]
- Fiedorowicz, M.; Khan, M.I.; Strzemecki, D.; Orzeł, J.; Wełniak-Kamińska, M.; Sobiborowicz, A.; Wieteska, M.; Rogulski, Z.; Cheda, L.; Wargocka-Matuszewska, W.; et al. Renal carcinoma CD105−/CD44−cells display stem-like properties in vitro and form aggressive tumors in vivo. Sci. Rep. 2020, 10, 5379. [Google Scholar] [CrossRef] [PubMed]


Publisher’s Note: MDPI stays neutral with regard to jurisdictional claims in published maps and institutional affiliations. |
© 2021 by the authors. Licensee MDPI, Basel, Switzerland. This article is an open access article distributed under the terms and conditions of the Creative Commons Attribution (CC BY) license (https://creativecommons.org/licenses/by/4.0/).
Share and Cite
Fiedorowicz, K.; Wargocka-Matuszewska, W.; Ambrożkiewicz, K.A.; Rugowska, A.; Cheda, Ł.; Fiedorowicz, M.; Zimna, A.; Drabik, M.; Borkowski, S.; Świątkiewicz, M.; et al. Molecular Imaging of Human Skeletal Myoblasts (huSKM) in Mouse Post-Infarction Myocardium. Int. J. Mol. Sci. 2021, 22, 10885. https://0-doi-org.brum.beds.ac.uk/10.3390/ijms221910885
Fiedorowicz K, Wargocka-Matuszewska W, Ambrożkiewicz KA, Rugowska A, Cheda Ł, Fiedorowicz M, Zimna A, Drabik M, Borkowski S, Świątkiewicz M, et al. Molecular Imaging of Human Skeletal Myoblasts (huSKM) in Mouse Post-Infarction Myocardium. International Journal of Molecular Sciences. 2021; 22(19):10885. https://0-doi-org.brum.beds.ac.uk/10.3390/ijms221910885
Chicago/Turabian StyleFiedorowicz, Katarzyna, Weronika Wargocka-Matuszewska, Karolina A. Ambrożkiewicz, Anna Rugowska, Łukasz Cheda, Michał Fiedorowicz, Agnieszka Zimna, Monika Drabik, Szymon Borkowski, Maciej Świątkiewicz, and et al. 2021. "Molecular Imaging of Human Skeletal Myoblasts (huSKM) in Mouse Post-Infarction Myocardium" International Journal of Molecular Sciences 22, no. 19: 10885. https://0-doi-org.brum.beds.ac.uk/10.3390/ijms221910885