Capsiate Intake with Exercise Training Additively Reduces Fat Deposition in Mice on a High-Fat Diet, but Not without Exercise Training


Abstract
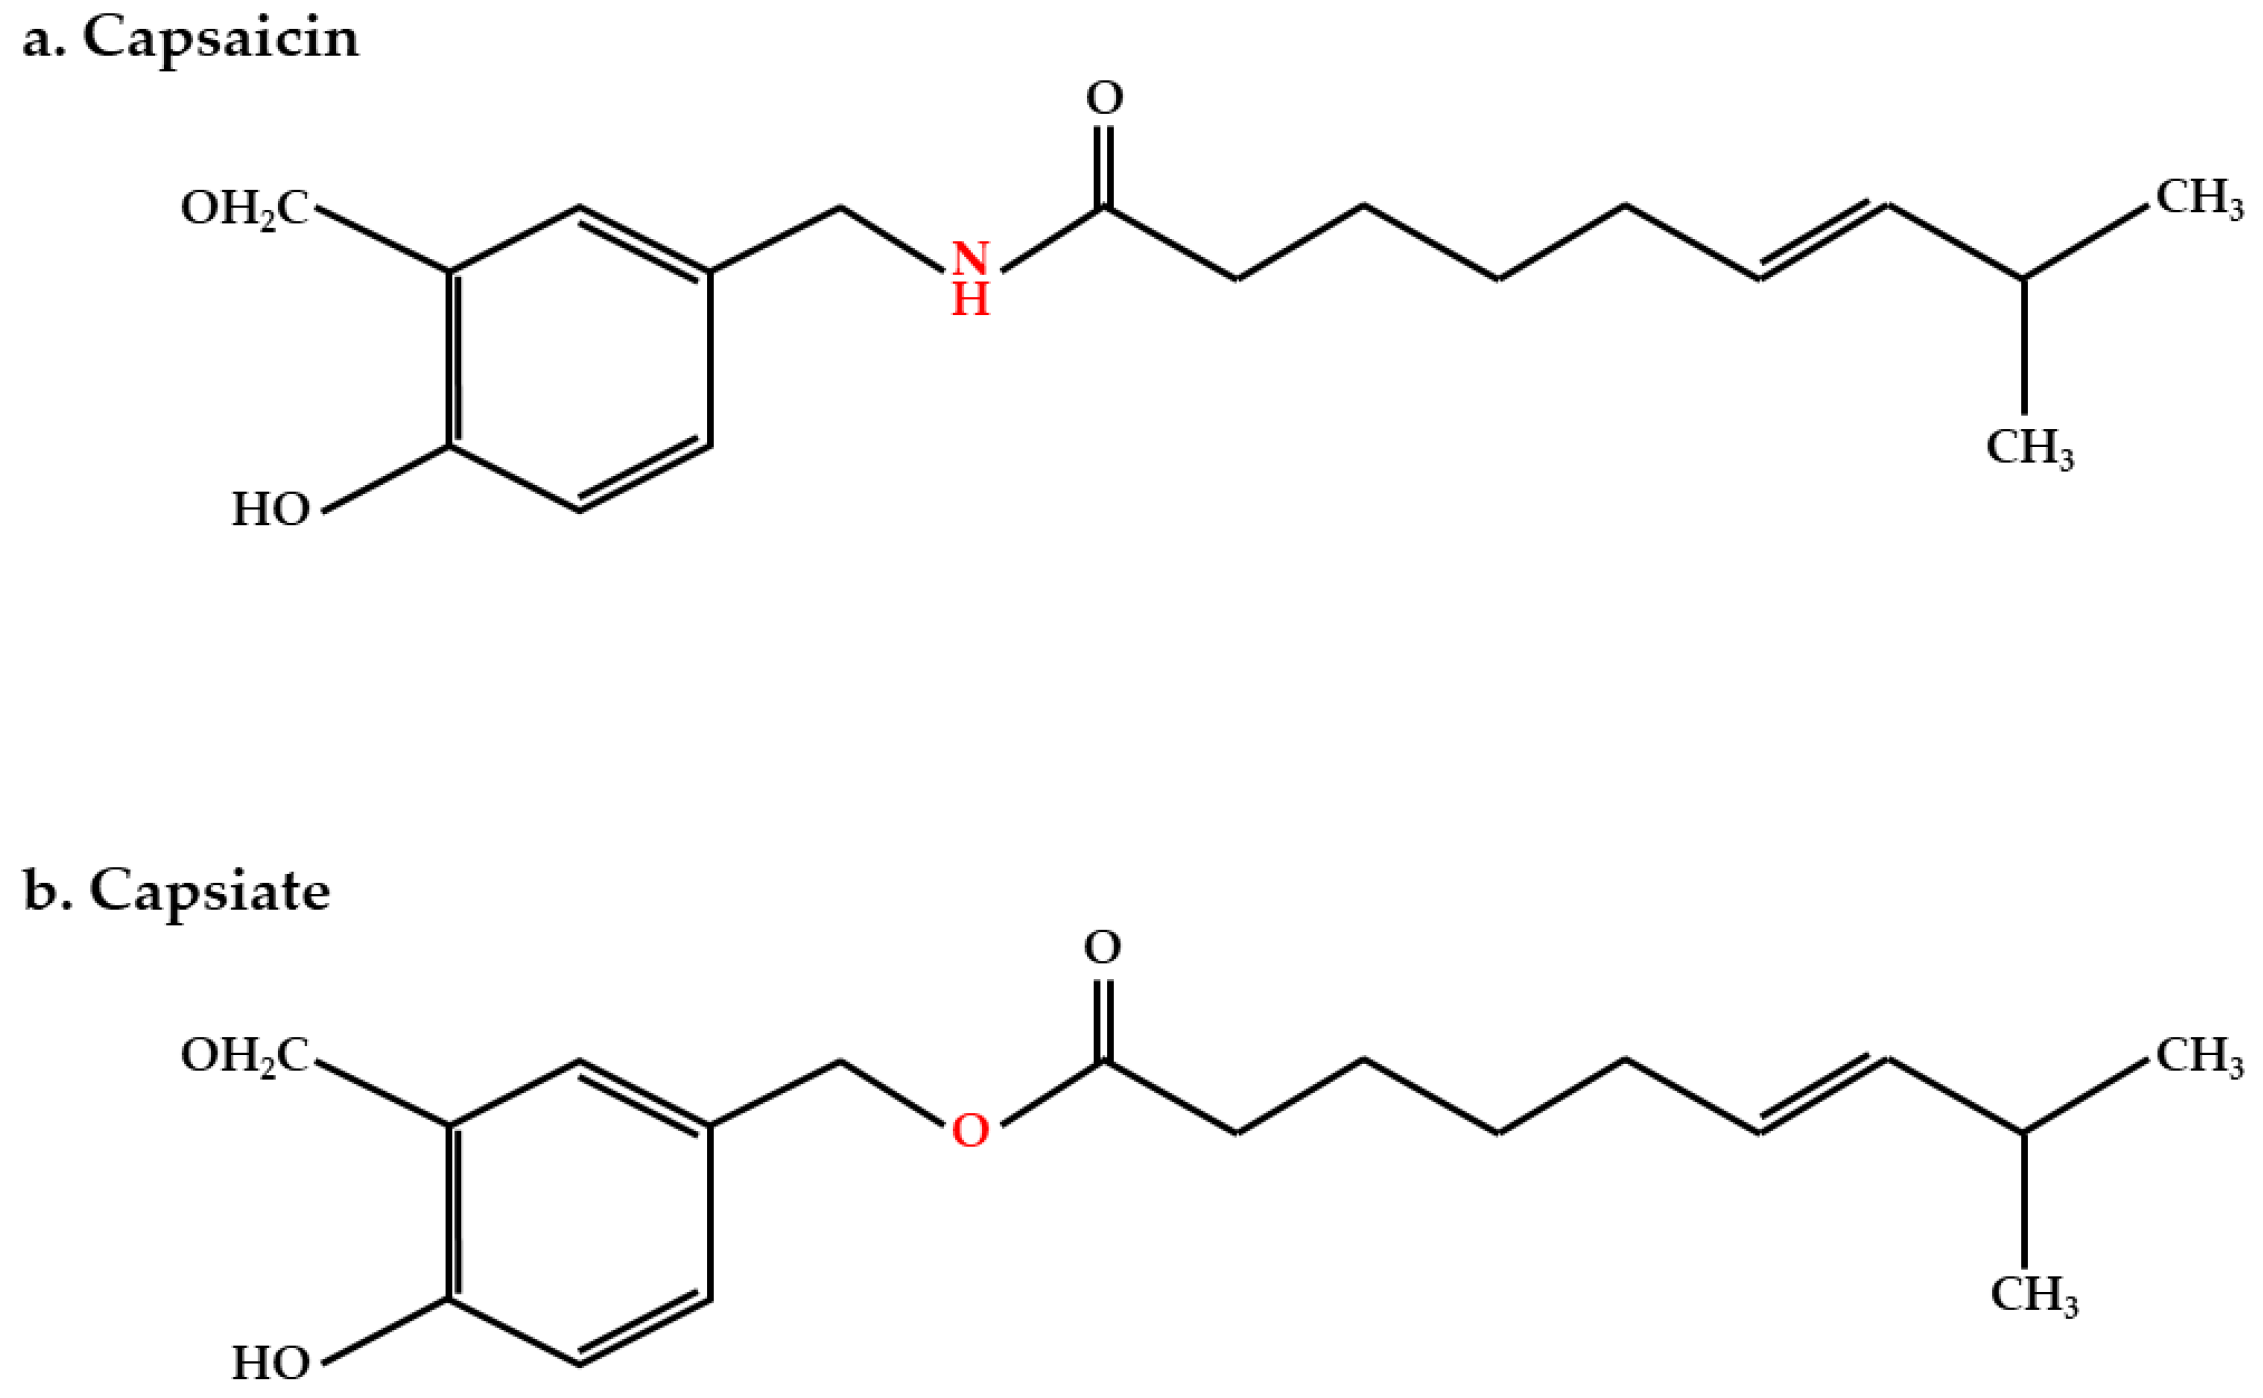
:1. Introduction
2. Results
2.1. Body Weight, Food Intake, and Feed Efficiency Ratio
2.2. The Proportion of Abdominal Fat
2.3. Metabolism-Related Molecules in Blood
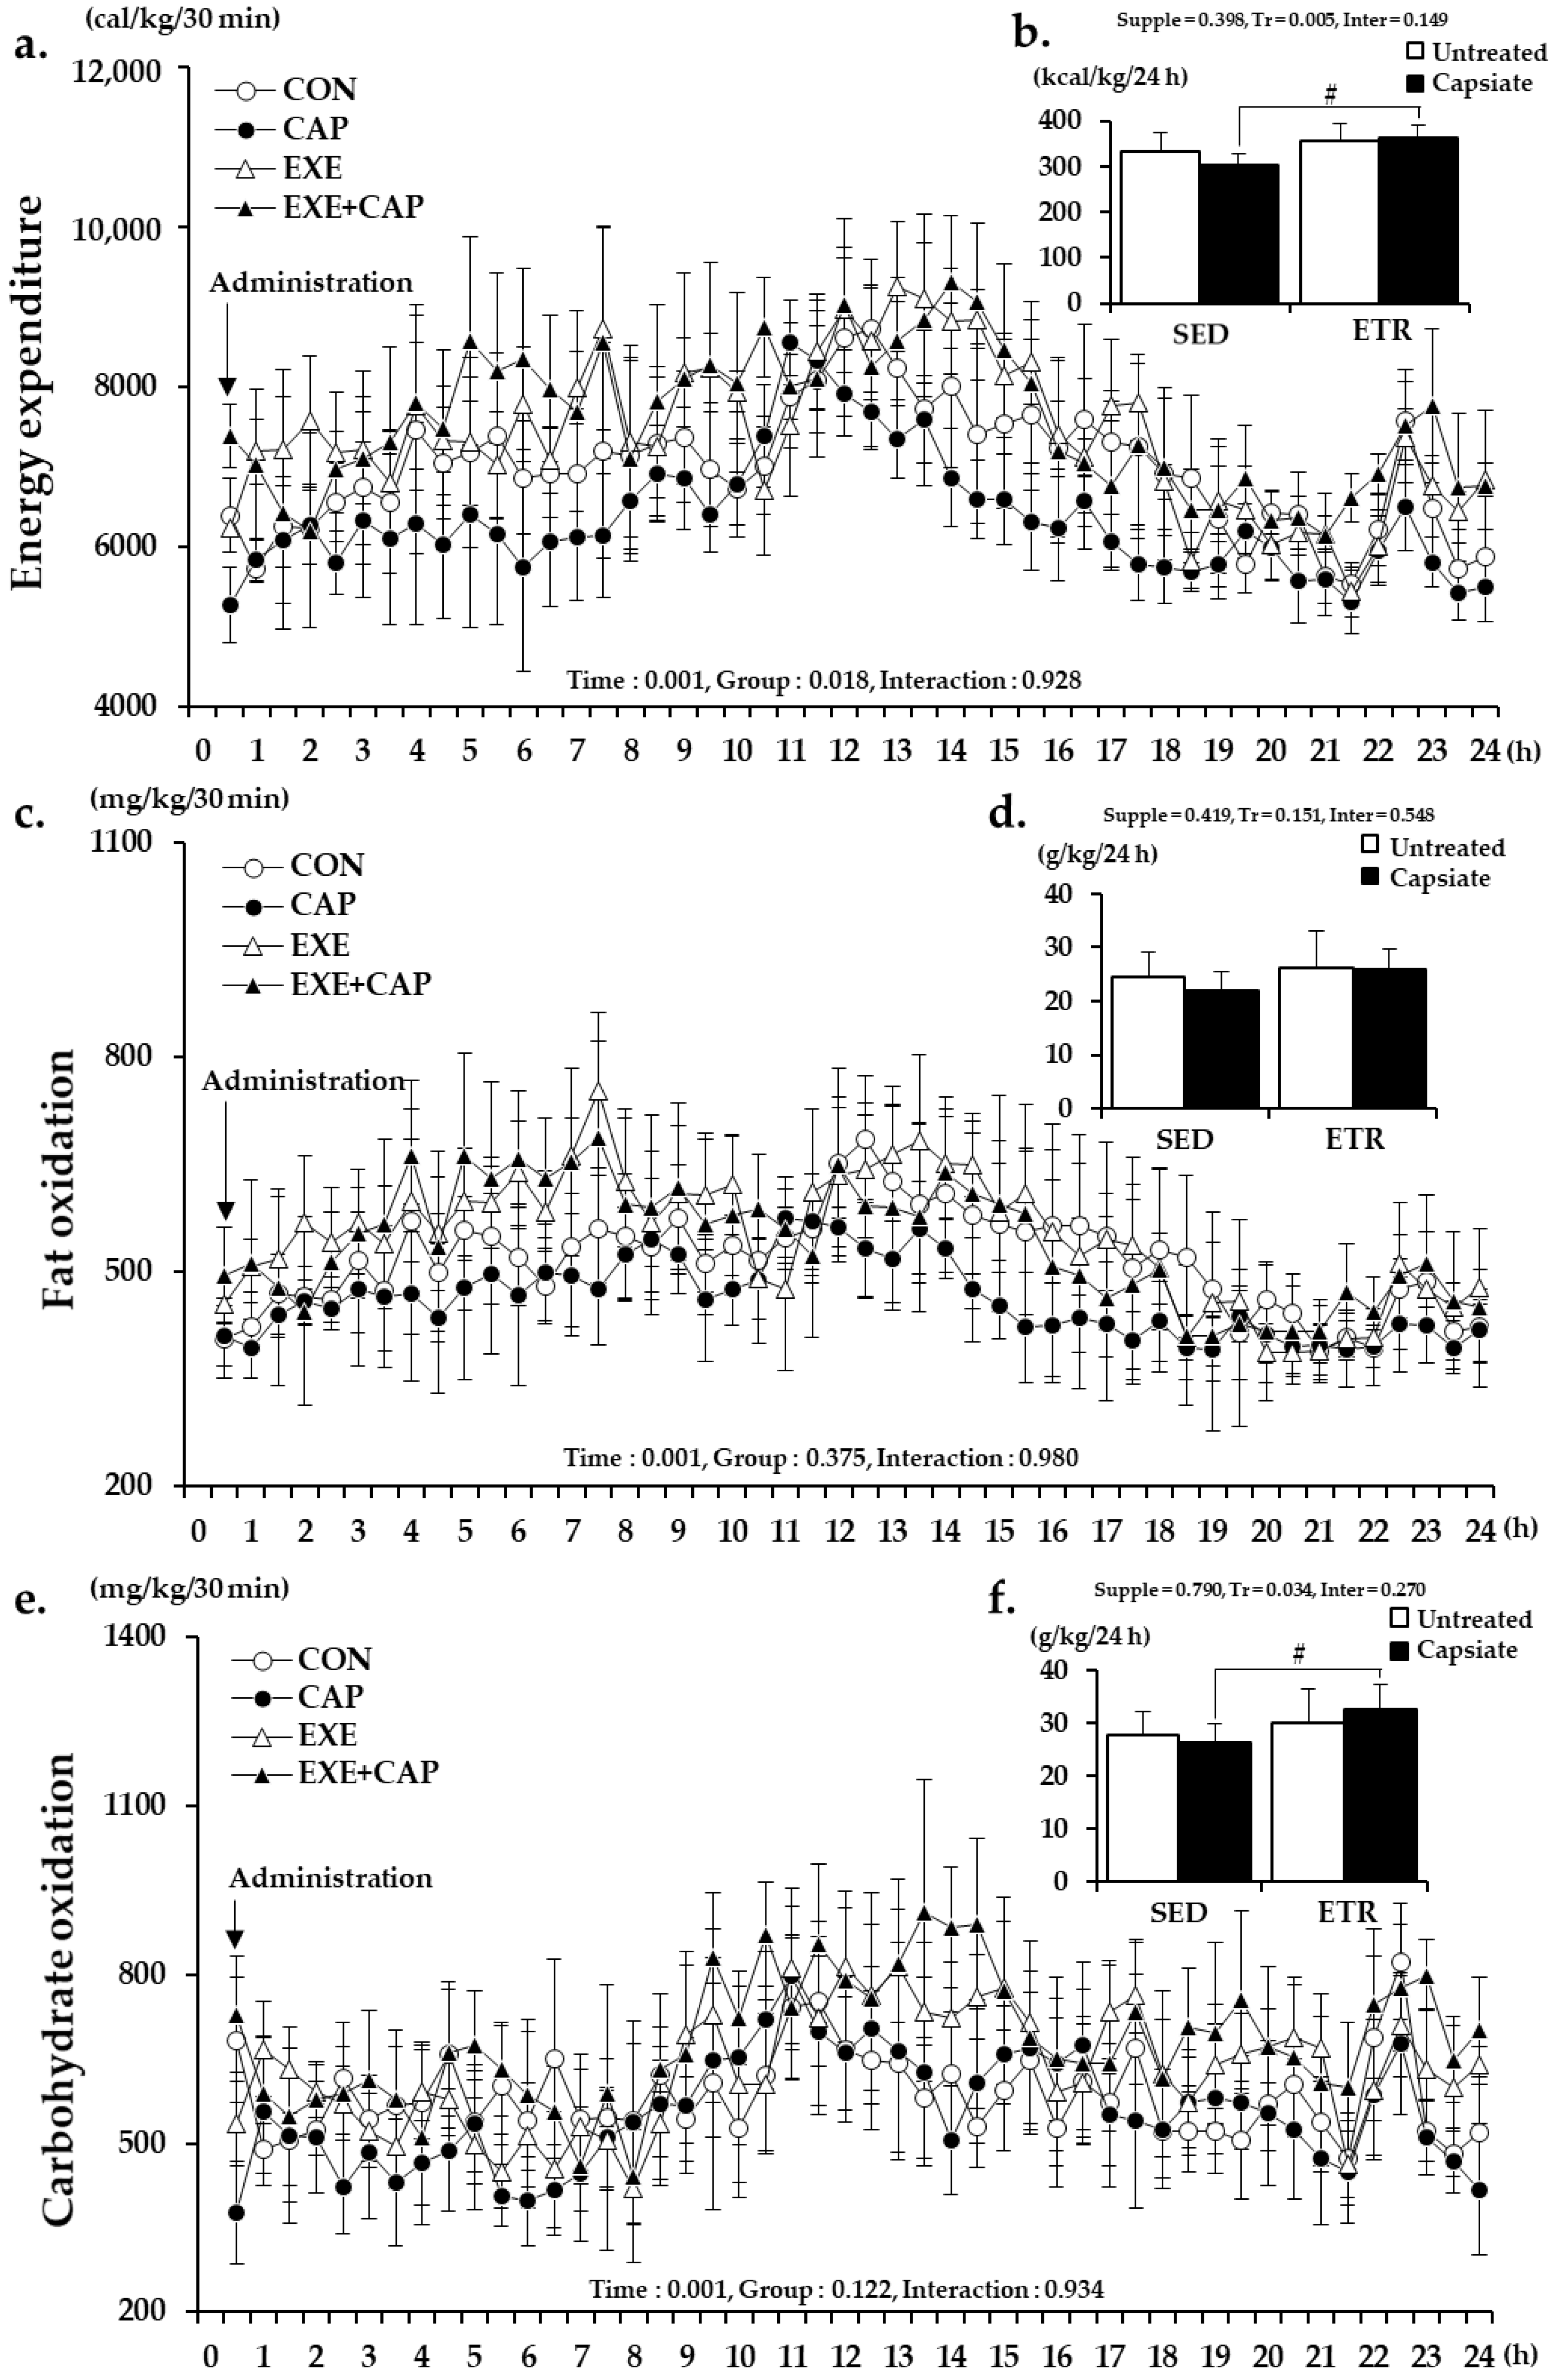
2.4. Resting Metabolic Rate
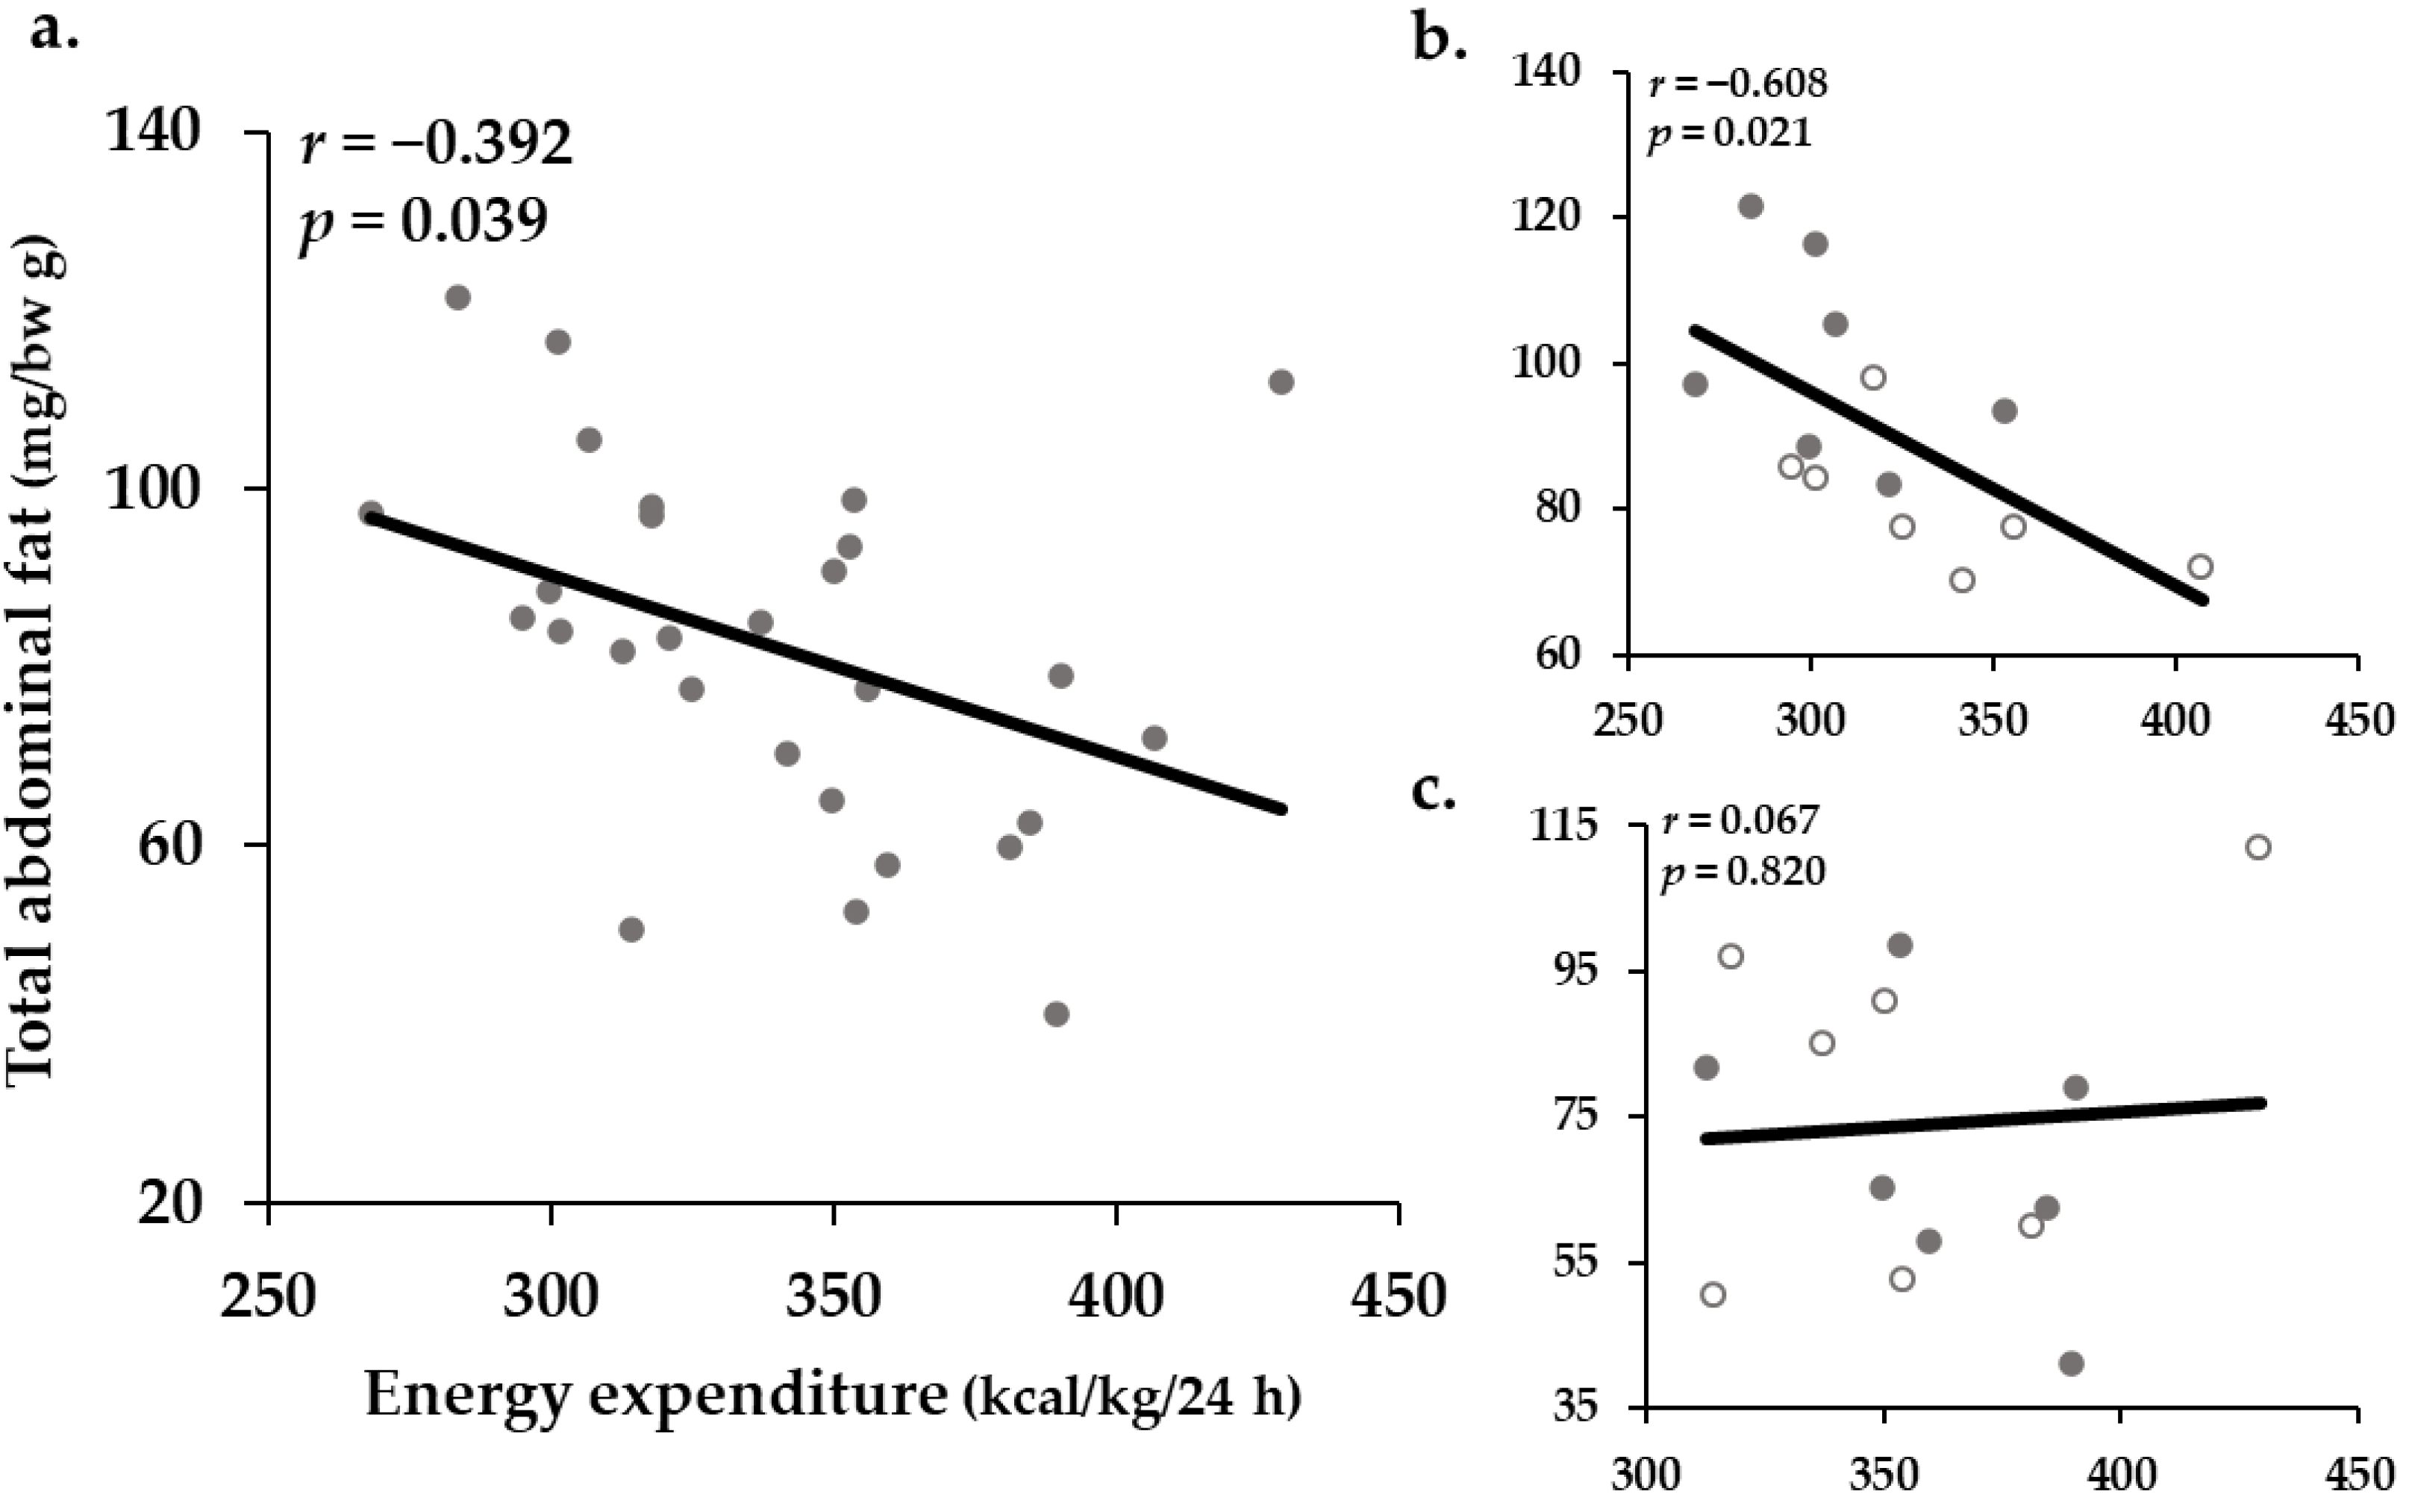
2.5. Correlation between Resting EE and the Proportion of Total Abdominal Fat
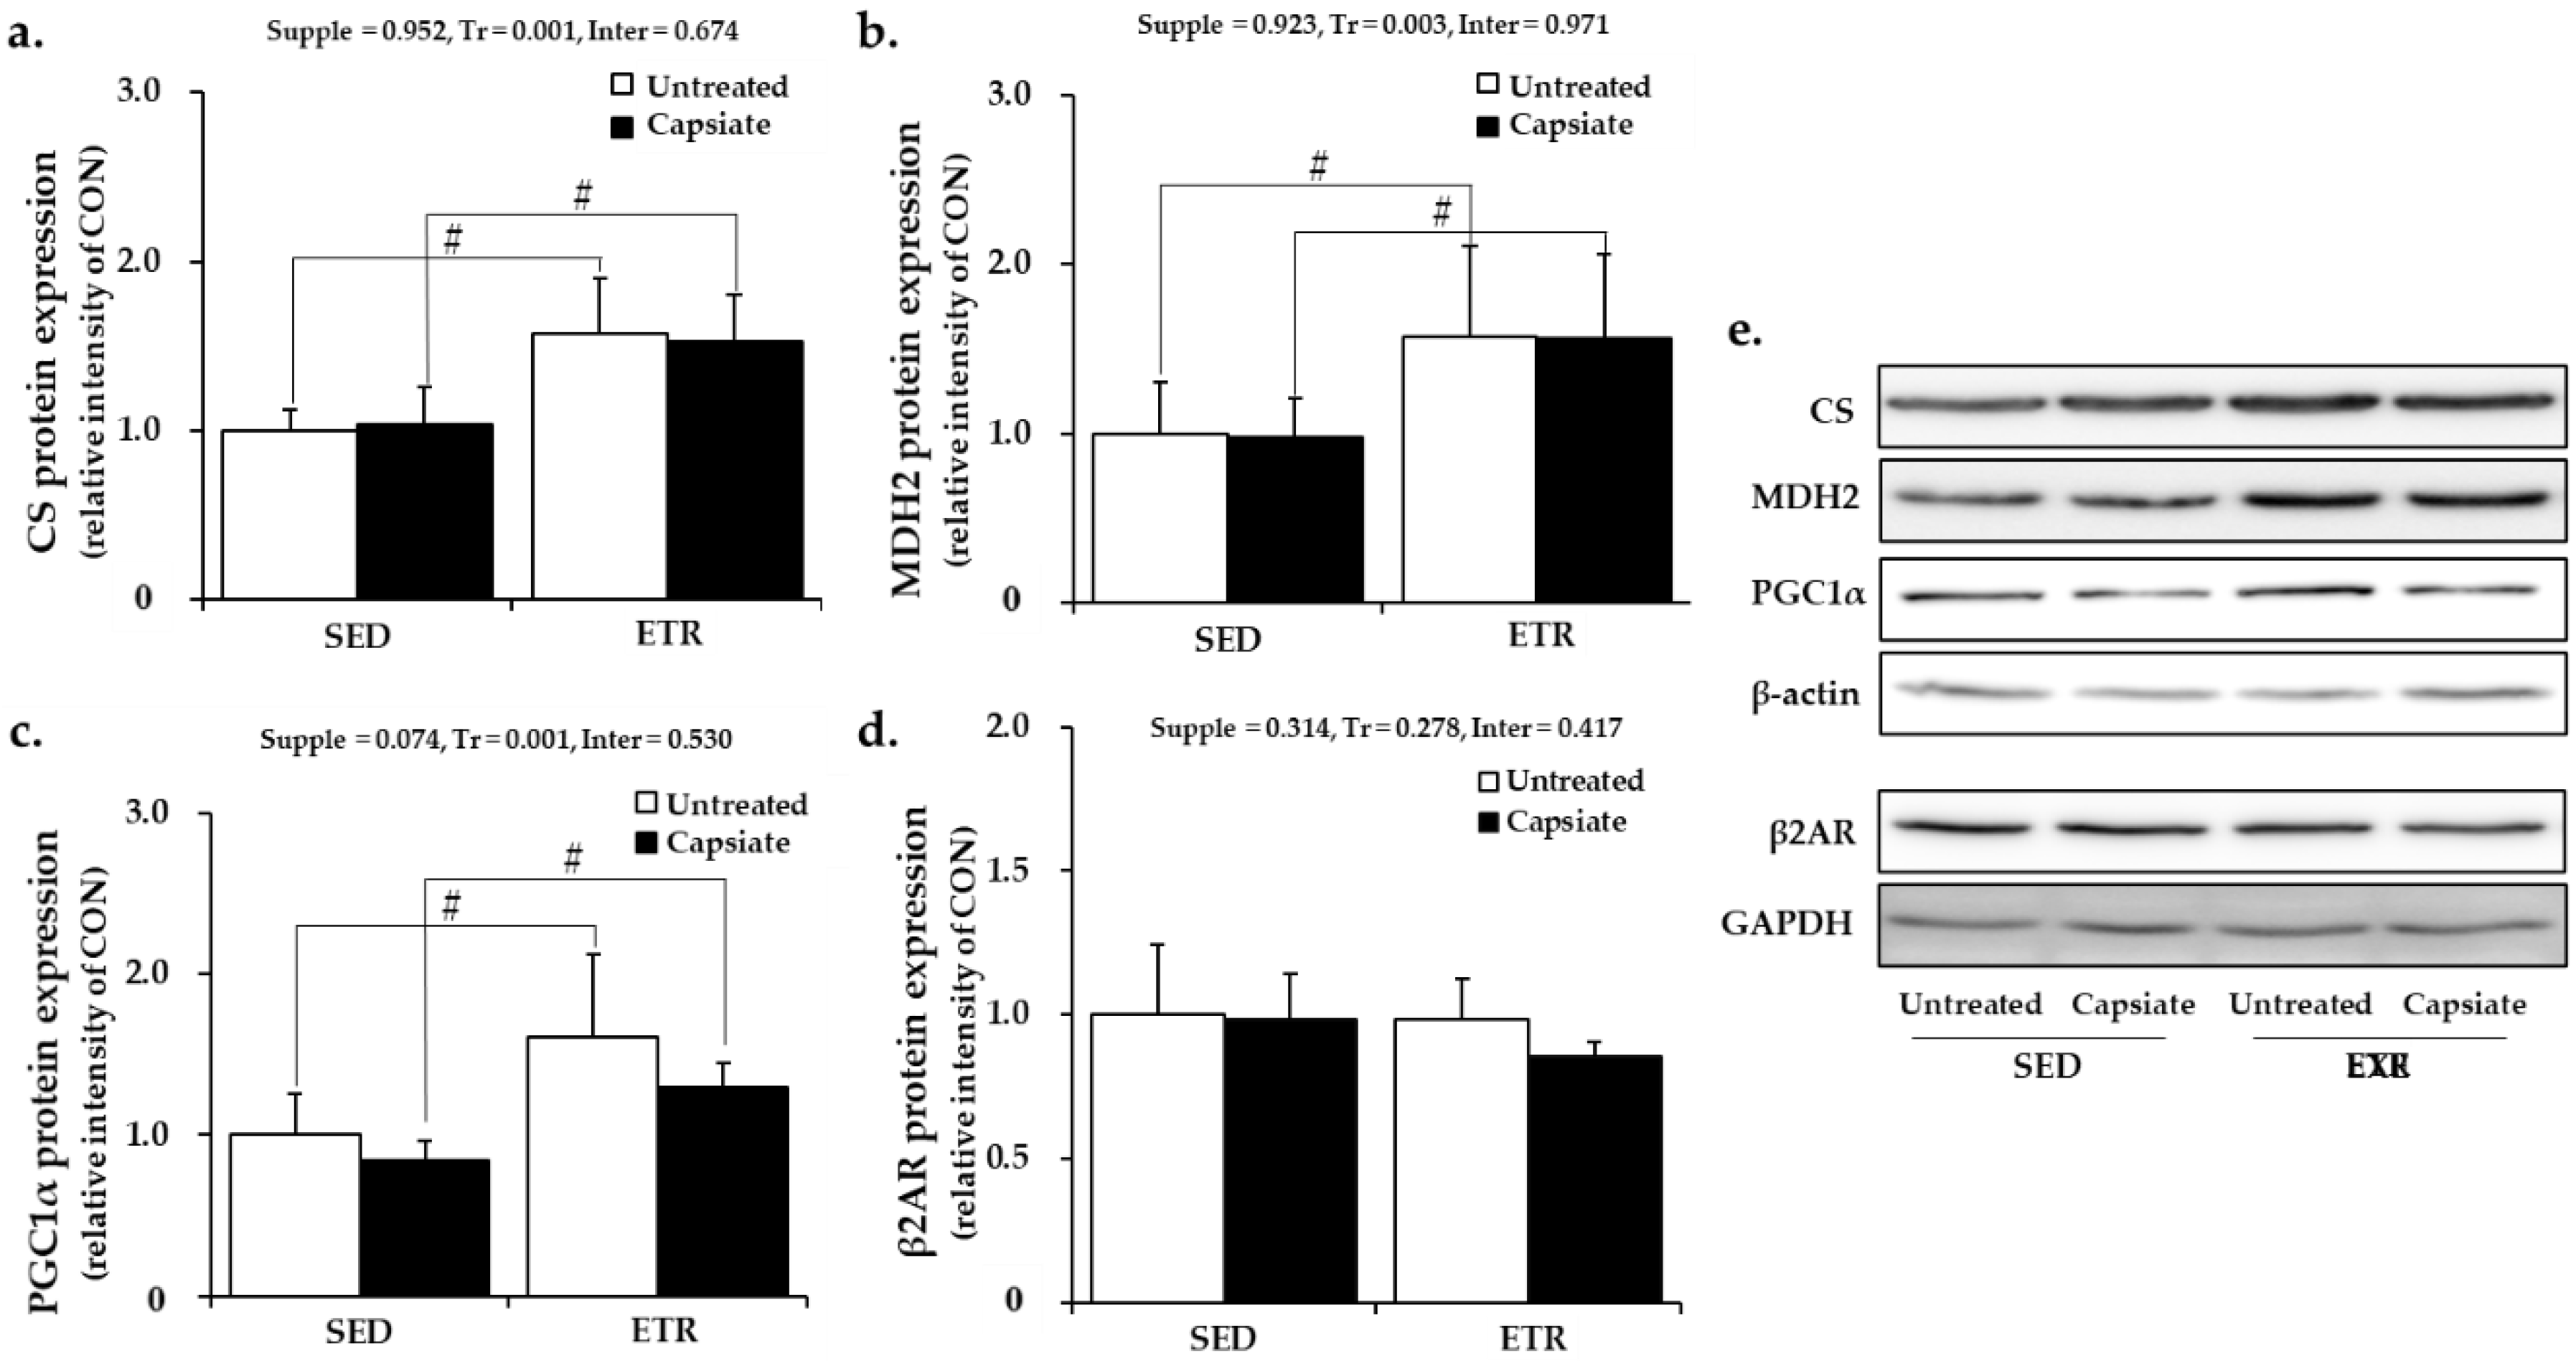
2.6. Metabolism-Associated Protein Expression in Soleus Muscle
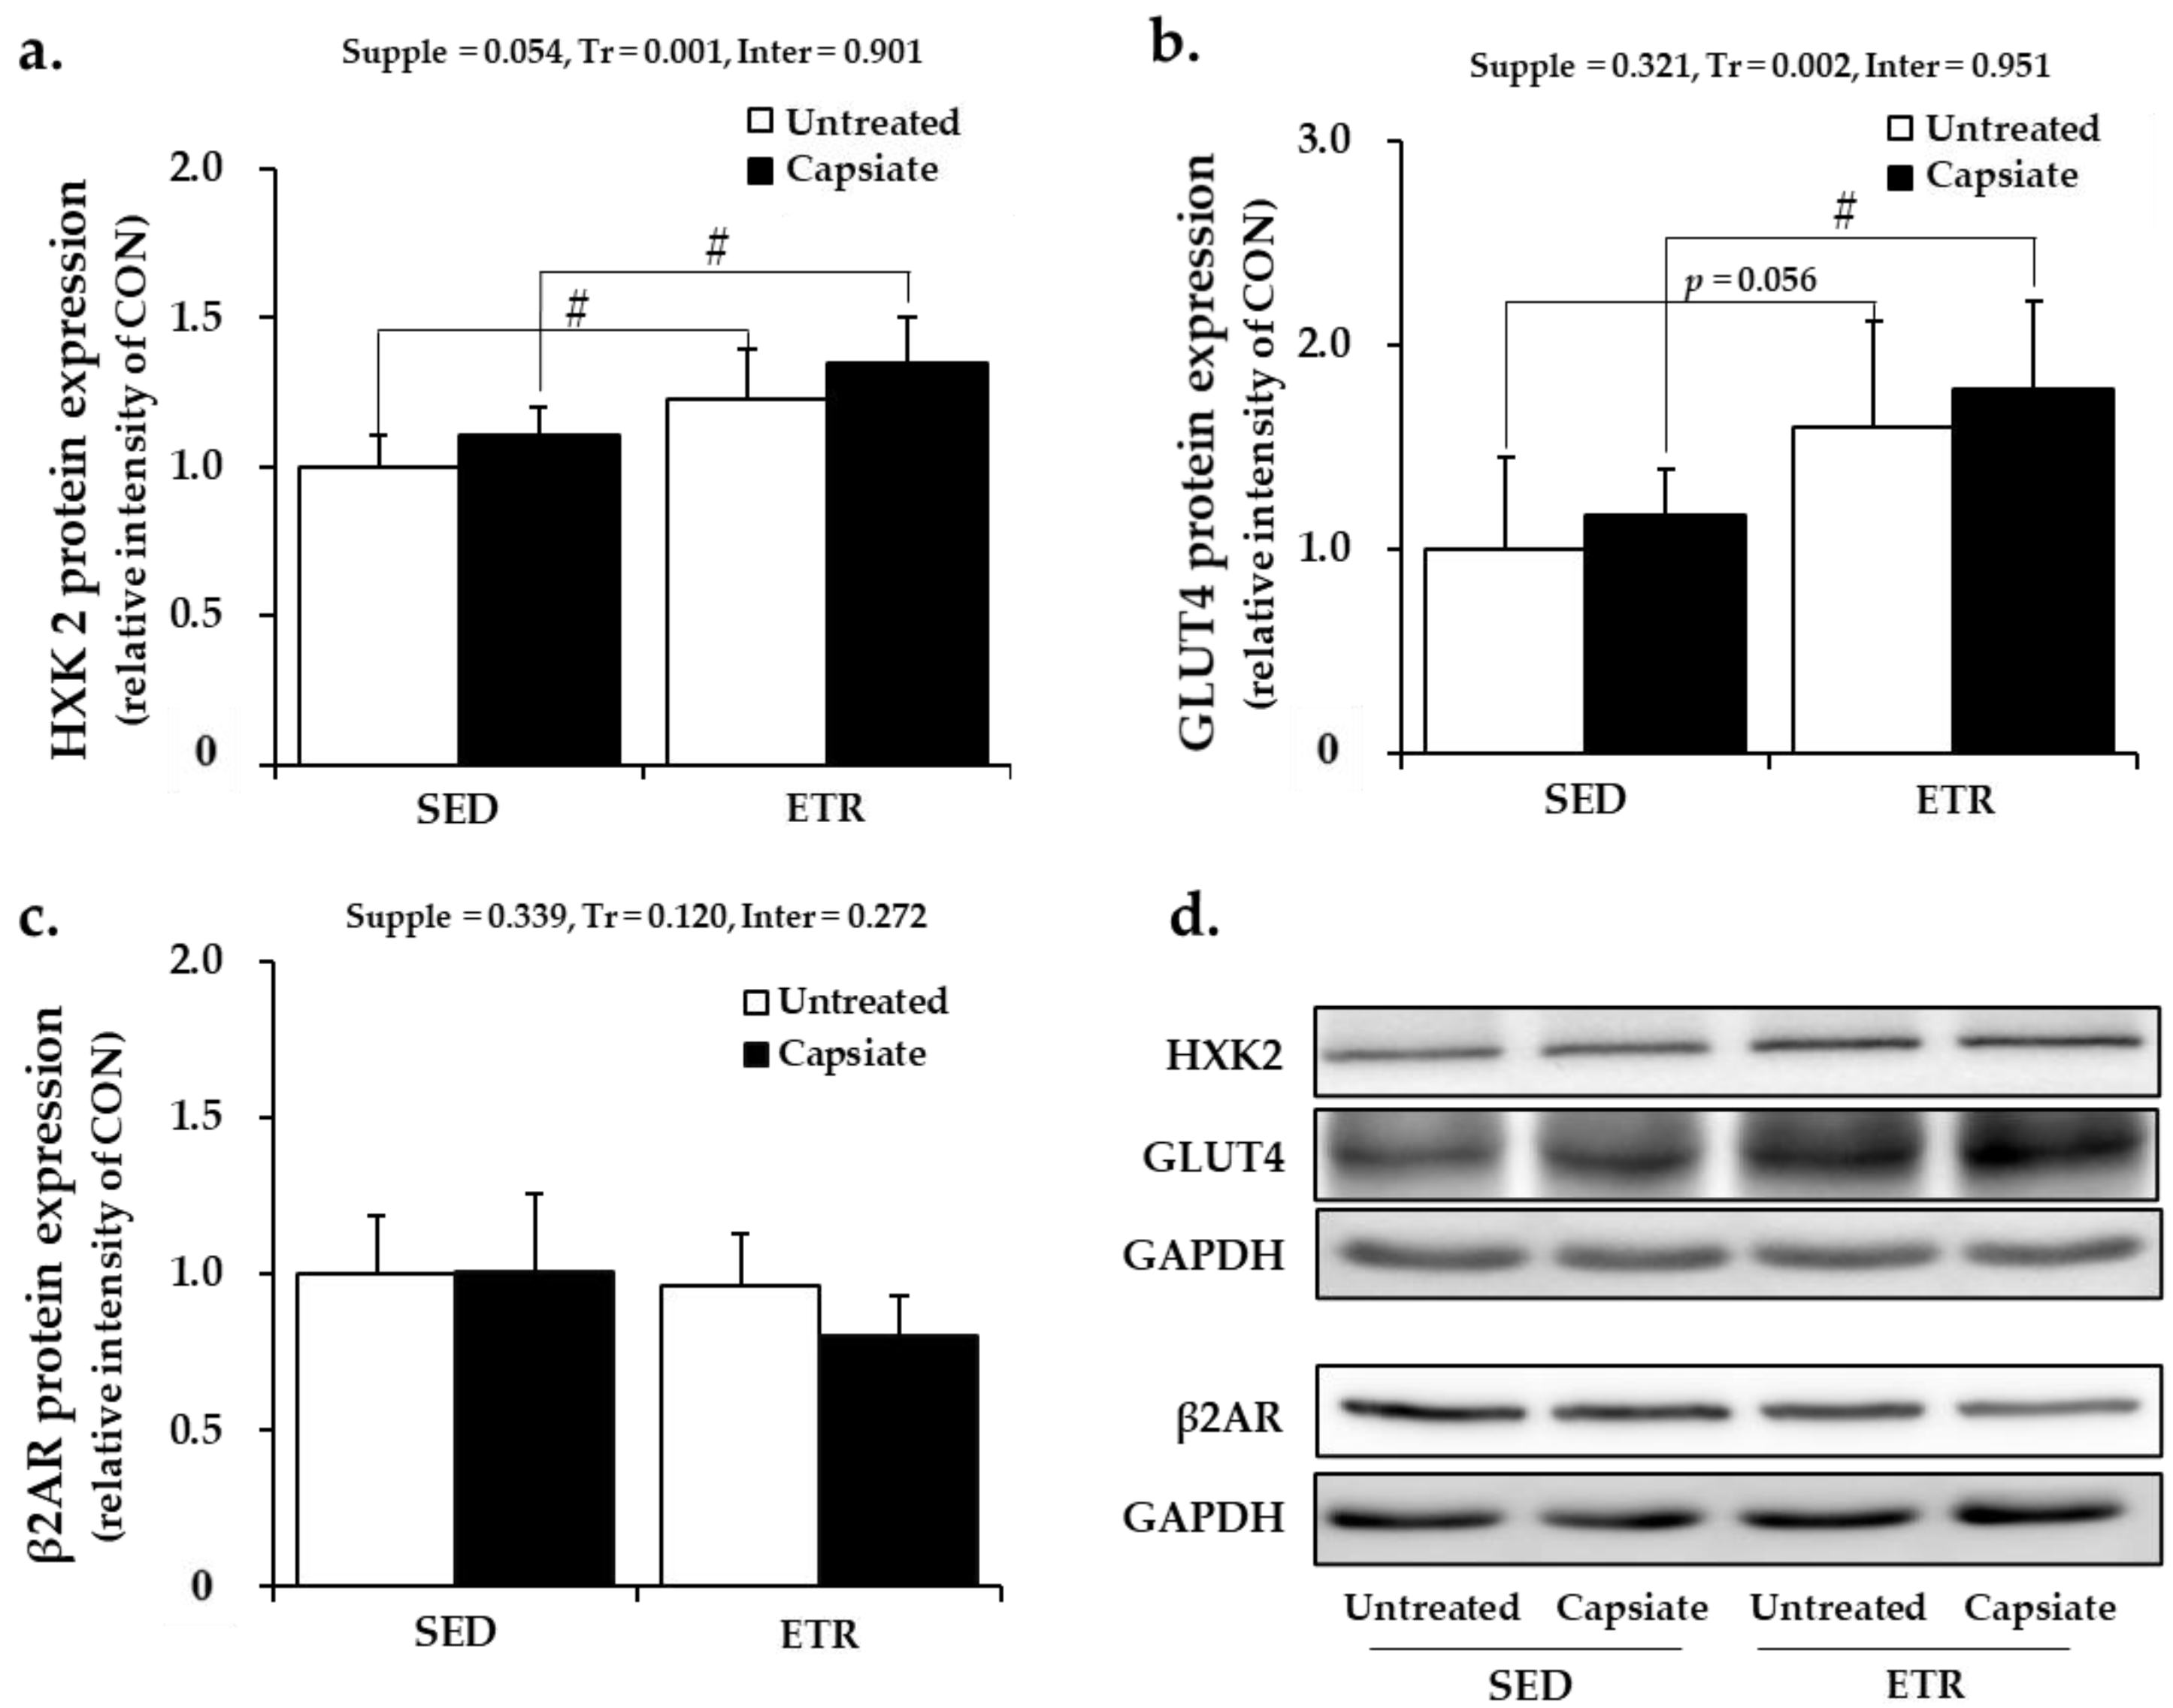
2.7. Metabolism-Associated Protein Expression in Plantaris Muscle
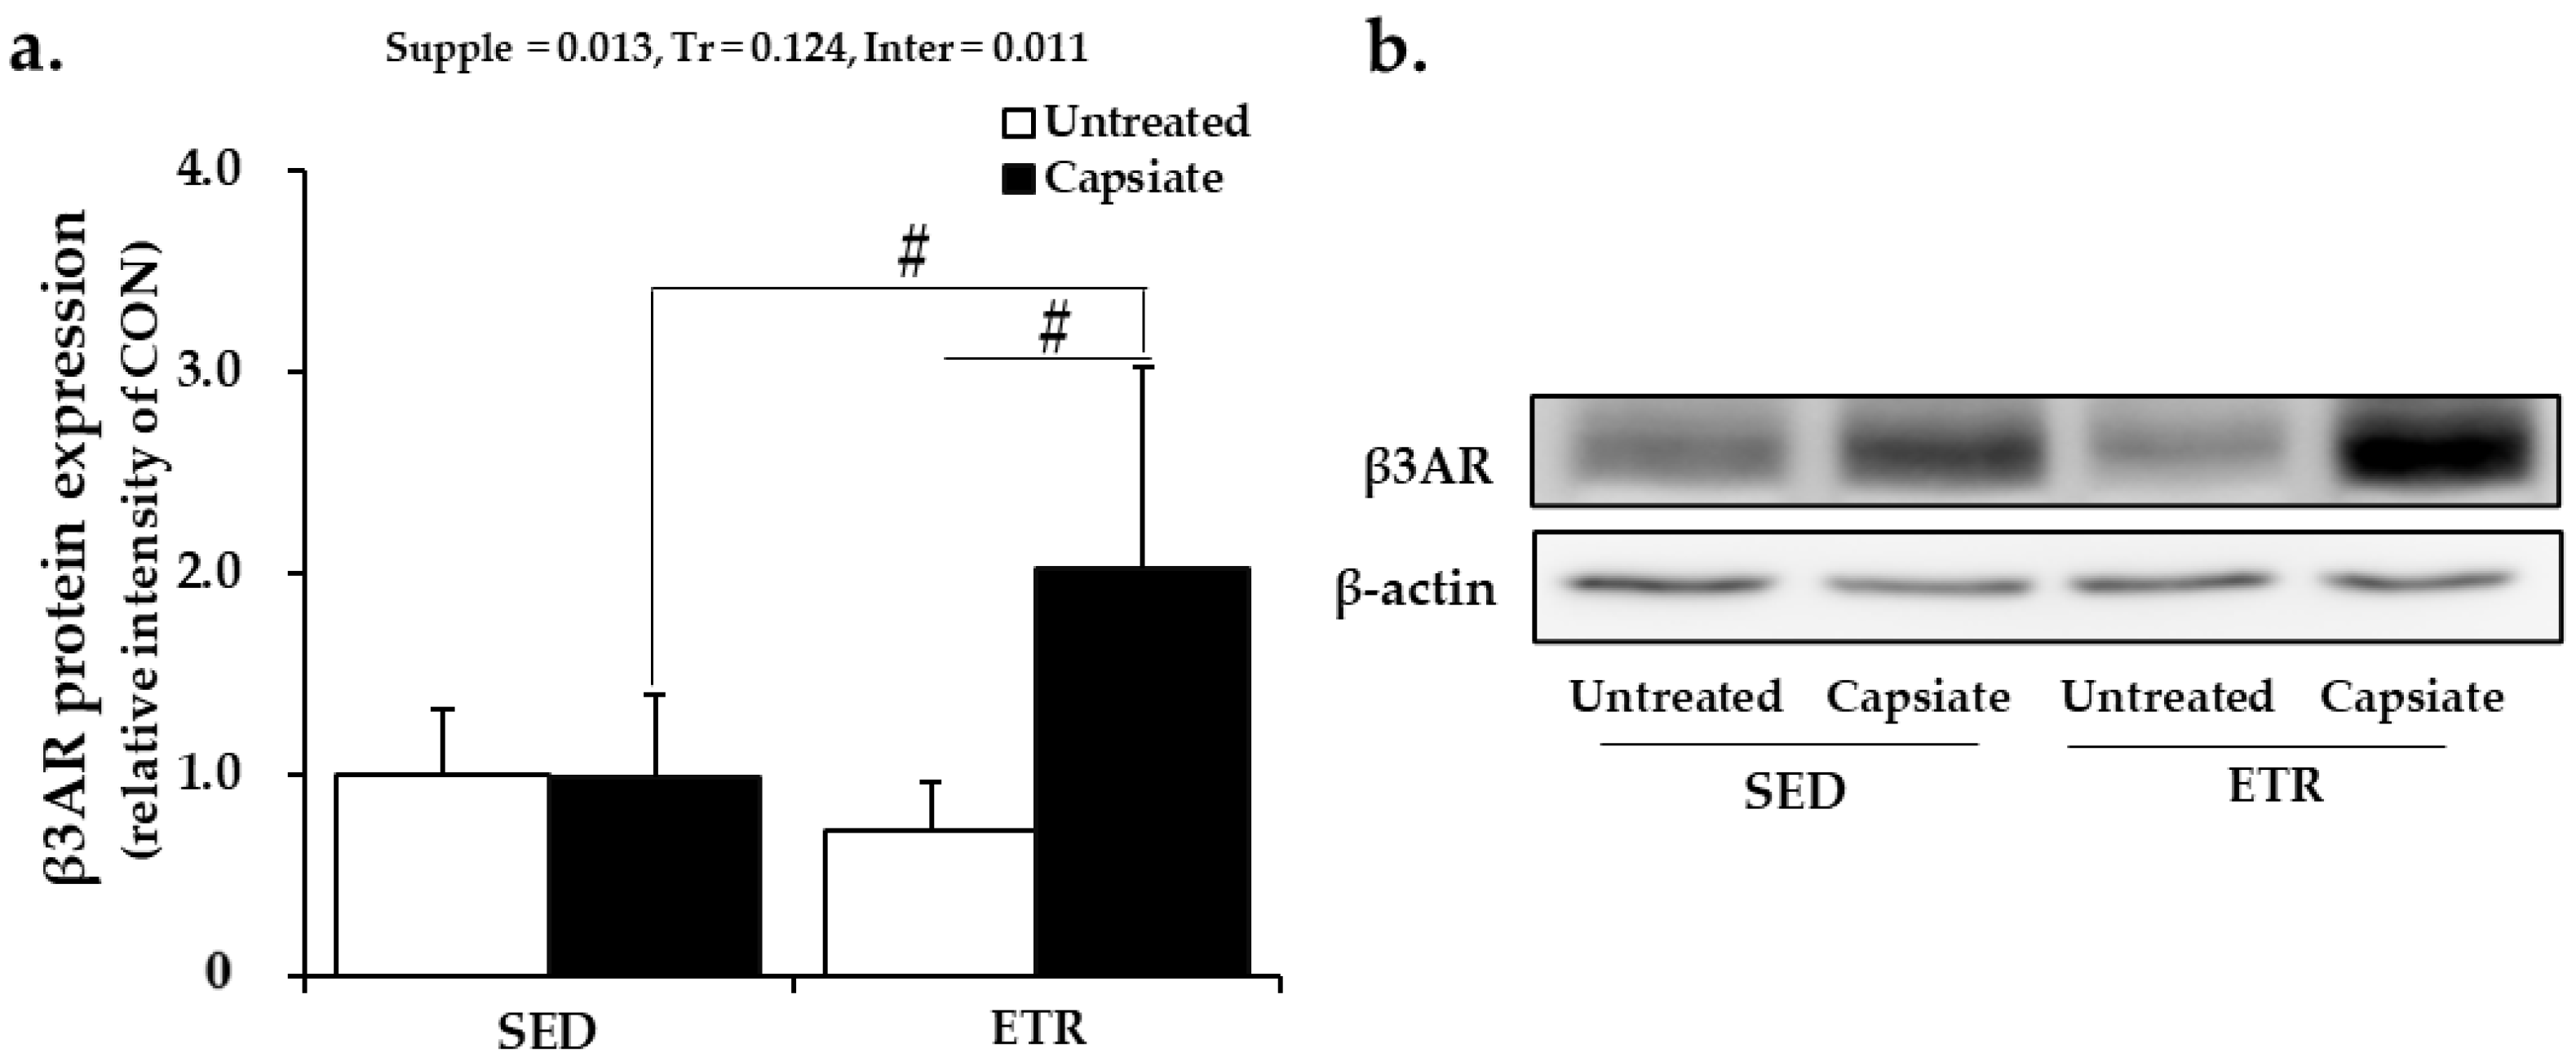
2.8. Protein Expression of Beta-3 Adrenoceptor in Epididymal Adipose Tissue
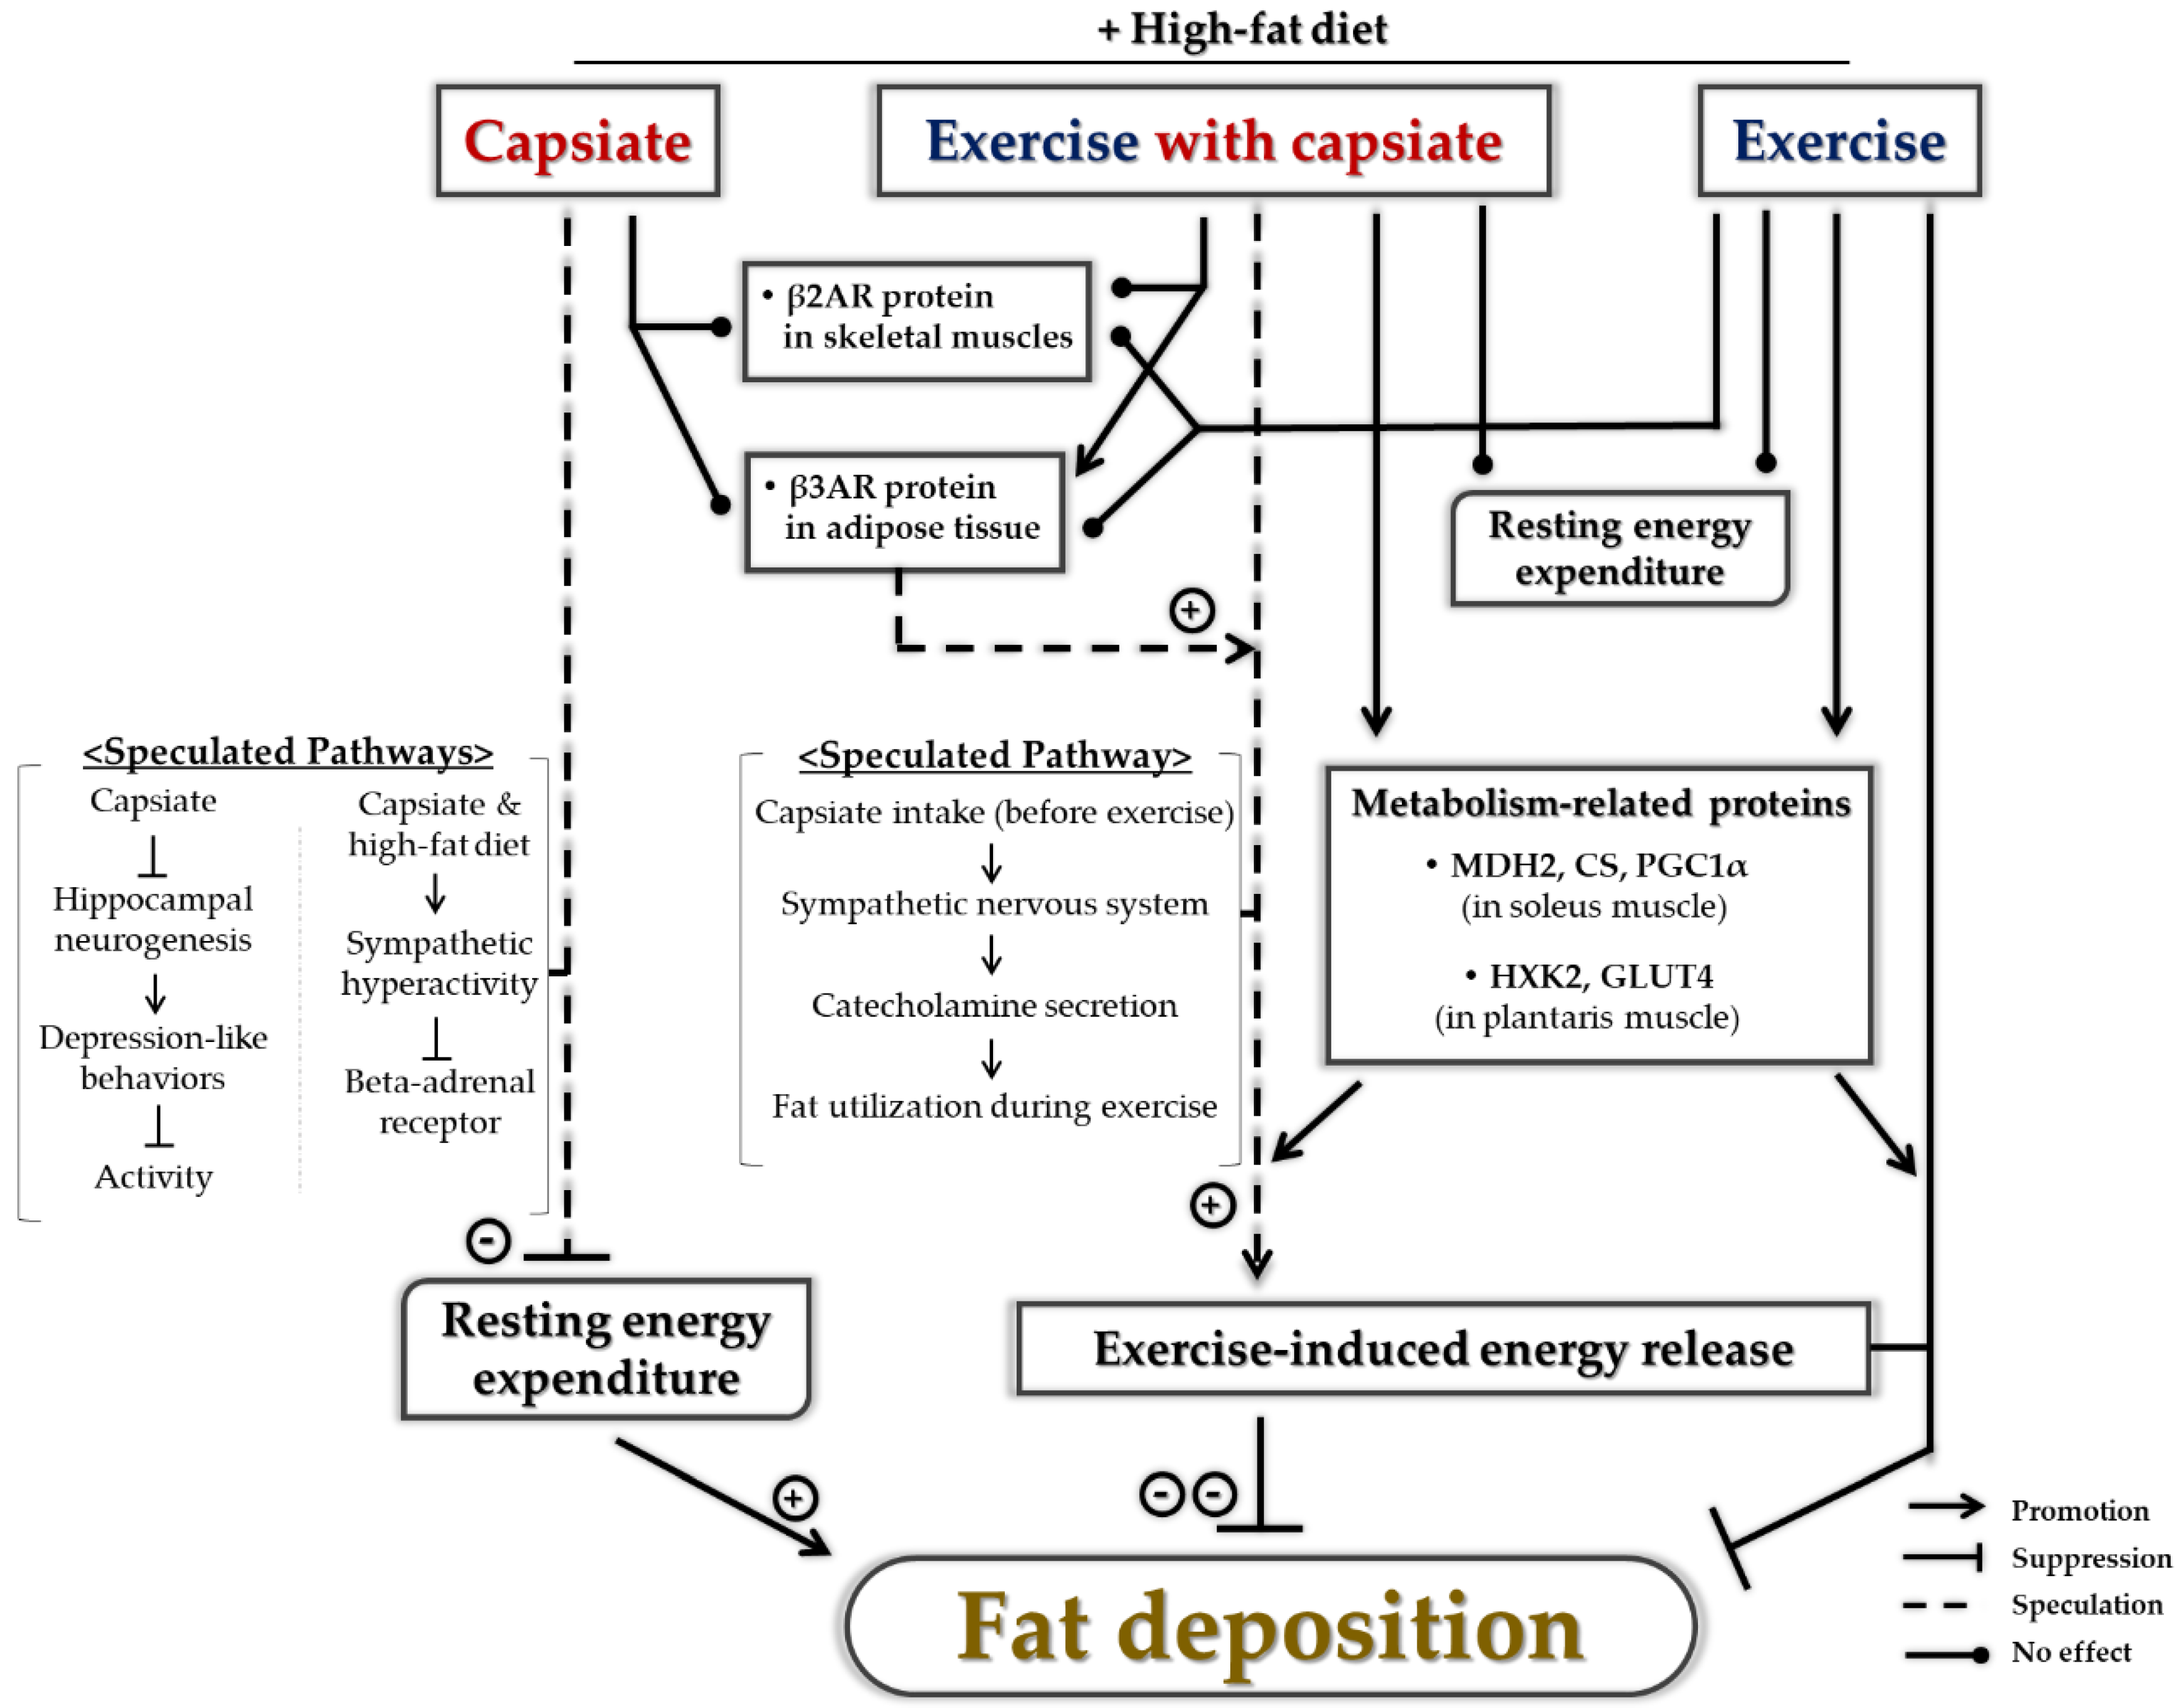
3. Discussion
4. Materials and Methods
4.1. Animal Care
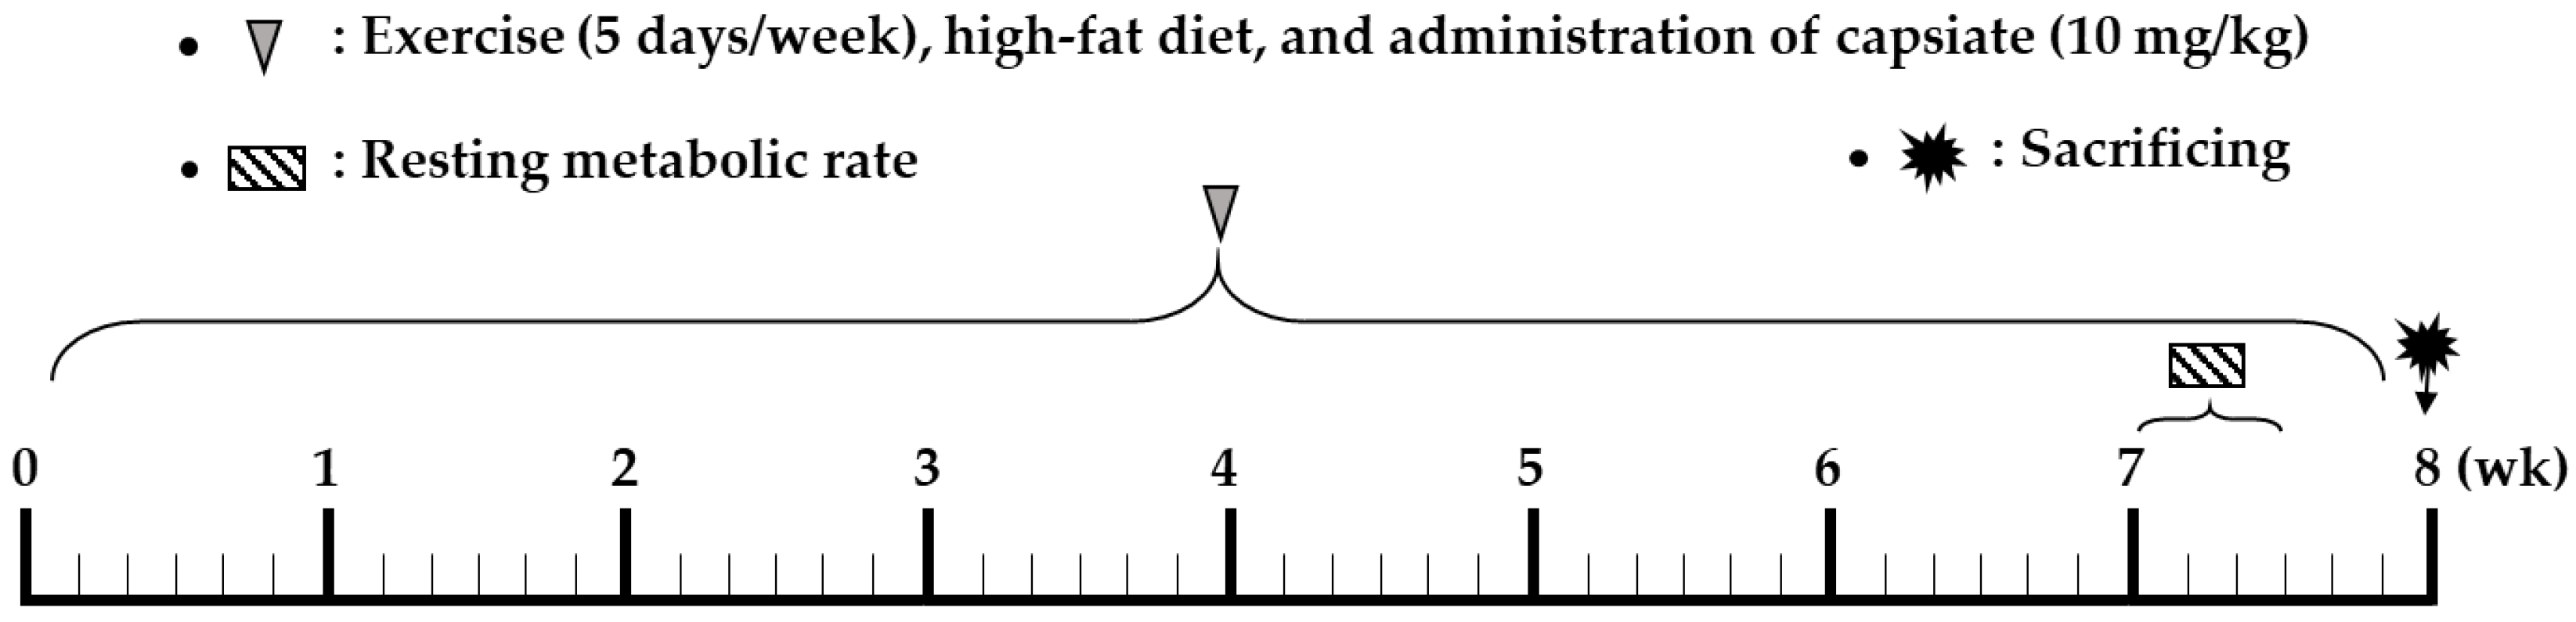
4.2. Study Design
4.3. RMR Analysis
4.4. Tissue Preparation
4.5. Blood Parameters
4.6. Western Blot Analysis
4.7. Statistical Analysis
5. Conclusions
Supplementary Materials
Author Contributions
Funding
Institutional Review Board Statement
Informed Consent Statement
Data Availability Statement
Conflicts of Interest
Abbreviations
| AMPK | AMP-activated protein kinase |
| BAT | brown adipose tissue |
| BW | body weight |
| BWG | body weight gain |
| β2AR | beta-2 adrenoceptor |
| β3AR | beta-3 adrenoceptor |
| CAP | sedentary with capsiate intake group |
| CI | capsiate intake |
| CO | carbohydrate oxidation |
| CON | sedentary control group |
| CS | citrate synthase |
| EE | energy expenditure |
| ET | exercise training |
| ETR | exercise-trained groups |
| EXE | exercise control group |
| EXE+CAP | exercise with capsiate intake group |
| FER | feed efficiency ratio |
| FI | food intake |
| FO | fat oxidation |
| GAPDH | glyceraldehyde 3-phosphate dehydrogenase |
| GLUT4 | glucose transporter 4 |
| HFD | high-fat diet |
| HXK2 | hexokinase 2 |
| MDH2 | malate dehydrogenase 2 |
| PBS | phosphate-buffered saline |
| PBS-T | phosphate-buffered saline with 0.1% Tween 20 |
| PGC1α | peroxisome proliferator-activated gamma coactivator 1-alpha |
| RMR | resting metabolic rate |
| SED | sedentary groups |
| SNS | sympathetic nervous system |
| TRPV1 | transient receptor potential cation channel subfamily V member 1 |
| TST | tail suspension test |
| UCP1 | uncoupling protein 1 |
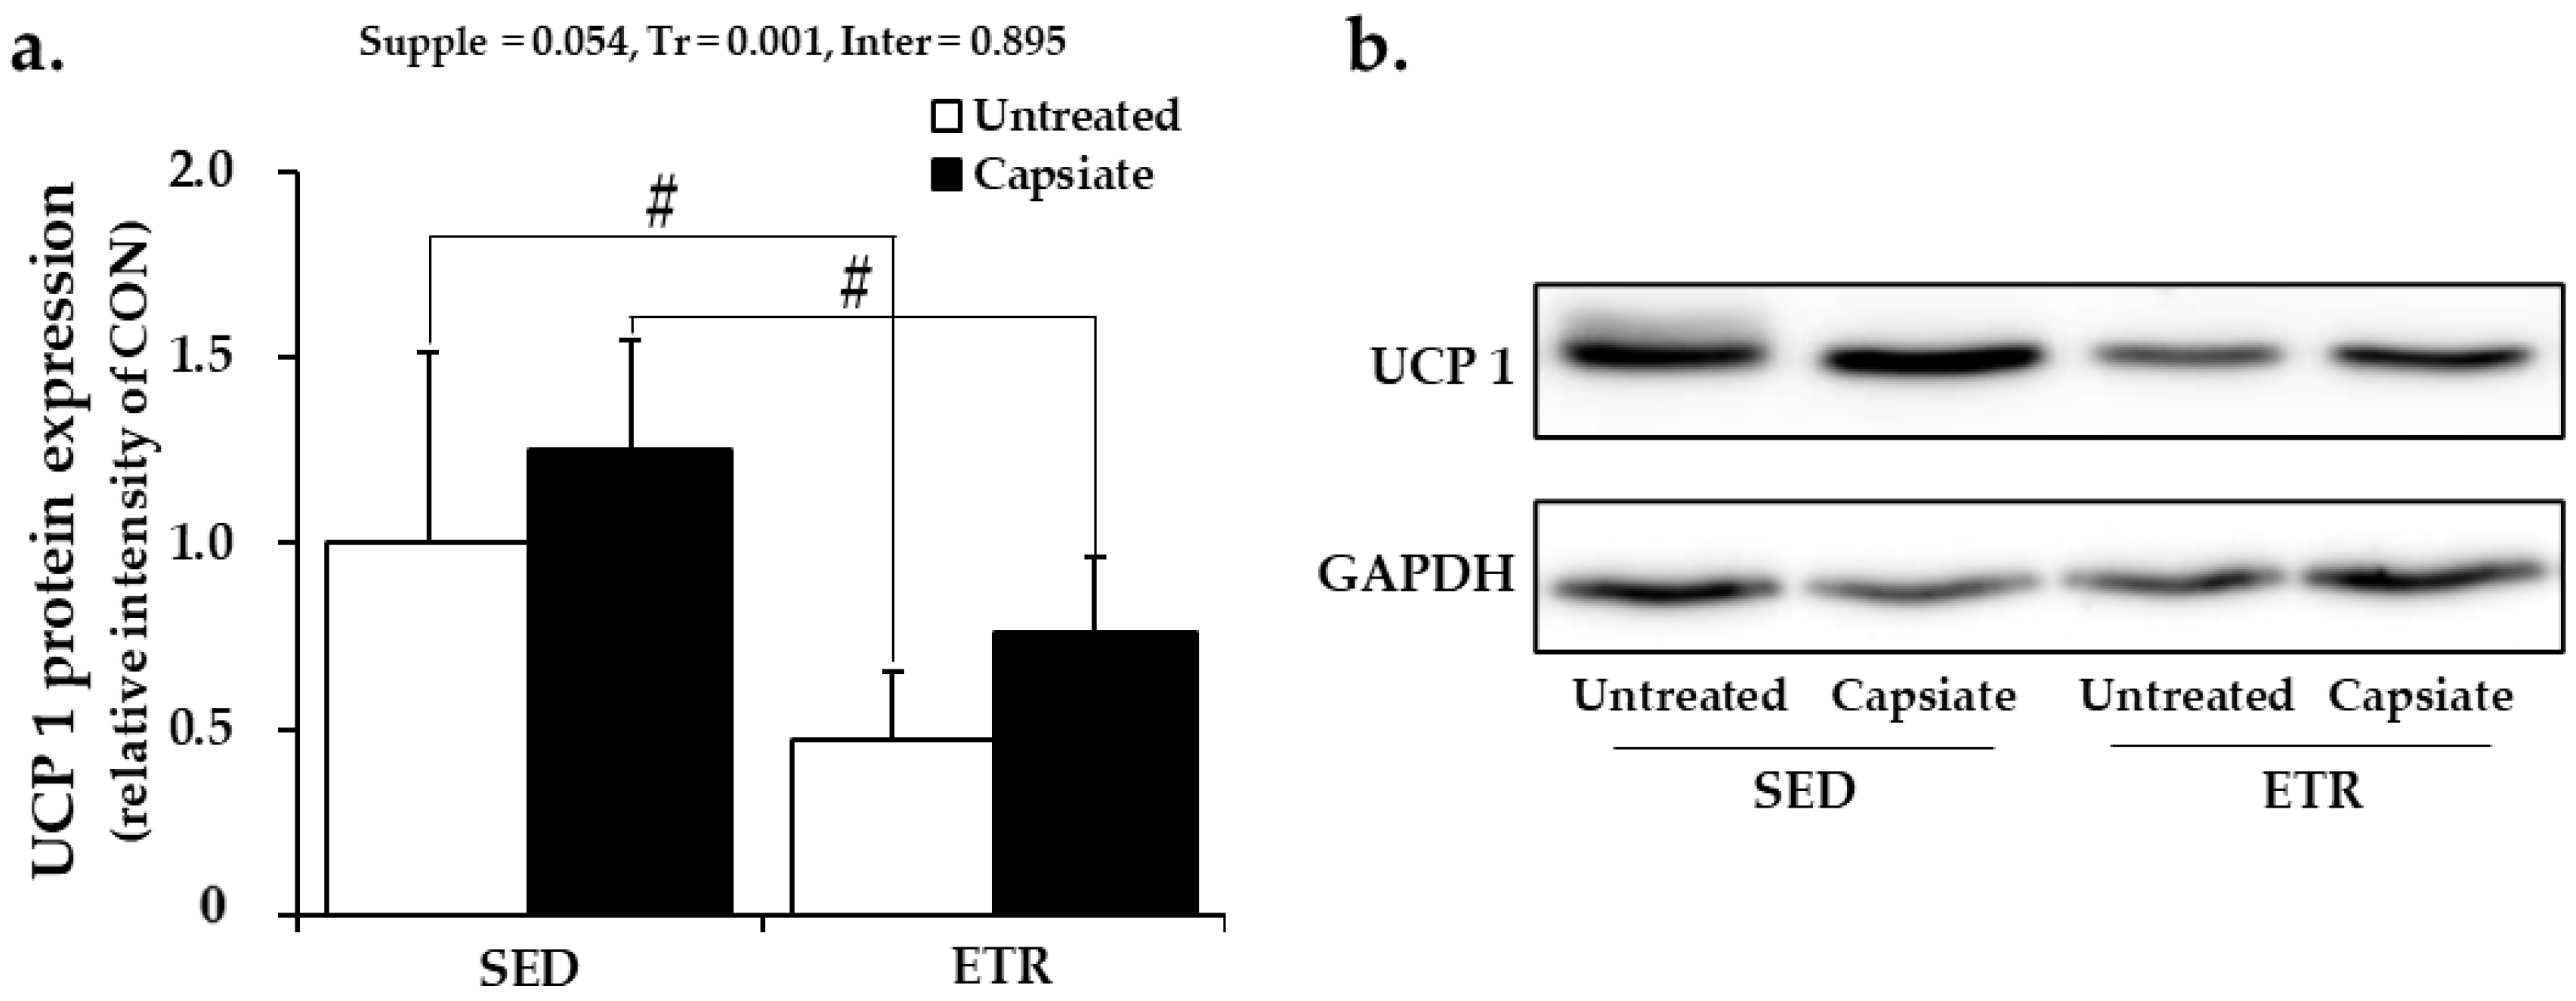
Appendix A. UCP1 Protein Expression in BAT

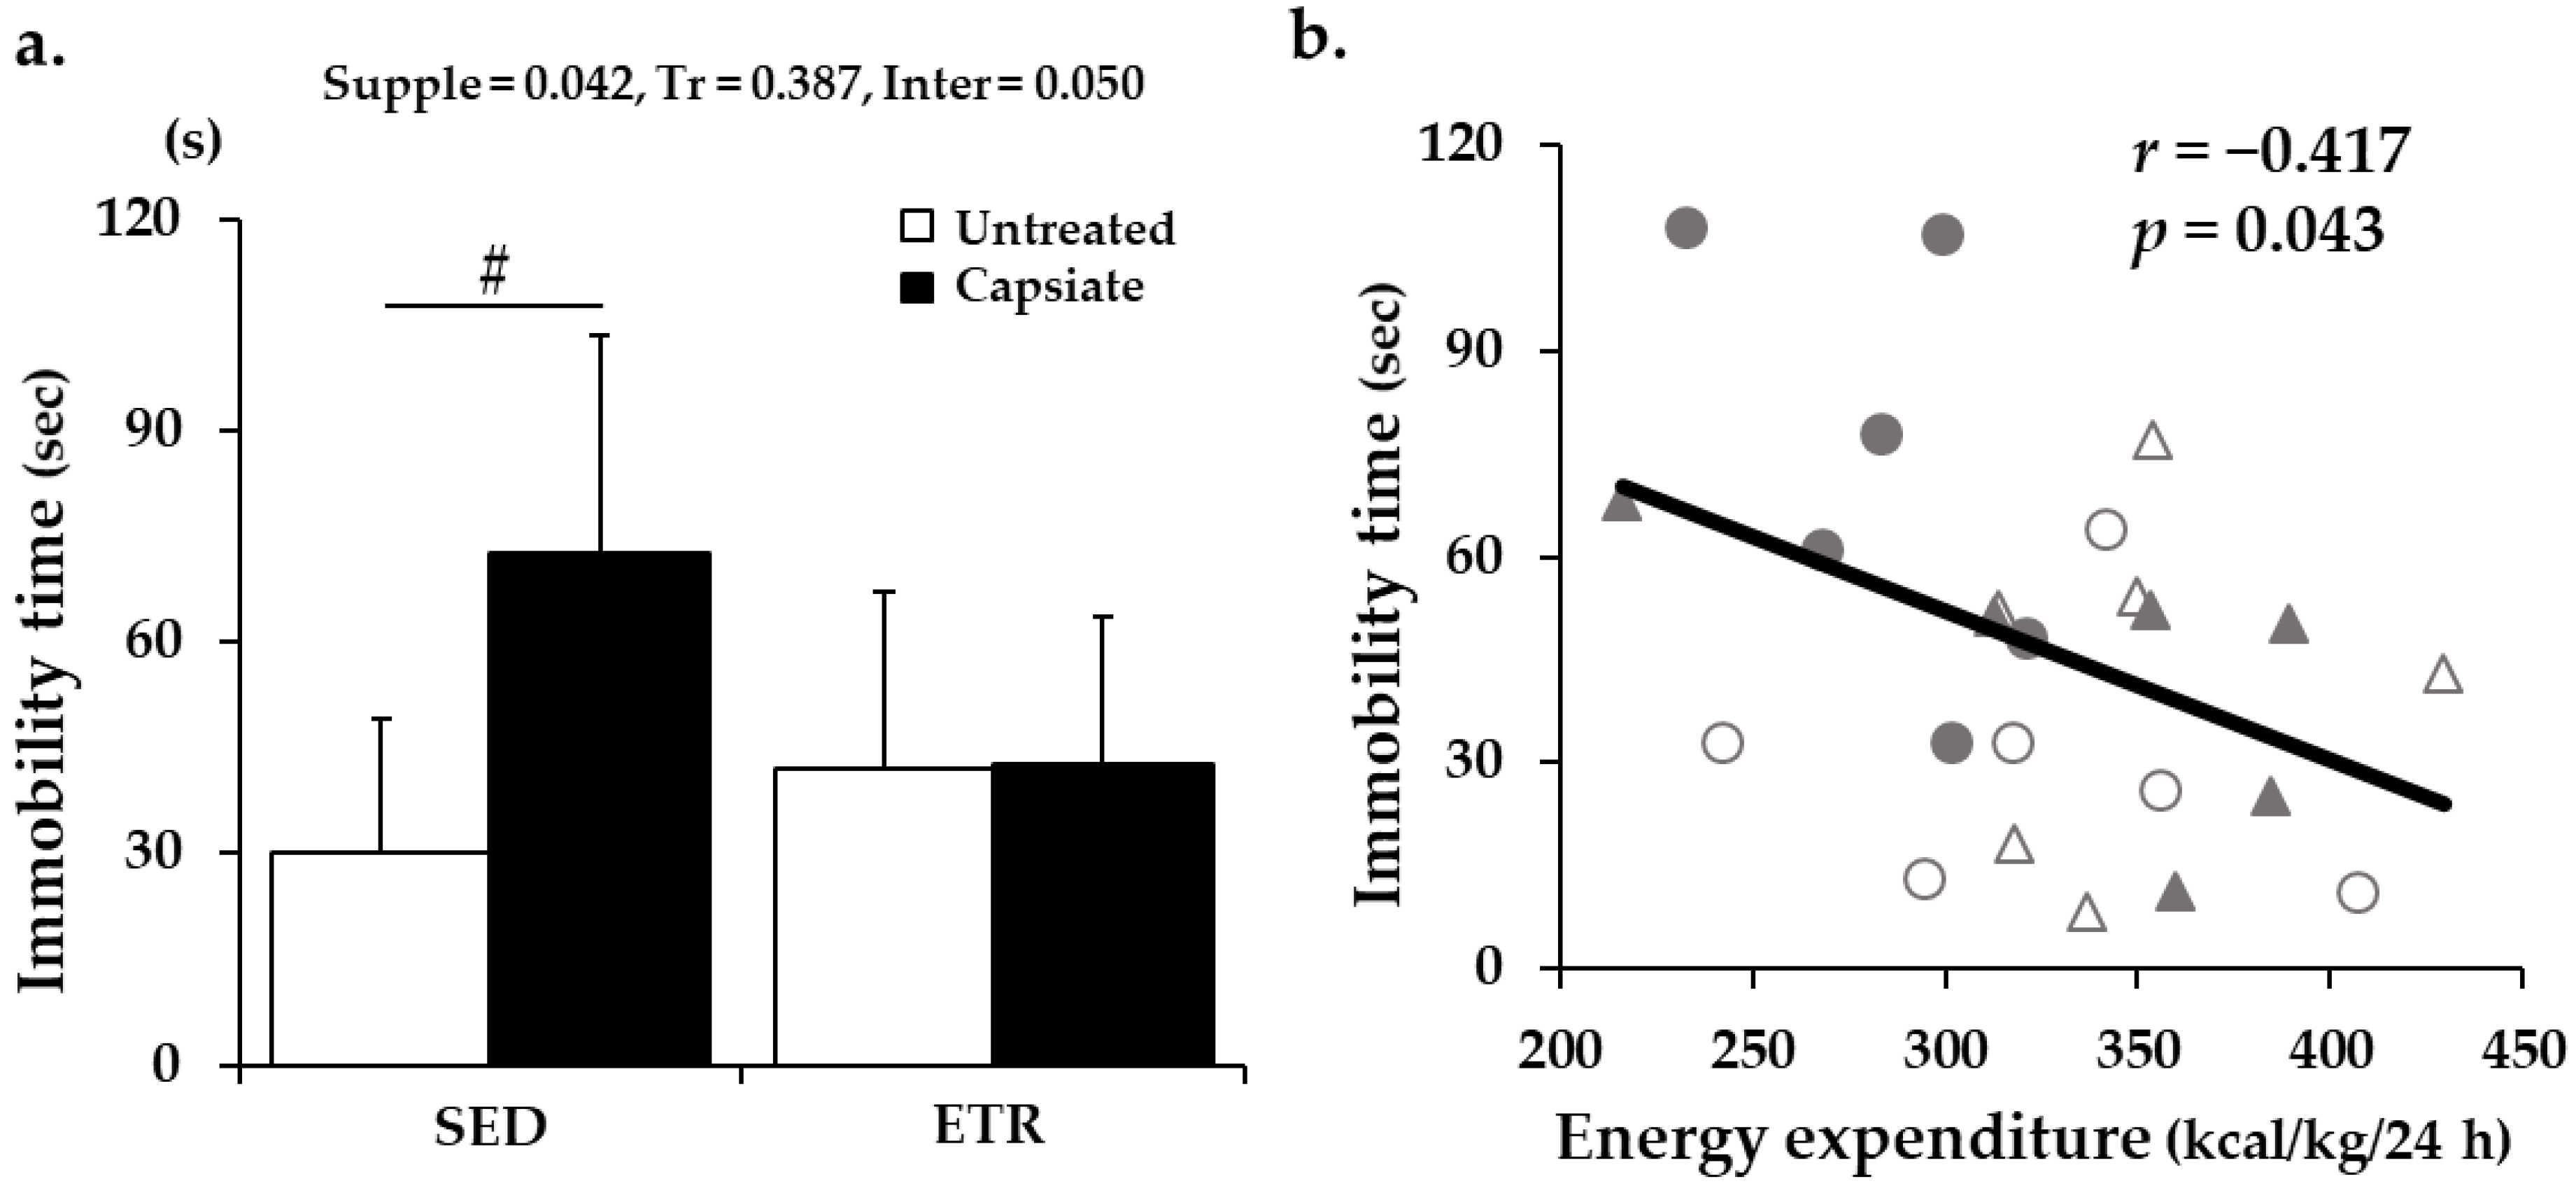
Appendix B. Immobility Time and Its Correlation with Resting EE

References
- Scherer, P.E.; Hill, J.A. Obesity, Diabetes, and Cardiovascular Diseases. Circ. Res. 2016, 118, 1703–1705. [Google Scholar] [CrossRef] [PubMed] [Green Version]
- Van Gaal, L.F.; Mertens, I.L.; DeBlock, C. Mechanisms Linking Obesity with Cardiovascular Diease. Nature 2006, 444, 875–880. [Google Scholar] [CrossRef] [PubMed]
- Xu, H.; Cupples, L.A.; Stokes, A.; Liu, C.T. Association of Obesity with Mortality Over 24 Years of Weight History: Findings From the Framingham Heart Study. JAMA Netw. Open 2018, 1, e184587. [Google Scholar] [CrossRef] [PubMed]
- Bagley, L.; Slevin, M.; Bradburn, S.; Liu, D.; Murgatroyd, C.; Morrissey, G.; Carroll, M.; Piasecki, M.; Gilmore, W.S.; McPhee, J.S. Sex Differences in the Effects of 12 Weeks Sprint Interval Training on Body Fat Mass and the Rates of Fatty Acid Oxidation and VO 2 Max during Exercise. BMJ Open Sport Exerc. Med. 2016, 2, e000056. [Google Scholar] [CrossRef] [Green Version]
- Solberg, P.A.; Kvamme, N.H.; Raastad, T.; Ommundsen, Y.; Tomten, S.E.; Halvari, H.; Loland, N.W.; Hallén, J. Effects of Different Types of Exercise on Muscle Mass, Strength, Function and Well-Being in Elderly. Eur. J. Sport Sci. 2013, 13, 112–125. [Google Scholar] [CrossRef]
- Henderson, G.C.; Fattor, J.A.; Horning, M.A.; Faghihnia, N.; Johnson, M.L.; Mau, T.L.; Luke-Zeitoun, M.; Brooks, G.A. Lipolysis and Fatty Acid Metabolism in Men and Women during the Postexercise Recovery Period. J. Physiol. 2007, 584, 963–981. [Google Scholar] [CrossRef]
- Thomas, D.M.; Bouchard, C.; Church, T.; Slentz, C.; Kraus, W.E.; Redman, L.M.; Martin, C.K.; Silva, A.M.; Vossen, M.; Westerterp, K.; et al. Why Do Individuals Not Lose More Weight from an Exercise Intervention at a Defined Dose? An Energy Balance Analysis. Obes. Rev. 2012, 13, 835–847. [Google Scholar] [CrossRef] [Green Version]
- Westerterp, K.R. Exercise, Energy Balance and Body Composition. Eur. J. Clin. Nutr. 2018, 72, 1246–1250. [Google Scholar] [CrossRef]
- Martin, C.K.; Johnson, W.D.; Myers, C.A.; Apolzan, J.W.; Earnest, C.P.; Thomas, D.M.; Rood, J.C.; Johannsen, N.M.; Tudor-Locke, C.; Harris, M.; et al. Effect of Different Doses of Supervised Exercise on Food Intake, Metabolism, and Non-Exercise Physical Activity: The E-MECHANIC Randomized Controlled Trial. Am. J. Clin. Nutr. 2019, 110, 583–592. [Google Scholar] [CrossRef]
- Kim, J.; Park, J.; Kim, N.; Park, H.-Y.; Lim, K. Inhibition of Androgen Receptor Can Decrease Fat Metabolism by Decreasing Carnitine Palmitoyltransferase I Levels in Skeletal Muscles of Trained Mice. Nutr. Metab. 2019, 16, 1–9. [Google Scholar] [CrossRef]
- Westerterp, K.R. Exercise for Weight Loss. Am. J. Clin. Nutr. 2019, 110, 540–541. [Google Scholar] [CrossRef] [PubMed]
- Murase, T.; Haramizu, S.; Shimotoyodome, A.; Tokimitsu, I. Reduction of Diet-Induced Obesity by a Combination of Tea-Catechin Intake and Regular Swimming. Int. J. Obes. 2006, 30, 561–568. [Google Scholar] [CrossRef] [PubMed] [Green Version]
- Wolfram, S.; Raederstorff, D.; Wang, Y.; Teixeira, S.R.; Elste, V.; Weber, P. TEAVIGOTM (Epigallocatechin Gallate) Supplementation Prevents Obesity in Rodents by Reducing Adipose Tissue Mass. Ann. Nutr. Metab. 2005, 49, 54–63. [Google Scholar] [CrossRef] [PubMed]
- Yazawa, S.; Suetome, N.; Okamoto, K.; Namiki, T. Content of Capsaicinoids and Capsaicinoid-like Substances in Fruit of Pepper (Capsicum annuum L.) Hybrids Made with “CH-19 Sweet” as a Parent. J. Jpn. Soc. Hortic. Sci. 1989, 58, 601–607. [Google Scholar] [CrossRef] [Green Version]
- Zsiborás, C.; Mátics, R.; Hegyi, P.; Balaskó, M.; Pétervári, E.; Szabó, I.; Sarlós, P.; Mikó, A.; Tenk, J.; Rostás, I.; et al. Capsaicin and Capsiate Could Be Appropriate Agents for Treatment of Obesity: A Meta-Analysis of Human Studies. Crit. Rev. Food Sci. Nutr. 2018, 58, 1419–1427. [Google Scholar] [CrossRef] [PubMed]
- Lejeune, M.P.G.M.; Kovacs, E.M.R.; Westerterp-Plantenga, M.S. Effect of Capsaicin on Substrate Oxidation and Weight Maintenance after Modest Body-Weight Loss in Human Subjects. Br. J. Nutr. 2003, 90, 651–659. [Google Scholar] [CrossRef] [Green Version]
- Iida, T.; Moriyama, T.; Kobata, K.; Morita, A.; Murayama, N.; Hashizume, S.; Fushiki, T.; Yazawa, S.; Watanabe, T.; Tominaga, M. TRPV1 Activation and Induction of Nociceptive Response by a Non-Pungent Capsaicin-like Compound, Capsiate. Neuropharmacology 2003, 44, 958–967. [Google Scholar] [CrossRef]
- Kwon, D.Y.; Kim, Y.S.; Ryu, S.Y.; Cha, M.R.; Yon, G.H.; Yang, H.J.; Kim, M.J.; Kang, S.; Park, S. Capsiate Improves Glucose Metabolism by Improving Insulin Sensitivity Better than Capsaicin in Diabetic Rats. J. Nutr. Biochem. 2013, 24, 1078–1085. [Google Scholar] [CrossRef]
- OhnukI, K.; Haramizu, S.; Oki, K.; Watanabe, T.; Yazawa, S.; Fushiki, T. Administration of Capsiate Promotes Energy Metabolism and Suppresses Body Fat Accumulation in Mice. Biosci. Biotechnol. Biochem. 2001, 65, 2735–2740. [Google Scholar] [CrossRef]
- Ono, K.; Tsukamoto-Yasui, M.; Hara-Kimura, Y.; Inoue, N.; Nogusa, Y.; Okabe, Y.; Nagashima, K.; Kato, F. Intragastric Administration of Capsiate, a Transient Receptor Potential Channel Agonist, Triggers Thermogenic Sympathetic Responses. J. Appl. Physiol. 2011, 110, 789–798. [Google Scholar] [CrossRef]
- Iwai, K.; Yazawa, A.; Watanabe, T. Roles as Metabolic Regulators of the Non-Nutrients, Capsaicin and Capsiate, Supplemented to Diets. Proc. Jpn. Acad. Ser. B 2003, 79, 207–212. [Google Scholar] [CrossRef] [Green Version]
- Josse, A.R.; Sherriffs, S.S.; Holwerda, A.M.; Andrews, R.; Staples, A.W.; Phillips, S.M. Effects of Capsinoid Ingestion on Energy Expenditure and Lipid Oxidation at Rest and during Exercise. Nutr. Metab. 2010, 7, 1–10. [Google Scholar] [CrossRef] [PubMed] [Green Version]
- Kawabata, F.; Inoue, N.; Yazawa, S.; Kawada, T.; Inoue, K.; Fushiki, T. Effects of CH-19 Sweet, a Non-Pungent Cultivar of Red Pepper, in Decreasing the Body Weight and Suppressing Body Fat Accumulation by Sympathetic Nerve Activation in Humans. Biosci. Biotechnol. Biochem. 2006, 70, 2824–2835. [Google Scholar] [CrossRef] [PubMed] [Green Version]
- Haramizu, S.; Kawabata, F.; Masuda, Y.; Ohnuki, K.; Watanabe, T.; Yazawa, S.; Tohru, F. Capsinoids, Non-Pungent Capsaicin Analogs, Reduce Body Fat Accumulation without Weight Rebound Unlike Dietary Restriction in Mice. Biosci. Biotechnol. Biochem. 2011, 75, 95–99. [Google Scholar] [CrossRef] [Green Version]
- Ohyama, K.; Nogusa, Y.; Suzuki, K.; Shinoda, K.; Kajimura, S.; Bannai, M. A Combination of Exercise and Capsinoid Supplementation Additively Suppresses Diet-Induced Obesity by Increasing Energy Expenditure in Mice. Am. J. Physiol. Endocrinol. Metab. 2015, 308, E315–E323. [Google Scholar] [CrossRef] [Green Version]
- Yoshioka, M.; Matsuo, T.; Lim, K.; Tremblay, A.; Suzuki, M. Effects of Capsaicin on Abdominal Fat and Serum Free-Fatty Acids in Exercise-Trained Rats. Nutr. Res. 2000, 20, 1041–1045. [Google Scholar] [CrossRef]
- Medina-Contreras, J.M.L.; Colado-Velázquez, J.; Gómez-Viquez, N.L.; Mailloux-Salinas, P.; Pérez-Torres, I.; Aranda-Fraustro, A.; Carvajal, K.; Bravo, G. Effects of Topical Capsaicin Combined with Moderate Exercise on Insulin Resistance, Body Weight and Oxidative Stress in Hypoestrogenic Obese Rats. Int. J. Obes. 2017, 41, 750–758. [Google Scholar] [CrossRef]
- Johnstone, A.M.; Murison, S.D.; Duncan, J.S.; Rance, K.A.; Speakman, J.R. Factors Influencing Variation in Basal Metabolic Rate Include Fat-Free Mass, Fat Mass, Age, and Circulating Thyroxine but Not Sex, Circulating Leptin, or Triiodothyronine. Am. J. Clin. Nutr. 2005, 82, 941–948. [Google Scholar] [CrossRef] [Green Version]
- Scharhag-Rosenberger, F.; Meyer, T.; Walitzek, S.; Kindermann, W. Effects of One Year Aerobic Endurance Training on Resting Metabolic Rate and Exercise Fat Oxidation in Previously Untrained Men and Women. Int. J. Sports Med. 2010, 31, 498–504. [Google Scholar] [CrossRef]
- Gaitán, J.M.; Eichner, N.Z.M.; Gilbertson, N.M.; Heiston, E.M.; Weltman, A.; Malin, S.K. Two Weeks of Interval Training Enhances Fat Oxidation during Exercise in Obese Adults with Prediabetes. J. Sport. Sci. Med. 2019, 18, 636–644. [Google Scholar]
- Nedergaard, J.; Golozoubova, V.; Matthias, A.; Asadi, A.; Jacobsson, A.; Cannon, B. UCP1: The Only Protein Able to Mediate Adaptive Non-Shivering Thermogenesis and Metabolic Ineffciency. Biochim. Biophys. Acta 2001, 1504, 82–106. [Google Scholar] [CrossRef] [Green Version]
- Holm, C. Molecular Mechanisms Regulating Hormone-Sensitive Lipase and Lipolysis. Biochem. Soc. Trans. 2003, 31, 1120–1124. [Google Scholar] [CrossRef] [PubMed]
- Hwang, D.; Seo, J.; Kim, J.; Lim, K. Effect of Mild-Intensity Exercise Training with Capsiate Intake on Fat Deposition and Substrate Utilization during Exercise in Diet-Induced Obese Mice. Phys. Act. Nutr. 2020, 24, 1–6. [Google Scholar] [CrossRef] [PubMed]
- Kim, J.; Park, J.; Lim, K. Nutrition Supplements to Stimulate Lipolysis: A Review in Relation to Endurance Exercise Capacity. J. Nutr. Sci. Vitaminol. (Tokyo) 2016, 62, 141–161. [Google Scholar] [CrossRef] [PubMed] [Green Version]
- Hussey, S.; Sharoff, C.; Garnham, A.; Zhenping, Y.; Bowen, B.; Mandarino, L.; Hargreaves, M. Effect of Exercise on the Skeletal Muscle Proteome in Patients with Type 2 Diabetes. Med. Sci. Sports Exerc. 2013, 45, 1069–1076. [Google Scholar] [CrossRef] [PubMed] [Green Version]
- Masuda, Y.; Haramizu, S.; Oki, K.; Ohnuki, K.; Watanabe, T.; Yazawa, S.; Kawada, T.; Hashizume, S.I.; Fushiki, T. Upregulation of Uncoupling Proteins by Oral Administration of Capsiate, a Nonpungent Capsaicin Analog. J. Appl. Physiol. 2003, 95, 2408–2415. [Google Scholar] [CrossRef] [Green Version]
- Ludy, M.J.; Moore, G.E.; Mattes, R.D. The Effects of Capsaicin and Capsiate on Energy Balance: Critical Review and Meta-Analyses of Studies in Humans. Chem. Senses 2012, 37, 103–121. [Google Scholar] [CrossRef] [Green Version]
- Lee, M.R.; Yang, H.J.; Park, K.I.; Ma, J.Y. Lycopus Lucidus Turcz. Ex Benth. Attenuates Free Fatty Acid-Induced Steatosis in HepG2 Cells and Non-Alcoholic Fatty Liver Disease in High-Fat Diet-Induced Obese Mice. Phytomedicine 2019, 55, 14–22. [Google Scholar] [CrossRef]
- Koch, C.E.; Lowe, C.; Pretz, D.; Steger, J.; Williams, L.M.; Tups, A. High-Fat Diet Induces Leptin Resistance in Leptin-Deficient Mice. J. Neuroendocrinol. 2014, 26, 58–67. [Google Scholar] [CrossRef]
- Tsurugizawa, T.; Nogusa, Y.; Ando, Y.; Uneyama, H. Different TRPV1-Mediated Brain Responses to Intragastric Infusion of Capsaicin and Capsiate. Eur. J. Neurosci. 2013, 38, 3628–3635. [Google Scholar] [CrossRef]
- Hill, A.S.; Sahay, A.; Hen, R. Increasing Adult Hippocampal Neurogenesis Is Sufficient to Reduce Anxiety and Depression-Like Behaviors. Neuropsychopharmacology 2015, 40, 2368–2378. [Google Scholar] [CrossRef] [Green Version]
- Tang, M.-M.; Lin, W.-J.; Pan, Y.-Q.; Guan, X.-T.; Li, Y.-C. Hippocampal Neurogenesis Dysfunction Linked to Depressive-like Behaviors in a Neuroinflammation Induced Model of Depression. Physiol. Behav. 2016, 161, 166–173. [Google Scholar] [CrossRef] [PubMed]
- Jantaratnotai, N.; Mosikanon, K.; Lee, Y.; McIntyre, R.S. The Interface of Depression and Obesity. Obes. Res. Clin. Pract. 2017, 11, 1–10. [Google Scholar] [CrossRef] [PubMed]
- Milaneschi, Y.; Simmons, W.K.; van Rossum, E.F.C.; Penninx, B.W. Depression and Obesity: Evidence of Shared Biological Mechanisms. Mol. Psychiatry 2019, 24, 18–33. [Google Scholar] [CrossRef] [PubMed]
- Van Gool, C.H.; Kempen, G.I.J.M.; Bosma, H.; Van Boxtel, M.P.J.; Jolles, J.; Van Eijk, J.T.M. Associations between Lifestyle and Depressed Mood: Longitudinal Results from the Maastricht Aging Study. Am. J. Public Health 2007, 97, 887–894. [Google Scholar] [CrossRef] [PubMed]
- Cryan, J.F.; Mombereau, C.; Vassout, A. The Tail Suspension Test as a Model for Assessing Antidepressant Activity: Review of Pharmacological and Genetic Studies in Mice. Neurosci. Biobehav. Rev. 2005, 29, 571–625. [Google Scholar] [CrossRef]
- Kong, K.H.; Kim, H.K.; Song, K.S.; Woo, Y.S.; Choi, W.S.; Park, H.R.; Park, M.; Kim, M.E.; Kim, M.S.; Ryu, J.S.; et al. Capsaicin Impairs Proliferation of Neural Progenitor Cells and Hippocampal Neurogenesis in Young Mice. J. Toxicol. Environ. Health Part A Curr. Issues 2010, 73, 1490–1501. [Google Scholar] [CrossRef]
- Stock, K.; Garthe, A.; De Almeida Sassi, F.; Glass, R.; Wolf, S.A.; Kettenmann, H. The Capsaicin Receptor TRPV1 as a Novel Modulator of Neural Precursor Cell Proliferation. Stem Cells 2014, 32, 3183–3195. [Google Scholar] [CrossRef]
- Yau, S.Y.; Li, A.; Hoo, R.L.C.; Ching, Y.P.; Christie, B.R.; Lee, T.M.C.; Xu, A.; So, K.F. Physical Exercise-Induced Hippocampal Neurogenesis and Antidepressant Effects Are Mediated by the Adipocyte Hormone Adiponectin. Proc. Natl. Acad. Sci. USA 2014, 111, 15810–15815. [Google Scholar] [CrossRef] [Green Version]
- Han, T.; Leem, Y.; Kim, H. Treadmill Exercise Restores High Fat Diet-Induced Disturbance of Hippocampal Neurogenesis through β 2-Adrenergic Receptor-Dependent Induction of Thioredoxin-1 and Brain-Derived Neurotrophic Factor. Brain Res. 2018, 1707, 154–163. [Google Scholar] [CrossRef]
- Feldstein, C.; Julius, S. The Complex Interaction between Overweight, Hypertension, and Sympathetic Overactivity. J. Am. Soc. Hypertens. 2009, 3, 353–365. [Google Scholar] [CrossRef] [PubMed]
- Valentini, M.; Julius, S.; Palatini, P.; Brook, R.D.; Bard, R.L.; Bisognano, J.D.; Kaciroti, N. Attenuation of Haemodynamic, Metabolic and Energy Expenditure Responses to Isoproterenol in Patients with Hypertension. J. Hypertens. 2004, 22, 1999–2006. [Google Scholar] [CrossRef] [PubMed] [Green Version]
- Kalil, G.Z.; Haynes, W.G. Sympathetic Nervous System in Obesity-Related Hypertension: Mechanisms and Clinical Implications. Hypertens. Res. 2012, 35, 4–16. [Google Scholar] [CrossRef] [PubMed] [Green Version]
- Chu, N.F.; Spiegelman, D.; Hotamisligil, G.S.; Rifai, N.; Stampfer, M.; Rimm, E.B. Plasma Insulin, Leptin, and Soluble TNF Receptors Levels in Relation to Obesity-Related Atherogenic and Thrombogenic Cardiovascular Disease Risk Factors among Men. Atherosclerosis 2001, 157, 495–503. [Google Scholar] [CrossRef]
- Billman, G.E.; Cagnoli, K.L.; Csepe, T.; Li, N.; Wright, P.; Mohler, P.J.; Fedorov, V.V. Exercise Training-Induced Bradycardia: Evidence for Enhanced Parasympathetic Regulation without Changes in Intrinsic Sinoatrial Node Function. J. Appl. Physiol. 2015, 118, 1344–1355. [Google Scholar] [CrossRef] [PubMed] [Green Version]
- Billman, G.E. Counterpoint: Exercise Training-Induced Bradycardia: The Case for Enhanced Parasympathetic Regulation. J. Appl. Physiol. 2017, 123, 686–688. [Google Scholar] [CrossRef] [Green Version]
- Hariri, N.; Thibault, L. High-Fat Diet-Induced Obesity in Animal Models. Nutr. Res. Rev. 2010, 23, 270–299. [Google Scholar] [CrossRef] [Green Version]


| CON | CAP | EXE | EXE+CAP | ||
|---|---|---|---|---|---|
| BW (g) | Pre | 34.91 ± 1.87 | 35.08 ± 2.49 | 35.28 ± 1.84 | 34.69 ± 1.48 |
| Post | 47.79 ± 1.54 | 49.40 ± 4.95 | 46.95 ± 4.70 | 44.03 ± 1.22 † | |
| BWG (g/8 wk) | 12.88 ± 2.36 | 14.32 ± 2.63 | 11.68 ± 4.51 | 9.34 ± 1.15 † | |
| FI (g/8 wk/mouse) | 177.7 ± 3.00 | 169.7 ± 12.4 | 188.5 ± 11.1 * | 201.5 ± 3.96 †,§ | |
| FER (BWG/FI*100) | 7.26 ± 1.42 | 8.49 ± 1.75 | 6.21 ± 2.36 | 4.64 ± 0.61 † | |
| Adipose tissue (mg/BW g) | |||||
| Epididymal | 37.33 ± 4.74 | 46.93 ± 6.64 * | 33.50 ± 9.11 | 28.53 ± 8.70 † | |
| Perirenal | 15.34 ± 3.99 | 20.14 ± 4.25 * | 16.71 ± 6.53 | 11.11 ± 2.88 † | |
| Mesenteric | 27.40 ± 3.21 | 30.85 ± 3.85 | 25.09 ± 2.92 | 22.58 ± 3.65 † | |
| Total | 80.07 ± 7.15 | 97.92 ± 10.2 * | 75.30 ± 18.1 | 62.21 ± 14.6 † | |
| CON | CAP | EXE | EXE+CAP | |
|---|---|---|---|---|
| Leptin(ng/mL) | 18.97 ± 4.42 | 26.83 ± 9.12 * | 18.51 ± 8.95 | 9.84 ± 5.74 †,§ |
| Noradrenaline (pg/mL) | 73.54 ± 9.32 | 86.87 ± 5.02 * | 80.45 ± 2.89 | 78.17 ± 4.01 † |
| Glucose (mg/dl) | 153.3 ± 46.8 | 172.3 ± 47.1 | 194.6 ± 66.1 | 186.0 ± 66.1 |
| Insulin (ng/mL) | 0.86 ± 0.24 | 0.83 ± 0.28 | 0.77 ± 0.32 | 0.79 ± 0.39 |
Publisher’s Note: MDPI stays neutral with regard to jurisdictional claims in published maps and institutional affiliations. |
© 2021 by the authors. Licensee MDPI, Basel, Switzerland. This article is an open access article distributed under the terms and conditions of the Creative Commons Attribution (CC BY) license (http://creativecommons.org/licenses/by/4.0/).
Share and Cite
Hwang, D.; Seo, J.-B.; Park, H.-Y.; Kim, J.; Lim, K. Capsiate Intake with Exercise Training Additively Reduces Fat Deposition in Mice on a High-Fat Diet, but Not without Exercise Training. Int. J. Mol. Sci. 2021, 22, 769. https://0-doi-org.brum.beds.ac.uk/10.3390/ijms22020769
Hwang D, Seo J-B, Park H-Y, Kim J, Lim K. Capsiate Intake with Exercise Training Additively Reduces Fat Deposition in Mice on a High-Fat Diet, but Not without Exercise Training. International Journal of Molecular Sciences. 2021; 22(2):769. https://0-doi-org.brum.beds.ac.uk/10.3390/ijms22020769
Chicago/Turabian StyleHwang, Deunsol, Jong-Beom Seo, Hun-Young Park, Jisu Kim, and Kiwon Lim. 2021. "Capsiate Intake with Exercise Training Additively Reduces Fat Deposition in Mice on a High-Fat Diet, but Not without Exercise Training" International Journal of Molecular Sciences 22, no. 2: 769. https://0-doi-org.brum.beds.ac.uk/10.3390/ijms22020769