Article

ATP1A1 Mutant in Aldosterone-Producing Adenoma Leads to Cell Proliferation

1
Department of Molecular and Internal Medicine, Graduate School of Biomedical and Health Sciences, Hiroshima University, Hiroshima 734-8551, Japan
2
Division of Endocrinology, G.V. (Sonny) Montgomery VA Medical Center and University of Mississippi Medical Center, Jackson, MS 39216, USA
3
Department of Pharmacology & Toxicology, University of Mississippi Medical Center, Jackson, MS 39216, USA
4
Department of Anatomical Pathology, Hiroshima University Hospital, Hiroshima 734-8551, Japan
*
Author to whom correspondence should be addressed.
Int. J. Mol. Sci. 2021, 22(20), 10981; https://0-doi-org.brum.beds.ac.uk/10.3390/ijms222010981
Submission received: 13 September 2021 / Revised: 4 October 2021 / Accepted: 9 October 2021 / Published: 12 October 2021
(This article belongs to the Special Issue Role of Aldosterone Excess in Determining Cardiovascular Risk)

Abstract

:
The molecular mechanisms by which ATP1A1 mutation-mediated cell proliferation or tumorigenesis in aldosterone-producing adenomas (APAs) have not been elucidated. First, we investigated whether the APA-associated ATP1A1 L104R mutation stimulated cell proliferation. Second, we aimed to clarify the molecular mechanisms by which the ATP1A1 mutation-mediated cell proliferated. We performed transcriptome analysis in APAs with ATP1A1 mutation. ATP1A1 L104R mutation were modulated in human adrenocortical carcinoma (HAC15) cells (ATP1A1-mutant cells), and we evaluated cell proliferation and molecular signaling events. Transcriptome and immunohistochemical analysis showed that Na/K-ATPase (NKA) expressions in ATP1A1 mutated APA were more abundant than those in non-functioning adrenocortical adenoma or KCNJ5 mutated APAs. The significant increase of number of cells, amount of DNA and S-phase population were shown in ATP1A1-mutant cells. Fluo-4 in ATP1A1-mutant cells were significantly increased. Low concentration of ouabain stimulated cell proliferation in ATP1A1-mutant cells. ATP1A1-mutant cells induced Src phosphorylation, and low concentration of ouabain supplementation showed further Src phosphorylation. We demonstrated that NKAs were highly expressed in ATP1A1 mutant APA, and the mutant stimulated cell proliferation and Src phosphorylation in ATP1A1-mutant cells. NKA stimulations would be a risk factor for the progression and development to an ATP1A1 mutant APA.

1. Introduction

Primary aldosteronism (PA) is the most common form of secondary hypertension, with a prevalence of eight to ten percent among hypertensive patients. It is associated with a significant increase in cardiovascular morbidity and mortality as compared to that in essential hypertension with similar levels and duration of elevated blood pressure [1,2,3]. PA is mainly classified with aldosterone-producing adenoma (APA) and idiopathic hyperaldosteronism [4]. Somatic mutations of KCNJ5, ATP1A1, ATP2B3, CACNA1D, CACNA1H, CLCN2, or CTNNB1 genes that drive autonomous aldosterone production have been documented in APAs [5,6,7,8,9,10,11,12,13]. Recently, Gong, et al., suggested that metabolic reprograming involved with tumorigenesis in KCNJ5 mutant APA [14]. However, the molecular mechanisms of genesis or growth of APAs mediated by ATP1A1 mutations have not been elucidated.
Aldosterone-producing cell clusters (APCCs), also called Aldosterone-producing micronodules (APM), are foci of cells with zona glomerulosa (ZG) morphology, and strong and uniform immunoreactivity for aldosterone synthase (CYP11B2) [15,16]. ATP1A1 mutations found in APA have also been detected in APCCs of normal individuals and in APCC-to-APA transitional lesions (AATLs), which have similar characteristics to APCC with respect to CYP11B2 immunoreactivity and penetrate into the zona fasciculata (ZF) [17,18]. Recent evaluation of the accumulated mutations and histopathology of the adrenal glomerulosa carried a potential that APM are the origin of APAs [19,20]. On the other hand, two-hit model for APA formation was also described in cases with APC variant or with partial and well-localized KCNJ5 staining in APA [21,22,23]. Therefore, the mechanism of APA development is still uncertain and may differ depending on the underlying mutation(s).
Na/K-ATPase (NKA) is a transmembrane heterodimer composed of a catalytic α subunit and a glycosylated β subunit, which exchange intracellular Na+ for extracellular K+ using ATP as its source of energy. The catalytic α subunit of NKA appears in four different forms, and α1 subunit is coded by the ATP1A1 gene. The β subunit controls α/β heterodimer assembly and insertion into the plasma membrane [24]. The roles of NKA by exchange of Na+ and K+ are the responsible for the osmoregulation as well as the transmission of nerve impulses, and cardiotonic steroids with pharmacologic concentration, micromolar range, inhibits the pump function [25]. The mutations of ATP1A1, G99R, L104R, V332G, and EETA963S, are located in transmembrane domain of NKA [5,6,26,27]. Those caused the alteration of K+ binding and loss of pump activity, and resulted in membrane depolarization and voltage-gated Ca2+ channel activation. In addition to the pump function, the NKA also works as a receptor, and NKA consists of receptor complex coupled with proto-oncogene non-receptor tyrosine-protein kinase (Src) for signal transduction. The signal transduction is triggered by low nanomolar concentration of cardiotonic steroids, which does not influence the pump function [25,28]. NKA-associated Src phosphorylation activates intracellular signaling molecules including epidermal growth factor receptor (EGFR), Inositol 1,4,5-trisphosphate receptor (IP3R), phospholipase C-γ (PLC-γ), and phosphatidylinositol 3-kinase (PI3K), which promote increased cell volume, cell proliferation, and tumor progression [29,30,31,32].
Known signaling properties of NKA together with the mutational analysis and the molecular evidence mentioned above led us to hypothesize that the somatic mutations of the ATP1A1 gene induce tumorigenesis and stimulate tumor growth of APA in addition to increasing autonomous aldosterone synthesis. In the initial part of our study, we determined whether an ATP1A1 mutation induced cell proliferation in vitro. This was followed by exploring key molecules that promote cell proliferation using APA samples to elucidate the molecular mechanism of APA tumorigenesis. Our data revealed that other subfamilies of ATPase were upregulated in APAs with ATP1A1 mutations. The signal transduction functions of one or more NKA that are upregulated in APAs might be responsible for tumorigenesis or tumor growth. We thus hypothesized that increased total NKA-associated signal transduction might potentiate cell proliferation in ATP1A1 mutant APA. The aim of our study was to delineate the mechanism by which NKA signal transduction induces proliferation in ATP1A1-mutatant adrenal cells. The ATP1A1 L104R mutation was selected as the prototype because it is reasonably common among the ATP1A1 mutations documented in APAs and functions in a similar manner as other ATP1A1 mutations.

2. Results

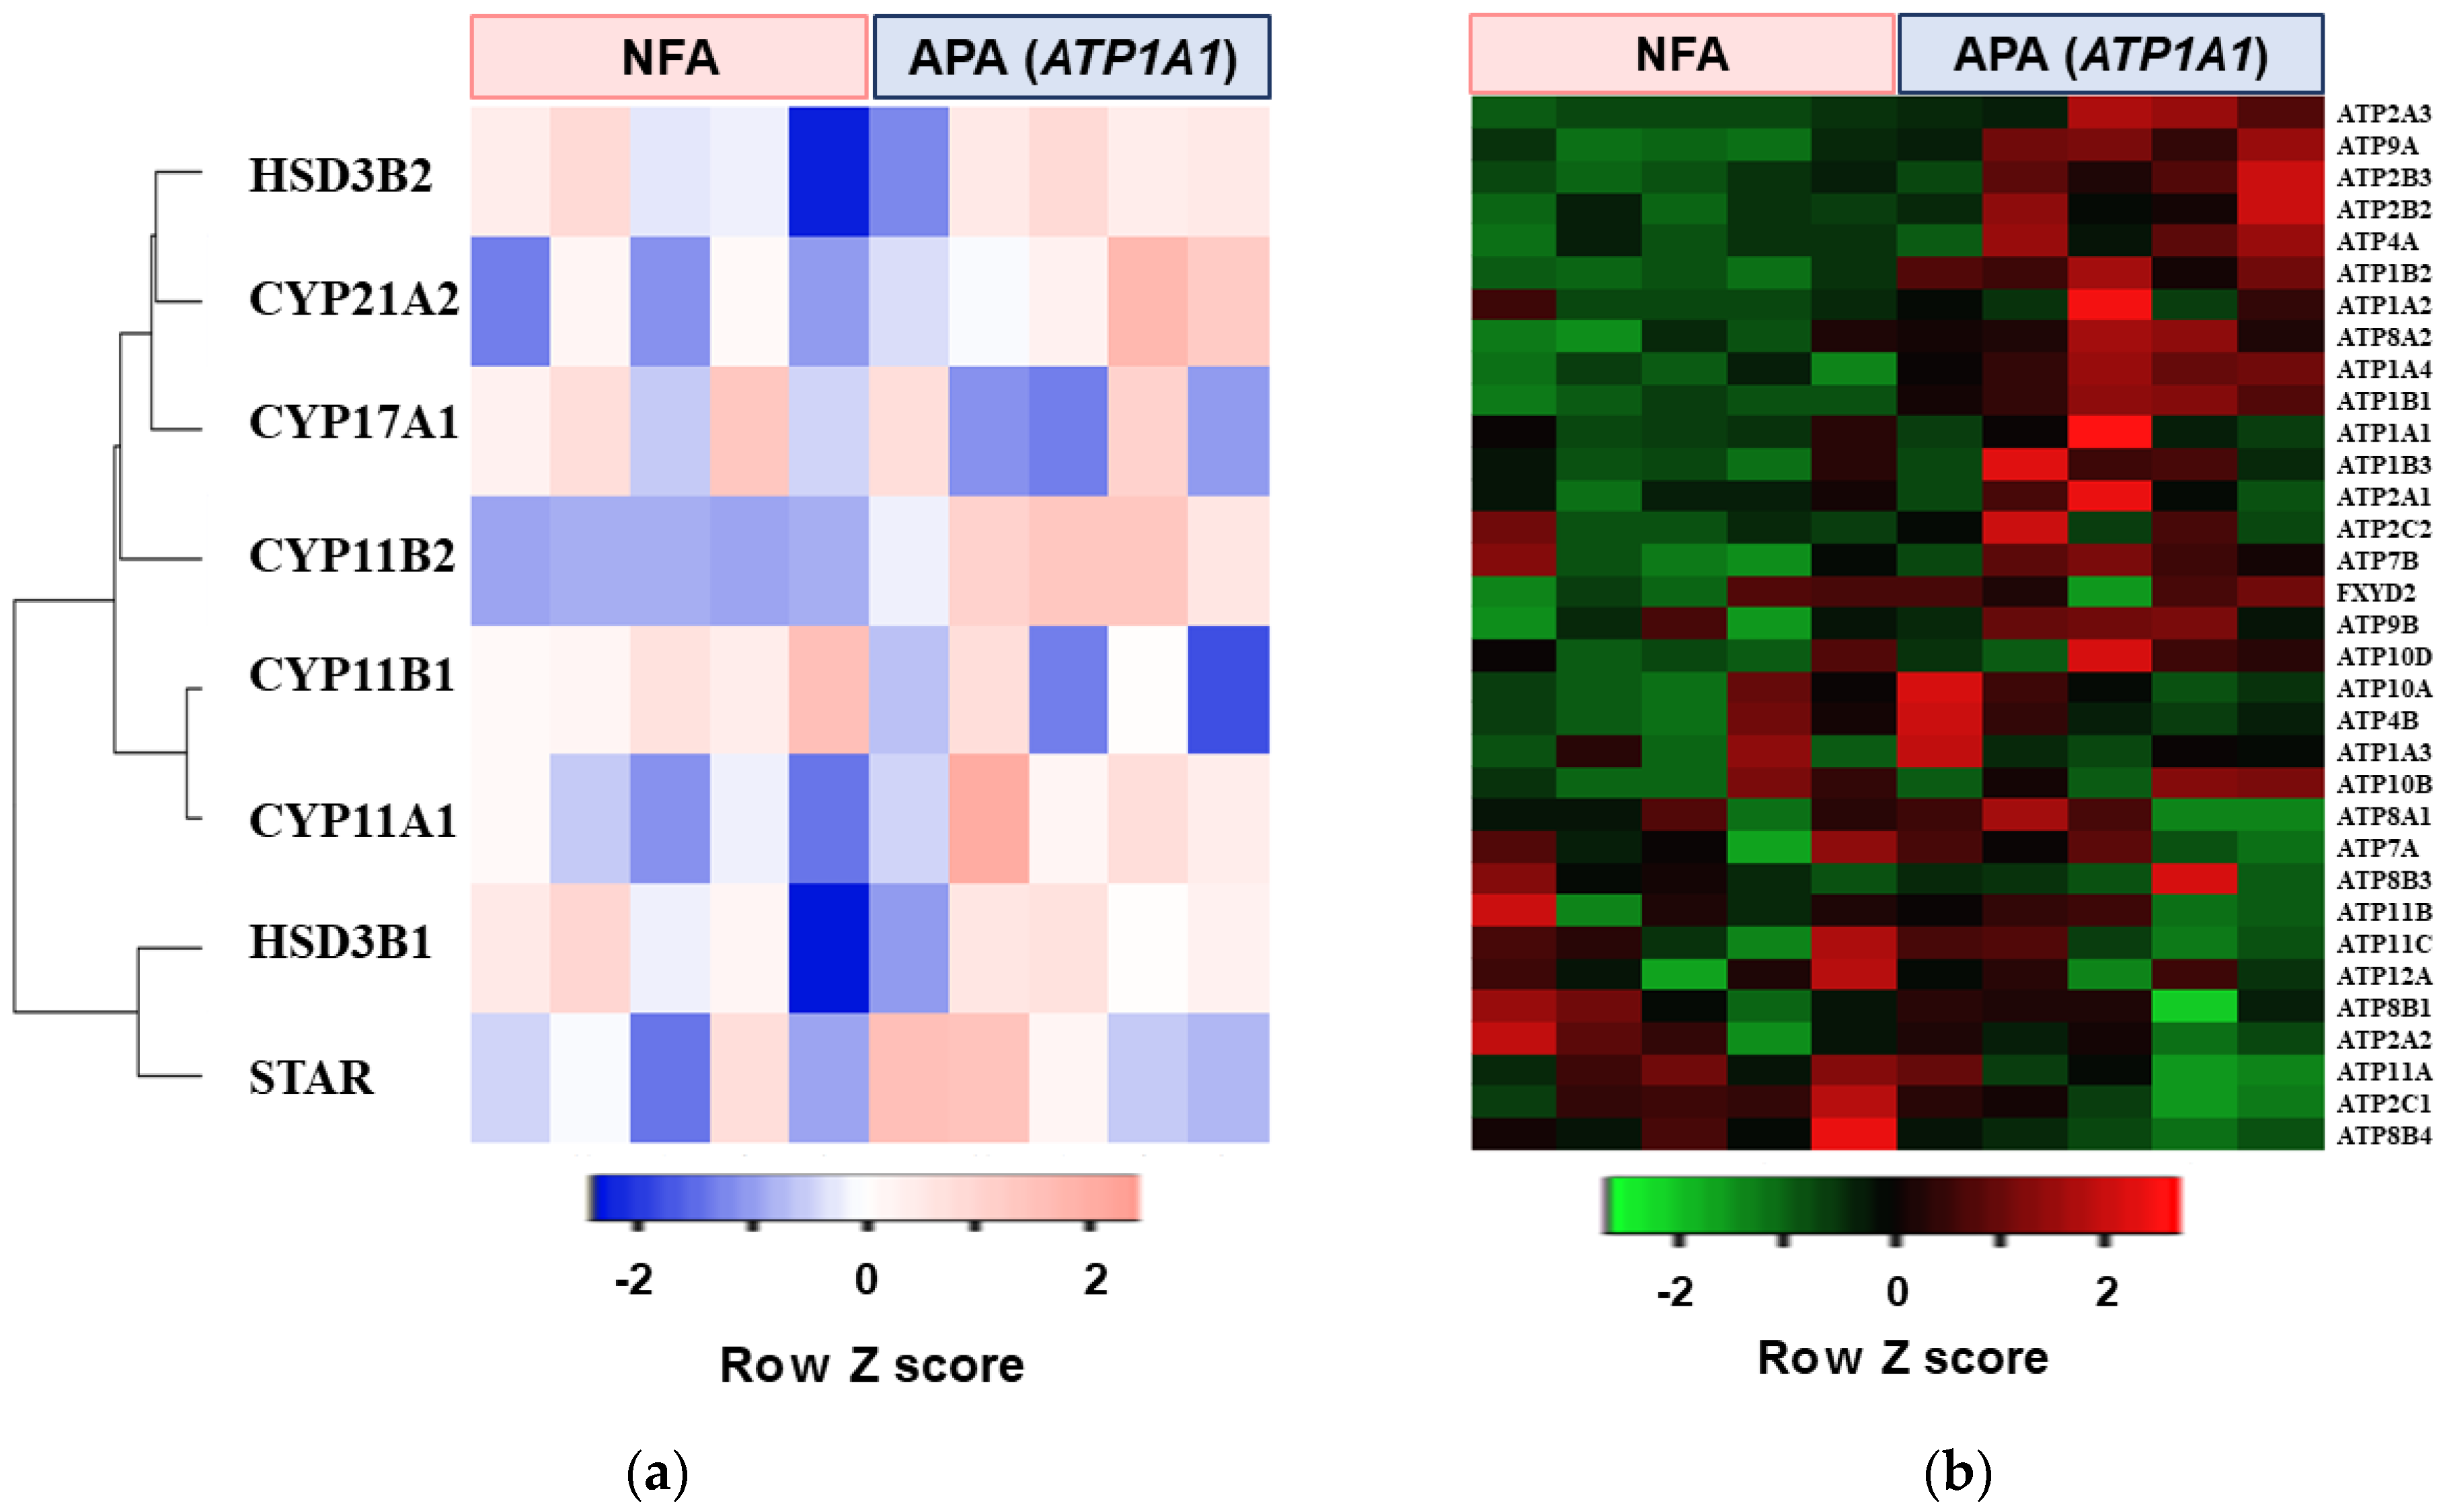
2.1. Transcriptome Analysis in APA with ATP1A1 Mutation

Microarray analysis was performed using five APAs with ATP1A1 mutations and five non–functioning adrenocortical adenomas (NFAs). ATP1A1 mutant APAs had higher levels of steroidogenic enzymes including CYP11B2 expression relative to NFAs (Figure 1a). Pathway analysis with GSEA was performed by R software. The top five pathways up-regulated in ATP1A1-mutated APAs are shown in Table 1. The ion transport pathway by P type ATPase was given specific emphasis, as high expression of NKA may stimulate the cell proliferation or APA growth. The comparison of the expression rates of the genes for all the subunits for human P type ATPases between ATP1A1-mutated APA and NFA are shown in Figure 1b and Table 2. Several genes including ATP1A2, ATP1A4, ATP1B1, and ATP1B2, which encode for α- and β-subunit of NKA, were highly expressed in ATP1A1 mutant APAs.

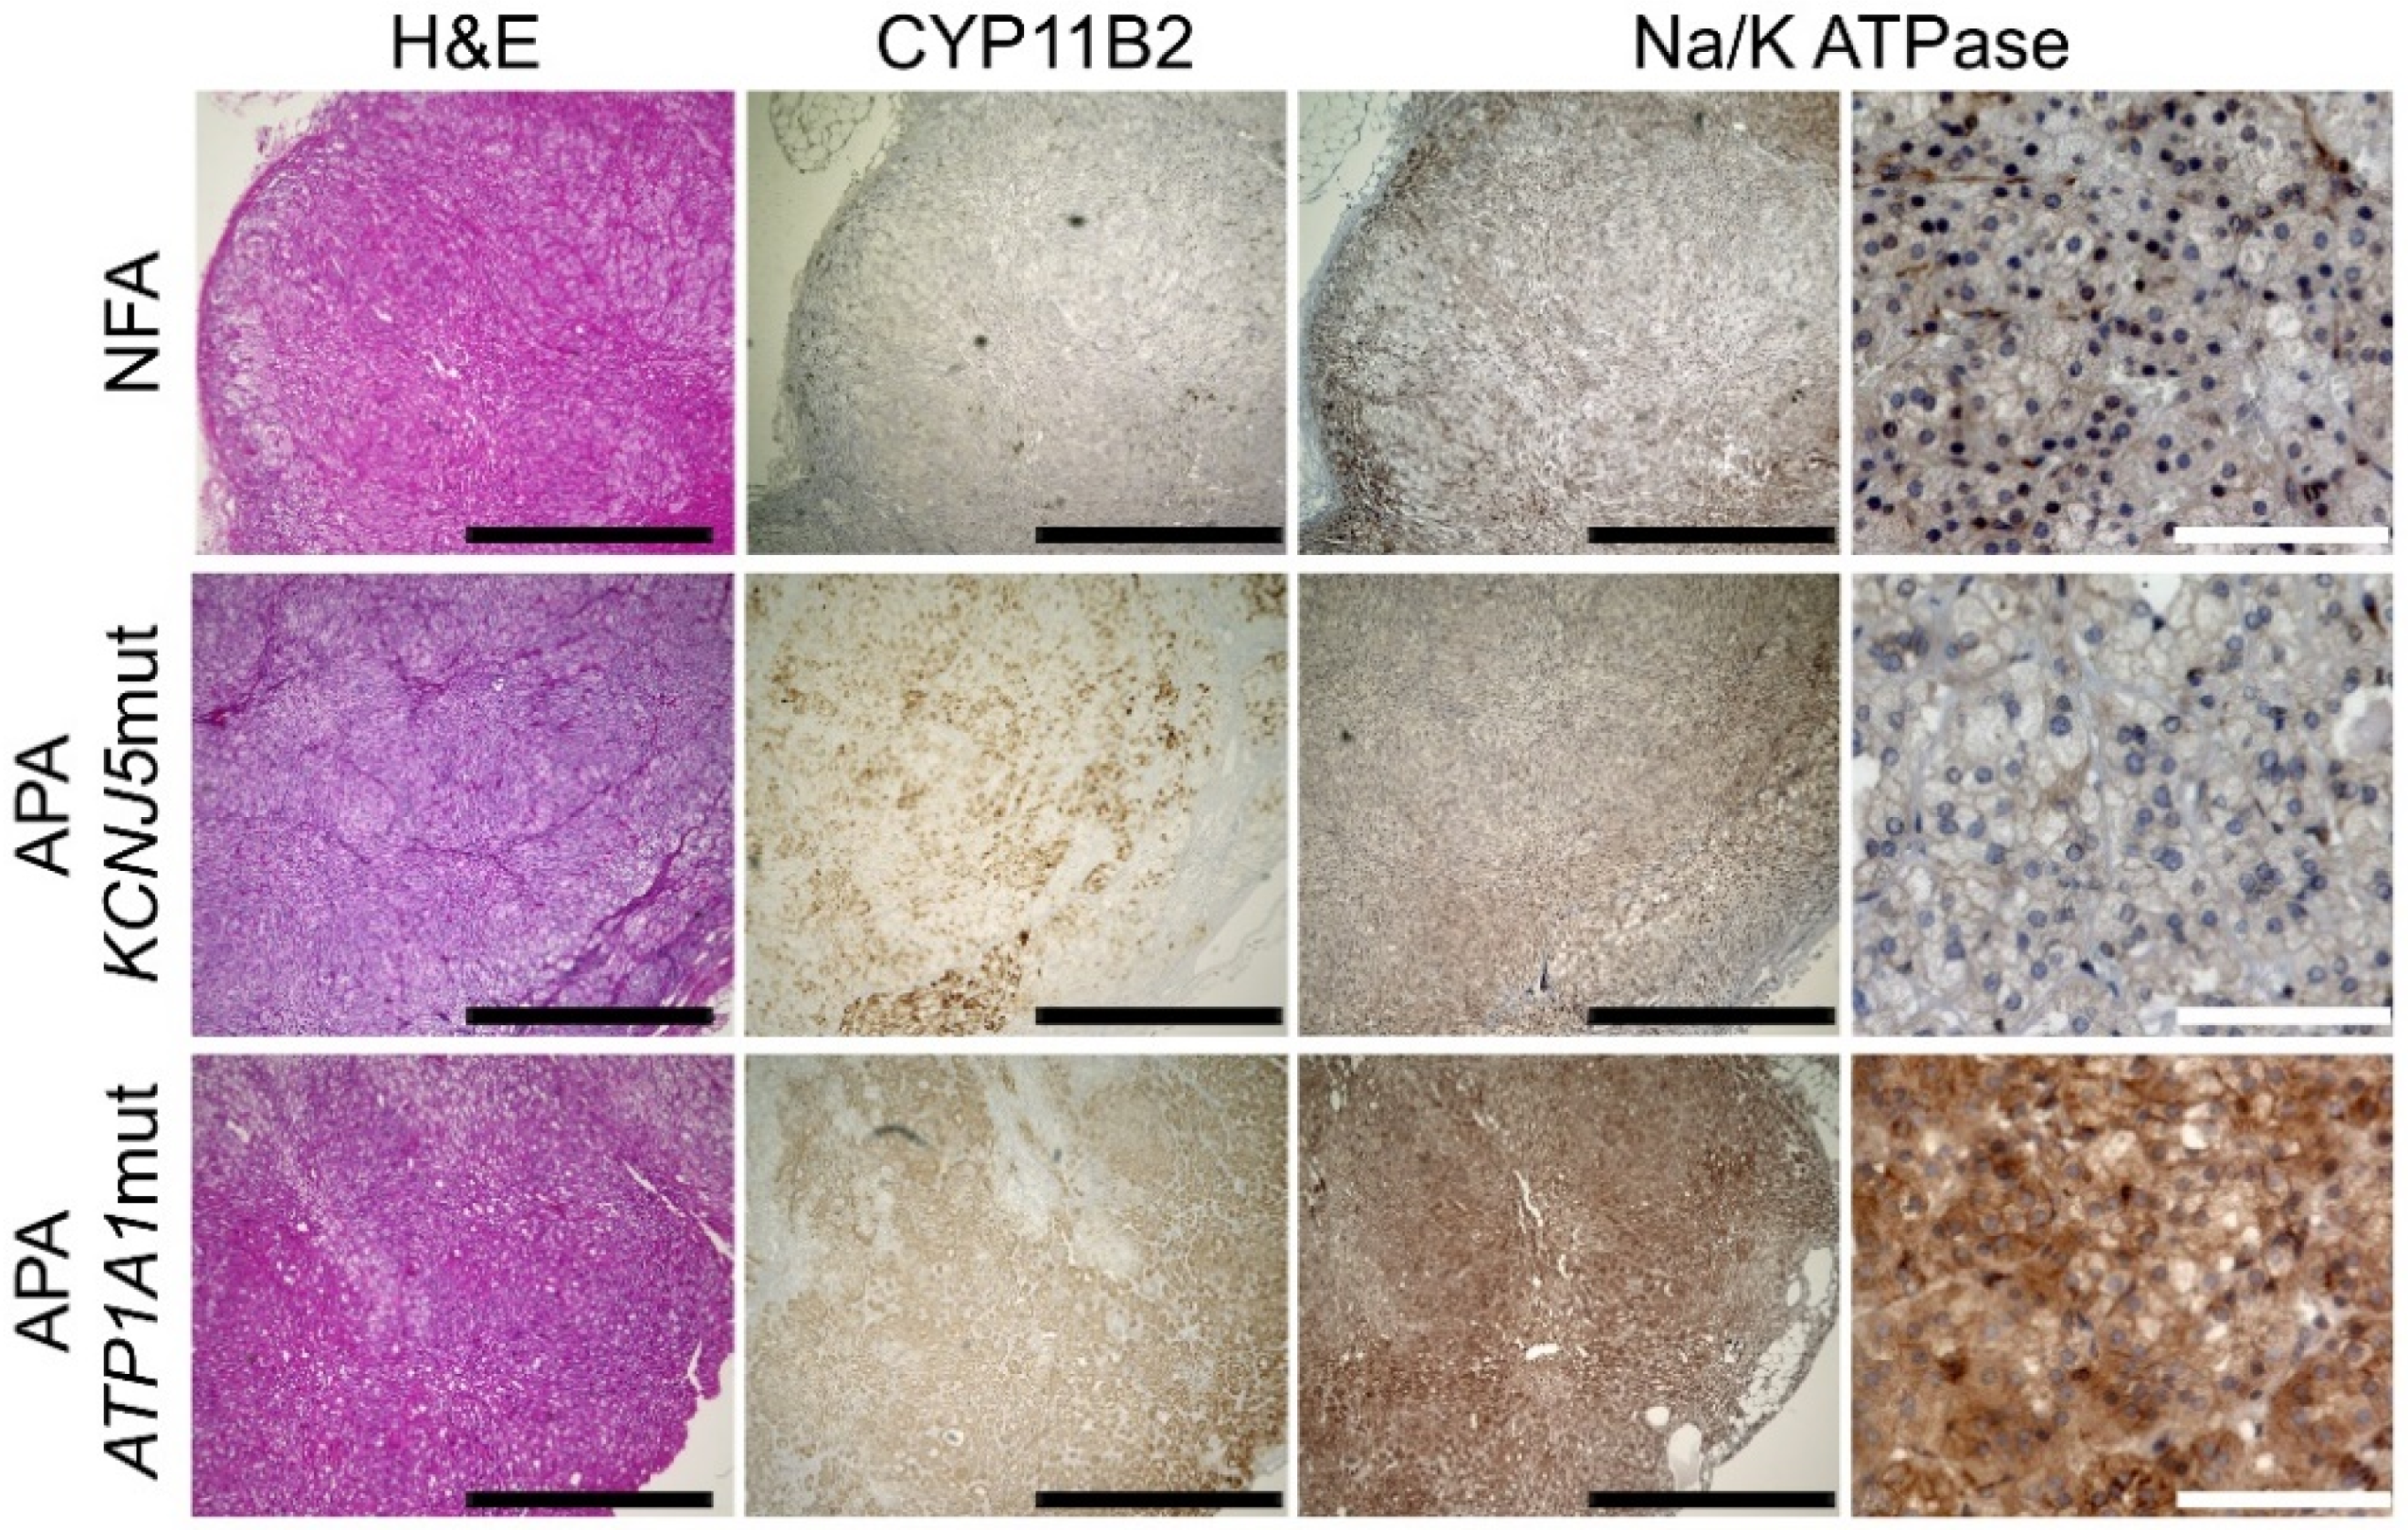
2.2. Immunohistochemical Analysis of NKA in APAs and NFAs

Since genes coding for NKA subunits were highly expressed in APAs with an ATP1A1 mutation, we performed immunohistochemical analysis of NKA in ATP1A1 and KCNJ5-mutated APA and NFA. To know the expression of all the NKA in the adenoma, a polyclonal antibody for total NKA was applied in this experiment. NKA positive cells were more abundant in ATP1A1 mutant APAs as compared to those in KCNJ5 mutant APAs and NFAs (Figure 2).

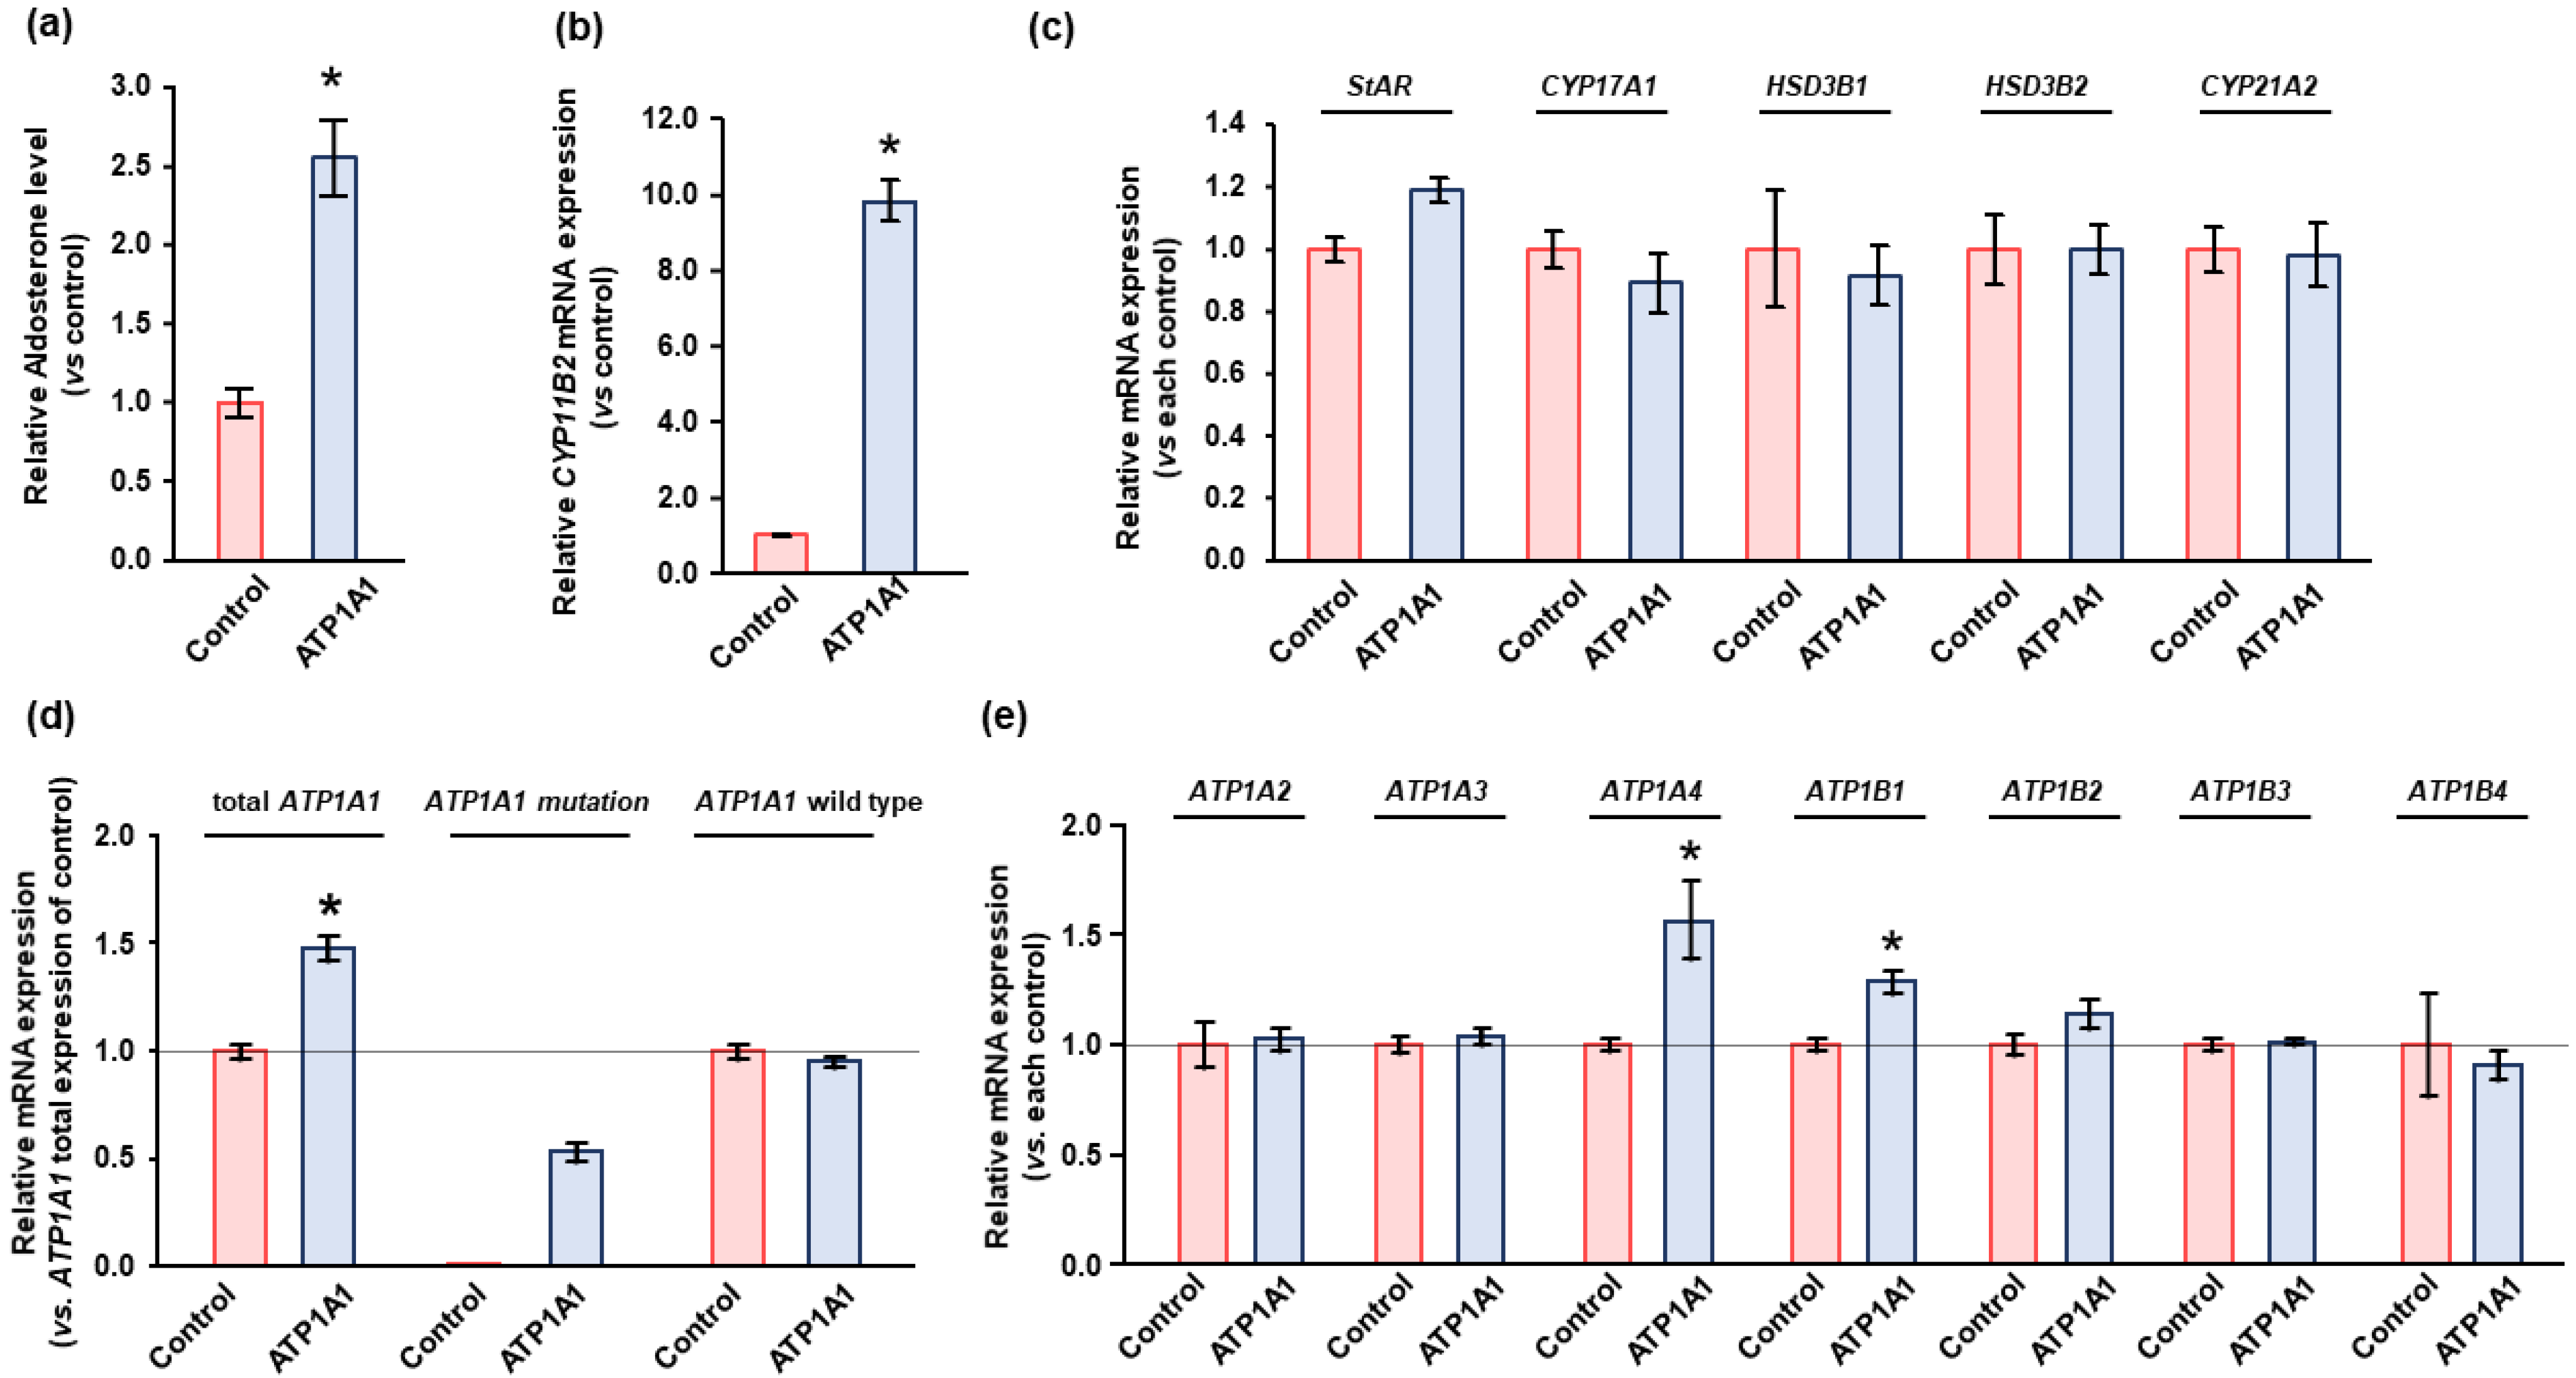
2.3. Effects of ATP1A1 Mutation on NKA Expression in Human Adrenocortical Carcinoma (HAC15) Cells

There was a significant increase in basal aldosterone production by 2.5-fold and in CYP11B2 transcripts by 9.8-fold in HAC15 cells stably expressing the ATP1A1 mutant relative to control cells (Figure 3a,b). Transduction with the wild type ATP1A1 lentivirus did not alter aldosterone biosynthesis or CYP11B2 transcripts compared to transduction with the empty lentivirus (data not shown). Further, the gene expression levels of StAR and the steroidogenic enzymes CYP17A1, HSD3B1, HSD3B2, and CYP21A2 were not altered by the ATP1A1 mutant in HAC15 cells (Figure 3c). To evaluate the effect of increased NKA expression due to ATP1A1 mutation on cell proliferation, we introduced empty vector as control in HAC15 cells. Gene expression analysis demonstrated that HAC15 cells with ATP1A1 mutation showed 1.36-fold increase of total ATP1A1 expression (p < 0.05), and native ATP1A1 expression did not change after the introduction of ATP1A1 mutant (Figure 3d). The ATP1A1 mutation significantly increased ATP1A1 and ATP1B1 expression were increased in HAC15 cells (Figure 3e).

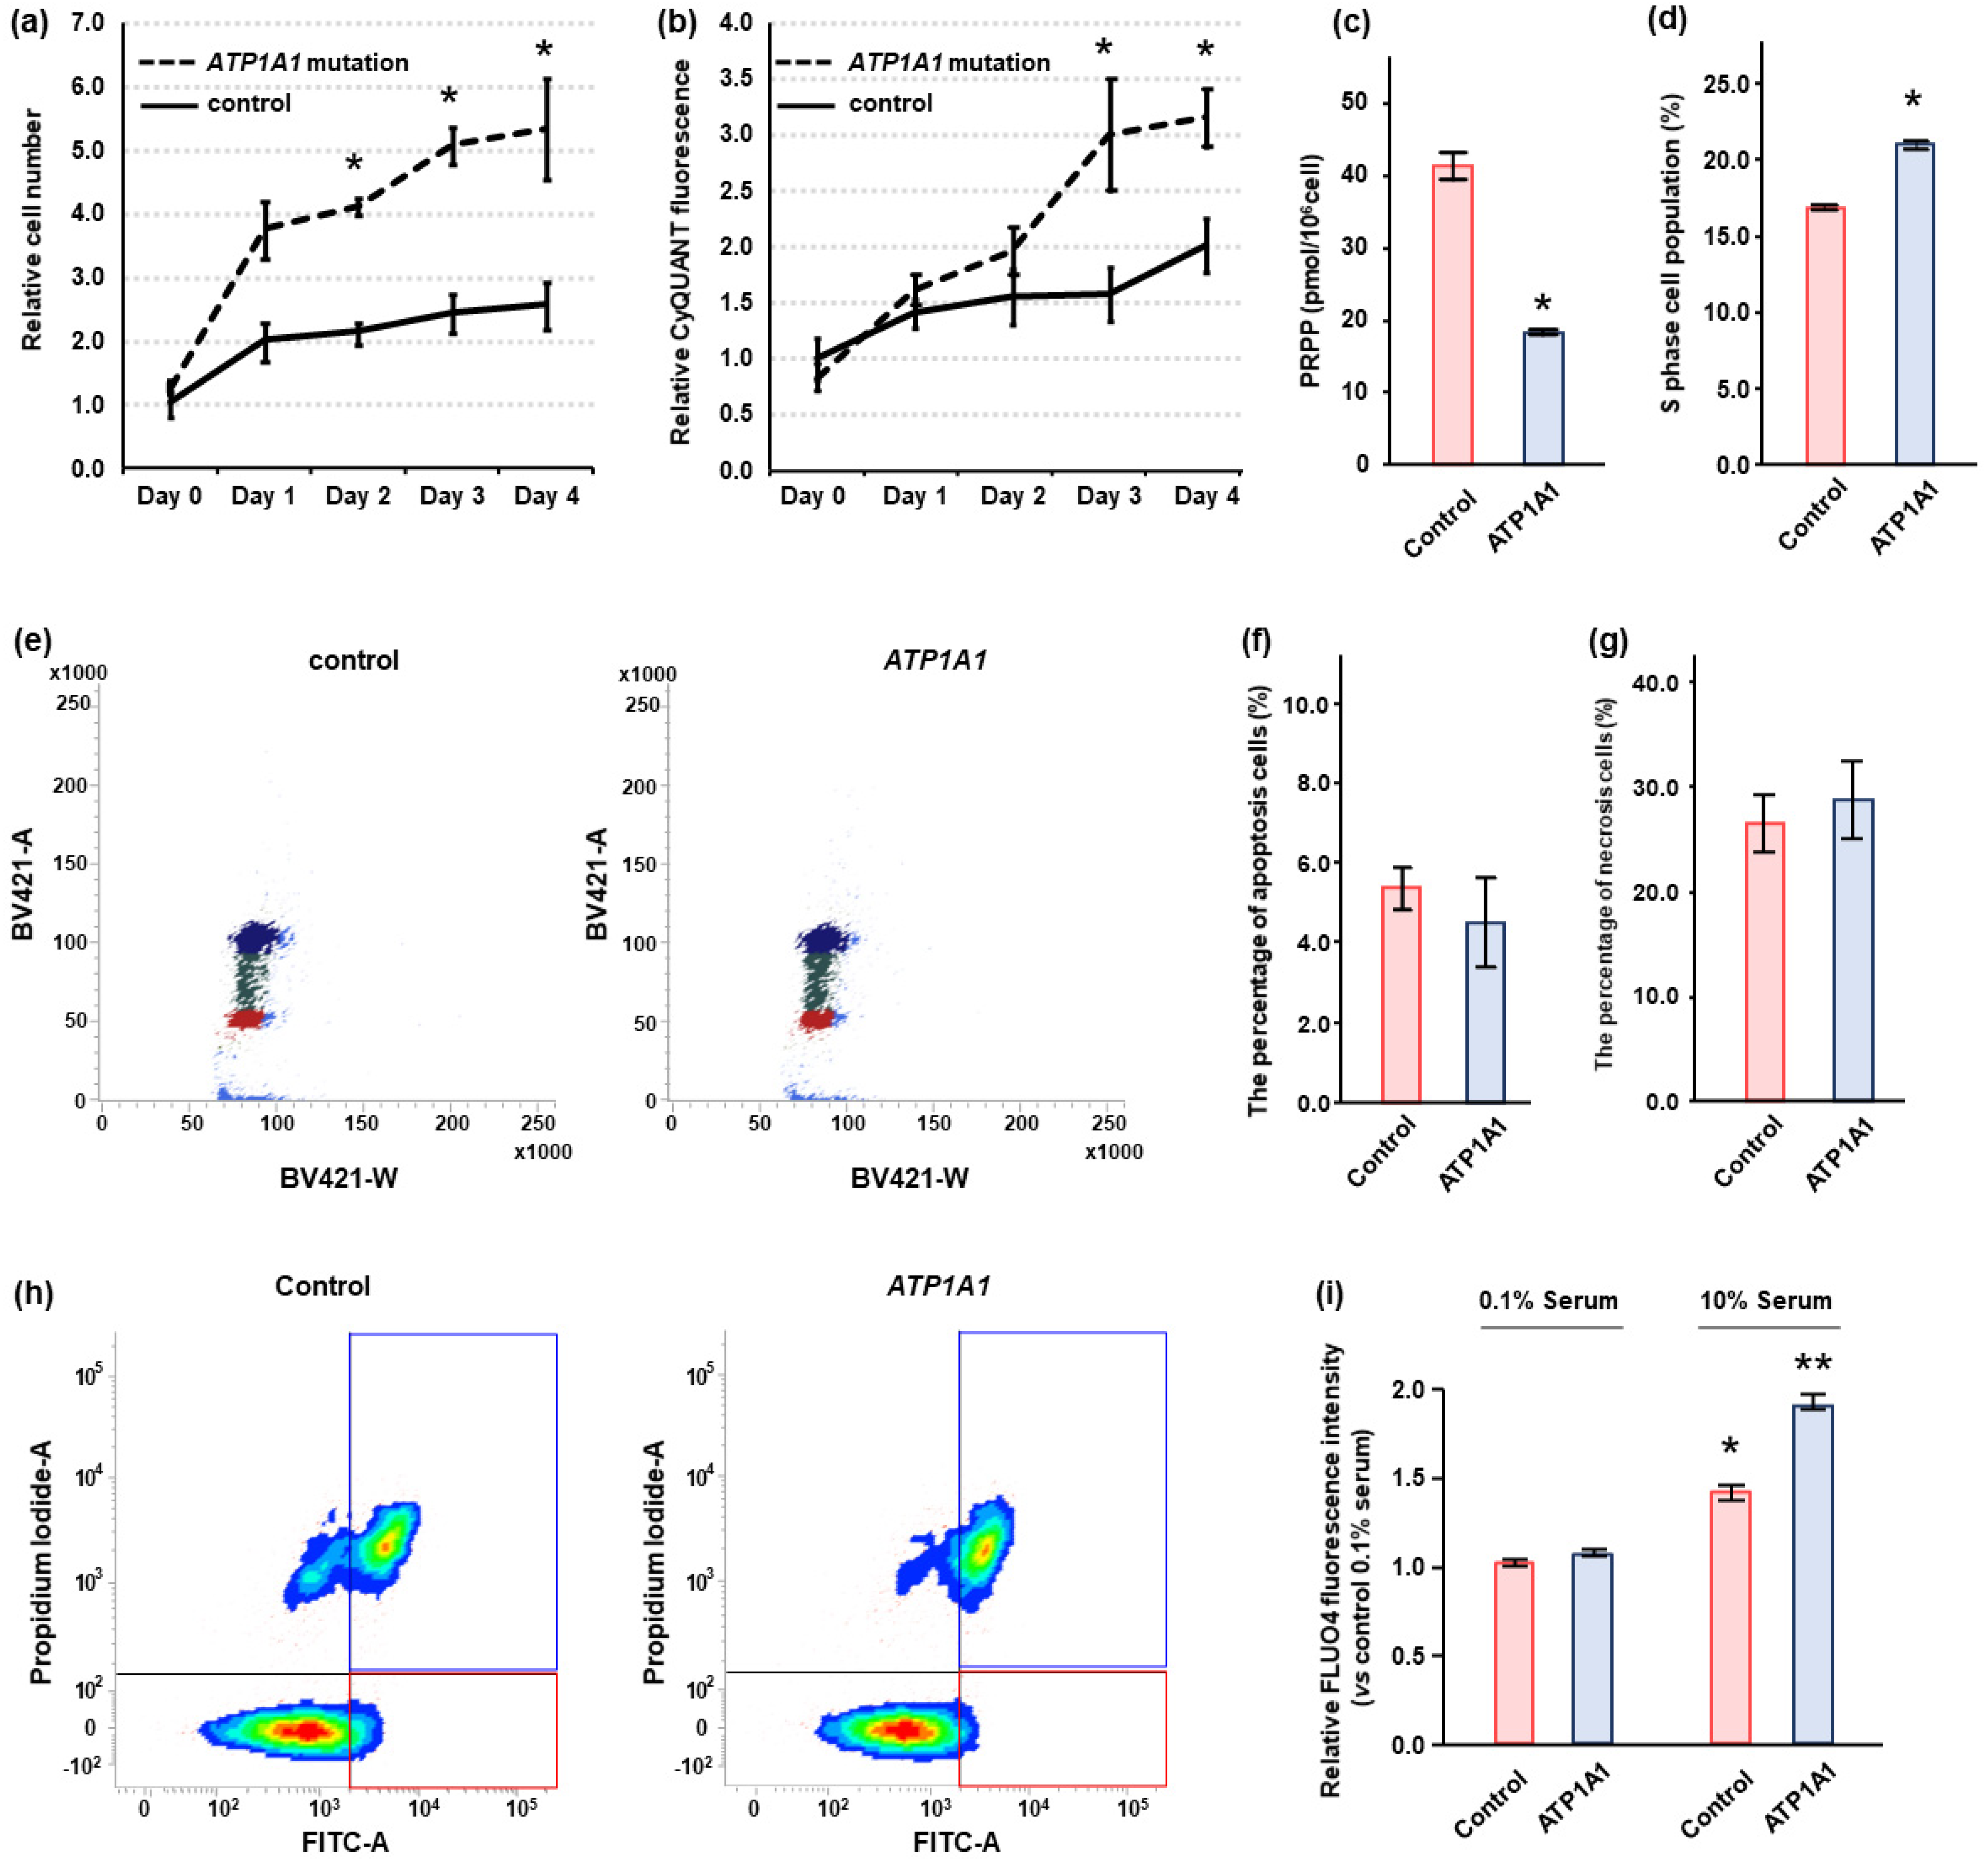
2.4. Effects of ATP1A1 Mutation on Cell Proliferation in HAC15 Cells

We counted cell number and calculated DNA quantity in control and HAC15 cells with the ATP1A1 L104R mutant. When grown in regular media, the cell number and DNA quantity in cells expressing the ATP1A1 mutation became significantly greater than that in control cells within two to three days after gene transduction (Figure 4a,b). Phosphoribosyl Diphosphate (PRPP), which was consumed by the increase of purine and pyrimidine nucleotide biosynthesis [33], was measured in control and ATP1A1 mutant cells. PRPP level in ATP1A1 mutant cells was lower than that in control cells (Figure 4c). The ATP1A1 mutation significantly increased S-phase cell population by cell cycle analysis (Figure 4d,e). The ATP1A1 mutation did not increase apoptotic or necrotic cells in HAC15 cells (Figure 4f–h). However, there was no differences in cell proliferation between ATP1A1 mutated and control cells, when the amount of serum in the medium was reduced from 10% to 0.1% (data not shown).
HAC15 cells with the ATP1A1 mutation did not exhibit an increase in Fluo-4, an indicator of intracellular Ca2+ concentration, relative to control cells under 0.1% serum condition (Figure 4i). However, ATP1A1 mutation led to a 1.3-fold increase in Fluo-4 levels as compared with control cells treated with 10% serum (p < 0.05, Figure 4i). These results indicated that serum might be essential for the increase of intracellular Ca2+ levels.

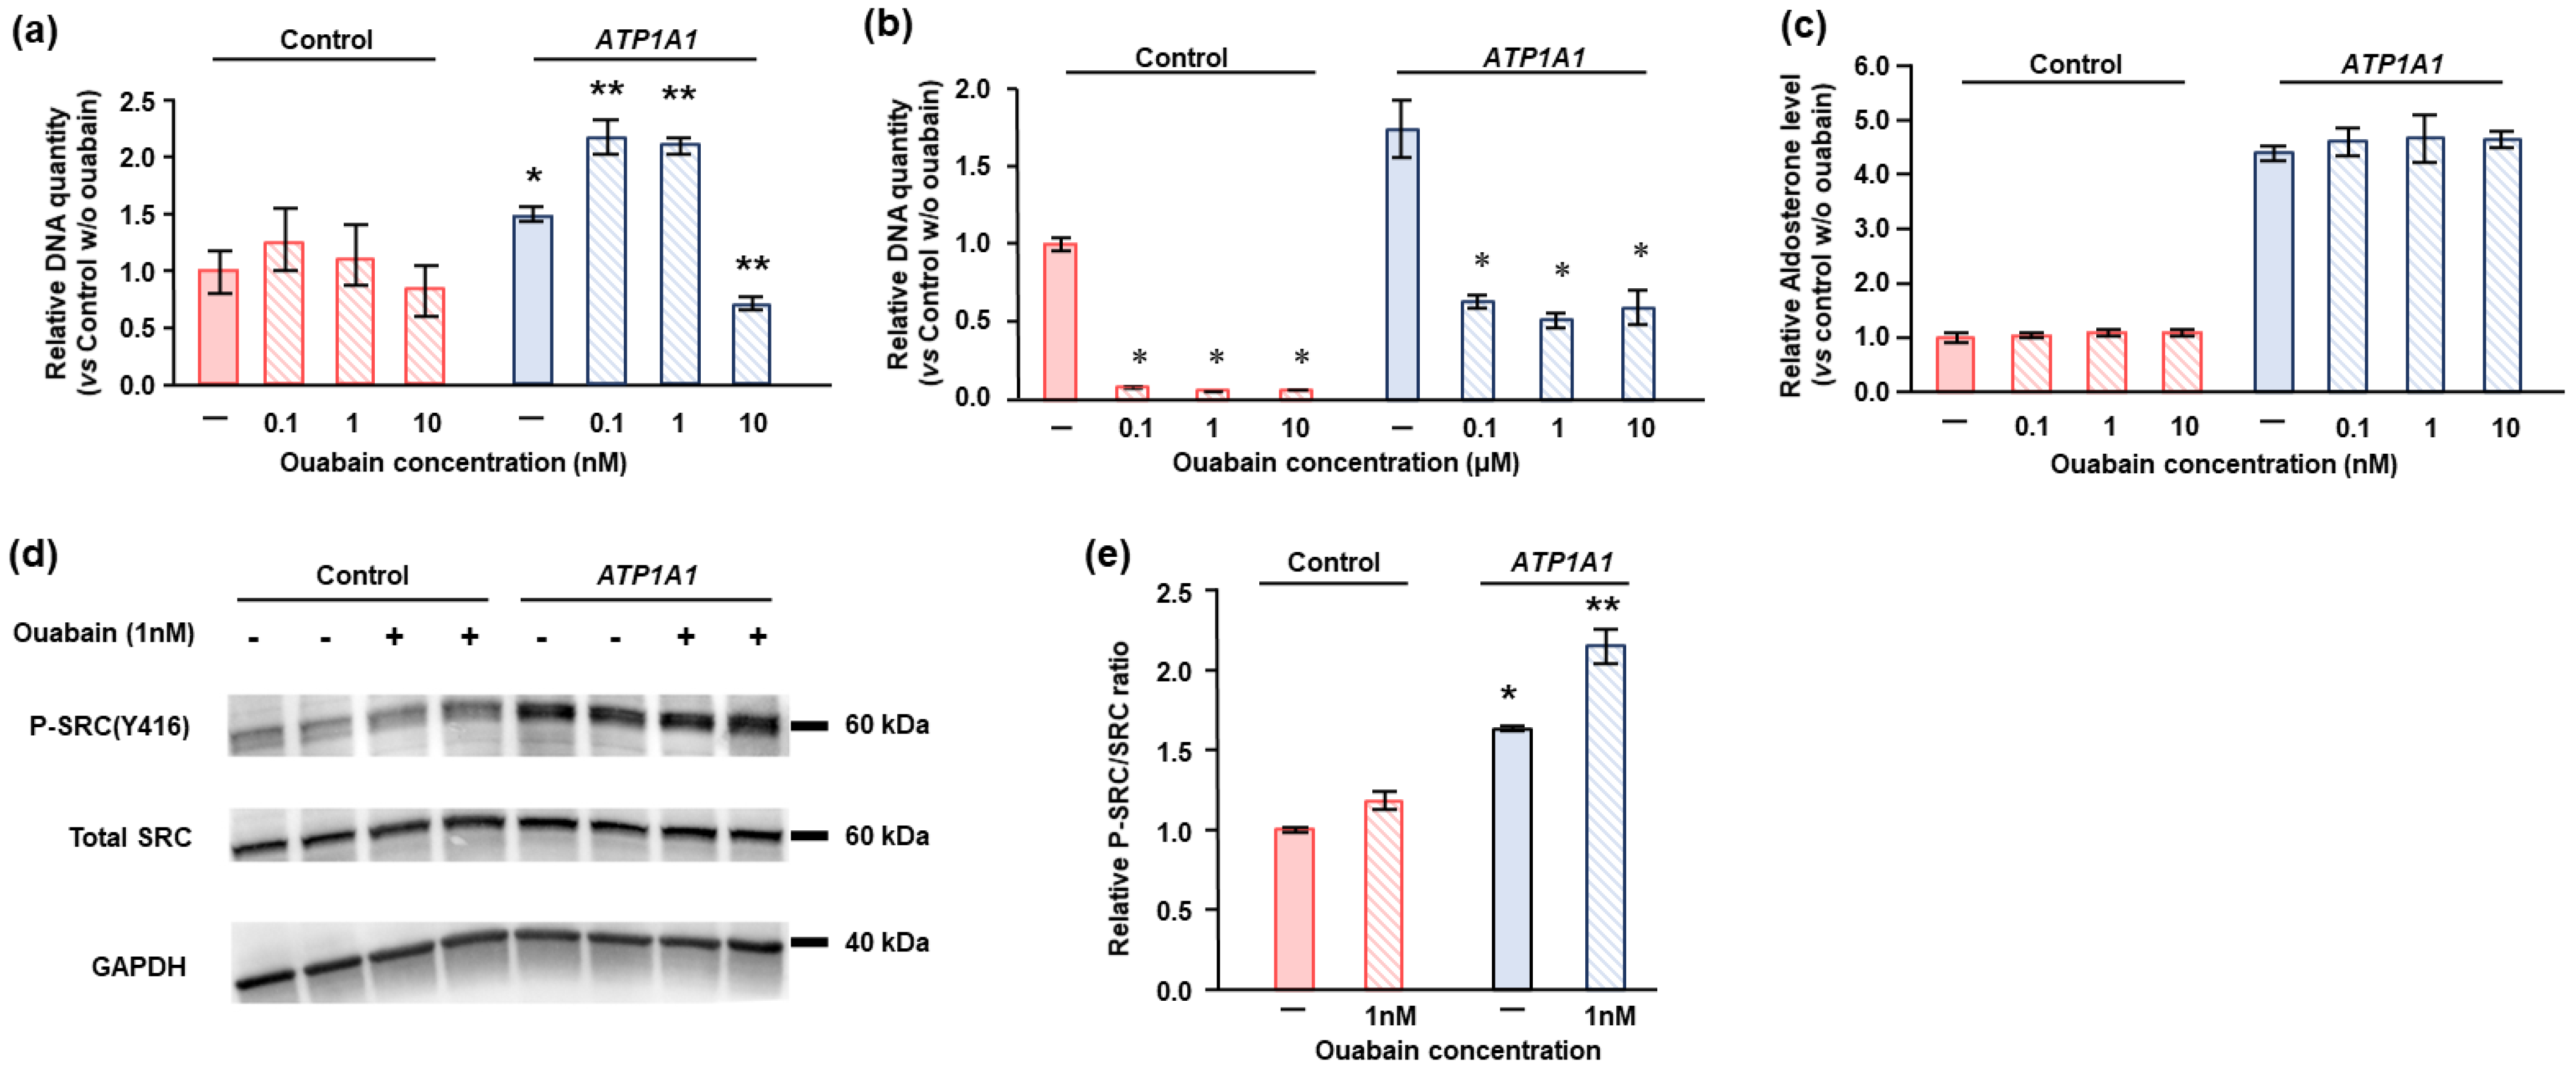
2.5. Effects of Ouabain in HAC15 Cells with ATP1A1 Mutation

Ouabain is a prototypical cardiotonic steroid commonly used for basic experiments with the NKA [28,34]. High concentrations of ouabain and other cardiotonic steroids inhibit NKA pump function, whereas lower concentrations stimulate cell proliferation via NKA-mediated signal transduction in cancer cells [28]. The effects of ouabain were studied in the control and ATP1A1 L104R HAC15 cells grown in serum replete/deprived media. Low concentrations (0.1 nM to 1 nM) of ouabain significantly stimulate cell proliferation in HAC15 cells with the ATP1A1 mutation, whereas it did not affect cell proliferation in control cells (Figure 5a). More than 10 nM of ouabain suppressed cell proliferation and decreased viable cells (Figure 5a,b). Ouabain did not stimulate aldosterone levels in ATP1A1 mutant or control cells at any of the concentrations used (Figure 5c).
To determine the mechanisms of NKA-mediated signal transduction on cell proliferation, we investigated the phosphorylation levels of Src, the major signaling molecule for NKA, by Western blotting. ATP1A1 mutant cells had significantly higher basal Src phosphorylation levels than those of control cells, and treatment with 1 nM of ouabain further increased Src phosphorylation levels as compared to ATP1A1 mutant cells without ouabain supplementation (Figure 5d,e).

3. Discussion

We demonstrated that NKAs were highly expressed in APAs with ATP1A1 mutations than in NFA or APAs with KCNJ5 mutations. Transduction of the ATP1A1 L104R mutation responsible for autonomous production of aldosterone in some APAs stimulated cell proliferation in HAC15 cells under 10% serum concentrations and low concentrations of ouabain. Furthermore, low concentration of ouabain treatment resulted in an increased Src phosphorylation in HAC15 cells with ATP1A1 mutation in the presence of adequate serum.
Clinical studies based on mutational and histopathological analyses suggested a progressive relationship between APM formation and APAs expressing ATP1A1 mutations [17,18]. Our results showing the stimulation of HAC15 adrenal cell proliferation in presence of the ATP1A1 L104R mutation, further supports this impression. The human adrenal cortex is histologically divided into three layers, the ZG, ZF, and zona reticularis. Aldosterone is produced by ZG cells, which consist of compact cells distinct from lipid droplet laden ZF cells; however, the morphology and steroidogenic capacity of cells within different APAs are variable. The ATP1A1 mutation was originally found in the screening of APAs with compact cells [6], and further pathological study indicated that ATP1A1-mutated APA tend to have compact cells [20,35,36,37]. Our current results provide one of the mechanisms that a ZG cell with a mutation in the ATP1A1 gene may proliferate and develop an APA.
In contrast, the genesis of APAs with KCNJ5 mutations is likely to be different from that with ATP1A1 mutations. A KCNJ5 mutation have been rarely found in APM [17,38]. Most APAs with KCNJ5 mutations predominantly consist of clear cells, rather than the normally compact ZG cells [35,36,37,39]. Moreover, as we have previously reported, a KCNJ5 mutation did not increase proliferation of HAC15 cells [40]. The absence of trophic effects of the KCNJ5 mutations suggests that APA cells bearing KCNJ5 mutations essentially require an additional factor or mutation to cause adenoma formation [23]. Taken together, the pathophysiology differs between APAs with ATP1A1 and KCNJ5 mutations.
We further showed that activation of Src through phosphorylation, one of the molecular mechanisms of NKA cell signaling, was enhanced in HAC15 cells with ATP1A1 mutation and resulted in increased intracellular Ca2+ and cell proliferation, as summarized in Figure 6. APAs with ATP1A1 mutations have abundant NKA levels, as other NKA subunit expression might be increased to compensate for decrease of NKA pump activity. α2 and α4 isoform of NKA, which were upregulated in HAC15 cells with ATP1A1 mutation, have a higher or similar affinity for ouabain compared to α1 isoform of NKA [41,42]. We found that ouabain, a ligand of NKA, exerted a biphasic effect on ATP1A1 mutant cell proliferation. Concentrations below or in the low nanomolar range increased proliferation of the mutated HAC15 cells via induction of a canonical NKA cell signaling mechanism. Higher doses of ouabain in the micromolar range inhibits the pump function of Na+ and K+ exchange. Our findings corroborate those of others. For instance, lower doses of ouabain were reported to have proliferative effects on adrenocortical tumor cells [43], and stimulate cell proliferation and progression in a number of cancer cell lines [44,45,46]. Collectively, these clinical and experimental data demonstrate that ATP1A1 mutations in APA cells could induce cell growth via their cell signaling functions.
Cardiac glycosides including ouabain are naturally occurring compounds identified in various plant and animal species [47]. The existence of an endogenous ouabain or other cardenolide and its interaction with aldosterone were proposed over 40 years ago [48], and detection of cardiac glycosides in human plasma by High Performance Liquid Chromatography and Mass Spectrometry continues to be reported [49]. However, despite an enormous effort from many academic and commercial laboratories, the mechanism for the synthesis of ouabain or another cardenolide in a mammal remains unelucidated, nor have the intermediates or metabolites of such a compound been isolated [50,51]. Nevertheless, the concentrations of ouabain as low as 0.1 nM that induce NKA cell signaling pathways in other systems stimulated adrenal cell proliferation in our study as well [52,53], suggesting that cardiac steroids participate in the NKA-mediated cell proliferation too. If it is not endogenous, might the elusive ouabain-like compound sought by many be an environmental endocrine disruptor compound? The ZG of most normal adult human adrenal glands comprise many CYP11B2-immunoreactive APM surrounded by compact cells that do not express CYP11B2 [15,54], in addition to the fact that APM might be precursors for developing APAs with ATP1A1 mutations. Consequently, measuring cardiac glycosides in plasma of the patients with APA may explain a potential role for a cardenolide regardless of its source. In addition, this knowledge may also facilitate the elucidation of preventive approaches for the development of APAs with an ATP1A1 mutation.
The effects of serum on cell proliferation were more prominent than those of ouabain. Therefore, mechanisms’ addition to NKA-mediated Src phosphorylation may be associated with ATP1A1 mutation-induced cell proliferation. Since the aberrant or ectopic receptors such as MC2R, AVPR, and HTR4 are expressed in APA [55,56], the agonists including ACTH, arginine vasopressin, and somatostatin in serum might be associated with cell proliferation. It is reported that ATP1A1 mutations, including the L104R, lead to decreased cytosolic pH in an adrenocortical cell line, resulting in autonomous aldosterone production [57]. Our pathway analysis showed that “Proximal Tubule Bicarbonate Reclamation” was upregulated in the ATP1A1 mutant APA (Table 1). Intracellular acidification in ATP1A1 mutant cells might potentiate gene transcription related with bicarbonate reclamation compensatory. Transmembrane protein 9 expression and Wnt/β-catenin signaling activation were associated with intracellular acidification induced colorectal cancer progression [58]. Therefore, intracellular acidification in ATP1A1 mutant cells may also mediate APA development. We could not fully characterize the ATP1A1 mutation mediated cell proliferation, and thus further basic investigations are needed.
This study has some limitations. Sample size of this study is limited, because the frequency of ATP1A1 mutation in APAs is small. Further studies are needed to confirm our results. Since this study was performed using one cancer-derived cell line, additional study using primary cell culture or cell lines from other species would be desired. Sufficient serum stimulated cell proliferation in HAC15 cells with ATP1A1 mutation; however, we could not identify known cardiotonic steroids or other factors in the serum that influenced cell growth. Additionally, we could not test the effects of calcium signal inhibition or activation on cell proliferation in vitro. Further studies are required for the molecular mechanisms by which cardiotonic steroids and others may mediate APA development.

4. Materials and Methods

4.1. Adrenal Tissues

The tissues of NFA (n = 5) and ATP1A1 mutated APA (n = 5) were enrolled in this study. The clinical, pathological, and genetic characteristics were shown in a previous report [59], and no CTNNB1 mutation was detected in NFA tissues. The presence of CYP11B2 by immunohistochemistry and quantitative polymerase chain reaction assays were confirmed in all APA tissues as previously reported [60,61]. This study was approved by the research ethics committee of Hiroshima University (Approval code; Hi-1 Hiroshima University, Hiroshima, Japan), and performed in accordance with the Declaration of Helsinki. All patients provided written informed consent.

4.2. RNA Extraction and Quantitative Polymerase Chain Reaction (qPCR) Assays

Total RNA was extracted using RNeasy Mini kit (Qiagen, Hilden, Germany). First-strand cDNA was generated from 300 ng of total RNA using Takara PrimeScript RT Master Mix (Takara Bio Inc., Shiga, Japan) following the manufacturer’s recommended protocol. The mRNA expression levels of GAPDH, StAR, and steroidogenic enzymes such as CYP11B2, CYP17A1, HSD3B1, HSD3B2, CYP21A2 were determined using a Taqman Gene Expression Assay kit (Applied Biosystems, Waltham, MA, USA). mRNA expression levels were analyzed as arbitrary units normalized against GAPDH expression.

4.3. Cell Culture and Reagents

HAC15 cells were provided by Professor WE Rainey (University of Michigan, Ann Arbor, MI, USA). Cells were cultured in DMEM/F12 with 10% Cosmic Calf serum (HyClone, Logan, UT, USA); detailed methods of cell culture are described in our previous report [59,62]. Ouabain was obtained from Tocris Bioscience (#1076, Ellisville, MO, USA).

4.4. Lentiviral Production and Infection

The lentiviral plasmid pCDH-CMV-MCS-EF1-Puro was purchased from System Bioscience (Palo Alto, CA, USA). The open reading frame of ATP1A1 gene with L104R mutant was obtained from GenScript (Piscataway, NJ, USA) and ligated into the multiple cloning site of the plasmid. Lentivirus production and infection in HAC15 cells were performed as previously reported [40]. The pCDH-CMV-MCS-EF1-Puro plasmid, which does not have any genes in the multiple cloning site, was used as control.

4.5. Transcriptome Analysis

Gene expression analysis was performed using total RNA extracted from adrenal tissues by SurePrint G3 Human Gene Expresson 8 × 60 K v2 (Agilent Technologies Inc,. Santa Clara, CA, USA) as we previously reported [61]. The transcriptome data were analyzed by the R software package (https://www.r-project.org/, accessed on 26 December 2018). Genes expressed in ATP1A1 mutated APA and NFA were subjected to pathway analysis using Gene Set Enrichment Analysis (GSEA; http://software.broadinstitute.org/gsea/index.jsp, accessed on 10 March 2015). Heatmaps using gene expression by microarray analysis were depicted by the Heatmapper (http://www.heatmapper.ca/, accessed on 10 September 2021). RNA sequencing analysis was performed using total RNA extracted from HAC15 cells as previously reported [63].

4.6. Immunohistochemical Analysis

Formalin-fixed paraffin-embedded human adrenal tissues were cut into 4 μm sections, processed, and incubated with mouse monoclonal antibodies against human CYP11B2 and rabbit polyclonal antibody against human NKA (#ab58475, Abcam, Cambridge, UK) as previously described [60,63]. Secondary detections for CYP11B2 was performed using SignalStain® Boost IHC Detection Reagent (#8114, Cell Signaling Technology, Danvers, MA, USA). Ultra View Universal DAB Detection Kit® (#760-500, Ventana Medical System Inc., Oro Valley, AZ, USA) was applied for secondary detection for NKA expression.

4.7. Cell Proliferation Assay

HAC15 cells were seeded on 96 well plates. After the cells reached to a confluency of 40–50%, transduction of ATP1A1 mutation (n = 6) or control (n = 6) vector was performed using the lentiviral systems described above. The effect of ATP1A1 mutant on cell proliferation was evaluated by counting cell number using TC20 Cell Counter (Bio-Rad, Hercules, CA, USA) after indicated time. The amount of DNA for cell number estimation was measured by CyQUANT Direct Cell Proliferation Assay Kit (Invitrogen, Carlsbad, CA, USA), which provided an index of cell proliferation, following manufacturer’s protocol [64]. The fluorescence was detected using Varioskan Flash (Thermo Fisher Scientific, Waltham, MA, USA).

4.8. Cell Cycle Assay

HAC15 cells were seeded on 6-well plates. After transduction of ATP1A1 mutant (n = 3) or control (n = 3), cells were incubated with DMEM-F12 containing 10% cosmic calf serum for 48 h. The cells were treated with 10 μM of cycloheximide for 24 h, because cycloheximide-induced cell cycle arrest in mitotic entry phase. Following the protocol of Cell Cycle Assay Solution Blue (Dojindo Lab., Kumamoto, Japan), the cells (5.0 × 10⁵) were incubated with supplemental solutions. The cells were injected into the flow cytometer instrument (BD FACSAriIIu, BD Biosciences, Franklin Lakes, NJ, USA).

4.9. Metabolite Analysis

After transduction of the ATP1A1 mutant (n = 3) or control (n = 3), HAC15 cells were incubated with DMEM-F12 containing 10% cosmic calf serum on 6-well plates for 24 h. Collected cells were washed with 5% mannitol solution and treated with methanol and internal standard solution (Human Metabolome Technologies Inc., Tsuruoka, Japan). Ultrafiltration was performed with a 5-kDa cutoff filter at 9100× g and 4 °C for 35 m. Metabolites including PRPP were analyzed by capillary electrophoresis time-of-flight mass spectrometry as reported elsewhere [65].

4.10. Intracellular Ca2+ Detection

Fluo4-AM (Invitrogen, Carlsbad, CA, USA) were applied for the measurements of intracellular Ca2+ concentrations as we previously described [59].

4.11. Western Blotting

HAC15 cells were seeded on 12-well plates. After transduction of the ATP1A1 mutant (n = 3) or control (n = 3) vectors and attainment of confluency, the HAC15 cells were incubated with DMEM/F12 containing 0.1% serum for 24 h. Cells were incubated with fresh media including 10% serum with or without 1 nM of ouabain for 5 m. Cell lysis, sodium dodecyl sulfate-polyacrylamide gel electrophoresis, transfer, and blot processing were performed as reported previously [62]. Immunoblotting analyses using phospho-Src Family (Tyr416) (D49G4) Rabbit mAb (#6943, Cell Signaling Technology, Danvers, MA, USA), Src (36D10) Rabbit mAb (#2109, Cell Signaling Technology, Danvers, MA, USA), and GAPDH (14C10) Rabbit mAb (#2118, Cell Signaling Technology, Danvers, MA, USA) were performed. Phopho-Src levels were analyzed as arbitrary units normalized against Src expression.

4.12. Aldosterone Measurement

HAC15 cells were seeded on 24-well plates. After transduction of ATP1A1 mutant (n = 3) or control (n = 3) in HAC15 cells and attainment of confluency, cells were serum deprived in DMEM/F12 containing 0.1% serum for 24 h. Cells were incubated with fresh media with 0.1% serum for another 24 h. Aldosterone levels were measured in cell culture supernatants by an ELISA kit as previously described [66]. Cellular protein levels were measured using a Pierce BCA Protein Assay Kit (Thermo Fisher Scientific, Waltham, MA, USA). The aldosterone levels were normalized based on cellular protein levels. Both aldosterone and cellular protein levels were assayed in triplicate.

4.13. Statistical Analysis

The results are expressed as mean values with SEM of at least three separate experiments. The statistical significance was analyzed by t-test for two groups or by one-way ANOVA followed by Bonferroni comparison for multiple groups. The changes over time between the two groups were tested by two-way ANOVA. Significance level of p < 0.05 was considered statistically significant. Statistical analysis was performed using SPSS for Windows (release 24.0; SPSS, Inc, Chicago, IL, USA).

5. Conclusions

We demonstrated that APAs with ATP1A1 mutations exhibited more abundant NKA expression relative to NFA or APAs with KCNJ5 mutations and that a common ATP1A1 mutation L104R stimulated cell proliferation in HAC15 cells. Our results also suggest that ATP1A1 mutation-mediated adrenal cell proliferation is regulated by cardiotonic steroids inducing cell signal transduction involving the increased phosphorylation of Src. Cardiotonic steroids are a potential risk factor for the progression of a ZG cell that develops an ATP1A1 mutation to an APA and might have pathogenic importance. This study provides a mechanism for APA tumorigenesis and consideration of preventive approaches for ATP1A1-mutated APAs.

Author Contributions

Conceptualization, K.O. and C.E.G.-S.; Methodology, K.K., K.I. and T.K.; Validation, K.O. and T.K.; Data curation, K.K., K.O., K.I. and R.B.; Formal analysis. K.K. and K.O.; Writing—original draft preparation, K.K. and K.O.; Writing—review and editing, C.E.G.-S., E.P.G.-S., G.N., H.O. and M.Y.; Supervision, K.A., N.H. and M.Y.; Visualization, K.K. and K.O.; Funding acquisition, K.K., K.O., C.E.G.-S., K.I. and Y.Y. All authors have read and agreed to the published version of the manuscript.

Funding

This study was financially supported by JSPS KAKENHI Grant Number JP21K16058 (K.K.), JSPS KAKENHI Grant Number JP21K08557 (K.O.), the Mochida Memorial Foundation for Medica and Pharmaceutical Research (K.O.), Takeda Science Foundation (K.O.), JSPS KAKENHI Grant Number JP19K17964 (K.I.), JSPS KAKENHI Grant Number JP19K17972 (Y.Y.), National Heart, Lung and Blood Institute grant R01 HL144847 (C.E.G.-S.), the National Institute of General Medical Sciences under Award Number 1U54GM115428 (C.E.G.-S.), and the Department of Veteran Affairs I01 BX004681 (C.E.G.-S.). The content is solely the responsibility of the authors and does not necessarily represent the official views of the National Institutes of Health.

Institutional Review Board Statement

This study was approved by the research ethics committee of Hiroshima University (Approval number, Hi-1 Hiroshima University), and performed in accordance with the Declaration of Helsinki.

Informed Consent Statement

Written informed consent was obtained from all subjects involved in the study.

Data Availability Statement

The data underlying this article will be shared upon appropriate request to the corresponding author.

Acknowledgments

This work was partly carried out with the kind cooperation of the Analysis Center of Life Science, Hiroshima University, and the Program of the network-type joint Usage/Research Center for Radiation Disaster Medical Science of Hiroshima University, Nagasaki University, and Fukushima Medical University.

Conflicts of Interest

The authors declare no conflict of interest.

References

  1. Funder, J.W.; Carey, R.M.; Fardella, C.; Gomez-Sanchez, C.E.; Mantero, F.; Stowasser, M.; Young, W.F.; Montori, V.M.; Society, E. Case detection, diagnosis, and treatment of patients with primary aldosteronism: An endocrine society clinical practice guideline. J. Clin. Endocrinol. Metab. 2008, 93, 3266–3281. [Google Scholar] [CrossRef] [Green Version]
  2. Reincke, M.; Fischer, E.; Gerum, S.; Merkle, K.; Schulz, S.; Pallauf, A.; Quinkler, M.; Hanslik, G.; Lang, K.; Hahner, S.; et al. Observational study mortality in treated primary aldosteronism: The German Conn’s registry. Hypertension 2012, 60, 618–624. [Google Scholar] [CrossRef] [Green Version]
  3. Savard, S.; Amar, L.; Plouin, P.F.; Steichen, O. Cardiovascular complications associated with primary aldosteronism: A controlled cross-sectional study. Hypertension 2013, 62, 331–336. [Google Scholar] [CrossRef] [Green Version]
  4. Funder, J.W.; Carey, R.M.; Mantero, F.; Murad, M.H.; Reincke, M.; Shibata, H.; Stowasser, M.; Young, W.F., Jr. The Management of Primary Aldosteronism: Case Detection, Diagnosis, and Treatment: An Endocrine Society Clinical Practice Guideline. J. Clin. Endocrinol. Metab. 2016, 101, 1889–1916. [Google Scholar] [CrossRef] [PubMed]
  5. Beuschlein, F.; Boulkroun, S.; Osswald, A.; Wieland, T.; Nielsen, H.N.; Lichtenauer, U.D.; Penton, D.; Schack, V.R.; Amar, L.; Fischer, E.; et al. Somatic mutations in ATP1A1 and ATP2B3 lead to aldosterone-producing adenomas and secondary hypertension. Nat. Genet. 2013, 45, 440–444. [Google Scholar] [CrossRef] [PubMed]
  6. Azizan, E.A.; Poulsen, H.; Tuluc, P.; Zhou, J.; Clausen, M.V.; Lieb, A.; Maniero, C.; Garg, S.; Bochukova, E.G.; Zhao, W.; et al. Somatic mutations in ATP1A1 and CACNA1D underlie a common subtype of adrenal hypertension. Nat. Genet. 2013, 45, 1055–1060. [Google Scholar] [CrossRef]
  7. Scholl, U.I.; Goh, G.; Stölting, G.; de Oliveira, R.C.; Choi, M.; Overton, J.D.; Fonseca, A.L.; Korah, R.; Starker, L.F.; Kunstman, J.W.; et al. Somatic and germline CACNA1D calcium channel mutations in aldosterone-producing adenomas and primary aldosteronism. Nat. Genet. 2013, 45, 1050–1054. [Google Scholar] [CrossRef] [PubMed]
  8. Choi, M.; Scholl, U.I.; Yue, P.; Björklund, P.; Zhao, B.; Nelson-Williams, C.; Ji, W.; Cho, Y.; Patel, A.; Men, C.J.; et al. K+ channel mutations in adrenal aldosterone-producing adenomas and hereditary hypertension. Science 2011, 331, 768–772. [Google Scholar] [CrossRef] [Green Version]
  9. Akerstrom, T.; Maharjan, R.; Sven Willenberg, H.; Cupisti, K.; Ip, J.; Moser, A.; Stalberg, P.; Robinson, B.; Alexander Iwen, K.; Dralle, H.; et al. Activating mutations in CTNNB1 in aldosterone producing adenomas. Sci. Rep. 2016, 6, 19546. [Google Scholar] [CrossRef] [PubMed] [Green Version]
  10. Oki, K.; Gomez-Sanchez, C.E. The landscape of molecular mechanism for aldosterone production in aldosterone-producing adenoma. Endocr. J. 2020, 67, 989–995. [Google Scholar] [CrossRef]
  11. Dutta, R.K.; Arnesen, T.; Heie, A.; Walz, M.; Alesina, P.; Soderkvist, P.; Gimm, O. A somatic mutation in CLCN2 identified in a sporadic aldosterone-producing adenoma. Eur. J. Endocrinol. 2019, 181, K37–K41. [Google Scholar] [CrossRef]
  12. Nanba, K.; Blinder, A.R.; Rege, J.; Hattangady, N.G.; Else, T.; Liu, C.J.; Tomlins, S.A.; Vats, P.; Kumar-Sinha, C.; Giordano, T.J.; et al. Somatic CACNA1H Mutation As a Cause of Aldosterone-Producing Adenoma. Hypertension 2020, 75, 645–649. [Google Scholar] [CrossRef]
  13. Shimada, H.; Yamazaki, Y.; Sugawara, A.; Sasano, H.; Nakamura, Y. Molecular Mechanisms of Functional Adrenocortical Adenoma and Carcinoma: Genetic Characterization and Intracellular Signaling Pathway. Biomedicines 2021, 9, 892. [Google Scholar] [CrossRef]
  14. Gong, S.; Tetti, M.; Reincke, M.; Williams, T.A. Primary Aldosteronism: Metabolic Reprogramming and the Pathogenesis of Aldosterone-Producing Adenomas. Cancers 2021, 13, 3716. [Google Scholar] [CrossRef] [PubMed]
  15. Nishimoto, K.; Nakagawa, K.; Li, D.; Kosaka, T.; Oya, M.; Mikami, S.; Shibata, H.; Itoh, H.; Mitani, F.; Yamazaki, T.; et al. Adrenocortical zonation in humans under normal and pathological conditions. J. Clin. Endocrinol. Metab. 2010, 95, 2296–2305. [Google Scholar] [CrossRef] [PubMed] [Green Version]
  16. Williams, T.A.; Gomez-Sanchez, C.E.; Rainey, W.E.; Giordano, T.J.; Lam, A.K.; Marker, A.; Mete, O.; Yamazaki, Y.; Zerbini, M.C.N.; Beuschlein, F.; et al. International Histopathology Consensus for Unilateral Primary Aldosteronism. J. Clin. Endocrinol. Metab. 2021, 106, 42–54. [Google Scholar] [CrossRef] [PubMed]
  17. Nishimoto, K.; Tomlins, S.A.; Kuick, R.; Cani, A.K.; Giordano, T.J.; Hovelson, D.H.; Liu, C.J.; Sanjanwala, A.R.; Edwards, M.A.; Gomez-Sanchez, C.E.; et al. Aldosterone-stimulating somatic gene mutations are common in normal adrenal glands. Proc. Natl. Acad. Sci. USA 2015, 112, E4591–E4599. [Google Scholar] [CrossRef] [Green Version]
  18. Nishimoto, K.; Koga, M.; Seki, T.; Oki, K.; Gomez-Sanchez, E.P.; Gomez-Sanchez, C.E.; Naruse, M.; Sakaguchi, T.; Morita, S.; Kosaka, T.; et al. Immunohistochemistry o.of aldosterone synthase leads the way to the pathogenesis of primary aldosteronism. Mol. Cell Endocrinol. 2017, 441, 124–133. [Google Scholar] [CrossRef] [Green Version]
  19. Lalli, E.; Barhanin, J.; Zennaro, M.C.; Warth, R. Local Control of Aldosterone Production and Primary Aldosteronism. Trends Endocrinol. Metab. 2016, 27, 123–131. [Google Scholar] [CrossRef]
  20. Seccia, T.M.; Caroccia, B.; Gomez-Sanchez, E.P.; Gomez-Sanchez, C.E.; Rossi, G.P. The Biology of Normal Zona Glomerulosa and Aldosterone-Producing Adenoma: Pathological Implications. Endocr. Rev. 2018, 39, 1029–1056. [Google Scholar] [CrossRef] [Green Version]
  21. Vouillarmet, J.; Fernandes-Rosa, F.; Graeppi-Dulac, J.; Lantelme, P.; Decaussin-Petrucci, M.; Thivolet, C.; Peix, J.L.; Boulkroun, S.; Clauser, E.; Zennaro, M.C. Aldosterone-Producing Adenoma With a Somatic KCNJ5 Mutation Revealing APC-Dependent Familial Adenomatous Polyposis. J. Clin. Endocrinol. Metab. 2016, 101, 3874–3878. [Google Scholar] [CrossRef] [PubMed]
  22. Nanba, K.; Chen, A.X.; Omata, K.; Vinco, M.; Giordano, T.J.; Else, T.; Hammer, G.D.; Tomlins, S.A.; Rainey, W.E. Molecular Heterogeneity in Aldosterone-Producing Adenomas. J. Clin. Endocrinol. Metab. 2016, 101, 999–1007. [Google Scholar] [CrossRef] [PubMed]
  23. Gomez-Sanchez, C.E.; Gomez-Sanchez, E.P. Mutations of the potassium channel KCNJ5 causing aldosterone-producing adenomas: One or two hits? Hypertension 2012, 59, 196–197. [Google Scholar] [CrossRef] [PubMed]
  24. Caplan, M.J.; Anderson, H.C.; Palade, G.E.; Jamieson, J.D. Intracellular sorting and polarized cell surface delivery of (Na+,K+)ATPase, an endogenous component of MDCK cell basolateral plasma membranes. Cell 1986, 46, 623–631. [Google Scholar] [CrossRef]
  25. Bejcek, J.; Spiwok, V.; Kmonickova, E.; Rimpelova, S. Na(+)/K(+)-ATPase Revisited: On Its Mechanism of Action, Role in Cancer, and Activity Modulation. Molecules 2021, 26, 1905. [Google Scholar] [CrossRef]
  26. Williams, T.A.; Monticone, S.; Schack, V.R.; Stindl, J.; Burrello, J.; Buffolo, F.; Annaratone, L.; Castellano, I.; Beuschlein, F.; Reincke, M.; et al. Somatic ATP1A1, ATP2B3, and KCNJ5 Mutations in Aldosterone-Producing Adenomas. Hypertension 2014, 63, 188–195. [Google Scholar] [CrossRef] [Green Version]
  27. Itcho, K.; Oki, K.; Ohno, H.; Yoneda, M. Update on Genetics of Primary Aldosteronism. Biomedicines 2021, 9, 409. [Google Scholar] [CrossRef]
  28. Liang, M.; Tian, J.; Liu, L.; Pierre, S.; Liu, J.; Shapiro, J.; Xie, Z.J. Identification of a pool of non-pumping Na/K-ATPase. J. Biol. Chem. 2007, 282, 10585–10593. [Google Scholar] [CrossRef] [Green Version]
  29. Barwe, S.P.; Anilkumar, G.; Moon, S.Y.; Zheng, Y.; Whitelegge, J.P.; Rajasekaran, S.A.; Rajasekaran, A.K. Novel role for Na,K-ATPase in phosphatidylinositol 3-kinase signaling and suppression of cell motility. Mol. Biol. Cell 2005, 16, 1082–1094. [Google Scholar] [CrossRef]
  30. Yudowski, G.A.; Efendiev, R.; Pedemonte, C.H.; Katz, A.I.; Berggren, P.O.; Bertorello, A.M. Phosphoinositide-3 kinase binds to a proline-rich motif in the Na+, K+-ATPase alpha subunit and regulates its trafficking. Proc. Natl. Acad. Sci. USA 2000, 97, 6556–6561. [Google Scholar] [CrossRef] [Green Version]
  31. Tian, J.; Cai, T.; Yuan, Z.; Wang, H.; Liu, L.; Haas, M.; Maksimova, E.; Huang, X.Y.; Xie, Z.J. Binding of Src to Na+/K+-ATPase forms a functional signaling complex. Mol. Biol. Cell 2006, 17, 317–326. [Google Scholar] [CrossRef] [Green Version]
  32. Yuan, Z.; Cai, T.; Tian, J.; Ivanov, A.V.; Giovannucci, D.R.; Xie, Z. Na/K-ATPase tethers phospholipase C and IP3 receptor into a calcium-regulatory complex. Mol. Biol. Cell 2005, 16, 4034–4045. [Google Scholar] [CrossRef] [Green Version]
  33. Hove-Jensen, B.; Andersen, K.R.; Kilstrup, M.; Martinussen, J.; Switzer, R.L.; Willemoes, M. Phosphoribosyl Diphosphate (PRPP): Biosynthesis, Enzymology, Utilization, and Metabolic Significance. Microbiol. Mol. Biol. Rev. 2017, 81, e00040-16. [Google Scholar] [CrossRef] [PubMed] [Green Version]
  34. Aydemir-Koksoy, A.; Abramowitz, J.; Allen, J.C. Ouabain-induced signaling and vascular smooth muscle cell proliferation. J. Biol. Chem. 2001, 276, 46605–46611. [Google Scholar] [CrossRef] [PubMed] [Green Version]
  35. Monticone, S.; Castellano, I.; Versace, K.; Lucatello, B.; Veglio, F.; Gomez-Sanchez, C.E.; Williams, T.A.; Mulatero, P. Immunohistochemical, genetic and clinical characterization of sporadic aldosterone-producing adenomas. Mol. Cell Endocrinol. 2015, 411, 146–154. [Google Scholar] [CrossRef] [PubMed]
  36. Gomez-Sanchez, C.E.; Gomez-Sanchez, E.P. Immunohistochemistry of the adrenal in primary aldosteronism. Curr. Opin Endocrinol. Diabetes Obes. 2016, 23, 242–248. [Google Scholar] [CrossRef] [Green Version]
  37. Dekkers, T.; ter Meer, M.; Lenders, J.W.; Hermus, A.R.; Schultze Kool, L.; Langenhuijsen, J.F.; Nishimoto, K.; Ogishima, T.; Mukai, K.; Azizan, E.A.; et al. Adrenal nodularity and somatic mutations in primary aldosteronism: One node is the culprit? J. Clin. Endocrinol. Metab. 2014, 99, E1341–E1351. [Google Scholar] [CrossRef] [Green Version]
  38. Omata, K.; Satoh, F.; Morimoto, R.; Ito, S.; Yamazaki, Y.; Nakamura, Y.; Anand, S.K.; Guo, Z.; Stowasser, M.; Sasano, H.; et al. Cellular and Genetic Causes of Idiopathic Hyperaldosteronism. Hypertension 2018, 72, 874–880. [Google Scholar] [CrossRef]
  39. Azizan, E.A.; Lam, B.Y.; Newhouse, S.J.; Zhou, J.; Kuc, R.E.; Clarke, J.; Happerfield, L.; Marker, A.; Hoffman, G.J.; Brown, M.J. Microarray, qPCR, and KCNJ5 sequencing of aldosterone-producing adenomas reveal differences in genotype and phenotype between zona glomerulosa- and zona fasciculata-like tumors. J. Clin. Endocrinol. Metab. 2012, 97, E819–E829. [Google Scholar] [CrossRef] [Green Version]
  40. Oki, K.; Plonczynski, M.W.; Luis Lam, M.; Gomez-Sanchez, E.P.; Gomez-Sanchez, C.E. Potassium channel mutant KCNJ5 T158A expression in HAC-15 cells increases aldosterone synthesis. Endocrinology 2012, 153, 1774–1782. [Google Scholar] [CrossRef]
  41. Sanchez, G.; Nguyen, A.N.; Timmerberg, B.; Tash, J.S.; Blanco, G. The Na,K-ATPase alpha4 isoform from humans has distinct enzymatic properties and is important for sperm motility. Mol. Hum. Reprod. 2006, 12, 565–576. [Google Scholar] [CrossRef]
  42. Hammann, J.; Bassetti, D.; White, R.; Luhmann, H.J.; Kirischuk, S. alpha2 isoform of Na(+),K(+)-ATPase via Na(+),Ca(2+) exchanger modulates myelin basic protein synthesis in oligodendrocyte lineage cells in vitro. Cell Calcium 2018, 73, 1–10. [Google Scholar] [CrossRef]
  43. Pezzani, R.; Rubin, B.; Redaelli, M.; Radu, C.; Barollo, S.; Cicala, M.V.; Salvà, M.; Mian, C.; Mucignat-Caretta, C.; Simioni, P.; et al. The antiproliferative effects of ouabain and everolimus on adrenocortical tumor cells. Endocr. J. 2014, 61, 41–53. [Google Scholar] [CrossRef] [Green Version]
  44. Lucas, T.F.; Amaral, L.S.; Porto, C.S.; Quintas, L.E. Na+/K+-ATPase α1 isoform mediates ouabain-induced expression of cyclin D1 and proliferation of rat sertoli cells. Reproduction 2012, 144, 737–745. [Google Scholar] [CrossRef] [Green Version]
  45. Tverskoi, A.M.; Sidorenko, S.V.; Klimanova, E.A.; Akimova, O.A.; Smolyaninova, L.V.; Lopina, O.D.; Orlov, S.N. Effects of Ouabain on Proliferation of Human Endothelial Cells Correlate with Na+,K+-ATPase Activity and Intracellular Ratio of Na+ and K. Biochemistry 2016, 81, 876–883. [Google Scholar] [CrossRef]
  46. Ren, Y.P.; Zhang, M.J.; Zhang, T.; Huang, R.W. Dual effects of ouabain on the regulation of proliferation and apoptosis in human umbilical vein endothelial cells: Involvement of Na(+)-K(+)-ATPase alpha-subunits and NF-kappaB. Int. J. Clin. Exp. Med. 2014, 7, 1214–1222. [Google Scholar]
  47. Botelho, A.F.M.; Pierezan, F.; Soto-Blanco, B.; Melo, M.M. A review of cardiac glycosides: Structure, toxicokinetics, clinical signs, diagnosis and antineoplastic potential. Toxicon 2019, 158, 63–68. [Google Scholar] [CrossRef] [PubMed]
  48. Gruber, K.A.; Whitaker, J.M.; Buckalew, V.M., Jr. Endogenous digitalis-like substance in plasma of volume-expanded dogs. Nature 1980, 287, 743–745. [Google Scholar] [CrossRef] [PubMed]
  49. Khalaf, F.K.; Dube, P.; Mohamed, A.; Tian, J.; Malhotra, D.; Haller, S.T.; Kennedy, D.J. Cardiotonic Steroids and the Sodium Trade Balance: New Insights into Trade-Off Mechanisms Mediated by the Na(+)/K(+)-ATPase. Int. J. Mol. Sci. 2018, 19, 2576. [Google Scholar] [CrossRef] [PubMed] [Green Version]
  50. Baecher, S.; Kroiss, M.; Fassnacht, M.; Vogeser, M. No endogenous ouabain is detectable in human plasma by ultra-sensitive UPLC-MS/MS. Clin. Chim Acta 2014, 431, 87–92. [Google Scholar] [CrossRef]
  51. Lewis, L.K.; Yandle, T.G.; Hilton, P.J.; Jensen, B.P.; Begg, E.J.; Nicholls, M.G. Endogenous ouabain is not ouabain. Hypertension 2014, 64, 680–683. [Google Scholar] [CrossRef] [Green Version]
  52. Manunta, P.; Rogowski, A.C.; Hamilton, B.P.; Hamlyn, J.M. Ouabain-induced hypertension in the rat: Relationships among plasma and tissue ouabain and blood pressure. J. Hypertens 1994, 12, 549–560. [Google Scholar] [CrossRef]
  53. Neri, G.; De Toni, R.; Tortorella, C.; Rebuffat, P.; Bova, S.; Cargnelli, G.; Petrelli, L.; Spinazzi, R.; Nussdorfer, G.G. Ouabain chronic infusion enhances the growth and steroidogenic capacity of rat adrenal zona glomerulosa: The possible involvement of the endothelin system. Int. J. Mol. Med. 2006, 18, 315–319. [Google Scholar] [PubMed] [Green Version]
  54. Nanba, K.; Vaidya, A.; Williams, G.H.; Zheng, I.; Else, T.; Rainey, W.E. Age-Related Autonomous Aldosteronism. Circulation 2017, 136, 347–355. [Google Scholar] [CrossRef] [PubMed]
  55. Zwermann, O.; Suttmann, Y.; Bidlingmaier, M.; Beuschlein, F.; Reincke, M. Screening for membrane hormone receptor expression in primary aldosteronism. Eur. J. Endocrinol. 2009, 160, 443–451. [Google Scholar] [CrossRef] [Green Version]
  56. Itcho, K.; Oki, K.; Kobuke, K.; Yoshii, Y.; Ohno, H.; Yoneda, M.; Hattori, N. Aberrant G protein-receptor expression is associated with DNA methylation in aldosterone-producing adenoma. Mol. Cell Endocrinol. 2018, 461, 100–104. [Google Scholar] [CrossRef] [PubMed] [Green Version]
  57. Stindl, J.; Tauber, P.; Sterner, C.; Tegtmeier, I.; Warth, R.; Bandulik, S. Pathogenesis of Adrenal Aldosterone-Producing Adenomas Carrying Mutations of the Na(+)/K(+)-ATPase. Endocrinology 2015, 156, 4582–4591. [Google Scholar] [CrossRef]
  58. Jung, Y.S.; Jun, S.; Kim, M.J.; Lee, S.H.; Suh, H.N.; Lien, E.M.; Jung, H.Y.; Lee, S.; Zhang, J.; Yang, J.I.; et al. TMEM9 promotes intestinal tumorigenesis through vacuolar-ATPase-activated Wnt/beta-catenin signalling. Nat. Cell Biol. 2018, 20, 1421–1433. [Google Scholar] [CrossRef]
  59. Kobuke, K.; Oki, K.; Gomez-Sanchez, C.E.; Gomez-Sanchez, E.P.; Ohno, H.; Itcho, K.; Yoshii, Y.; Yoneda, M.; Hattori, N. Calneuron 1 Increased Ca(2+) in the Endoplasmic Reticulum and Aldosterone Production in Aldosterone-Producing Adenoma. Hypertension 2018, 71, 125–133. [Google Scholar] [CrossRef]
  60. Gomez-Sanchez, C.E.; Qi, X.; Velarde-Miranda, C.; Plonczynski, M.W.; Parker, C.R.; Rainey, W.; Satoh, F.; Maekawa, T.; Nakamura, Y.; Sasano, H.; et al. Development of monoclonal antibodies against human CYP11B1 and CYP11B2. Mol. Cell Endocrinol. 2014, 383, 111–117. [Google Scholar] [CrossRef] [Green Version]
  61. Kishimoto, R.; Oki, K.; Yoneda, M.; Gomez-Sanchez, C.E.; Ohno, H.; Kobuke, K.; Itcho, K.; Kohno, N. Gonadotropin-Releasing Hormone Stimulate Aldosterone Production in a Subset of Aldosterone-Producing Adenoma. Medicine 2016, 95, e3659. [Google Scholar] [CrossRef] [PubMed]
  62. Itcho, K.; Oki, K.; Kobuke, K.; Ohno, H.; Yoneda, M.; Hattori, N. Angiotensin 1-7 suppresses angiotensin II mediated aldosterone production via JAK/STAT signaling inhibition. J. Steroid. Biochem. Mol. Biol. 2019, 185, 137–141. [Google Scholar] [CrossRef] [PubMed]
  63. Itcho, K.; Oki, K.; Gomez-Sanchez, C.E.; Gomez-Sanchez, E.P.; Ohno, H.; Kobuke, K.; Nagano, G.; Yoshii, Y.; Baba, R.; Hattori, N.; et al. Endoplasmic Reticulum Chaperone Calmegin Is Upregulated in Aldosterone-Producing Adenoma and Associates With Aldosterone Production. Hypertension 2020, 75, 492–499. [Google Scholar] [CrossRef]
  64. Hasan, A.; Pokeza, N.; Shaw, L.; Lee, H.S.; Lazzaro, D.; Chintala, H.; Rosenbaum, D.; Grant, M.B.; Chaqour, B. The matricellular protein cysteine-rich protein 61 (CCN1/Cyr61) enhances physiological adaptation of retinal vessels and reduces pathological neovascularization associated with ischemic retinopathy. J. Biol. Chem. 2011, 286, 9542–9554. [Google Scholar] [CrossRef] [PubMed] [Green Version]
  65. Sugimoto, M.; Wong, D.T.; Hirayama, A.; Soga, T.; Tomita, M. Capillary electrophoresis mass spectrometry-based saliva metabolomics identified oral, breast and pancreatic cancer-specific profiles. Metabolomics 2010, 6, 78–95. [Google Scholar] [CrossRef] [PubMed] [Green Version]
  66. Oki, K.; Plonczynski, M.W.; Lam, M.L.; Gomez-Sanchez, E.P.; Gomez-Sanchez, C.E. The potassium channel, Kir3.4 participates in angiotensin II-stimulated aldosterone production by a human adrenocortical cell line. Endocrinology 2012, 153, 4328–4335. [Google Scholar] [CrossRef] [PubMed]
Figure 1. Heat map of concerns genes in five aldosterone–producing adenomas (APA) with an ATP1A1 mutation and five non–functioning adrenocortical adenomas (NFA). (a) Heat map of steroidogenic enzymes genes. (b) Heat map of genes related to P type ATPase function.
Ijms 22 10981 g001
Figure 2. Immunohistochemical detection of sodium/potassium-transporting ATPase (NKA) in aldosterone-producing adenomas (APA) with an ATP1A1 or KCNJ5 mutation and a non-functioning adrenocortical adenoma (NFA). Black and white scale bars indicate 1 mm and 100 μm, respectively.
Ijms 22 10981 g002
Figure 3. Effect of ATP1A1 L104R mutation on aldosterone production and genes related with Na/K-ATPase (NKA) in HAC15 cells. (a,b) After transduction of ATP1A1 mutant (n = 3) or control (n = 3) in HAC15 cells and attainment of confluency on 24-well plates, cells were serum deprived in DMEM/F12 containing 0.1% serum for 24 h. Cells were incubated with fresh media with 0.1% serum for 24 h. Aldosterone levels of the supernatant and CYP11B2 expression in the cells were measured. *, p < 0.05 vs. control cells. (c–e) After transduction of ATP1A1 mutation (n = 3) or control (n = 3) and incubation with DMEM-F12 containing 0.1% cosmic calf serum on 24-well plates for 24 h. Total RNA was extracted, and RNA sequencing analysis was performed. mRNA levels of steroidogenic enzymes were determined as relative expression of each control. Total ATP1A1, ATP1A1 mutation, and ATP1A1 wild type expression levels were determined as relative expression of total ATP1A1 in control cells. *, p < 0.05 vs. total ATP1A1 expression of control cells. Gene expression levels of NAK subfamily were also measured by RNA sequencing analysis. *, p < 0.05 vs. each control cells.
Ijms 22 10981 g003
Figure 4. Effect of ATP1A1 L104R mutation on cell proliferation in HAC15 cells. (a,b) HAC15 cells with 40–50% confluency on 96-well plates were transduced with a lentivirus ATP1A1 mutant (n = 6) or control (n = 6) vectors. The cells were cultured in DMEM/F12 containing 10% serum. The effects of the ATP1A1 mutant on cell proliferation and DNA amounts were evaluated by counting cell number using TC20 Cell Counter at the indicated times and CyQUANT Direct Cell Proliferation Assay Kit, respectively. *, p < 0.05 vs. each type of control cells. (c) After transduction of ATP1A1 mutant (n = 3) or control (n = 3) in HAC15 cells and attainment of confluency. Cells were incubated in DMEM/F12 containing 10% serum on 6-well plates for 24 h, and Phosphoribosyl Diphosphate (PRPP) levels in cells were measured by capillary electrophoresis time-of-flight mass spectrometry. (d,e) After transduction of ATP1A1 mutant (n = 3) or control (n = 3) in HAC15 cells and attainment of confluency. Incubation with DMEM-F12 containing 10% cosmic calf serum on 6-well plates for 48 h, cells were treated with 10 μM of cycloheximide for 24 h. The cells with supplemental solutions of Cell Cycle Assay Solution Blue were injected into the flow cytometer instrument, and the cells of G0/G1, S, or G2/M phase were shown in the figure with red, green, or blue, respectively. The number of cells of S phase were compared. *, p < 0.05 vs. control cells. (fh) After transduction of ATP1A1 mutant (n = 3) or control (n = 3) and incubation with DMEM-F12 containing 10% cosmic calf serum on 6-well plates for 72 h, cells were harvested. Following Promokine Apoptotic/Necrotic Cells Detection kit (PromoCell, Heidelberg, Germany), the cells (2.5 × 10⁵) were incubated with Annexixn and Ethidium Homodimer for 15 m. The samples containing cells were injected into the flow cytometer instrument (BD FACSAriaIIu, BD Biosciences, Franklin Lakes, NJ, USA). The results of control and ATP1A1 mutation are depicted in A and B, respectively. The cells in red and blue squares were defined as apoptotic and necrotic, respectively. The apoptotic and necrotic cell number per total cell number were compared between control and ATP1A1 mutation cells. (i) After transduction of ATP1A1 mutant (n = 4) or control (n = 4) vectors in HAC15 cells and incubation with DMEM/F12 containing 0.1% serum for 24 h, cells were incubated with fresh media with or without 10% serum with 3 μM of Fluo4-AM on 96-well plates for 10 m. *, p < 0.05 vs. control cells with 0.1% serum. **, p < 0.05 vs. other three type of cells.
Ijms 22 10981 g004
Figure 5. Ouabain enhanced cell proliferation of HAC15 cells with the ATP1A1 L104R mutant, but did not increase aldosterone production. (a) After transduction of the ATP1A1 mutant (n = 6) or control (n = 6) vectors in HAC15 cells and incubation with or without ouabain at the indicated concentration on 96-well plates for 3 days, the amount of DNA was measured by CyQUANT Direct Cell Proliferation Assay Kit. *, p < 0.05 vs. each type of control cells. (b) After transduction of ATP1A1 mutant (n = 3) or control (n = 3) vectors in HAC15 cells and incubation with or without ouabain at the indicated concentration for 3 days, cells were serum deprived in DMEM/F12 containing 0.1% serum on 24-well plates for 24 h. Cells were incubated with fresh media with 0.1% serum for 24 h, and then aldosterone levels of the supernatant were measured. Aldosterone levels were normalized based on cellular protein levels. *, p < 0.05 vs. each control cells. (c) After transduction of ATP1A1 mutation (n = 6) or control (n = 6) and incubation with or without ouabain at indicated concentration on 96-well plates for 3 days, the amounts of DNA were measured by CyQUANT Direct Cell Proliferation Assay Kit. *, p < 0.05 vs. each control cells. (d,e) After transduction of ATP1A1 mutant (n = 3) or control (n = 3) vectors in HAC15 cells and incubation with DMEM/F12 containing 0.1% serum on 12-well plates for 24 h, cells were incubated with fresh media including 10% serum with or without 1 nM of ouabain for 5 m. *, p < 0.05 vs. control cells without ouabain. **, p < 0.05 vs. the other three type of cells.
Ijms 22 10981 g005
Figure 6. Hypothetical mechanism by which ATP1A1 mutations promote tumor progression. Sodium/potassium-transporting ATPase (NKA) are more highly expressed in aldosterone-producing adenomas (APA) with an ATP1A1 mutant to compensate for the loss of NKA pump function. This, subsequently, results in enhanced cell signaling function, including that of cell proliferation and intracellular Ca2+ concentration, upon stimulation of NKA with very low levels of a cardiotonic steroid.
Ijms 22 10981 g006
Table 1. Pathway analysis using Gene Set Enrichment Analysis (GSEA) of genes expressed in five aldosterone-producing adenomas (APA) with an ATP1A1 mutation and five non-functioning adrenocortical adenomas (NFA).
RankingPathway Increased in APA with ATP1A1 Mutation
1Cancer Head and Neck vs. Cervical Down
2Ion Transport by P Type ATPase
3Proximal Tubule Bicarbonate Reclamation
4Kidney
5LG1 Targets Up
The transcriptome data from microarray analysis were analyzed by the R software package. The pathways highly expressed in ATP1A1 mutated APA in contrast to NFA were detected.
Table 2. The difference of genes related with P type ATPase between aldosterone-producing adenoma (APA) with ATP1A1 mutation and nonfunctioning adrenocortical adenoma (NFA).
Gene SymbolFold Increase (vs. NFA)p Value
ATP2A35.12 0.036
ATP9A4.34 0.004
ATP2B33.84 0.040
ATP2B23.71 0.049
ATP4A3.43 0.059
ATP1B23.17 0.001
ATP1A22.90 n.s
ATP8A22.82 0.012
ATP1A42.13 0.001
ATP1B12.01 0.001
ATP1A11.86 n.s
ATP1B31.67 n.s
ATP2A11.43 n.s
ATP2C21.35 n.s
ATP7B1.33 n.s
FXYD21.32 n.s
ATP9B1.24 n.s
ATP10D1.22 n.s
ATP10A1.10 n.s
ATP4B1.10 n.s
ATP1A31.10 n.s
ATP10B1.05 n.s
ATP8A11.03 n.s
ATP7A0.98 n.s
ATP8B30.93 n.s
ATP11B0.90 n.s
ATP11C0.90 n.s
ATP12A0.87 n.s
ATP8B10.87 n.s
ATP2A20.79 n.s
ATP11A0.79 n.s
ATP2C10.75 n.s
ATP8B40.41 n.s
The statistical significance was analyzed by t-test.
Publisher’s Note: MDPI stays neutral with regard to jurisdictional claims in published maps and institutional affiliations.

